M.Sc. in Meteorology UCD Physical Meteorology Prof Peter Lynch Mathematical Computation Laboratory Mathematical Physics Department University College Dublin Belfield. First Semester, 2004–2005.
Transcript
M.Sc. in Meteorology UCD
Physical MeteorologyProf Peter Lynch
Mathematical Computation LaboratoryMathematical Physics Department
University College DublinBelfield.
First Semester, 2004–2005.
Text for the CourseThe lectures will be based closely on the text
Atmospheric Science: An Introductory Surveyby
John M. Wallace and Peter V. Hobbs
published by Academic Press (1977).
A second edition of this text is expected to bepublished next year.
2
Introduction and OverviewAtmospheric science is concerned with the structure andevolution of the atmospheres of the earth and planets, andwith the wide range of phenomena that occur within them.
3
Introduction and OverviewAtmospheric science is concerned with the structure andevolution of the atmospheres of the earth and planets, andwith the wide range of phenomena that occur within them.
Since it is concerned primarily with the Earth’s atmosphere,atmospheric science can be regarded as one of the earthsciences or geosciences. These include
• Meteorology
• Oceanography
• Hydrology
• Geology
• Seismology
• Volcanology
• Geodesy
3
For most purposes, we may regard meteorology andatmospheric science as synonymous.
4
For most purposes, we may regard meteorology andatmospheric science as synonymous.
The development of atmospheric sciences has, in recenttimes, been driven strongly by the need for more accurateweather forecasts and by concerns about climate change.
4
For most purposes, we may regard meteorology andatmospheric science as synonymous.
The development of atmospheric sciences has, in recenttimes, been driven strongly by the need for more accurateweather forecasts and by concerns about climate change.
During the past century, weather forecasting has evolvedfrom an art that relied solely on experience and intuition,into a science that relies on numerical models based on theconservation of mass, momentum and energy.
The increasing sophistication of the computer models of theatmosphere has led to dramatic improvements in forecastskill, as shown in the figure which follows.
4
Forecast Skill. Prediction of 500mb heights.5
The Global Observing System
What began in the late 19th century as an assemblage ofregional collection centers for real time (synoptic) teletypetransmissions of observations of surface weather variableshas evolved into an observing system in which satellite andin situ measurements of many surface and upper air vari-ables are merged in a consistent way to produce optimalestimates of their respective three-dimensional fields overthe entire globe.
6
7
The Global Telecomms. SystemThis global, real time atmospheric dataset is the envy ofoceanographers, and other geoscientists: it represesents bothan extraordinary technological achievement, and an extraor-dinary exemplar of the benefits that can derive from inter-national cooperation.
8
The Global Telecomms. SystemThis global, real time atmospheric dataset is the envy ofoceanographers, and other geoscientists: it represesents bothan extraordinary technological achievement, and an extraor-dinary exemplar of the benefits that can derive from inter-national cooperation.
Today’s global weather observing system is a vital compo-nent of a broader earth observing system, which supports awide variety of scientific endeavors including climate moni-toring and studies of ecosystems on a global scale.
8
The GTS (Global Telecommunications System)9
Atmospheric ChemistryAn increasingly important area of atmospheric science isatmospheric chemistry. Urban air quality has long been aconcern. During the 1970’s when it was discovered thatforests and organisms living in lakes over parts of north-ern Europe were being killed by acid rain caused by sulfurdioxide emissions from coal-fired electric power plants hun-dreds of kilometers upwind. The sources of the acidity weregaseous oxides of sulfur and nitrogen (SO2, NO, NO2, andN2O5) that dissolve in microscopic cloud droplets which mayreach the ground as raindrops.
10
Atmospheric ChemistryAn increasingly important area of atmospheric science isatmospheric chemistry. Urban air quality has long been aconcern. During the 1970’s when it was discovered thatforests and organisms living in lakes over parts of north-ern Europe were being killed by acid rain caused by sulfurdioxide emissions from coal-fired electric power plants hun-dreds of kilometers upwind. The sources of the acidity weregaseous oxides of sulfur and nitrogen (SO2, NO, NO2, andN2O5) that dissolve in microscopic cloud droplets which mayreach the ground as raindrops.
A major discovery of the 1980’s was the Antarctic ozonehole, the temporary disappearance of much of the strato-spheric ozone layer over the southern polar cap each spring.The ozone destruction was shown to be caused by the break-down of chloroflurocarbons (CFC’s).
10
The Antarctic ozone hole dueto the build-up of CFC’s.Vertically integrated ozoneover high latitudes of thesouthern hemisphere inSeptember and October,2000. Cool colors representlow values of total ozone.
11
Greenhouse WarmingThe issues surrounding the buildup of atmospheric carbondioxide and other relatively inert trace gases produced byburning of fossil fuels represent a major challenge for mankind.
The following figure shows the upward trend in atmosphericCO2 concentrations (in ppmv) at Mauna Loa (black) andSouth Pole (blue) due to the burning of fossil fuels.
12
CO2 variation in Hawaii and Antarctic.13
At one time climatic change was viewed by most atmo-spheric scientists as occurring on such long time scales that,for most purposes, today’s climate could be described interms of a fixed set of statistics, such as January climato-logical mean (or “normal”) temperature.
In effect, climatology and climate change were consideredto be separate subfields.
14
At one time climatic change was viewed by most atmo-spheric scientists as occurring on such long time scales that,for most purposes, today’s climate could be described interms of a fixed set of statistics, such as January climato-logical mean (or “normal”) temperature.
In effect, climatology and climate change were consideredto be separate subfields.
The older view was that, on the scale of a human lifetime,the climate could be regarded as static. More recent re-search and indeed general experience has brought us to therealization that this view is not reliable.
14
Here are some of the the factors that have contributed tothe emergence of a more holistic, dynamic view of climate:
15
Here are some of the the factors that have contributed tothe emergence of a more holistic, dynamic view of climate:
• Documentation of year-to-year climate variations over largeareas of the globe that occur in association with El Nino;
15
Here are some of the the factors that have contributed tothe emergence of a more holistic, dynamic view of climate:
• Documentation of year-to-year climate variations over largeareas of the globe that occur in association with El Nino;
• Proxy evidence, based on a variety of sources (ocean sed-iment cores and ice cores, in particular), indicating thatlarge, spatially coherent climatic changes have occurredon time scales of a century or even less;
• The rise of the global-mean surface air temperature dur-ing the 20th century, and projections of a larger rise dur-ing the 21st century, due to human activities.
Climate dynamics is inherently multi-disciplinary: the at-mosphere must be treated as a component of the Earthsystem.
The term Earth System Science has been gaining popularityduring the last few years.
15
Some Terms of ReferenceAtmospheric phenomena are represented in terms of a spher-ical coordinate system, rotating with the earth, as illus-trated in the figure which follows.
16
Some Terms of ReferenceAtmospheric phenomena are represented in terms of a spher-ical coordinate system, rotating with the earth, as illus-trated in the figure which follows.
The coordinates are latitude φ, longitude λ and height abovesea-level, z. The angles are often replaced by the distances
dx ≡ r cos φ dλ
dy ≡ r dφ
where x and y are distance east of the Greenwich meridianalong a latitude circle, and distance north of the equator,and r is the distance from the center of the earth.
Note the (obvious) relationship between r and z
r = z + a
where a is the radius of the Earth.
16
[Figure to follow: Draw on board.]
Spherical coordinate system used in atmospheric science
17
At the earth’s surface a degree of latitude is equivalent to adistance of 111km.
1◦(latitude) ≈ 111km
18
At the earth’s surface a degree of latitude is equivalent to adistance of 111km.
1◦(latitude) ≈ 111km
About 99% of the mass of the atmosphere is concentratedwithin the lowest 30km, a layer with a thickness less than0.5% of the radius of the earth. Thus, r may (where notdifferentiated) be replaced by a, the mean radius of theearth (6.37× 10⁶ m), with only a minor error.
Note that the Earth’s radius is given by
a =2× 10⁷
π≈ 6, 366metres
Indeed, this follows from the (original) definition of a metre.
The thin atmopshere approximation (r ≈ a) is importantas it allows us to make simplifications to the equations ofmotion.
Satellite images of the atmosphere, as viewed edge on em-phasize how thin the atmosphere really is.
18
The limb of the earth, as viewed from space in visible satellite imagery.19
The three velocity components are defined as
u ≡ dx
dt= a cos φ
dλ
dt(the zonal velocity component)
v ≡ dy
dt= a
dλ
dt(the meridional velocity component)
w ≡ dr
dt=
dz
dt(the vertical velocity component)
20
The three velocity components are defined as
u ≡ dx
dt= a cos φ
dλ
dt(the zonal velocity component)
v ≡ dy
dt= a
dλ
dt(the meridional velocity component)
w ≡ dr
dt=
dz
dt(the vertical velocity component)
Note that we have replaced r by a in the expressions for uand v but, of course, we cannot ignore the variation of r inthe vertical derivative.This is typical: when we make approximations we have toproceed with caution.
20
The three velocity components are defined as
u ≡ dx
dt= a cos φ
dλ
dt(the zonal velocity component)
v ≡ dy
dt= a
dλ
dt(the meridional velocity component)
w ≡ dr
dt=
dz
dt(the vertical velocity component)
Note that we have replaced r by a in the expressions for uand v but, of course, we cannot ignore the variation of r inthe vertical derivative.This is typical: when we make approximations we have toproceed with caution.Festina lente.
20
Some Meteorological Jargon
21
Some Meteorological Jargon• Zonal Wind
21
Some Meteorological Jargon• Zonal Wind
• Zonal Average
21
Some Meteorological Jargon• Zonal Wind
• Zonal Average
• Meridional Wind; Meridional Average
21
Some Meteorological Jargon• Zonal Wind
• Zonal Average
• Meridional Wind; Meridional Average
• Meridional Cross-section
21
Some Meteorological Jargon• Zonal Wind
• Zonal Average
• Meridional Wind; Meridional Average
• Meridional Cross-section
• Westerly wind: u > 0
21
Some Meteorological Jargon• Zonal Wind
• Zonal Average
• Meridional Wind; Meridional Average
• Meridional Cross-section
• Westerly wind: u > 0
• Southerly Wind: v > 0
21
Some Meteorological Jargon• Zonal Wind
• Zonal Average
• Meridional Wind; Meridional Average
• Meridional Cross-section
• Westerly wind: u > 0
• Southerly Wind: v > 0
• Easterlies, Northerlies
21
Some Meteorological Jargon• Zonal Wind
• Zonal Average
• Meridional Wind; Meridional Average
• Meridional Cross-section
• Westerly wind: u > 0
• Southerly Wind: v > 0
• Easterlies, Northerlies
• ‘Wind’ = Horizontal Wind
21
Some Meteorological Jargon• Zonal Wind
• Zonal Average
• Meridional Wind; Meridional Average
• Meridional Cross-section
• Westerly wind: u > 0
• Southerly Wind: v > 0
• Easterlies, Northerlies
• ‘Wind’ = Horizontal Wind
Note that terms such as ‘westerly’ are frequently misusedby those who should know better. For example, an airlinepilot may say: “We are taking off in a westerly direction”.S/he should say “in a westward direction”.
21
Some UnitsThe SI unit for velocity is metres per second (ms−1).
22
Some UnitsThe SI unit for velocity is metres per second (ms−1).
A meter per second is equivalent to 1.95 knots.(1 knot is 1 nautical mile per hour). So, roughly,
5ms−1 ≈ 10 knots
22
Some UnitsThe SI unit for velocity is metres per second (ms−1).
A meter per second is equivalent to 1.95 knots.(1 knot is 1 nautical mile per hour). So, roughly,
5ms−1 ≈ 10 knots
A nautical mile is defined as a distance of one minute oflatitude. Thus, there are sixty nautical miles in one degreeof latitude:
1◦(latitude) = 60n.m. ≈ 111km
For vertical velocities, a rough rule of thumb is
1 cms−1 ∼ 1kmday−1
22
Time DerivativesTotal time derivatives d/dt refer to the rate of change follow-ing an air parcel as it moves along through the atmosphere,while the local derivative ∂/∂t refers to the rate of changeat a point fixed relative to the earth’s surface.
23
Time DerivativesTotal time derivatives d/dt refer to the rate of change follow-ing an air parcel as it moves along through the atmosphere,while the local derivative ∂/∂t refers to the rate of changeat a point fixed relative to the earth’s surface.
The two derivatives are related by the chain rule
d
dt=
∂
∂t+
dx
dt
∂
∂x+
dy
dt
∂
∂y+
dz
dt
∂
∂z
=∂
∂t+ u
∂
∂x+ v
∂
∂y+ w
∂
∂z
We re-write this as
∂
∂t=
d
dt+
{−u
∂
∂x− v
∂
∂y− w
∂
∂z
}The terms in the braces are called the advection.
23
At a fixed point in space the Eulerian and Lagrangian ratesof change differ by virtue of the advection of air from up-stream, which carries with it higher or lower values of thevariable in question.This is easily understood if we consider, for example, airblowing from a warm region to a cold one. The advectionof the warm air brings about a rise in temperature.
24
At a fixed point in space the Eulerian and Lagrangian ratesof change differ by virtue of the advection of air from up-stream, which carries with it higher or lower values of thevariable in question.This is easily understood if we consider, for example, airblowing from a warm region to a cold one. The advectionof the warm air brings about a rise in temperature.
Advection is a dominant process in synoptic meteorology
For the special case of a hypothetical conservative tracer,the Lagrangian rate of change is identically equal to zero,and the Eulerian rate of change is determined entirely bythe advection.Many pollutants can be treated, at least on short timescales, as passive tracers, so their dynamics are governedby advection.
24
Pressure UnitsThe fundamental thermodynamic variables are pressure, den-sity and temperature, denoted by the symbols p, ρ and T .
The SI units of pressure are Newtons per square metre orPascals (or kgm−1s−2).
25
Pressure UnitsThe fundamental thermodynamic variables are pressure, den-sity and temperature, denoted by the symbols p, ρ and T .
The SI units of pressure are Newtons per square metre orPascals (or kgm−1s−2).
Prior to the adoption of SI units, atmospheric pressure wasexpressed in millibars (mb), where 1bar= 106 dynes cm−2.
In the interests of retaining the numerical values of pressurethat atmospheric scientists and the public have become ac-customed to, atmospheric pressure is usually expressed inunits of hundreds of Pascals (hectopascals or hPa). Thus,for example,
1013.25mb ≡ 1013.25hPa
25
Pressure UnitsThe fundamental thermodynamic variables are pressure, den-sity and temperature, denoted by the symbols p, ρ and T .
The SI units of pressure are Newtons per square metre orPascals (or kgm−1s−2).
Prior to the adoption of SI units, atmospheric pressure wasexpressed in millibars (mb), where 1bar= 106 dynes cm−2.
In the interests of retaining the numerical values of pressurethat atmospheric scientists and the public have become ac-customed to, atmospheric pressure is usually expressed inunits of hundreds of Pascals (hectopascals or hPa). Thus,for example,
1013.25mb ≡ 1013.25hPa[Millibar
Mansion
]=⇒
[Hectopascal
House
]25
Other Thermodynamic VariablesDensity is expressed in units of kilograms per cubic metre(kgm−3).
26
Other Thermodynamic VariablesDensity is expressed in units of kilograms per cubic metre(kgm−3).
Temperature is in units of degrees Celsius (◦C) for generalpurposes, and in degrees Kelvin (K) for scientific work.
26
Other Thermodynamic VariablesDensity is expressed in units of kilograms per cubic metre(kgm−3).
Temperature is in units of degrees Celsius (◦C) for generalpurposes, and in degrees Kelvin (K) for scientific work.
In the United States (perhaps Canada too?) the Fahrenheitscale is still used. We have a very crude approximation:
To get Fahrenheit from Celsius, double and add thirty.
Energy is expressed in units of joules (J = kgm2s−2).
26
Predictability and ChaosAtmospheric motions are inherently unpredictable as an ini-tial value problem beyond a few weeks, when the uncertain-ties in the forecasts, no matter how small they might be inthe initial conditions, become as large as the variations thatthe models are designed to predict.
27
Predictability and ChaosAtmospheric motions are inherently unpredictable as an ini-tial value problem beyond a few weeks, when the uncertain-ties in the forecasts, no matter how small they might be inthe initial conditions, become as large as the variations thatthe models are designed to predict.
This sensitivity to initial conditions is a characteristic ofchaotic nonlinear systems. In fact, it was the growth oferrors in an idealized weather forecast model and the longterm behavior of extended forecasts carried out with thatsame model that provided one of the most lucid early demon-strations of the type of behavior signified by the term chaos.
27
Weather and ClimateAtmospheric phenomena with time scales shorter than afew weeks, which corresponds to the theoretical limit ofthe range of deterministic weather forecasting, are usuallyregarded as weather, and phenomena on longer time scalesas relating to climate.
28
Weather and ClimateAtmospheric phenomena with time scales shorter than afew weeks, which corresponds to the theoretical limit ofthe range of deterministic weather forecasting, are usuallyregarded as weather, and phenomena on longer time scalesas relating to climate.
Hence, the adage (ascribed to Edward Lorenz):
“Climate is what we expect:Weather is what we get.”
Atmospheric variability on time scales of months or longeris referred to as climate variability, and statistics relatingto conditions in a typical (as opposed to a particular) seasonor year are referred to as climatological statistics.
28
Brief Overview of the Atmosphere
The remainder of this introduction provides an overview ofthe optical properties, composition and vertical structureof the earth’s atmosphere, the major wind systems and theclimatological-mean distribution of precipitation.
29
Optical Properties of AtmosphereThe earth’s atmosphere is relatively transparent to incom-ing solar radiation and opaque to outgoing terrestrial radi-ation.
The blocking of outgoing radiation by the atmosphere, pop-ularly referred to as the greenhouse effect, keeps the surfaceof the earth warm enough so that water in the liquid stateis abundant.
30
Optical Properties of AtmosphereThe earth’s atmosphere is relatively transparent to incom-ing solar radiation and opaque to outgoing terrestrial radi-ation.
The blocking of outgoing radiation by the atmosphere, pop-ularly referred to as the greenhouse effect, keeps the surfaceof the earth warm enough so that water in the liquid stateis abundant.
Much of the absorption and reemission of outgoing terres-trial radiation is due to air molecules, but cloud dropletsalso contribute.
The radiation emitted to space by air molecules and clouddroplets provides a basis for remote sensing of the temper-ature and various atmospheric constituents, using satellite-borne sensors.
30
A deck of low clouds off the coast of California(viewed in reflected visible radiation)
31
The back-scattering of solar radiation off the top of the deckof low clouds off the California coast greatly enhances thewhiteness (or reflectively) of that region as viewed fromspace.
32
The back-scattering of solar radiation off the top of the deckof low clouds off the California coast greatly enhances thewhiteness (or reflectively) of that region as viewed fromspace.
The contribution of clouds to the earth’s planetary albedo(i.e., the ratio of backscattered to incoming solar radiation,averaged over the entire planet) is 20%, and atmosphericaerosols also make a significant contribution.
Since back-scattering depletes the incoming solar radiationas it passes through the atmosphere, it has a cooling effecton climate at the earth’s surface.
32
Mass and CompositionThe total mass of the atmosphere can easily be inferredfrom the mean surface pressure.
33
Mass and CompositionThe total mass of the atmosphere can easily be inferredfrom the mean surface pressure.
At any point on the earth, the atmosphere exerts a down-ward force on the underlying surface due to the earth’s grav-itational attraction. The downward force (the weight) on aunit volume of air with density ρ is
F = ρg
where g is the acceleration due to gravity.
Integrating this expression from the earth’s surface to the“top” of the atmosphere, we obtain the pressure on theearth’s surface due to the weight of the air above:
ps =
∫ ∞
0ρg dz
33
Assuming for now that g is constant, g = g0 = 9.8066ms−2,we get
ps = g0
∫ ∞
0ρ dz = mg0
where m is the vertically integrated mass of the air in theoverlying column.
34
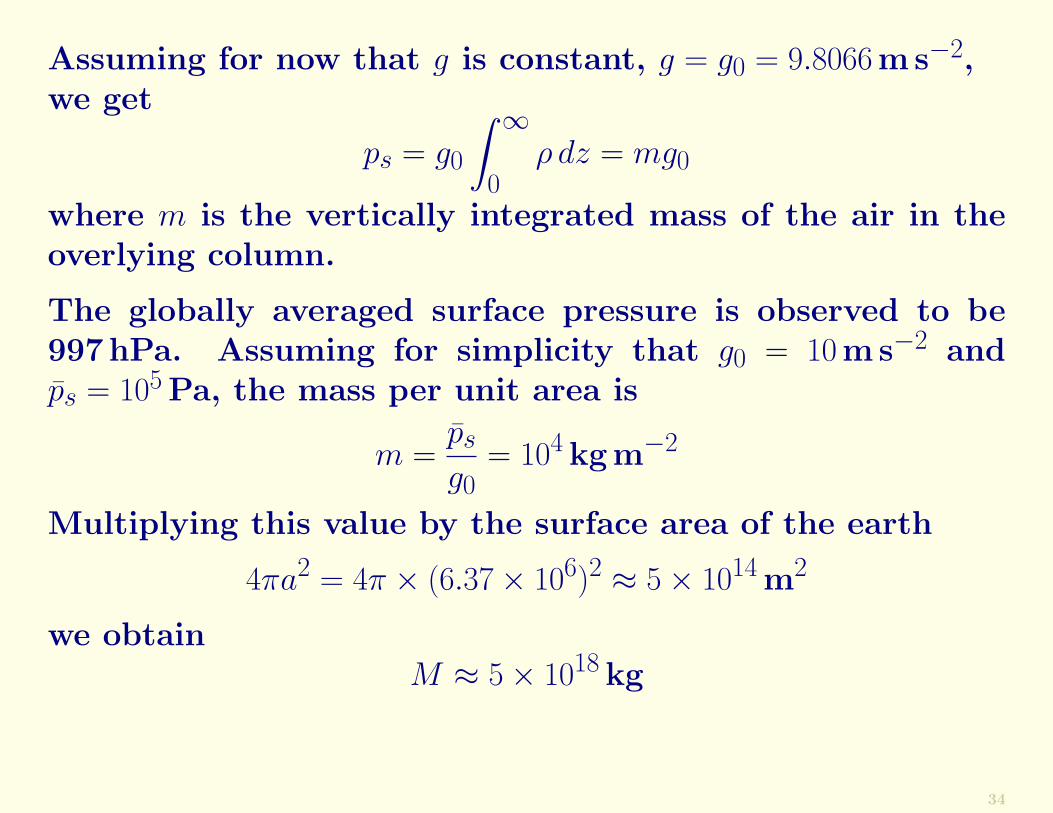
Assuming for now that g is constant, g = g0 = 9.8066ms−2,we get
ps = g0
∫ ∞
0ρ dz = mg0
where m is the vertically integrated mass of the air in theoverlying column.
The globally averaged surface pressure is observed to be997hPa. Assuming for simplicity that g0 = 10ms−2 andps = 105 Pa, the mass per unit area is
m =ps
g0= 104 kgm−2
Multiplying this value by the surface area of the earth
4πa2 = 4π × (6.37× 106)2 ≈ 5× 10¹⁴ m2
we obtainM ≈ 5× 10¹⁸ kg
34
Assuming for now that g is constant, g = g0 = 9.8066ms−2,we get
ps = g0
∫ ∞
0ρ dz = mg0
where m is the vertically integrated mass of the air in theoverlying column.
The globally averaged surface pressure is observed to be997hPa. Assuming for simplicity that g0 = 10ms−2 andps = 105 Pa, the mass per unit area is
m =ps
g0= 104 kgm−2
Multiplying this value by the surface area of the earth
4πa2 = 4π × (6.37× 106)2 ≈ 5× 10¹⁴ m2
we obtainM ≈ 5× 10¹⁸ kg
Exercise: Check this (5 thousand million million tonnes).
34
Principal Constituents of AirThe atmosphere is composed primarily of nitrogen (80%)and oxygen (20%).
The concentrations of other constituents, such as carbondioxide and methane, are small, but they are important forradiative balance.
35
Principal Constituents of AirThe atmosphere is composed primarily of nitrogen (80%)and oxygen (20%).
The concentrations of other constituents, such as carbondioxide and methane, are small, but they are important forradiative balance.
Water occurs in all three phases, and is enormously impor-tant.
Ozone concentrations are much smaller than those of watervapor and are also variable.
Because of the large variability of water vapor, it is cus-tomary to list the percentages of the various constituents inrelation to dry air.
35
Table 1: Main Constitutents of the Atmosphere
Gas Percentage Mol. Wt.Nitrogen N2 78% 28Oxygen O2 21% 32Argon Ar 0.9% 40Water H2O variable 18Air 100% 29
36
Triatomic MoleculesFor reasons that will be explained later, gas molecules com-prised of three or more atoms are highly effective at trap-ping outgoing longwave radiation.
37
Triatomic MoleculesFor reasons that will be explained later, gas molecules com-prised of three or more atoms are highly effective at trap-ping outgoing longwave radiation.
In the earth’s atmosphere, this so-called greenhouse effect isprimarily due to water vapor and certain trace gases (CO2,O3, CH4, N20 and the chlorofluorocarbons or CFC’s), all ofwhich are comprised of three or more atoms.
37
AerosolsAerosols (particles) and cloud droplets account for only aminute fraction of the mass of the atmosphere, but theymediate the condensation of water vapor in the atmosphericbranch of the hydrologic cycle.
38
AerosolsAerosols (particles) and cloud droplets account for only aminute fraction of the mass of the atmosphere, but theymediate the condensation of water vapor in the atmosphericbranch of the hydrologic cycle.
Averaged over the earth’s surface, clouds reflect around 22%of the incoming solar radiation back to space;
Aerosols also contribute to the greenhouse effect.
38
Vertical StructureThe density of air at sea-level is 1.25kgm−3 to within a fewpercent. Pressure and density ρ decrease nearly exponen-tially with height, with an e-folding depth or scale height of7 or 8km.
39
Vertical StructureThe density of air at sea-level is 1.25kgm−3 to within a fewpercent. Pressure and density ρ decrease nearly exponen-tially with height, with an e-folding depth or scale height of7 or 8km.We will show later that
p = p0 e−z/H
or, equivalently
log
(p
p0
)= − z
H
where H is the scale height.
39
Density decreases with height in the same manner as pres-sure.
The exponential dependence can be seen from the the factthat the pressure and density curves on a semi-log plotclosely resemble straight lines.
40
Vertical profiles of pressure (hPa), density (gm−3), and mean free path
(m), for the standard atmosphere.
41
Exercise: Assuming a scale height of 7.5 km,estimate the heights in the atmosphere at whichthe air density is equal to 1kgm−3, and thepressure is equal to 1 hPa.
? ? ?
42
Exercise: Assuming a scale height of 7.5 km,estimate the heights in the atmosphere at whichthe air density is equal to 1kgm−3, and thepressure is equal to 1 hPa.
? ? ?
Because the pressure at a given height in theatmosphere is a measure of the mass that liesabove that level, it is sometimes used as a ver-tical coordinate in lieu of height.
For example, the 500-hPa level, situated ata height of around 5.5 km above sea-level isroughly halfway up to the top the atmospherein terms of mass.
42
The vertical distribution of temperature fortypical conditions in the earth’s atmosphere isshown in the following figure. The atmosphereis divided into four layers:
• troposphere
• stratosphere
• mesosphere
• thermosphere
43
The vertical distribution of temperature fortypical conditions in the earth’s atmosphere isshown in the following figure. The atmosphereis divided into four layers:
• troposphere
• stratosphere
• mesosphere
• thermosphere
These are separated by surfaces called the
• tropopause
• stratopause
• mesopause43
Vertical temperature profile (Standard atmosphere)
44
The TroposphereThe troposphere ( or turning or changing sphere)is marked by generally decreasing tempera-tures with height, with an average rate of de-crease of temperature with height or lapse rateof about 7◦Ckm−1. That is to say,
Γ ≡ −∂T
∂z≈ 7Kkm−1 = 0.007Km−1
where T is temperature and Γ is the lapse rate.
45
The TroposphereThe troposphere ( or turning or changing sphere)is marked by generally decreasing tempera-tures with height, with an average rate of de-crease of temperature with height or lapse rateof about 7◦Ckm−1. That is to say,
Γ ≡ −∂T
∂z≈ 7Kkm−1 = 0.007Km−1
where T is temperature and Γ is the lapse rate.
Tropospheric air, which accounts for about 80%of the mass of the atmosphere, is relatively wellmixed and it is continually being cleansed orscavenged of aerosols by cloud droplets and iceparticles.
45
Temperature InversionsEmbedded within the troposphere are thin lay-ers called temperature inversions in which tem-perature increases with height and vertical mix-ing is strongly inhibited.
Inversions are not fixed in space or time, butdepend strongly on the prevailing weather con-ditions.
In turn, inversions have a strong effect locallyon the atmospheric conditions near the ground.
46
Cumulonimbus cloud with fully developed anvil.
47
The Stratosphere (and above)Within the stratosphere (or layered sphere)the increase of temperature with height stronglyinhibits vertical mixing, just as it does withinthe much thinner temperature inversions thatoften form within the troposphere.
48
The Stratosphere (and above)Within the stratosphere (or layered sphere)the increase of temperature with height stronglyinhibits vertical mixing, just as it does withinthe much thinner temperature inversions thatoften form within the troposphere.
The characteristic anvils created by the spread-ing of cloud tops generated by intense thunder-storms are due to this strong stratification.
Cloud processes in the stratosphere play a muchmore limited role in removing particles injectedby volcanic eruptions and human activities thanthey do in the troposphere.
48
As a result, residence times for aerosols tendto be much longer in the stratosphere than thetroposphere.
49
As a result, residence times for aerosols tendto be much longer in the stratosphere than thetroposphere.
Stratospheric air is extremely dry and it ischaracterized by relatively high concentrationsof ozone. The absorption of solar radiation inthe ultraviolet region of the spectrum by thisstratospheric ozone layer is critical to the hab-itability of the earth.
Heating due to the absorption of this ultra-violet radiation gives rise to the temperaturemaximum that defines the stratopause.
49
The increase of temperature with height withinthe thermosphere is due to the absorption ofsolar radiation in association with the dissocia-tion of diatomic nitrogen and oxygen moleculesand the stripping of electrons from atoms.
50
The increase of temperature with height withinthe thermosphere is due to the absorption ofsolar radiation in association with the dissocia-tion of diatomic nitrogen and oxygen moleculesand the stripping of electrons from atoms.
Temperatures in the earth’s outer thermospherevary widely in response to variations in theemission of ultraviolet and x-ray radiation fromthe sun’s outer atmosphere.
Definition: The Middle Atmosphere is the re-gion of the atmosphere between the tropopauseand the mesopause. Thus, it comprises thestratosphere and mesosphere.
50
Zonal Mean StateAt any given level in the atmosphere temper-ature varies with latitude. Within the tropo-sphere, the zonally averaged temperature gen-erally decreases with latitude, as seen in themeridional cross section.
The meridional temperature gradient is sub-stantially larger in the winter hemisphere wherethe polar cap region is in darkness.
51
Meridional cross section of January mean tem-perature (red) and zonal wind (blue).
52
Meridional cross section of July mean temper-ature (red) and zonal wind (blue).
53
The tropopause is clearly evident in these fig-ures as a discontinuity in the lapse rate. Notethe distinct break between the tropical tropo-pause, with a mean altitude of 17km, and theextratropical tropopause, with a mean altitudenear 10km.
The tropical tropopause is remarkably cold,with temperatures on the order of −80◦C.
54
Scale of MotionsThe horizontal scale of atmospheric motions isdefined in various ways.
If a pattern as is wavelike, it may be defined asthe wavelength divided by 2π. If the patternresembles a closed circulation or vortex, it maybe taken simply as the radius.
55
Scale of MotionsThe horizontal scale of atmospheric motions isdefined in various ways.
If a pattern as is wavelike, it may be defined asthe wavelength divided by 2π. If the patternresembles a closed circulation or vortex, it maybe taken simply as the radius.
Features in the flow with scales >6000 km arereferred to as planetary-scale;
Features with scales between 1000 and 6000km as synoptic-scale
Features with scales ranging from 30 to 1000km as meso-scale.
55
Atmospheric MotionsDifferential heating between low and highlatitudes gives rise to vigorous large scalehorizontal motions on a wide range of scales.
56
Atmospheric MotionsDifferential heating between low and highlatitudes gives rise to vigorous large scalehorizontal motions on a wide range of scales.
Prominent features of the atmospheric climato-logical-mean wind field, which are maintainedby this heating gradient are the planetary-scalewest-to-east (westerly) mid-latitude troposphericjet streams, centered at the tropopause in mid-latitudes, and the stratospheric polar-night jet,which is evident in the meridional cross-sectionshown already.
56
The tropospheric jet streams are perturbedby an endless succession of eastward propa-gating, synoptic scale baroclinic waves whichfeed upon, and tend to limit the north-southtemperature contrast.
57
The tropospheric jet streams are perturbedby an endless succession of eastward propa-gating, synoptic scale baroclinic waves whichfeed upon, and tend to limit the north-southtemperature contrast.
Baroclinic waves are one of a number of typesof atmospheric disturbances that develop spon-taneously in response to instabilities in thelarge scale flow pattern in which they are em-bedded.
57
Large wave-like distortion of the zonal flow.
58
Extratropical CyclonesThe low level wind pattern in these baroclinicwaves is dominated by extratropical cyclones,an example of which is shown below.Much of the significant weather associated withthese disturbances occurs within frontal zones:meso-scale bands of highly concentrated hori-zontal temperature gradients.Extratropical cyclones are distinctly differentfrom the tighter and more circular tropical cy-clones.
59
An intense extra-tropical cyclone overthe North Pacific,as viewed in visiblesatellite imagery. Theelongated cloud bandsspiraling out fromthe center are theremnants of frontalzones.
60
An old extratropicalcyclone over Ireland(06/08/1986, 14:00,Ch2).
61
Hurricane Andrew approaching the Florida coast.
62
Global Surface WindsThe distribution of surface winds over the oceansis shown in the following figure.Note the following features:
• Westerlies over the higher latitude oceans
• Easterlies (trade winds) over the tropical andsubtropical Oceans
• The boundary between the northeast trades,and southeast trades, the intertropical con-vergence zone (ITCZ), located near the equa-tor
• Seasonally reversing monsoon circulation overthe Indian Ocean
63
January and July surface winds over the oceans[based on three years of Quikscat scatterometer data]
64
In a time average over the winter season, thenorthern hemisphere westerly belt is dominatedby cyclonic circulations centered over the Aleu-tians and Iceland.
The flow over the oceans at lower latitudesis dominated by the subtropical anticyclonescentered at latitudes near 30◦. prominent dur-ing summer.
Longitudinally dependent climatic features suchas the monsoons and the subtropical anticy-clones are driven by contrasts in surface airtemperature that develop in response to thewidely differing heat capacities of land and sea.
65
Land-sea contrasts also give rise to a system-atic meandering of in the jet streams at higherlatitudes, particularly over the northern hemi-sphere during winter.
66
Smaller Scale MotionsThe heating of the earth’s surface by solar ra-diation gives rise to buoyant plumes, referredto by glider pilots as “thermals”.
These plumes of rising air are often visible ascumulus clouds. The overturning circulationsare often confined to the lowest 1-2 km of theatmosphere (the so called mixed layer or plan-etary boundary layer, in which case they arereferred to as shallow convection.
67
Cumulus clouds resulting from plumes of risingair in shallow boundary layer convection.
68
Deep ConvectionDeeper, more vigorous convection is often ob-served in cold air masses flowing over a warmersurface. Under certain conditions, buoyantplumes originating near the earth’s surface canbreak through the weak temperature inversionthat usually caps the mixed layer, giving riseto towering clouds that extend all the way tothe tropopause, referred to as deep convection.
69
Deep convective storms can cause locally heavy rain, sometimes accom-
panied by hail, strong winds, and intense electrical activity.
70
Boundary Layer TurbulenceConvection is not the only source of small scaleatmospheric motions. Large scale flow oversmall surface irregularities induces small scale,three-dimensional boundary layer turbulence,which is clearly revealed by the distortions andspreading of the plumes from smokestacks.
71
Boundary Layer TurbulenceConvection is not the only source of small scaleatmospheric motions. Large scale flow oversmall surface irregularities induces small scale,three-dimensional boundary layer turbulence,which is clearly revealed by the distortions andspreading of the plumes from smokestacks.
This boundary layer turbulence is instrumen-tal in causing smoke plumes to widen as theymove downstream, in limiting the strength ofthe winds, and in mixing momentum, energyand trace constituents between the atmosphereand the underlying surface.
71
Smoke plume from a large forest fire widening as it moves downstream
under the influence of boundary layer turbulence.72
High Level TurbulenceTurbulence is not exclusively a boundary layerphenomenon: it can also be generated by flowinstabilities higher in the atmosphere.
The cloud pattern shown below reveals thepresence of a overturning circulations know asKelvin-Helmholtz billows, that develop spon-taneously in regions of strong vertical windshear.
73
Kelvin-Helmholtz billows
74
Clear Air TurbulenceThrough this succession of instabilities, kineticenergy extracted from the large scale wind fieldgives rise to a spectrum of smaller scale mo-tions extending down to the molecular scale:
Big whirls have smaller whirls that feed on their velocity.
Little whirls have lesser whirls, and so on to viscosity.
75
Clear Air TurbulenceThrough this succession of instabilities, kineticenergy extracted from the large scale wind fieldgives rise to a spectrum of smaller scale mo-tions extending down to the molecular scale:
Big whirls have smaller whirls that feed on their velocity.
Little whirls have lesser whirls, and so on to viscosity.
Within localized patches where the energy cas-cade is particularly intense, eddies on scales oftens of meters can be strong enough to causediscomfort to airline passengers and, in excep-tional cases, to pose hazards to aircraft. Tur-bulence generated by shear instability is re-ferred to as clear air turbulence.
75
PrecipitationSo you thought Ireland’s climate was wet!!!
76
PrecipitationSo you thought Ireland’s climate was wet!!!
The following figure shows the climatologicalmean distribution of precipitation.
The narrow bands of heavy rainfall that dom-inate the tropical Atlantic and Pacific sectorscoincide with the ITCZ’s in the surface windfield pointed out above.
The ITCZ is flanked by pronounced dry zoneswhich extend westward from the continentaldeserts.
76
Climatological mean precipitation
77
A Typical DayOn any given day, the cloud patterns revealedby global satellite imagery exhibit patches ofdeep convective clouds that can be identifiedwith the ITCZ and the monsoons over the trop-ical continents of the summer hemisphere; arelative absence of clouds in the subtropicaldry zones; and a succession of comma-shaped,frontal cloud bands embedded in the baroclinicwaves tracking across the mid-latitude oceans.
78
Satellite imagery in the water vapour channel.Note the contrast between cloudy ascendingair (lighter shades) and clear, dry sinking air(black).