School of Public Health and Community Medicine Mary-Louise McLaws Professor of Epidemiology Healthcare Associated Infection and Infectious Diseases Control Epidemiology Advisor to Clinical Excellence Commission Central Line Associated Bloodstream Infections: Is achieving zero possible?
Transcript
School of Public Health and Community Medicine
Mary-Louise McLaws
Professor of Epidemiology
Healthcare Associated Infection and Infectious Diseases Control
Epidemiology Advisor to Clinical Excellence Commission
Central Line Associated Bloodstream Infections: Is achieving zero possible?
How much is infection prevention worth?
1. Insertion bundle for zero risk for CLABSI
How large is the CLABSI problem ?
How did we introduce bundle intervention ?
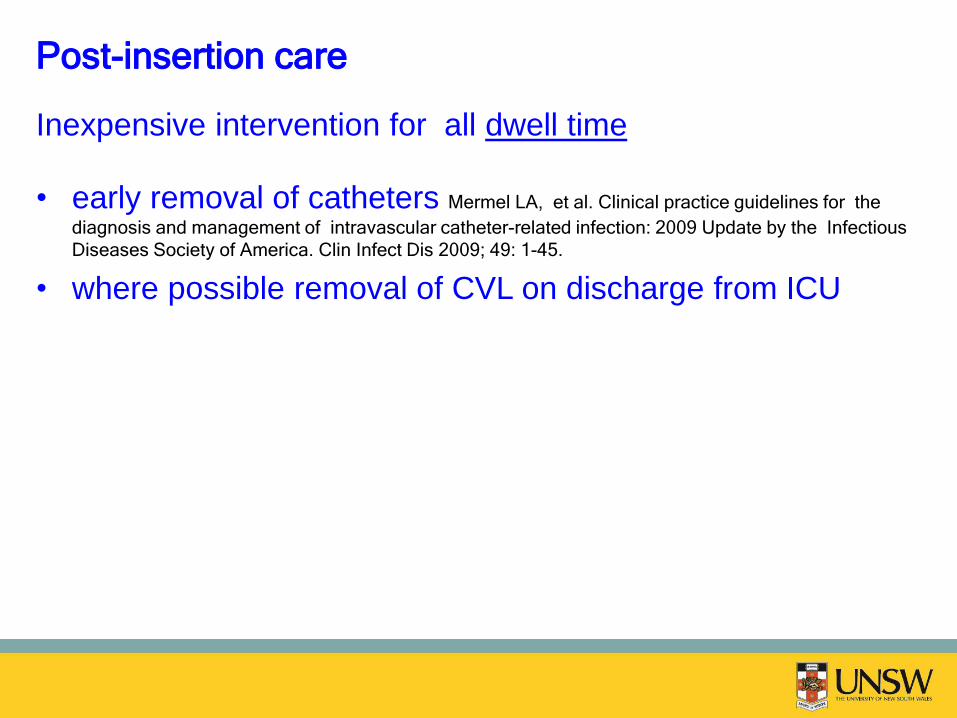
2. Dwell time associated with increased risk of CLABSI
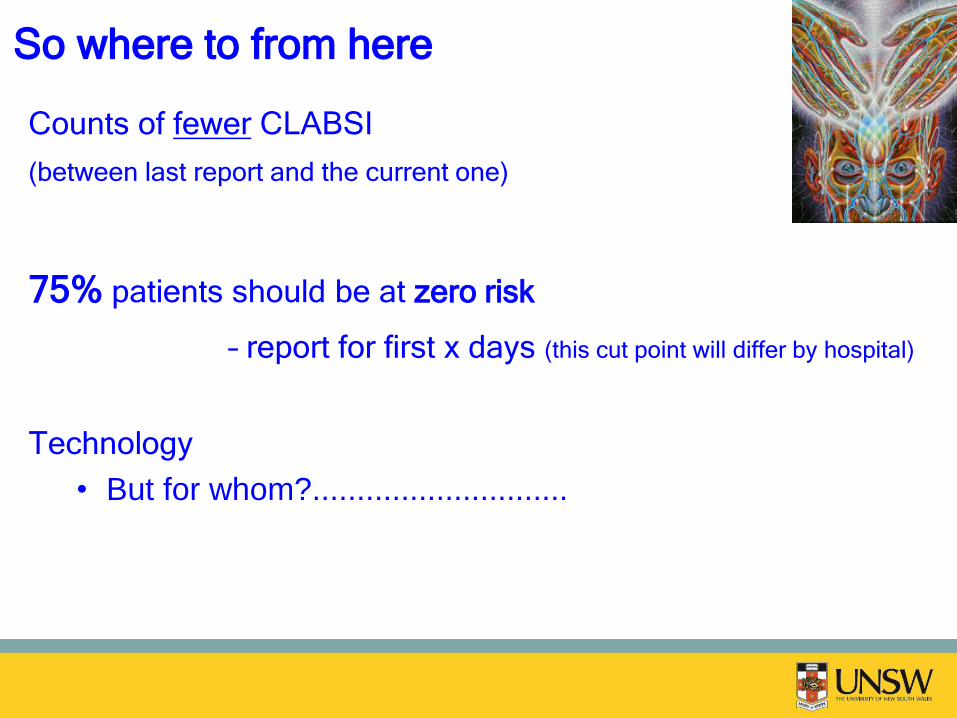
Is every patient with a CVC at risk of CLABSI?
3. Surveillance analysis to assist CLABSI prevention
Is there a better surveillance method to identify dwell time
for targeting infection control efforts?
4. Other CLABSI prevention methods
Some are expensive so which patients should have
additional prevention resources?
CDC DEFINITION OF A CENTRAL LINE Insertion site or device type ARE NOT used to determine line as
central line
Central line: intravascular catheter that terminates at or close to
the heart or in one of the great vessels which is used
for infusion, withdrawal of blood, or hemodynamic
monitoring
Great vessels: Aorta, pulmonary artery, superior vena cava, inferior
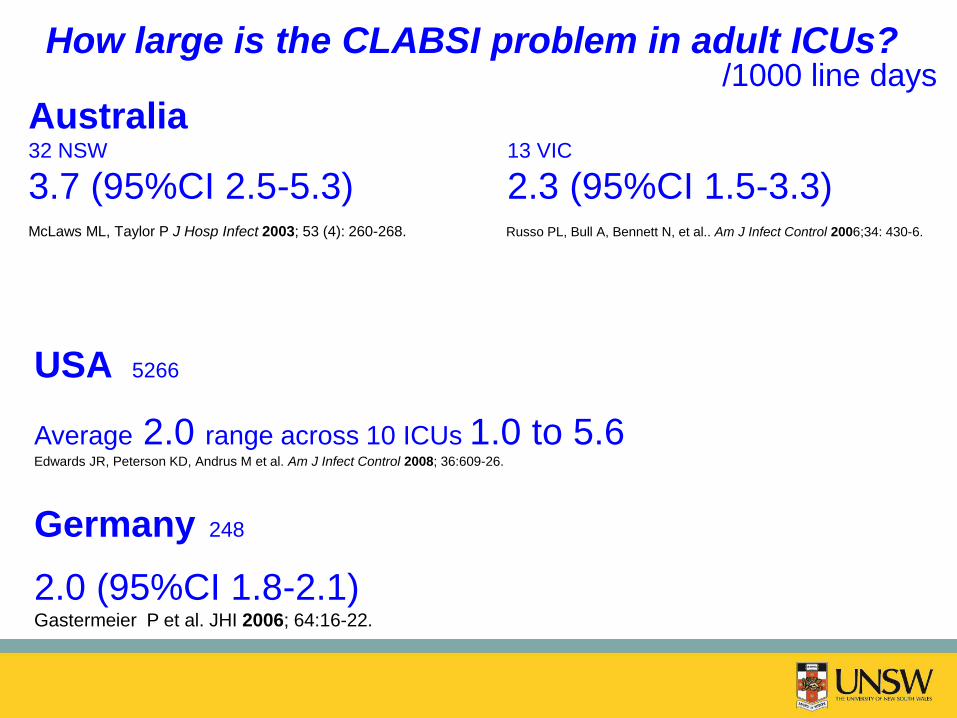
McLaws ML, Taylor P J Hosp Infect 2003; 53 (4): 260-268. Russo PL, Bull A, Bennett N, et al.. Am J Infect Control 2006;34: 430-6.
USA 5266
Average 2.0 range across 10 ICUs 1.0 to 5.6 Edwards JR, Peterson KD, Andrus M et al. Am J Infect Control 2008; 36:609-26.
Germany 248
2.0 (95%CI 1.8-2.1) Gastermeier P et al. JHI 2006; 64:16-22.
How large is the CLABSI problem in adult ICUs? /1000 line days
Germany
920 from 248 ICU 4 each ICU / year
USA
5266 from 1045 ICU 5 each ICU / year
AUSTRALIA (NSW + Victoria)
106 from 45 ICUs 2 each ICU / year
What does this mean in terms of infected
patients per year?
What does this mean in terms of
death per year ?
attributable mortality 12% -25% CDC. Vital Signs: Central line – associated blood stream infections – United States, 2001, 2008, and
2009. MMWR 2011; 60(8): 243-8.
1 death each ICU / year
15 years of Evidence
CLABSI is preventable
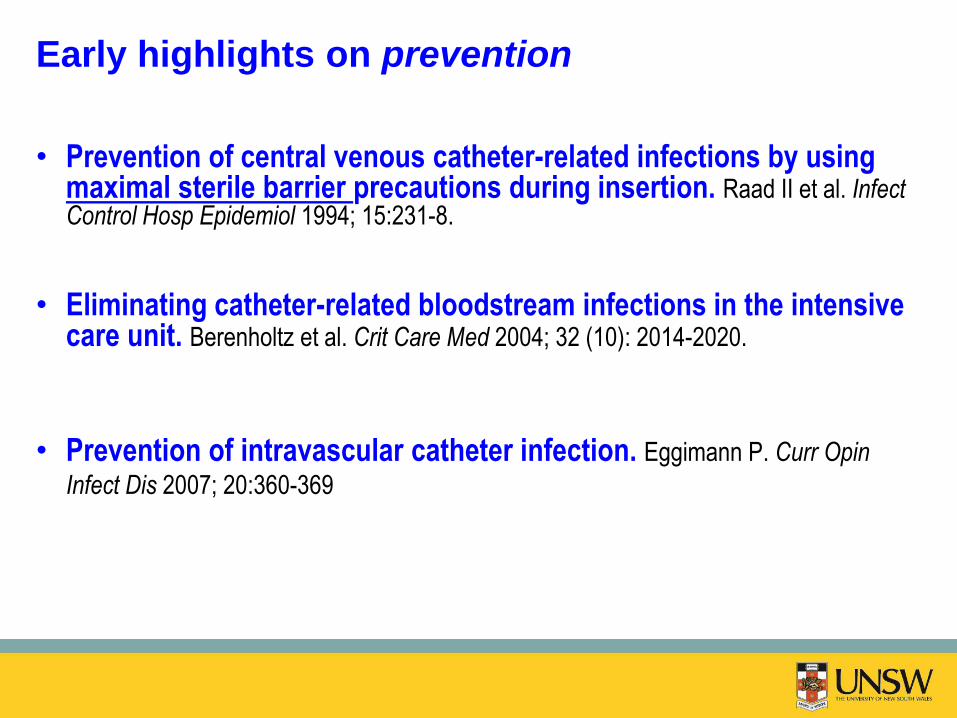
Early highlights on prevention
• Prevention of central venous catheter-related infections by using maximal sterile barrier precautions during insertion. Raad II et al. Infect Control Hosp Epidemiol 1994; 15:231-8.
• Eliminating catheter-related bloodstream infections in the intensive care unit. Berenholtz et al. Crit Care Med 2004; 32 (10): 2014-2020.
• Prevention of intravascular catheter infection. Eggimann P. Curr Opin
Infect Dis 2007; 20:360-369
Major collaborative studies
• CLABSI rate by 68% to 1.36/1000 line days over
a 4 year period 69 ICUs in South Western Pennsylvania MMWR. 2005;54:1013-1016. & JAMA 2006; 269-270.
• Comparable results were obtained in 46 ICUs in New York State & a group of Veterans Affairs hospitals
Koll BS et al. Jt Comm J Qual Patient Saf 2008;34:713-723.
Bonello RS et al. Jt Comm J Qual Patient Saf 2008;34:639-645.
• A regional collaborative study 44 ICUs underway in
Tuscany
Rodell S et al.Qual Saf Health Care 2008;17:20-21.
• Low resourced setting
Marra AR, Cal RG, Durao MS et al. Am J Infect Control 2010;38:434-439.
Keystone ICU Project
Pronovost P, Needham D, Berenholtz S, et al. An intervention to decrease catheter-
related bloodstream infections in the ICU. N Engl J Med 2006;355:2725–2732
Pronovost et al NEJM 2006;355(26): 2725-32.
Pronovost et al BMJ 2010;340:c309.
0 months median 2.7 (IQR 0.6 - 4.8) /1000 line-days
3 months median 0.0 (IQR 0.0 - 2.4) /1000 line-days
16-18 months median 0.0 (IQR 0.0 - 3.0) /1000 line-days
34-36 months median 0.0 (IQR 0.0 - 1.2) /1000 line-days
55 then 108 ICU Michigan
Aim: all 37 public ICUs in NSW
How did NSW introduce bundle intervention ?
How did NSW introduce bundle intervention ?
Multidisciplinary support
Clinical Excellence Commission
Intensive Care Centre Monitoring Unit
NSW Ministry of Health
Physician and Nurse from every ICU
Burrell A, McLaws ML, Herkes R, Mungo M, Pantle A. Aseptic insertion of central lines reduces bacteraemia: The NSW
Central Line Associated Bacteraemia Collaborative (CLAB-ICU). Med J Aust 2011; 194: 583-587.
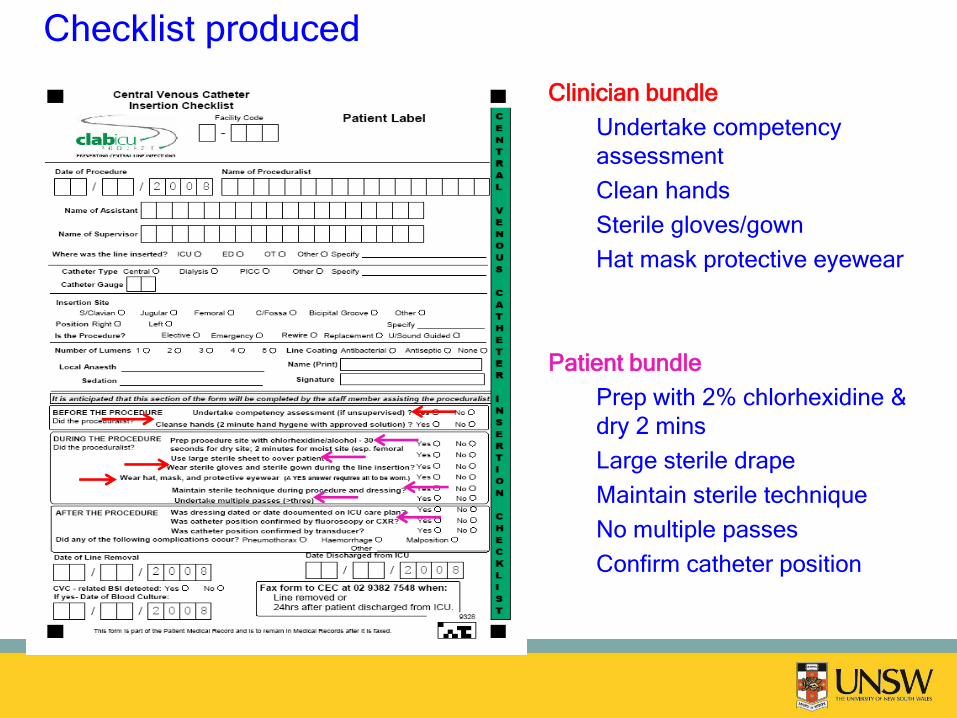
Checklist produced
Clinician bundle
Undertake competency
assessment
Clean hands
Sterile gloves/gown
Hat mask protective eyewear
Patient bundle
Prep with 2% chlorhexidine &
dry 2 mins
Large sterile drape
Maintain sterile technique
No multiple passes
Confirm catheter position
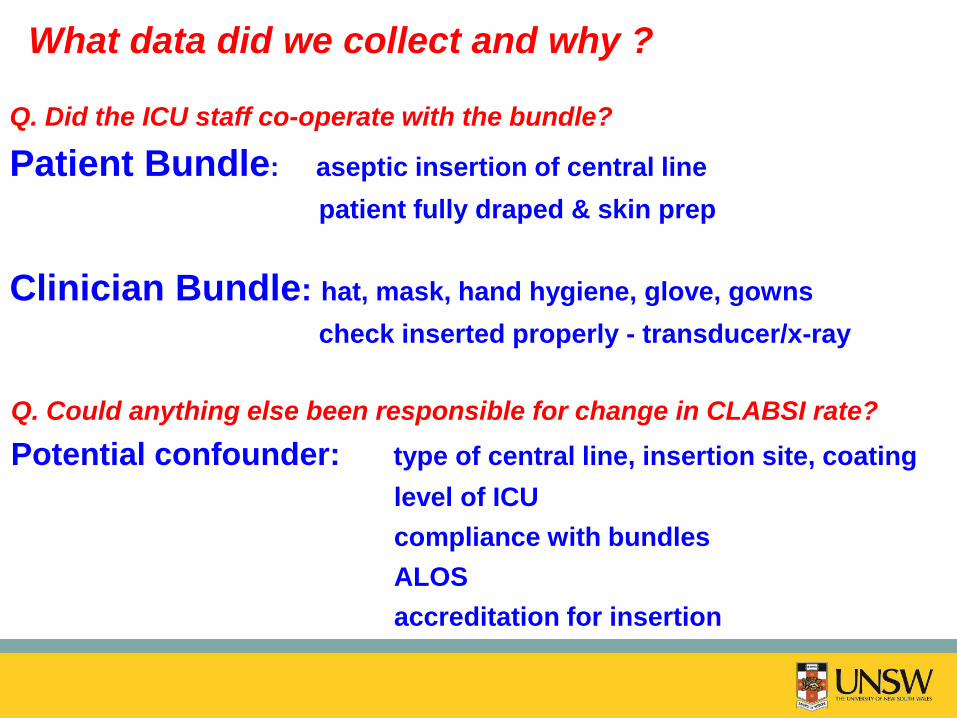
Q. Did the ICU staff co-operate with the bundle?
Patient Bundle: aseptic insertion of central line
patient fully draped & skin prep
Clinician Bundle: hat, mask, hand hygiene, glove, gowns
check inserted properly - transducer/x-ray
Q. Could anything else been responsible for change in CLABSI rate?
Potential confounder: type of central line, insertion site, coating
level of ICU
compliance with bundles
ALOS
accreditation for insertion
What data did we collect and why ?
Initial clinician resistance
‘We don’t have CLABSIs’
‘I don’t believe the evidence’
4 ICUs would not wear hats
‘Where’s the money?’ (Data collection/reporting)
Apathy
Overcome these by…
Increased involvement by senior intensive care physicians
Increased checking of data submitted to Commission
Increased feedback reports from us to participating units
What issues effected co-operation?
Checklist Compliance rate for all units
After Safe Insertion
Entire patient draped 93%
Alcoholic chlorhexidine prep allowed to dry 96%
Sterile technique maintained 96%
Hat, mask, eyewear 80%
Hands washed 2 mins 92%
Sterile gown/gloves 96%
Competency assessed 48% (23% No; 29%
missing)
No multiple passes 81%
Confirm position radiologically 74%
Other method to confirm placement 44% (45% No; 11%
missing)
Per cent of hospitals that regularly use practice to prevent Central Line-Associated
Bloodstream Infection (CLABSI).
Sarah L Krein et al. BMJ Qual Saf doi:10.1136/bmjqs-2014-
NNIS in 2005 became National Healthcare Safety Network (NHSN)
“ For device-associated HAI incidence density rates9: record daily the total number of patients and total number of ....central line-days....in the patient care area(s) under surveillance; sum these daily counts at the end of the surveillance period for use as denominators” (CDC April 2006) “..the number of patients with one or more central lines of any type is collected daily, at the same time each day, during the month and recorded on the Denominators for Intensive Care Unit (ICU)/Other Locations” (CDC May 2010)
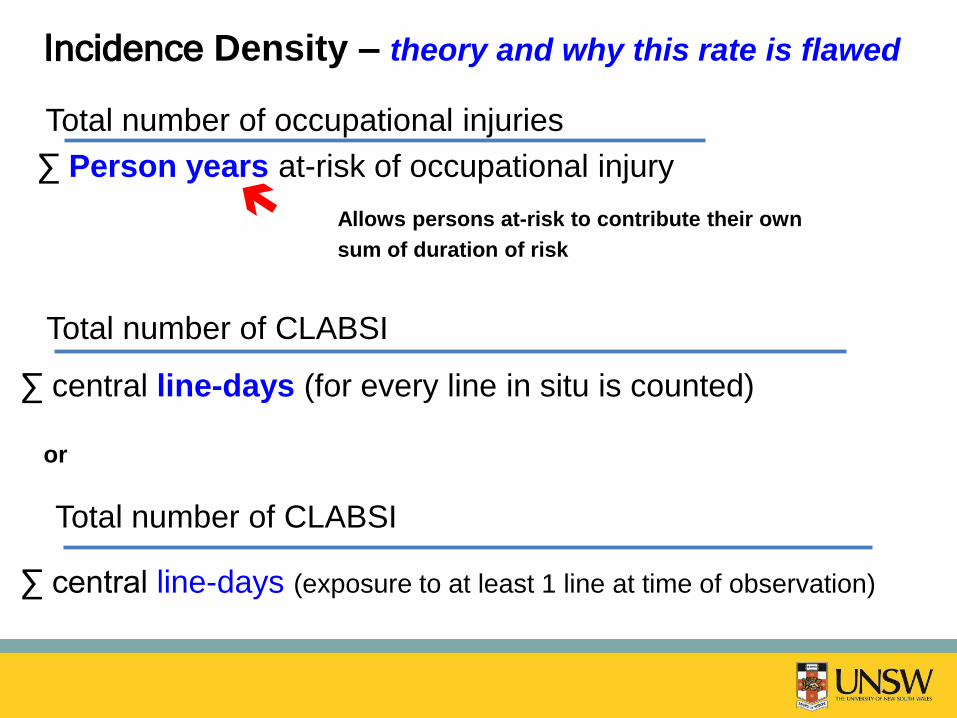
Total number of occupational injuries
∑ Person years at-risk of occupational injury
Incidence Density – theory and why this rate is flawed
Allows persons at-risk to contribute their own
sum of duration of risk
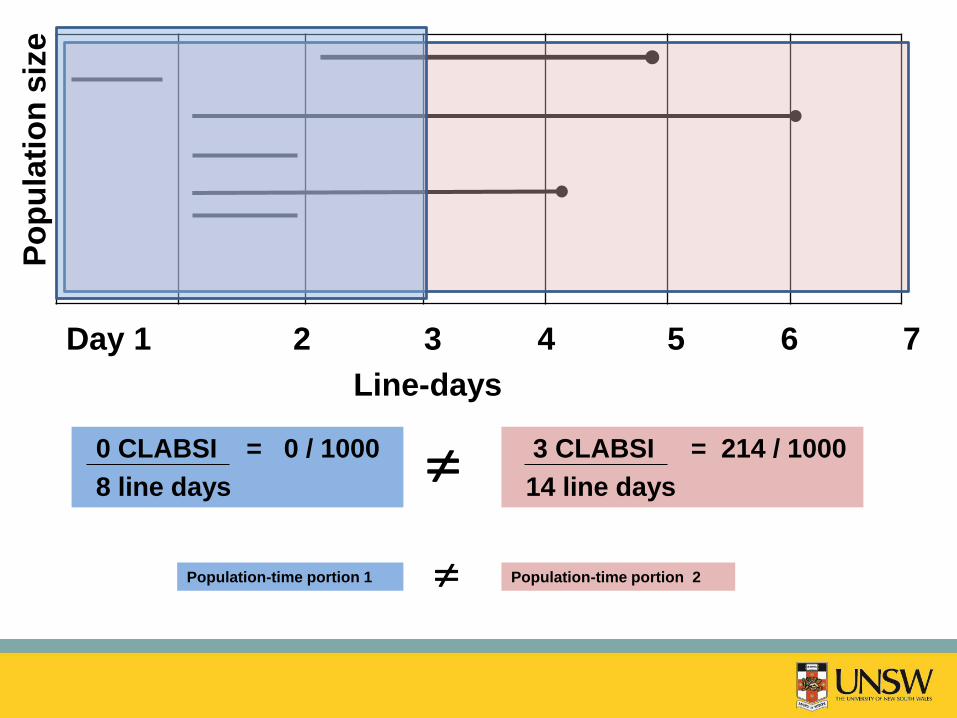
Total number of CLABSI
∑ central line-days (exposure to at least 1 line at time of observation)
Total number of CLABSI
∑ central line-days (for every line in situ is counted)
or
History sophistication of disease frequency and distribution
1620-74 John Graunt quantified disease patterns
in The Nature of Political Observations Made Upon the Bills of
Mortality (1664)
1807- 83 William Farr vital statistics system
(1837) for surveillance person-time
Statistics for a Fixed population
fixed Mt (or Mb) in a fixed population is evaluated within successive ‘same time’
intervals so that time dependence of Mt can be elucidated.
Graunt’s Life table
Fixed populations
Table 1. Graunt’s Life Table
Age Interval % Surviving during % Survived at
Interval start of Interval
0-6 36 100
7-16 24 64
17-26 15 40
27-36 9 25
37-46 6 16
47-56 4 10
57-66 3 6
67-76 2 3
77-86 1 1
Statistics for a dynamic population
dynamic Persons enter (born, migrate, aging into a stratum) as observation time proceeds.
Some exit (emigrate, die, become diseased) but population is in a steady state
number entering must = number leaving the population to be in a
‘steady state’
Farr’s Person-time
Rules for incidence density for a dynamic population:
constant dwell time over the audit period
if you take a snap shot of the dwell-time experienced by