34

PROFILE: NELSON MANDELA BAY METRO
2
PROFILE: NELSON MANDELA BAY METRO 3
CONTENT
Executive Summary ............................................................................................................ 4
1. Nelson Mandela Bay Metro Metropolitan Municipality .............................................. 7 1.1 Nelson Mandela Bay Metro Contextual Perspective 7
2. Social Development Profile .............................................. Error! Bookmark not defined. 2.1 Key Demographics Error! Bookmark not defined. 2.1.1. Population and Household Profile Error! Bookmark not defined. 2.1.2 Age Profile Error! Bookmark not defined. 2.1.3. Poverty Error! Bookmark not defined. 2.1.4. Human Development Index and Gini coefficient Error! Bookmark not defined. 2.1.5. Unemployment/Employment Error! Bookmark not defined. 2.1.6. Service Delivery Analysis Error! Bookmark not defined. 2.1.6.1. Housing Error! Bookmark not defined. 2.1.6.2. Water Error! Bookmark not defined. 2.1.6.3. Sanitation Error! Bookmark not defined. 2.1.6.4. Refuse removal Error! Bookmark not defined. 2.1.6.5. Electricity Error! Bookmark not defined. 2.1.6.6. Roads and Stormwater Error! Bookmark not defined. 2.1.6.7. Community Facilities Error! Bookmark not defined. 2.1.7. Education Provision Error! Bookmark not defined. 2.1.8. Healthcare Provision Error! Bookmark not defined. 2.1.9. Covid-19 Error! Bookmark not defined. 2.1.10. Crime Levels Error! Bookmark not defined.
3. Environmental Features ................................................... Error! Bookmark not defined.
4. Economic Drivers .............................................................. Error! Bookmark not defined. 4.1 Economic Overview Error! Bookmark not defined. 4.2 Primary Sectors Error! Bookmark not defined. 4.2.1. Agriculture Error! Bookmark not defined. 4.2.2. Mining Error! Bookmark not defined. 4.3 Secondary Sector Error! Bookmark not defined. 4.3.1.Manufacturing Error! Bookmark not defined. 4.4. Tertiary Sector Error! Bookmark not defined. 4.4.1. Community service sector Error! Bookmark not defined. 4.5. Tourism Error! Bookmark not defined.
5. Catalytic Projects to Diversify and Grow the Economy . Error! Bookmark not defined. 5.1. Port Elizabeth International Airport
6. Governance ....................................................................... Error! Bookmark not defined. 6.1.1. Financial Health Error! Bookmark not defined.
6.1.1.1. Audit Outcomes .............................................. Error! Bookmark not defined.
6.1.1.2. Budget Allocation ............................................ Error! Bookmark not defined.
6.1.1.3. Financial Viability ............................................ Error! Bookmark not defined.
6.1.2. Governance Structure Error! Bookmark not defined.
PROFILE: NELSON MANDELA BAY METRO
4
PROFILE: NELSON MANDELA BAY METRO 5
PROFILE: NELSON MANDELA BAY METRO
6
EXECUTIVE SUMMARY
The City of Port Elizabeth is South Africa's second-oldest city,
boasting its pristine scenic coastline that stretches along with a
multitude of Blue Flag Beaches. Nelson Mandela Bay comprises of
the City of Port Elizabeth and smaller towns of Uitenhage, Despatch
and Colchester, all administratively governed by the Nelson Mandela
Bay Municipality.
The City is mostly referred to as the "friendly city" or the "water sports capital of Africa"
and regarded as the official gateway to the scenic Eastern Cape Province and the
world-renowned Garden Route. Tourists, athletes and spectators who travel here get
the unique opportunity to visit one of the most wildly beautiful and historically
significant areas of the world. Nelson Mandela Bay boasts the Big 7 all within its
municipal boundaries. It is also recognised as both the Mohair and Bottlenose Dolphin
Capital of the World and home to the largest breeding colony of the African Penguin.
Situated on the shores of the Indian Ocean, this bustling seaport City flaunts an
atmosphere of relaxed year-round fun and excitement. Warm, dry Summers and mild
Winter temperatures entice water sports lovers throughout the year. The breath-taking
seashore boasts a perfect combination of warm water, protected beaches and
refreshing sea breezes. Here you will find some of the world's best sailing venues,
first-rate scuba diving with colourful coral species, beautiful reefs and shipwrecks,
perfect conditions for wind-surfing, angling, snorkelling, kite-surfing, fly-fishing and
canoeing.
The City has consecutively been awarded the "Blue Flag Status" - an international
award only given to those beaches that meet excellence in safety, amenities,
cleanliness and environmental standards.
The infrastructure and accommodation facilities are well established and at par with
global quality and standards. Revered as the "Mecca of Sport" in Africa, the Nelson
Mandela Bay Municipality has a proven track record of successfully hosting local,
regional and international sporting events and has become a City of choice for many
event organizers and sporting federations.
PROFILE: NELSON MANDELA BAY METRO 7
1. Nelson Mandela Bay Metropolitan Municipality
1.1 Nelson Mandela Bay Contextual Perspective
The Nelson Mandela Bay Metropolitan Municipality (Area: 1 950km2) is
a Category A municipality established on 5 December 2000. Nelson
Mandela Bay was the first City in South Africa to establish a fully
integrated democratic local authority. The City is home to the Port
Elizabeth International Airport, the only international air access point
in the Eastern Cape Province. The City's maritime entry point
showcases its developmental capabilities, boasting the most modern
deep-water port in the Southern Hemisphere, the Port of Ngqura.
The Coega Industrial Development Zone (IDZ) is situated within the Nelson Mandela
Metropolitan Municipality. The initiative is a multibillion-dollar industrial development
complex customized for heavy, medium and light industries. It is adjacent to a
deepwater port, the Port of Ngqura, and covers 110 km2 of land. The city’s unique
advantage of possessing two ports, namely Port Elizabeth Harbour and Ngqura,
creates an opportunity for the city to establish a strong and vibrant maritime sector”.
PROFILE: NELSON MANDELA BAY METRO
8
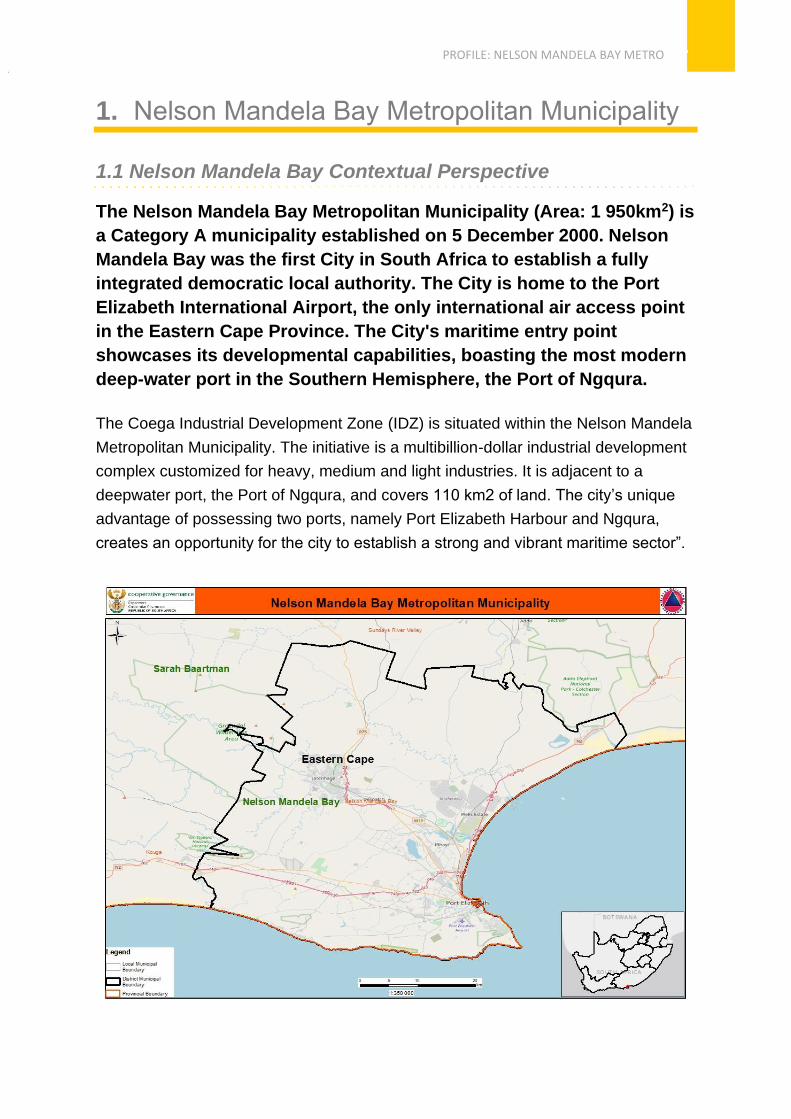
Nelson Mandela Bay is located on the southern coast of South Africa, on the shores
of Algoa Bay. The Nelson Mandela Bay Municipality is one of two metropolitan
municipalities in the Eastern Cape Province. It incorporates Port Elizabeth, Uitenhage
and Despatch, with their surrounding agricultural areas, and has an area of 1959, 02
km². The Map below is a depiction that shows the location of the NMBM in South Africa
and the Eastern Cape.
2. Social Development Profile
2.1. Key Demographics
2.1.1. Population and Household Profile
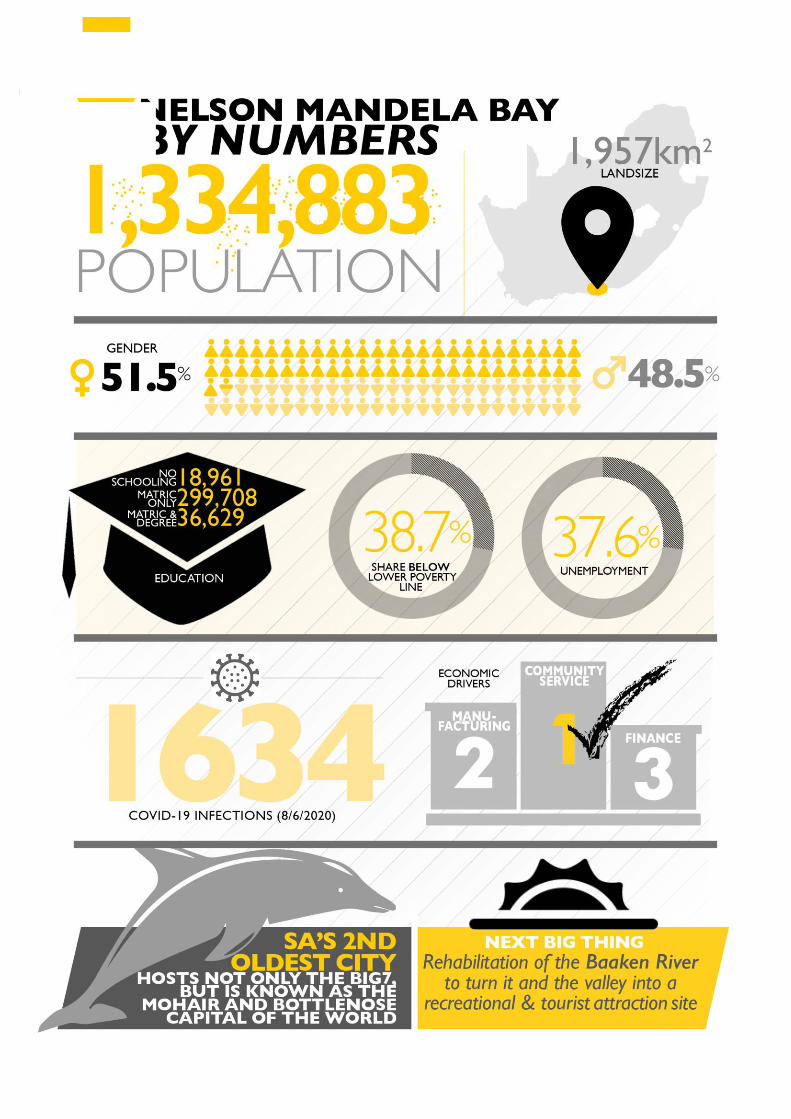
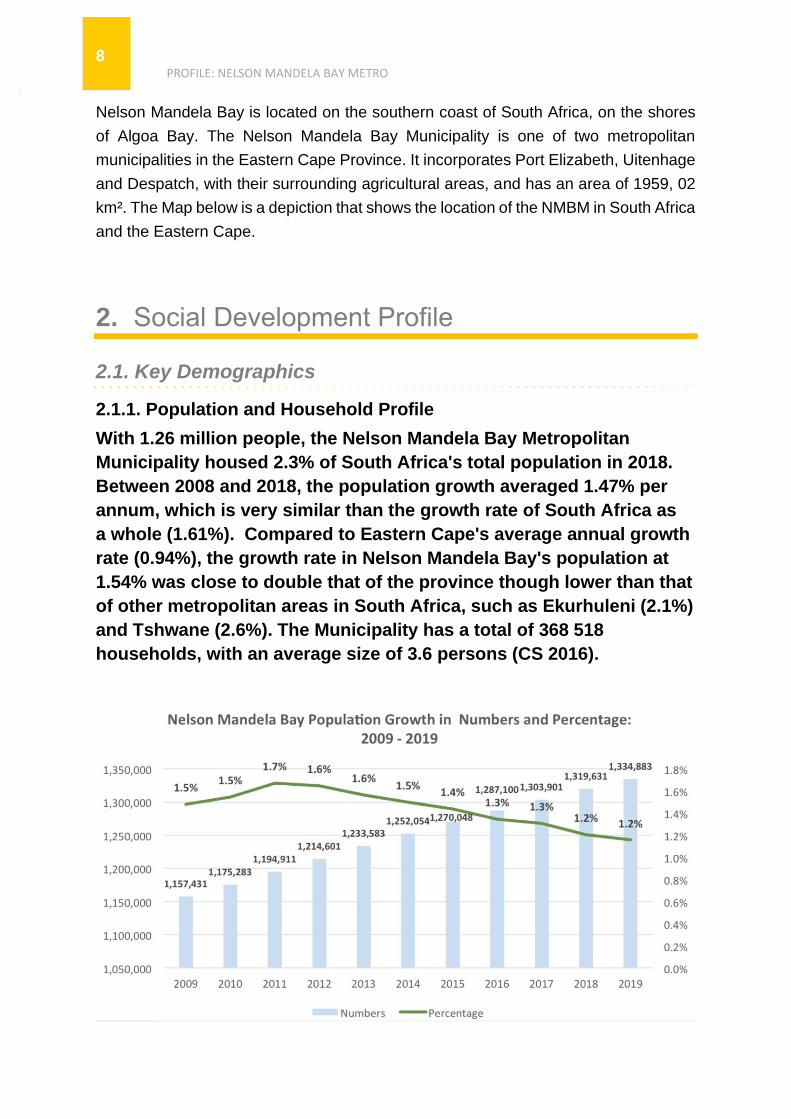
With 1.26 million people, the Nelson Mandela Bay Metropolitan
Municipality housed 2.3% of South Africa's total population in 2018.
Between 2008 and 2018, the population growth averaged 1.47% per
annum, which is very similar than the growth rate of South Africa as
a whole (1.61%). Compared to Eastern Cape's average annual growth
rate (0.94%), the growth rate in Nelson Mandela Bay's population at
1.54% was close to double that of the province though lower than that
of other metropolitan areas in South Africa, such as Ekurhuleni (2.1%)
and Tshwane (2.6%). The Municipality has a total of 368 518
households, with an average size of 3.6 persons (CS 2016).
PROFILE: NELSON MANDELA BAY METRO 9
PROFILE: NELSON MANDELA BAY METRO
10
During the 2018/19 financial year, 100% of qualifying households earning less than
R3 200 per month (two-state pensions) had access to free basic services offered by
the Municipality through its Assistance To The Poor Programme (ATTP). As of 30
June 2018, the value of the free basic services provided was R614 218 196, benefiting
101 645 qualifying households. Various types of service assistance were provided to
local households as follows: 89 721 (water); 90 175 (sanitation); 73 593 (electricity);
80 221 (refuse removal); and 76 392 (rebate on rates accounts).
There is currently, further to the qualifying mentioned above households, a backlog of
4 229 applications in the system. This backlog is attributed to the precise nature of the
verification processes. The Municipality continues to prioritise the processing of ATTP
applications. ATTP applications are reviewed in a three-year cycle. Figure 1 indicates
the proportion of registered indigent households in the municipal area over three
financial years (2015/16 – 2017/18).
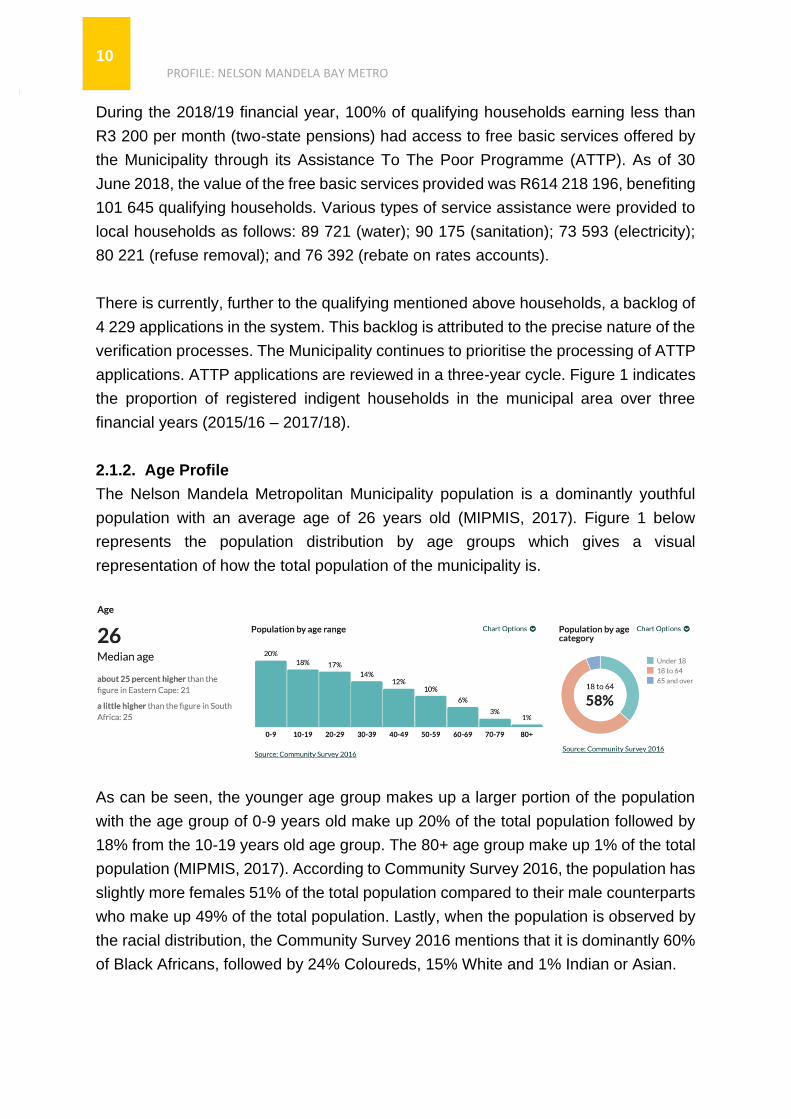
2.1.2. Age Profile
The Nelson Mandela Metropolitan Municipality population is a dominantly youthful
population with an average age of 26 years old (MIPMIS, 2017). Figure 1 below
represents the population distribution by age groups which gives a visual
representation of how the total population of the municipality is.
As can be seen, the younger age group makes up a larger portion of the population
with the age group of 0-9 years old make up 20% of the total population followed by
18% from the 10-19 years old age group. The 80+ age group make up 1% of the total
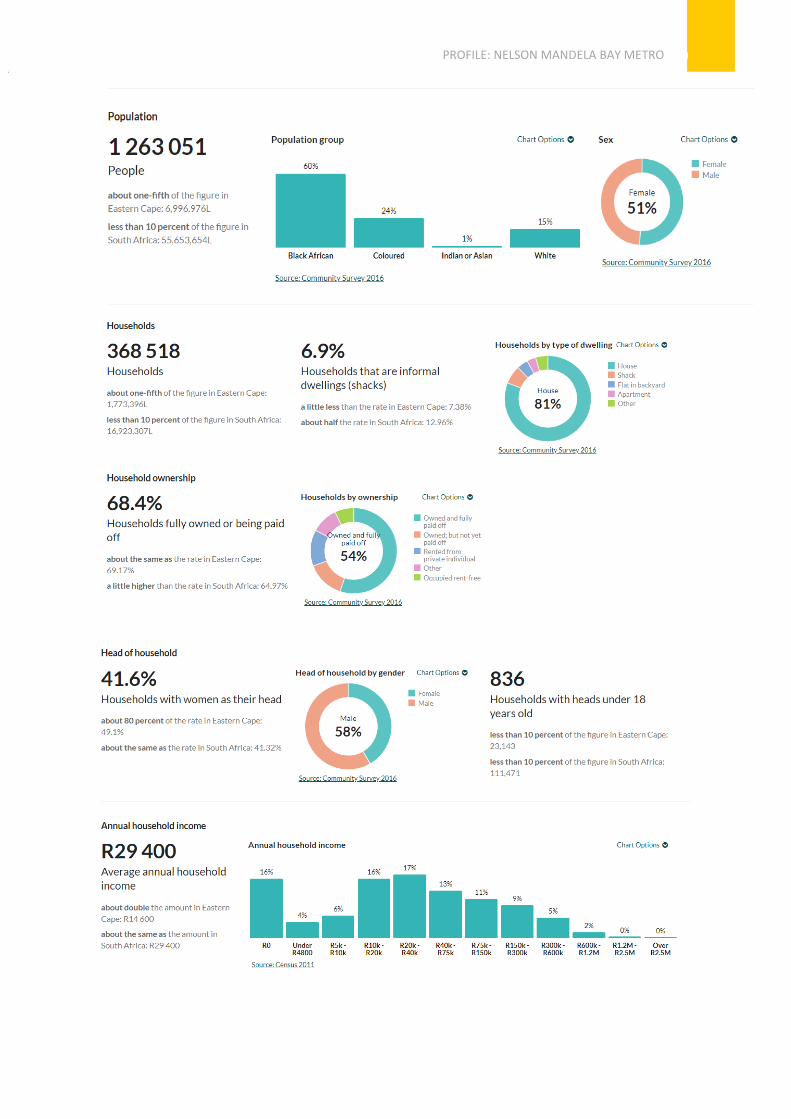
population (MIPMIS, 2017). According to Community Survey 2016, the population has
slightly more females 51% of the total population compared to their male counterparts
who make up 49% of the total population. Lastly, when the population is observed by
the racial distribution, the Community Survey 2016 mentions that it is dominantly 60%
of Black Africans, followed by 24% Coloureds, 15% White and 1% Indian or Asian.
PROFILE: NELSON MANDELA BAY METRO 11
Nelson Mandela Bay is characterized by a youthful population, with 26 years being
the median age. In all the periods under discussion, female domination is noticeable,
particularly in the age categories from 40 years upwards.
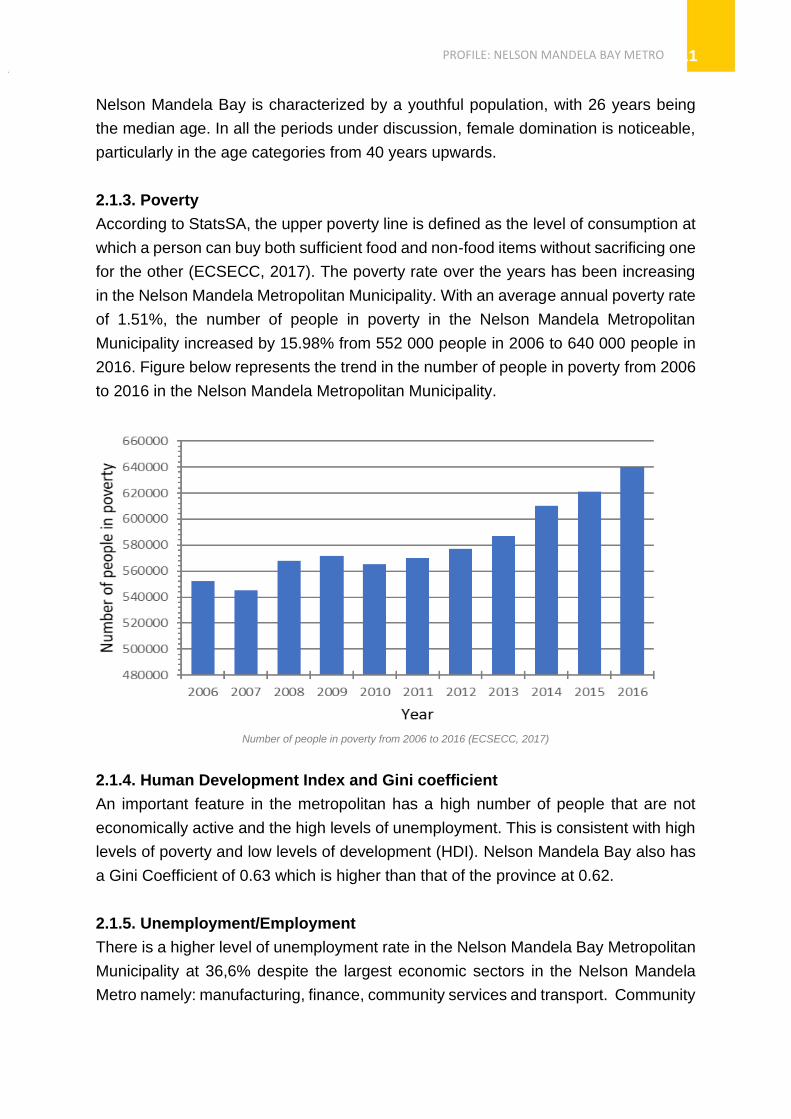
2.1.3. Poverty
According to StatsSA, the upper poverty line is defined as the level of consumption at
which a person can buy both sufficient food and non-food items without sacrificing one
for the other (ECSECC, 2017). The poverty rate over the years has been increasing
in the Nelson Mandela Metropolitan Municipality. With an average annual poverty rate
of 1.51%, the number of people in poverty in the Nelson Mandela Metropolitan
Municipality increased by 15.98% from 552 000 people in 2006 to 640 000 people in
2016. Figure below represents the trend in the number of people in poverty from 2006
to 2016 in the Nelson Mandela Metropolitan Municipality.
Number of people in poverty from 2006 to 2016 (ECSECC, 2017)
2.1.4. Human Development Index and Gini coefficient
An important feature in the metropolitan has a high number of people that are not
economically active and the high levels of unemployment. This is consistent with high
levels of poverty and low levels of development (HDI). Nelson Mandela Bay also has
a Gini Coefficient of 0.63 which is higher than that of the province at 0.62.
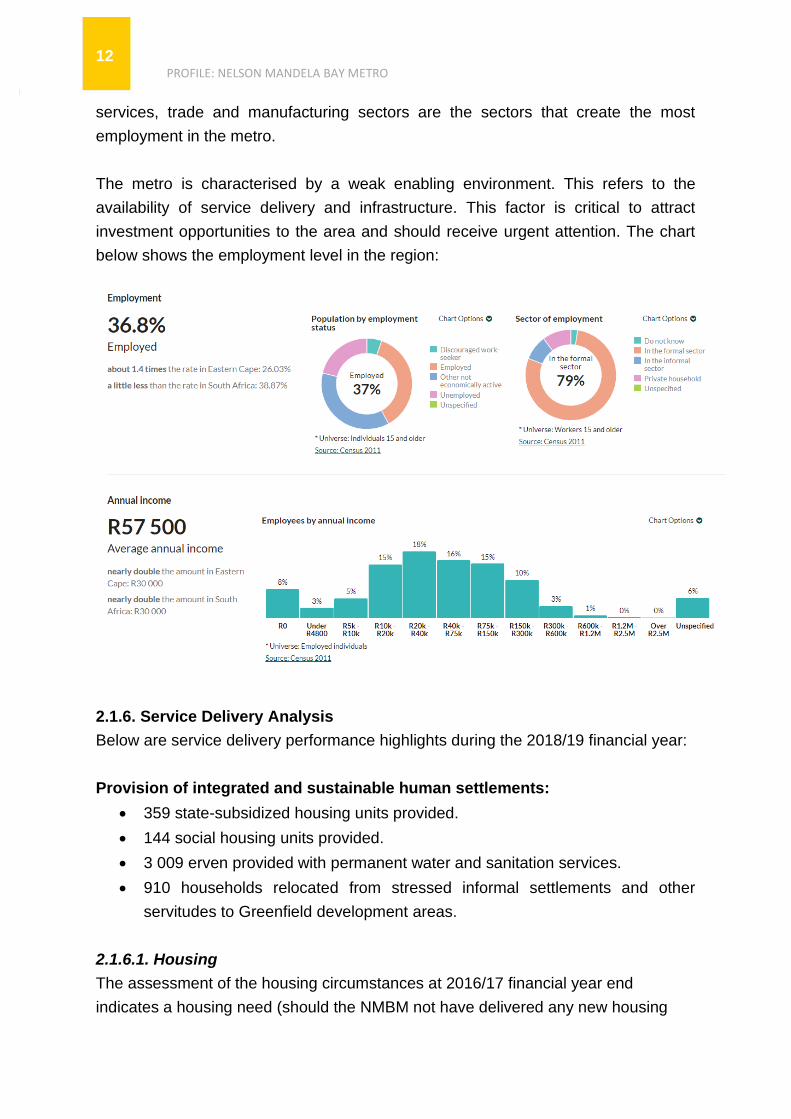
2.1.5. Unemployment/Employment
There is a higher level of unemployment rate in the Nelson Mandela Bay Metropolitan
Municipality at 36,6% despite the largest economic sectors in the Nelson Mandela
Metro namely: manufacturing, finance, community services and transport. Community
PROFILE: NELSON MANDELA BAY METRO
12
services, trade and manufacturing sectors are the sectors that create the most
employment in the metro.
The metro is characterised by a weak enabling environment. This refers to the
availability of service delivery and infrastructure. This factor is critical to attract
investment opportunities to the area and should receive urgent attention. The chart
below shows the employment level in the region:
2.1.6. Service Delivery Analysis
Below are service delivery performance highlights during the 2018/19 financial year:
Provision of integrated and sustainable human settlements:
• 359 state-subsidized housing units provided.
• 144 social housing units provided.
• 3 009 erven provided with permanent water and sanitation services.
• 910 households relocated from stressed informal settlements and other
servitudes to Greenfield development areas.
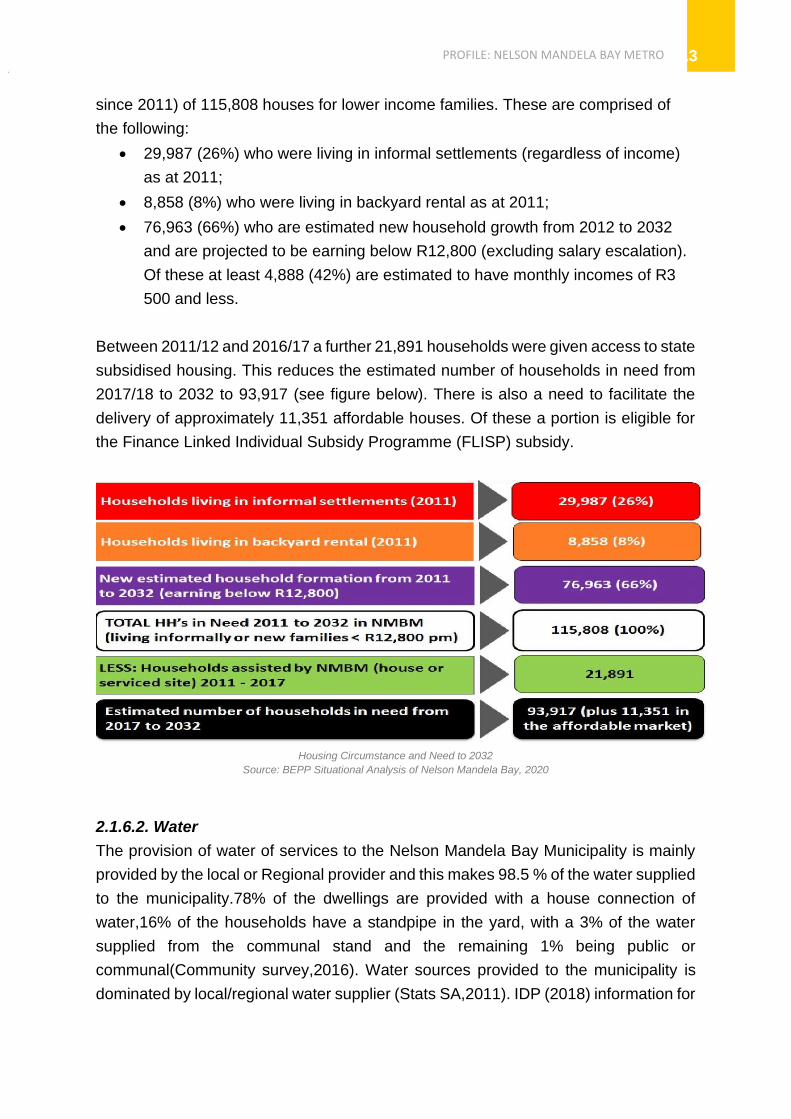
2.1.6.1. Housing
The assessment of the housing circumstances at 2016/17 financial year end
indicates a housing need (should the NMBM not have delivered any new housing
PROFILE: NELSON MANDELA BAY METRO 13
since 2011) of 115,808 houses for lower income families. These are comprised of
the following:
• 29,987 (26%) who were living in informal settlements (regardless of income)
as at 2011;
• 8,858 (8%) who were living in backyard rental as at 2011;
• 76,963 (66%) who are estimated new household growth from 2012 to 2032
and are projected to be earning below R12,800 (excluding salary escalation).
Of these at least 4,888 (42%) are estimated to have monthly incomes of R3
500 and less.
Between 2011/12 and 2016/17 a further 21,891 households were given access to state
subsidised housing. This reduces the estimated number of households in need from
2017/18 to 2032 to 93,917 (see figure below). There is also a need to facilitate the
delivery of approximately 11,351 affordable houses. Of these a portion is eligible for
the Finance Linked Individual Subsidy Programme (FLISP) subsidy.
Housing Circumstance and Need to 2032
Source: BEPP Situational Analysis of Nelson Mandela Bay, 2020
2.1.6.2. Water
The provision of water of services to the Nelson Mandela Bay Municipality is mainly
provided by the local or Regional provider and this makes 98.5 % of the water supplied
to the municipality.78% of the dwellings are provided with a house connection of
water,16% of the households have a standpipe in the yard, with a 3% of the water
supplied from the communal stand and the remaining 1% being public or
communal(Community survey,2016). Water sources provided to the municipality is
dominated by local/regional water supplier (Stats SA,2011). IDP (2018) information for
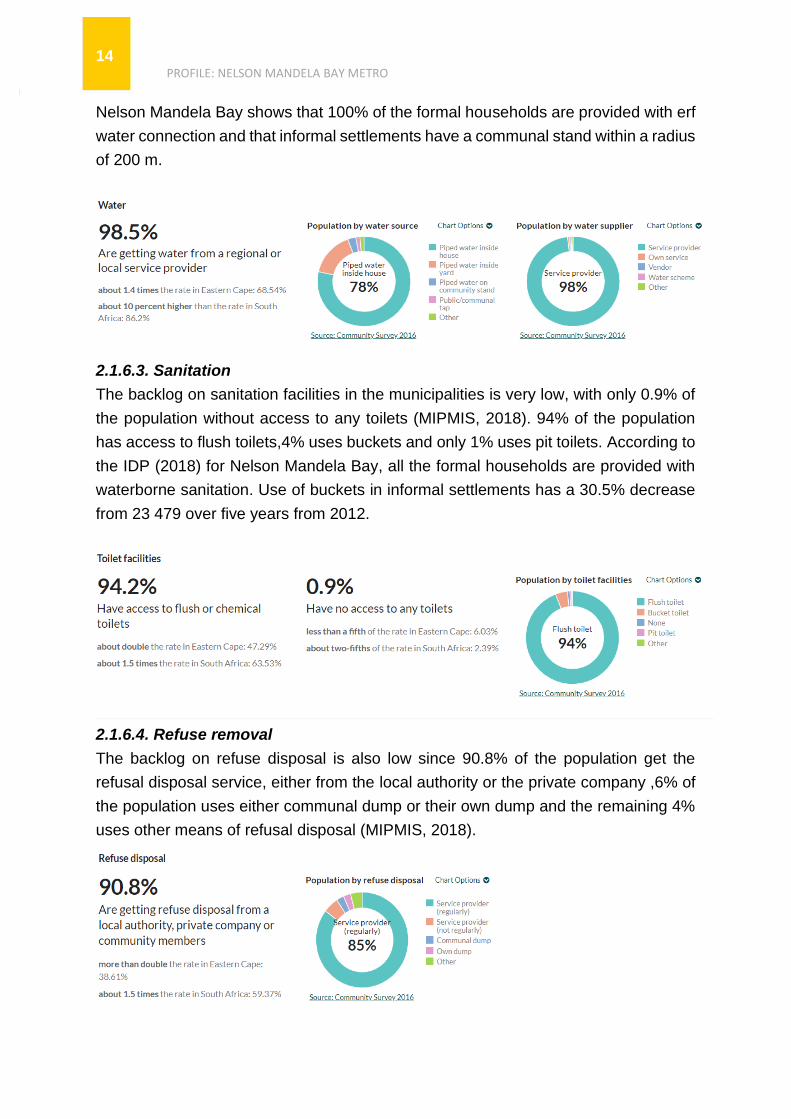
PROFILE: NELSON MANDELA BAY METRO
14
Nelson Mandela Bay shows that 100% of the formal households are provided with erf
water connection and that informal settlements have a communal stand within a radius
of 200 m.
2.1.6.3. Sanitation
The backlog on sanitation facilities in the municipalities is very low, with only 0.9% of
the population without access to any toilets (MIPMIS, 2018). 94% of the population
has access to flush toilets,4% uses buckets and only 1% uses pit toilets. According to
the IDP (2018) for Nelson Mandela Bay, all the formal households are provided with
waterborne sanitation. Use of buckets in informal settlements has a 30.5% decrease
from 23 479 over five years from 2012.
2.1.6.4. Refuse removal
The backlog on refuse disposal is also low since 90.8% of the population get the
refusal disposal service, either from the local authority or the private company ,6% of
the population uses either communal dump or their own dump and the remaining 4%
uses other means of refusal disposal (MIPMIS, 2018).
PROFILE: NELSON MANDELA BAY METRO 15
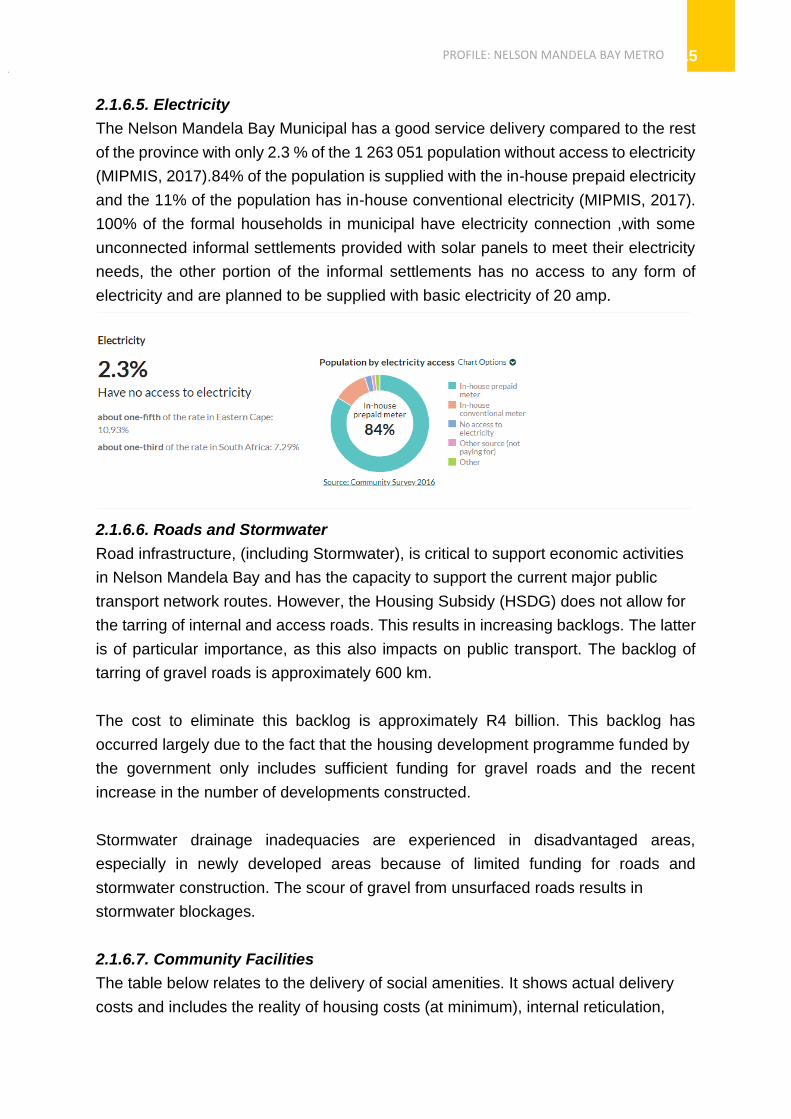
2.1.6.5. Electricity
The Nelson Mandela Bay Municipal has a good service delivery compared to the rest
of the province with only 2.3 % of the 1 263 051 population without access to electricity
(MIPMIS, 2017).84% of the population is supplied with the in-house prepaid electricity
and the 11% of the population has in-house conventional electricity (MIPMIS, 2017).
100% of the formal households in municipal have electricity connection ,with some
unconnected informal settlements provided with solar panels to meet their electricity
needs, the other portion of the informal settlements has no access to any form of
electricity and are planned to be supplied with basic electricity of 20 amp.
2.1.6.6. Roads and Stormwater
Road infrastructure, (including Stormwater), is critical to support economic activities
in Nelson Mandela Bay and has the capacity to support the current major public
transport network routes. However, the Housing Subsidy (HSDG) does not allow for
the tarring of internal and access roads. This results in increasing backlogs. The latter
is of particular importance, as this also impacts on public transport. The backlog of
tarring of gravel roads is approximately 600 km.
The cost to eliminate this backlog is approximately R4 billion. This backlog has
occurred largely due to the fact that the housing development programme funded by
the government only includes sufficient funding for gravel roads and the recent
increase in the number of developments constructed.
Stormwater drainage inadequacies are experienced in disadvantaged areas,
especially in newly developed areas because of limited funding for roads and
stormwater construction. The scour of gravel from unsurfaced roads results in
stormwater blockages.
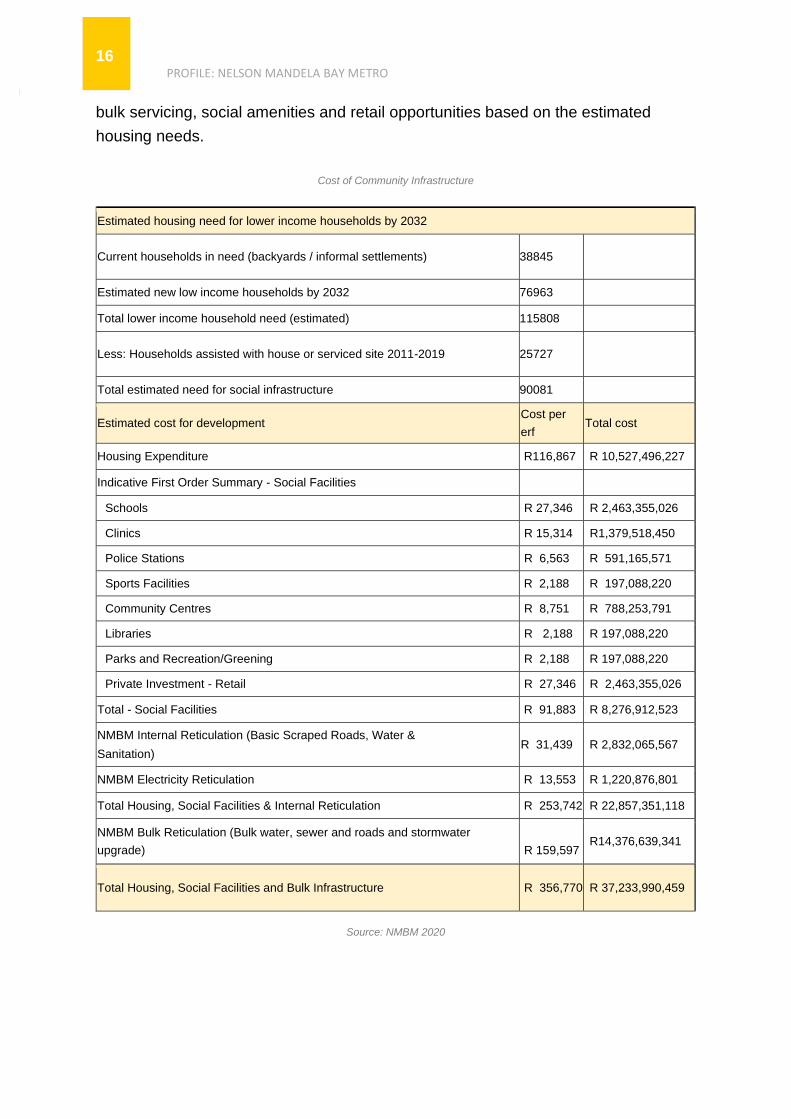
2.1.6.7. Community Facilities
The table below relates to the delivery of social amenities. It shows actual delivery
costs and includes the reality of housing costs (at minimum), internal reticulation,
PROFILE: NELSON MANDELA BAY METRO
16
bulk servicing, social amenities and retail opportunities based on the estimated
housing needs.
Cost of Community Infrastructure
Estimated housing need for lower income households by 2032
Current households in need (backyards / informal settlements) 38845
Estimated new low income households by 2032 76963
Total lower income household need (estimated) 115808
Less: Households assisted with house or serviced site 2011-2019 25727
Total estimated need for social infrastructure 90081
Estimated cost for development Cost per
erf Total cost
Housing Expenditure R116,867 R 10,527,496,227
Indicative First Order Summary - Social Facilities
Schools R 27,346 R 2,463,355,026
Clinics R 15,314 R1,379,518,450
Police Stations R 6,563 R 591,165,571
Sports Facilities R 2,188 R 197,088,220
Community Centres R 8,751 R 788,253,791
Libraries R 2,188 R 197,088,220
Parks and Recreation/Greening R 2,188 R 197,088,220
Private Investment - Retail R 27,346 R 2,463,355,026
Total - Social Facilities R 91,883 R 8,276,912,523
NMBM Internal Reticulation (Basic Scraped Roads, Water &
Sanitation) R 31,439 R 2,832,065,567
NMBM Electricity Reticulation R 13,553 R 1,220,876,801
Total Housing, Social Facilities & Internal Reticulation R 253,742 R 22,857,351,118
NMBM Bulk Reticulation (Bulk water, sewer and roads and stormwater
upgrade)
R 159,597 R14,376,639,341
Total Housing, Social Facilities and Bulk Infrastructure R 356,770 R 37,233,990,459
Source: NMBM 2020
PROFILE: NELSON MANDELA BAY METRO 17
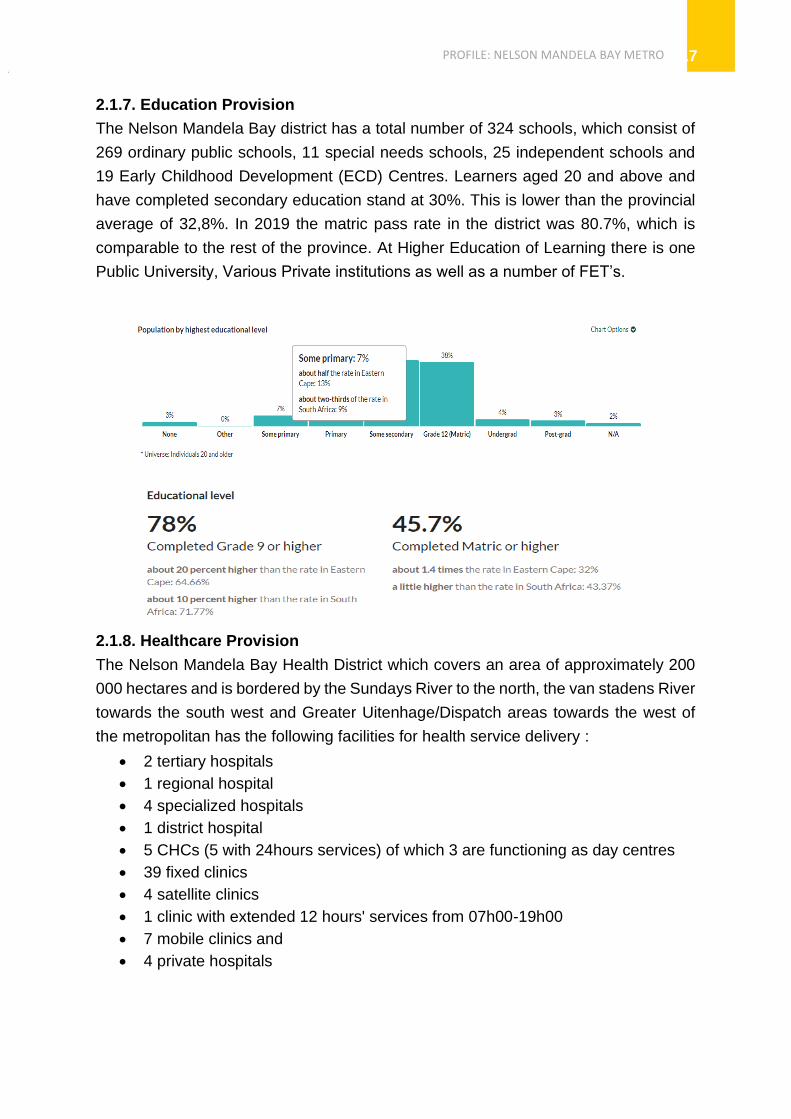
2.1.7. Education Provision
The Nelson Mandela Bay district has a total number of 324 schools, which consist of
269 ordinary public schools, 11 special needs schools, 25 independent schools and
19 Early Childhood Development (ECD) Centres. Learners aged 20 and above and
have completed secondary education stand at 30%. This is lower than the provincial
average of 32,8%. In 2019 the matric pass rate in the district was 80.7%, which is
comparable to the rest of the province. At Higher Education of Learning there is one
Public University, Various Private institutions as well as a number of FET’s.
2.1.8. Healthcare Provision
The Nelson Mandela Bay Health District which covers an area of approximately 200
000 hectares and is bordered by the Sundays River to the north, the van stadens River
towards the south west and Greater Uitenhage/Dispatch areas towards the west of
the metropolitan has the following facilities for health service delivery :
• 2 tertiary hospitals
• 1 regional hospital
• 4 specialized hospitals
• 1 district hospital
• 5 CHCs (5 with 24hours services) of which 3 are functioning as day centres
• 39 fixed clinics
• 4 satellite clinics
• 1 clinic with extended 12 hours' services from 07h00-19h00
• 7 mobile clinics and
• 4 private hospitals

PROFILE: NELSON MANDELA BAY METRO
18
2.1.9. Covid-19
In light of the Covid-19 pandemic, the Nelson Mandela Bay Stadium has been
identified as one of the sites that can be utilised to accommodate people who might
need to be isolated. The 35 000 seater venue for international rugby and football
games has about 140 private suites, a doctor's room and several rooms for
physiotherapy.
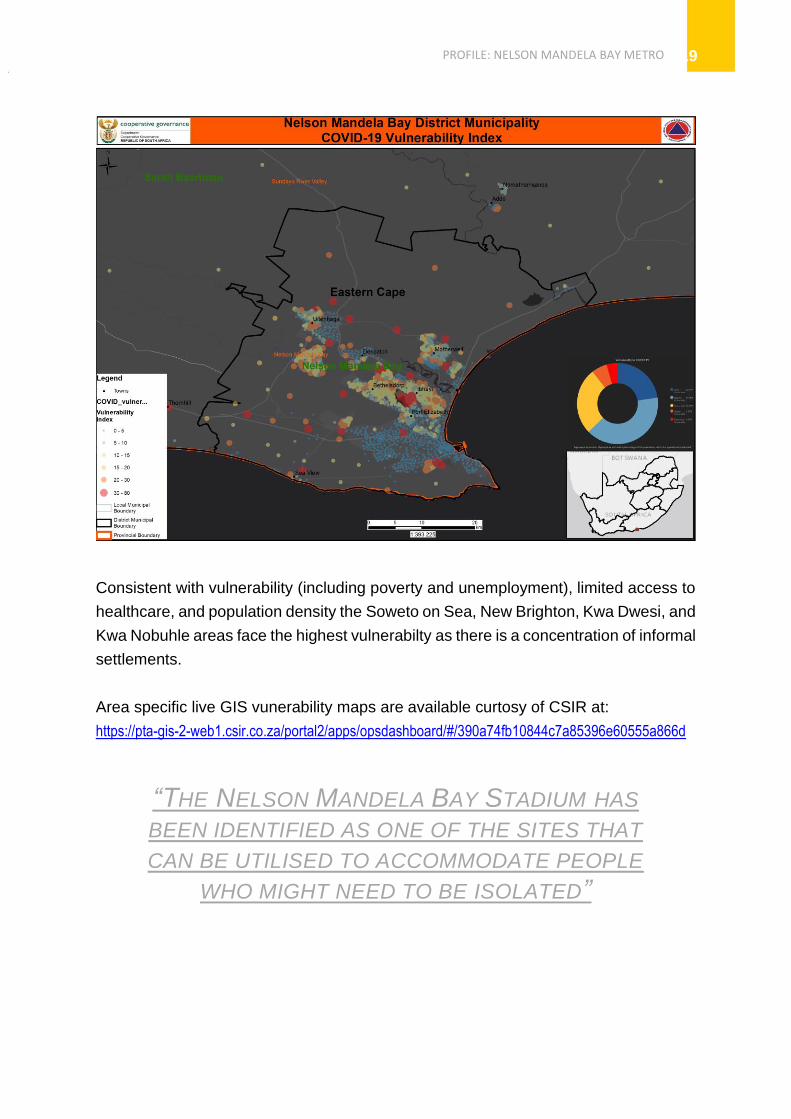
Covid-19 Eastern Cape Statistics
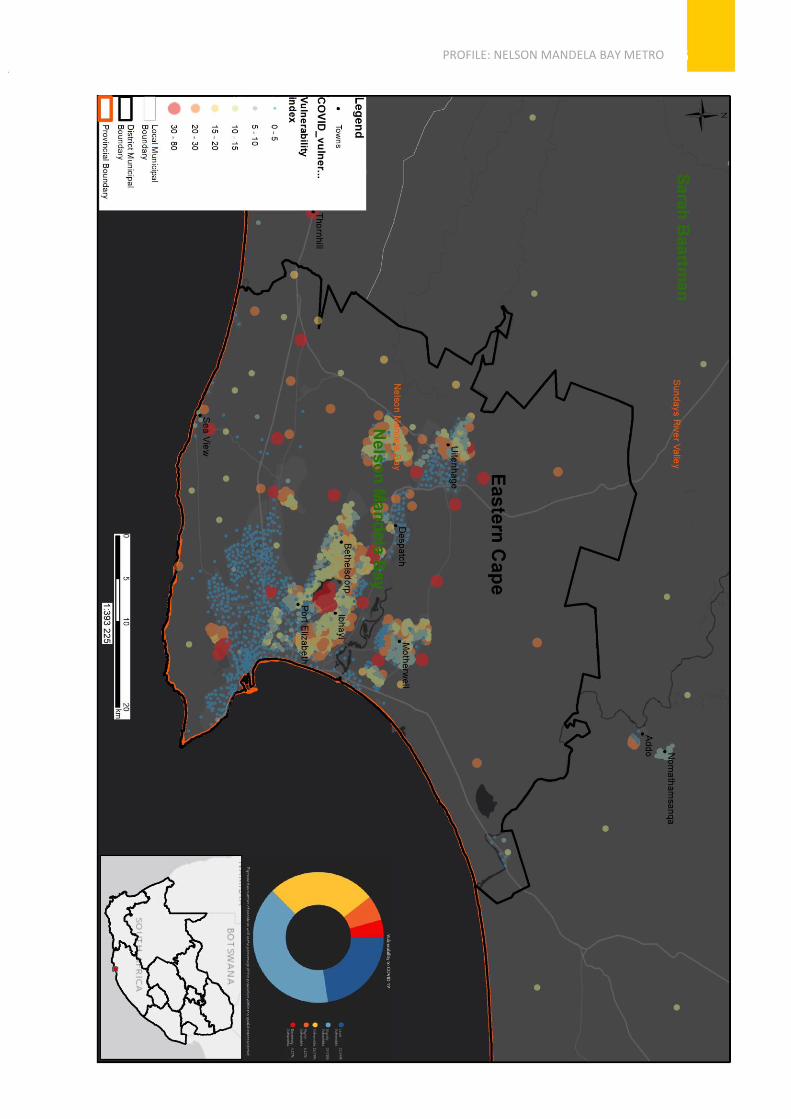
The Council for Scientific and Industrial Research (CSIR) in collaboration with Albert
Luthuli Centre for Responsible leadership have developed a set of COVID-19
Vulnerability Indicators using available data and knowledge. It identifies vulnerabilities
present in communities and identifying areas in need of targeted coordinated
interventions and early response. The purpose of the indicators is intended to support
the early prevention/mitigation and preparedness phase of the disaster management
cycle and informing disaster management decision making. It is not based on
epidemiological modelling but a response to highlighting intervention areas due to
underlying situation. The composition of the index follows two main factors, namely:
transmission potential and health susceptibility.
Transmission potential areas identify areas that prevent social distancing to be
practiced and where limitations of practicing good basic hygiene. The health
susceptibility index denotes areas where large number of people are potential more
susceptible to being adversely affected by COVID-10 due to factors such as age and
underlying health conditions. The Johannesburg vulnerability profile is presented
below. The map shows low vulnerability areas (blue dotted areas) versus areas with
higher vulnerability (red dotted areas)
PROFILE: NELSON MANDELA BAY METRO 19
Consistent with vulnerability (including poverty and unemployment), limited access to
healthcare, and population density the Soweto on Sea, New Brighton, Kwa Dwesi, and
Kwa Nobuhle areas face the highest vulnerabilty as there is a concentration of informal
settlements.
Area specific live GIS vunerability maps are available curtosy of CSIR at:
https://pta-gis-2-web1.csir.co.za/portal2/apps/opsdashboard/#/390a74fb10844c7a85396e60555a866d
“THE NELSON MANDELA BAY STADIUM HAS BEEN IDENTIFIED AS ONE OF THE SITES THAT CAN BE UTILISED TO ACCOMMODATE PEOPLE
WHO MIGHT NEED TO BE ISOLATED”
PROFILE: NELSON MANDELA BAY METRO
20
2.1.10. Crime Levels
PROFILE: NELSON MANDELA BAY METRO 21
In the Nelson Mandela Metropolitan Municipality has 16 police station according to the
Crime Statistics Series Volume 4 2015-2016 (Stats SA, 2017). These police stations
must deal with crime which occurs in the metropolitan municipality. Crime has a variety
of categories of the type of crime that can be committed. In this section, focus will be
on a select few. Some examples of general types of crimes taking place in the Nelson
Mandela Metropolitan Municipality are murder, assault, robbery and burglaries.
Crime statistics have limitations in what they produce so there are
discrepancies/inaccuracies with the data they provide. From the 2016 South African
Cities Report titled “State of Urban Safety in South Africa”, the following are some of
the crime rate statistics which they gathered for the Nelson Mandela Bay Metropolitan
Municipality (IDP, 2017):
• Murder rate decreased from approximately 60 murders to 48 murders per
100 000 between 2005 and 2015;
• Assault with intent to inflict grievous bodily harm decreased from 650 to 420 per
100 000 between 2005 and 2015;
• Robberies at residential premises increased from approximately 10 to 50 per
100 000 between 2005 and 2015. This is similar with the trend of robberies at
non-residential premises;
• Residential burglaries decreased from approximately 915 to 600 per 100 000
between 2005 and 2015.
• Furthermore, from the Eastern Cape Community Survey 2016, following was
gathered (Stats SA, 2018); and
• 27 726 households experienced some type of crime in the last 12 months while
339 690 households did not experience any crime in the same time frame.
In comparing the crime rates to the province, other metropolitan municipalities and/or
nation, the following was observed:
• The murder rate of the Nelson Mandela Metropolitan Municipality recorded the
highest murder rate alongside Buffalo City of all South African Metropolitan
Municipalities, but these cities have shown the greatest decrease over the 10-
year period as well.
• The assault with intent to inflict grievous bodily harm showed similar trends with
most of the other metropolitan municipalities and the national average.
• Robberies at residential and non-residential premises experienced consistent
trends with other metro and national trends.

PROFILE: NELSON MANDELA BAY METRO
22
• The residential burglaries in the Nelson Mandela Metropolitan Municipalities
was the highest in 2015 and went to be the fifth highest in 2015 of all the
metropolitan municipalities in the country.
• Households in Nelson Mandela Metropolitan Municipality who experienced
some type of crime contributed to 25.4% of the province while households in
Nelson Mandela Metropolitan Municipality who did not experience some type
of crime contributed to 20.6% of the province in the period of between 2015 and
2016
“THE NELSON MANDELA METROPOLITAN
MUNICIPALITY RECORDED THE HIGHEST MURDER
RATE ALONGSIDE BUFFALO CITY OF ALL SOUTH
AFRICAN METROPOLITAN MUNICIPALITIES”
3. Environmental Features
Nelson Mandela Bay is an excellent value-for-money-family-fun-in-the-
sun-holiday destination, named after Nelson Mandela - humanitarian,
freedom fighter and world icon of peace - is located 763 km east of
Cape Town, is regarded as the "official" gateway to the scenic
Eastern Cape Province and the world renowned Garden Route and is
sometimes referred to (by the people who know her best) as the
"friendly city" or the "water sport capital of Africa". Nelson Mandela
Bay is also recognised as both the Mohair and Bottlenose Dolphin
Capital of the World and is home to the largest breeding colony of the
African Penguin.
The only city that boasts the Big 7 (Elephant, Buffalo, Rhino, Lion, Leopard, Southern
right whale and Great White Shark) within its municipal boundaries, Port Elizabeth
(The Friendly City) is known for its over 40Km coast that boast a multitude of Blue Flag
Beaches and hours of sunshine to enjoy them in. Port Elizabeth is also known as both
the Mohair and Bottlenose Dolphin Capital of the World and the 5 Biome City.
PROFILE: NELSON MANDELA BAY METRO 23
Situated on the shores of the Indian Ocean, overlooking Algoa Bay, this bustling
seaport city flaunts an atmosphere of relaxed year-round fun and excitement. Warm,
dry Summers and mild Winter temperatures entice water sport lovers to Algoa Bay
throughout the year. The breath-taking seashore boasts a perfect combination of
warm water, protected beaches and invigorating sea breezes. Here you will find some
of the world's best sailing venues, first-rate scuba diving with colourful coral species,
beautiful reefs and shipwrecks, near perfect conditions for wind-surfing, angling,
snorkelling, kite-surfing, fly-fishing and canoeing.
Another draw-card to the metro is the charming architectural profile which follows a
chronological historical pattern throughout the city - starting with Victorian styles,
followed by art nouveau, art deco and modern buildings. The biggest number of art
deco buildings in South Africa is to be found in the city centre of Port Elizabeth.
In Uitenhage you can still find buildings from the 1800s in their original form. The Old
Drostdy Museum built in 1809 is now the home of the Uitenhage Africana Museum. It
is the ideal setting through which to experience the history of Uitenhage. The Old
Railway Station built in 1875 which is reputed as one of the oldest railway stations in
South Africa is another historical attraction found in Uitenhage. Vintage locomotives,
a variety of coaches, period furniture and equipment are on display in this museum.
In addition, the city and environs offer a wide selection of attractions; the sheer
diversity of which will excite and delight one. These include a rich historical heritage
as well as nature-based eco-offerings, activities and experiences. The area supports
the most diverse array of vegetation types in South Africa; six of the country's seven
terrestrial biomes (bio geographic areas) are represented in the Eastern Cape.
PROFILE: NELSON MANDELA BAY METRO
24
4. Economic Drivers
4.1 Economic Overview
The Gross Domestic Product (GDP), an important indicator of
economic performance, is used to compare economies and economic
states. Definition: Gross Domestic Product by Region (GDP-R)
represents the value of all goods and services produced within a
region, over a period of one year, plus taxes and minus subsidies.
The GDP-R can be measured using either current or constant prices,
where the current prices measures the economy in actual Rand, and
constant prices measures the economy by removing the effect of
inflation, and therefore captures the real growth in volumes, as if
prices were fixed in each base year.
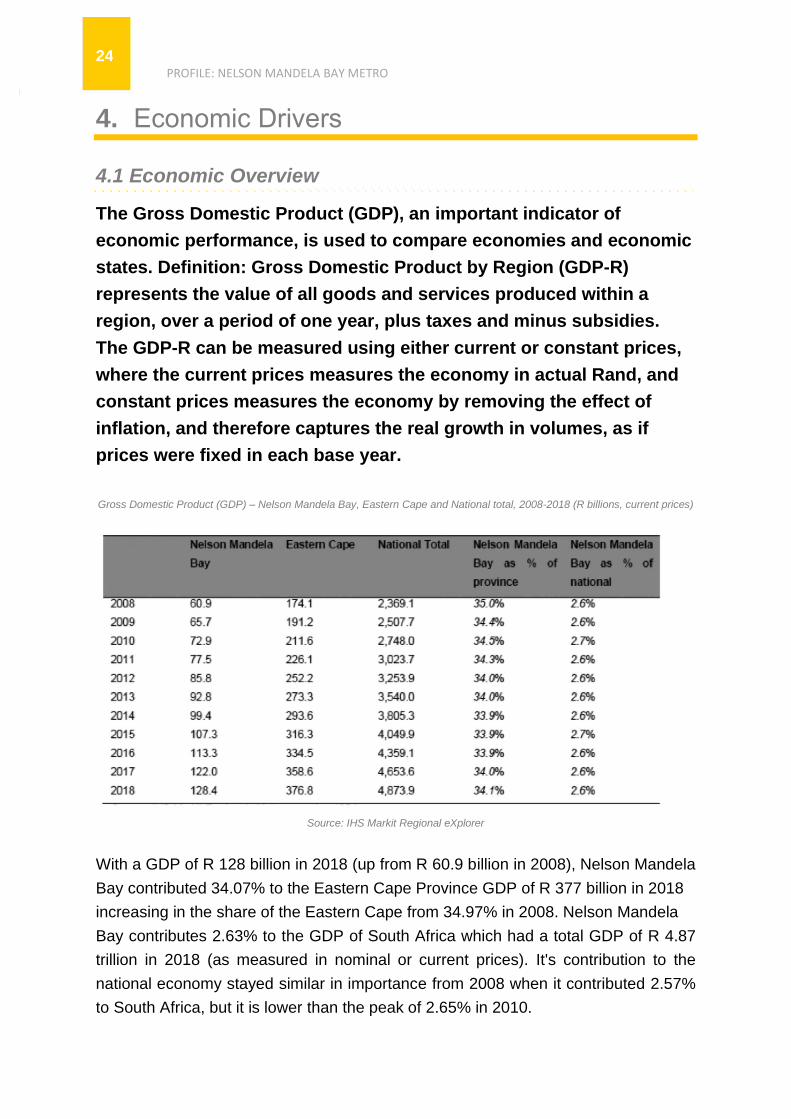
Gross Domestic Product (GDP) – Nelson Mandela Bay, Eastern Cape and National total, 2008-2018 (R billions, current prices)
Source: IHS Markit Regional eXplorer
With a GDP of R 128 billion in 2018 (up from R 60.9 billion in 2008), Nelson Mandela
Bay contributed 34.07% to the Eastern Cape Province GDP of R 377 billion in 2018
increasing in the share of the Eastern Cape from 34.97% in 2008. Nelson Mandela
Bay contributes 2.63% to the GDP of South Africa which had a total GDP of R 4.87
trillion in 2018 (as measured in nominal or current prices). It's contribution to the
national economy stayed similar in importance from 2008 when it contributed 2.57%
to South Africa, but it is lower than the peak of 2.65% in 2010.
PROFILE: NELSON MANDELA BAY METRO 25
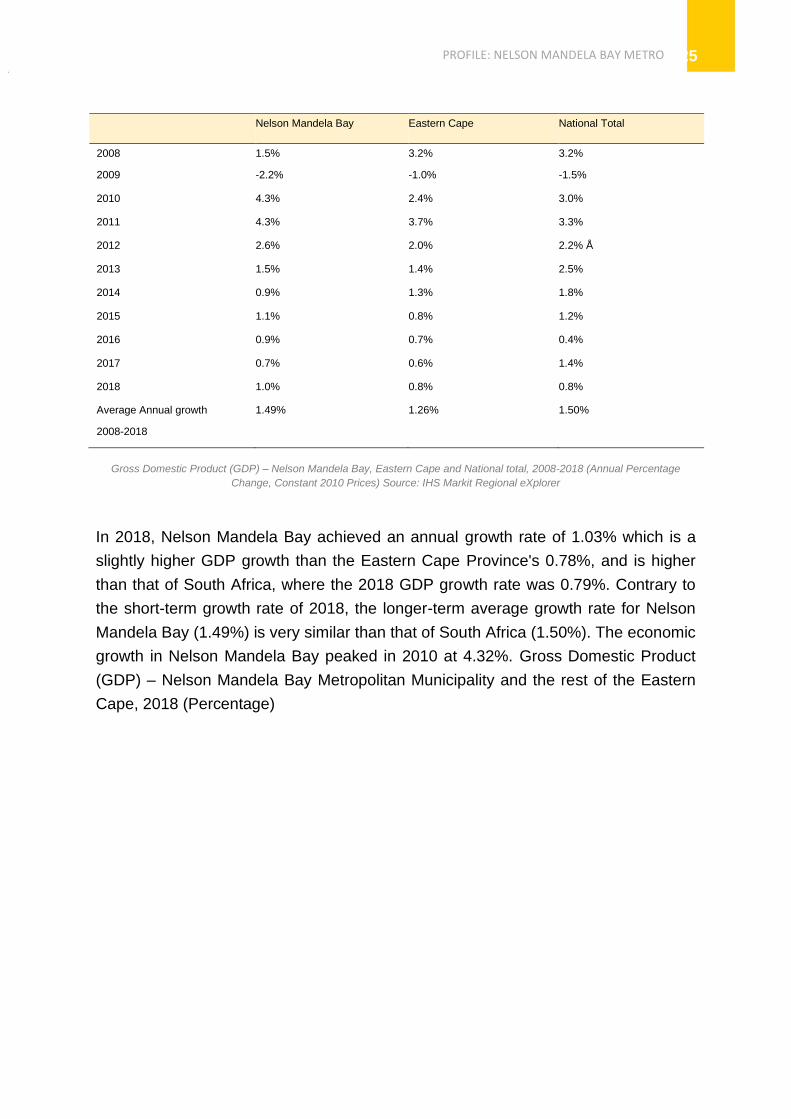
Nelson Mandela Bay Eastern Cape National Total
2008 1.5% 3.2% 3.2%
2009 -2.2% -1.0% -1.5%
2010 4.3% 2.4% 3.0%
2011 4.3% 3.7% 3.3%
2012 2.6% 2.0% 2.2% Å
2013 1.5% 1.4% 2.5%
2014 0.9% 1.3% 1.8%
2015 1.1% 0.8% 1.2%
2016 0.9% 0.7% 0.4%
2017 0.7% 0.6% 1.4%
2018 1.0% 0.8% 0.8%
Average Annual growth
2008-2018
1.49% 1.26% 1.50%
Gross Domestic Product (GDP) – Nelson Mandela Bay, Eastern Cape and National total, 2008-2018 (Annual Percentage
Change, Constant 2010 Prices) Source: IHS Markit Regional eXplorer
In 2018, Nelson Mandela Bay achieved an annual growth rate of 1.03% which is a
slightly higher GDP growth than the Eastern Cape Province's 0.78%, and is higher
than that of South Africa, where the 2018 GDP growth rate was 0.79%. Contrary to
the short-term growth rate of 2018, the longer-term average growth rate for Nelson
Mandela Bay (1.49%) is very similar than that of South Africa (1.50%). The economic
growth in Nelson Mandela Bay peaked in 2010 at 4.32%. Gross Domestic Product
(GDP) – Nelson Mandela Bay Metropolitan Municipality and the rest of the Eastern
Cape, 2018 (Percentage)
PROFILE: NELSON MANDELA BAY METRO
26
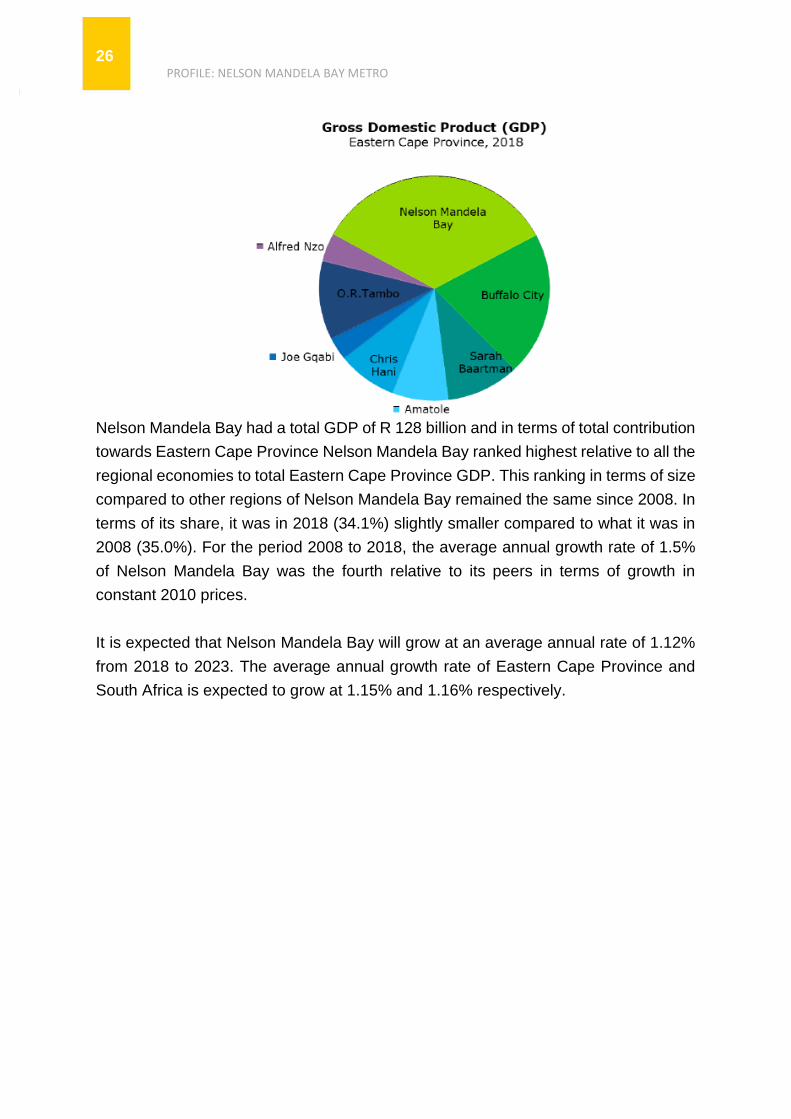
Nelson Mandela Bay had a total GDP of R 128 billion and in terms of total contribution
towards Eastern Cape Province Nelson Mandela Bay ranked highest relative to all the
regional economies to total Eastern Cape Province GDP. This ranking in terms of size
compared to other regions of Nelson Mandela Bay remained the same since 2008. In
terms of its share, it was in 2018 (34.1%) slightly smaller compared to what it was in
2008 (35.0%). For the period 2008 to 2018, the average annual growth rate of 1.5%
of Nelson Mandela Bay was the fourth relative to its peers in terms of growth in
constant 2010 prices.
It is expected that Nelson Mandela Bay will grow at an average annual rate of 1.12%
from 2018 to 2023. The average annual growth rate of Eastern Cape Province and
South Africa is expected to grow at 1.15% and 1.16% respectively.
PROFILE: NELSON MANDELA BAY METRO 27
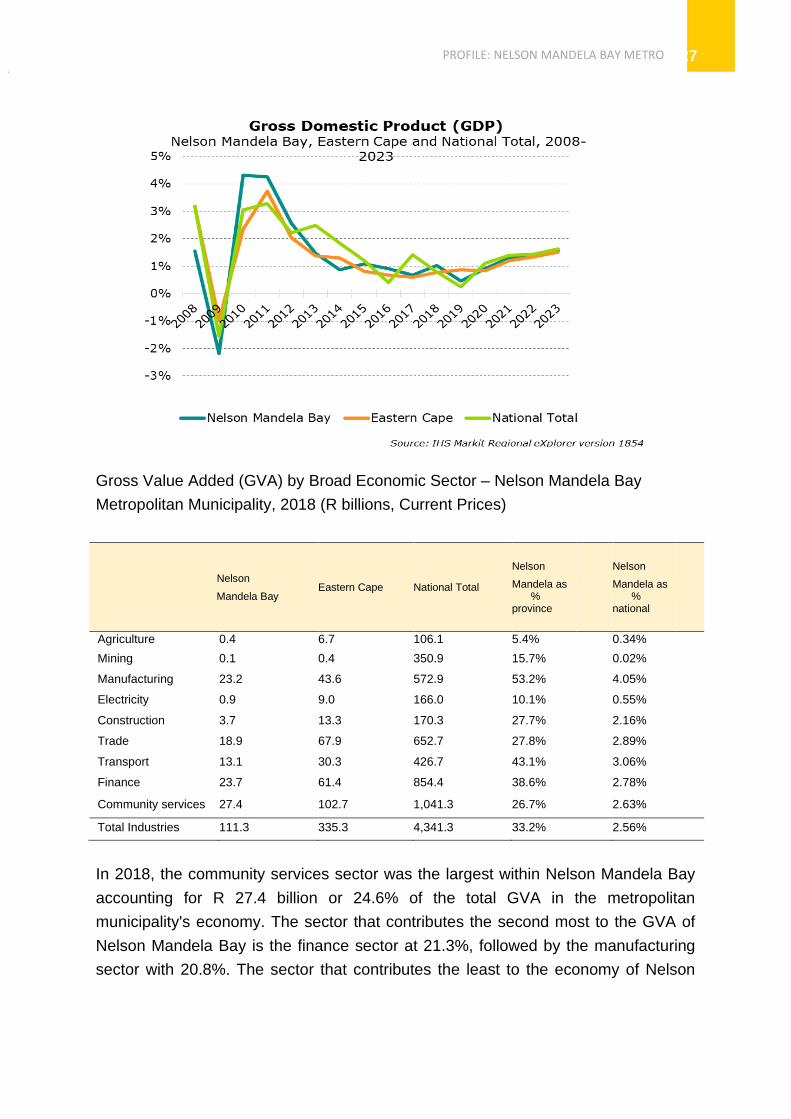
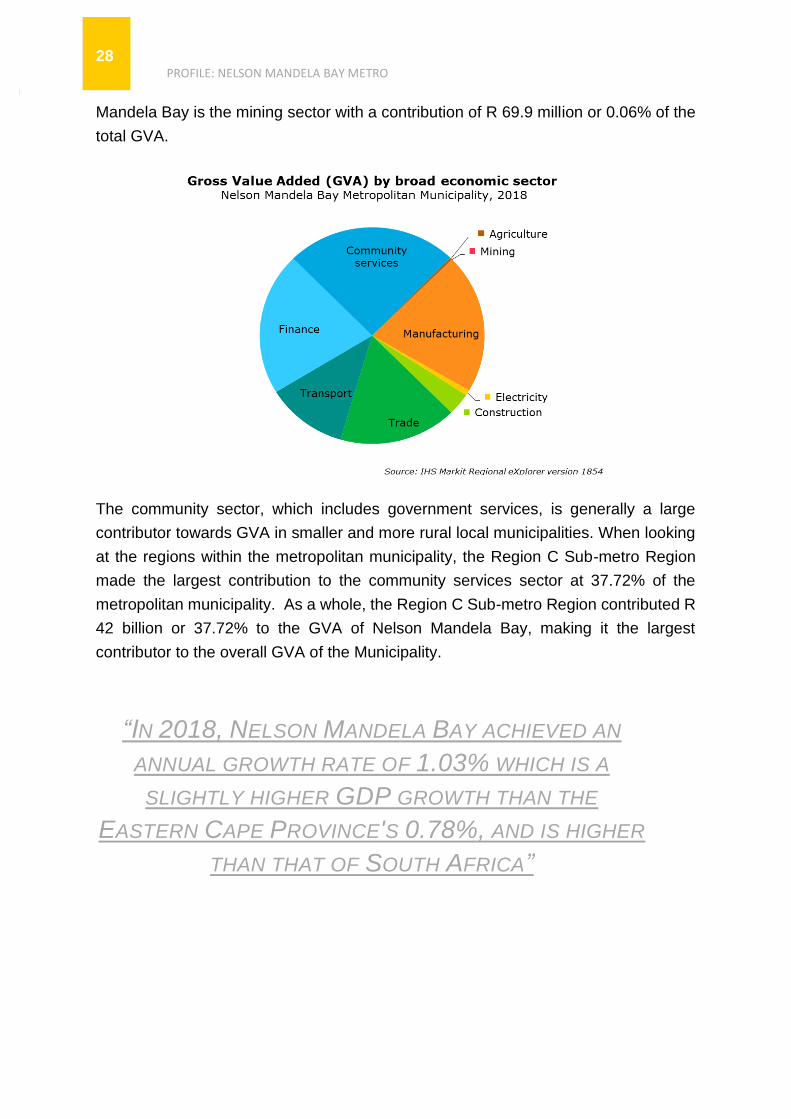
Gross Value Added (GVA) by Broad Economic Sector – Nelson Mandela Bay
Metropolitan Municipality, 2018 (R billions, Current Prices)
Nelson
Mandela Bay Eastern Cape National Total
Nelson
Mandela as % province
Nelson
Mandela as % national
Agriculture 0.4 6.7 106.1 5.4% 0.34%
Mining 0.1 0.4 350.9 15.7% 0.02%
Manufacturing 23.2 43.6 572.9 53.2% 4.05%
Electricity 0.9 9.0 166.0 10.1% 0.55%
Construction 3.7 13.3 170.3 27.7% 2.16%
Trade 18.9 67.9 652.7 27.8% 2.89%
Transport 13.1 30.3 426.7 43.1% 3.06%
Finance 23.7 61.4 854.4 38.6% 2.78%
Community services 27.4 102.7 1,041.3 26.7% 2.63%
Total Industries 111.3 335.3 4,341.3 33.2% 2.56%
In 2018, the community services sector was the largest within Nelson Mandela Bay
accounting for R 27.4 billion or 24.6% of the total GVA in the metropolitan
municipality's economy. The sector that contributes the second most to the GVA of
Nelson Mandela Bay is the finance sector at 21.3%, followed by the manufacturing
sector with 20.8%. The sector that contributes the least to the economy of Nelson
PROFILE: NELSON MANDELA BAY METRO
28
Mandela Bay is the mining sector with a contribution of R 69.9 million or 0.06% of the
total GVA.
The community sector, which includes government services, is generally a large
contributor towards GVA in smaller and more rural local municipalities. When looking
at the regions within the metropolitan municipality, the Region C Sub-metro Region
made the largest contribution to the community services sector at 37.72% of the
metropolitan municipality. As a whole, the Region C Sub-metro Region contributed R
42 billion or 37.72% to the GVA of Nelson Mandela Bay, making it the largest
contributor to the overall GVA of the Municipality.
“IN 2018, NELSON MANDELA BAY ACHIEVED AN
ANNUAL GROWTH RATE OF 1.03% WHICH IS A
SLIGHTLY HIGHER GDP GROWTH THAN THE
EASTERN CAPE PROVINCE'S 0.78%, AND IS HIGHER
THAN THAT OF SOUTH AFRICA”
PROFILE: NELSON MANDELA BAY METRO 29
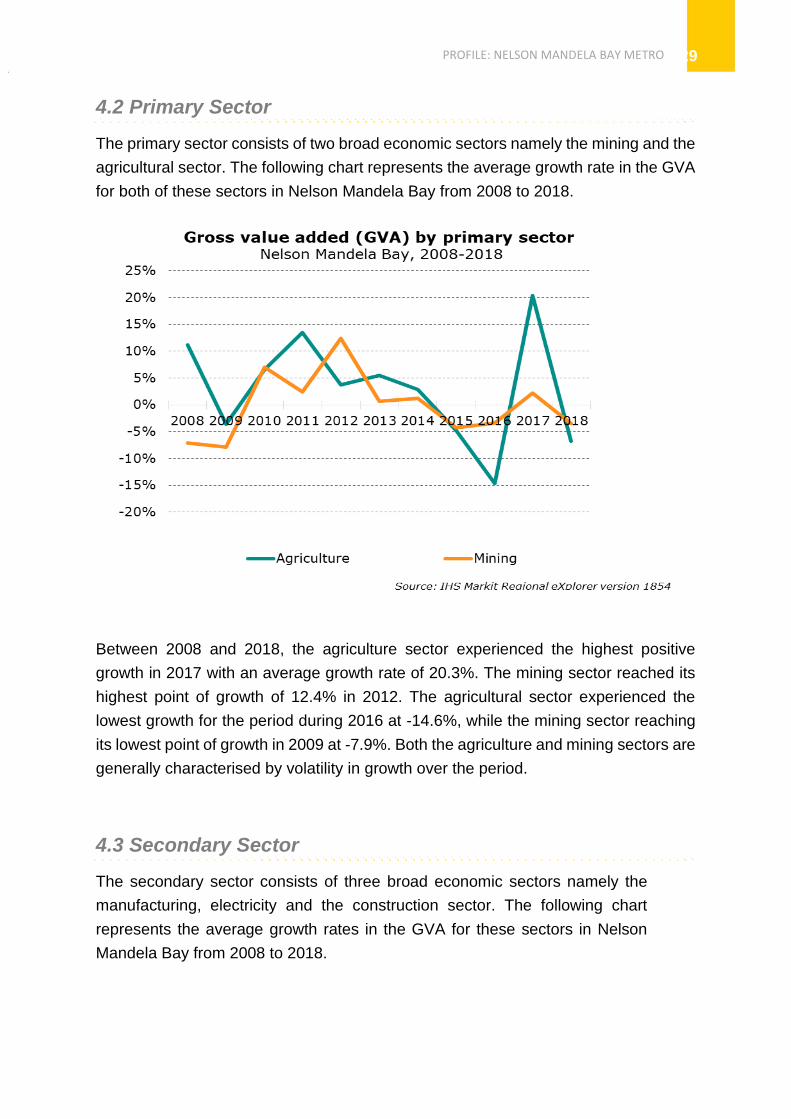
4.2 Primary Sector
The primary sector consists of two broad economic sectors namely the mining and the
agricultural sector. The following chart represents the average growth rate in the GVA
for both of these sectors in Nelson Mandela Bay from 2008 to 2018.
Between 2008 and 2018, the agriculture sector experienced the highest positive
growth in 2017 with an average growth rate of 20.3%. The mining sector reached its
highest point of growth of 12.4% in 2012. The agricultural sector experienced the
lowest growth for the period during 2016 at -14.6%, while the mining sector reaching
its lowest point of growth in 2009 at -7.9%. Both the agriculture and mining sectors are
generally characterised by volatility in growth over the period.
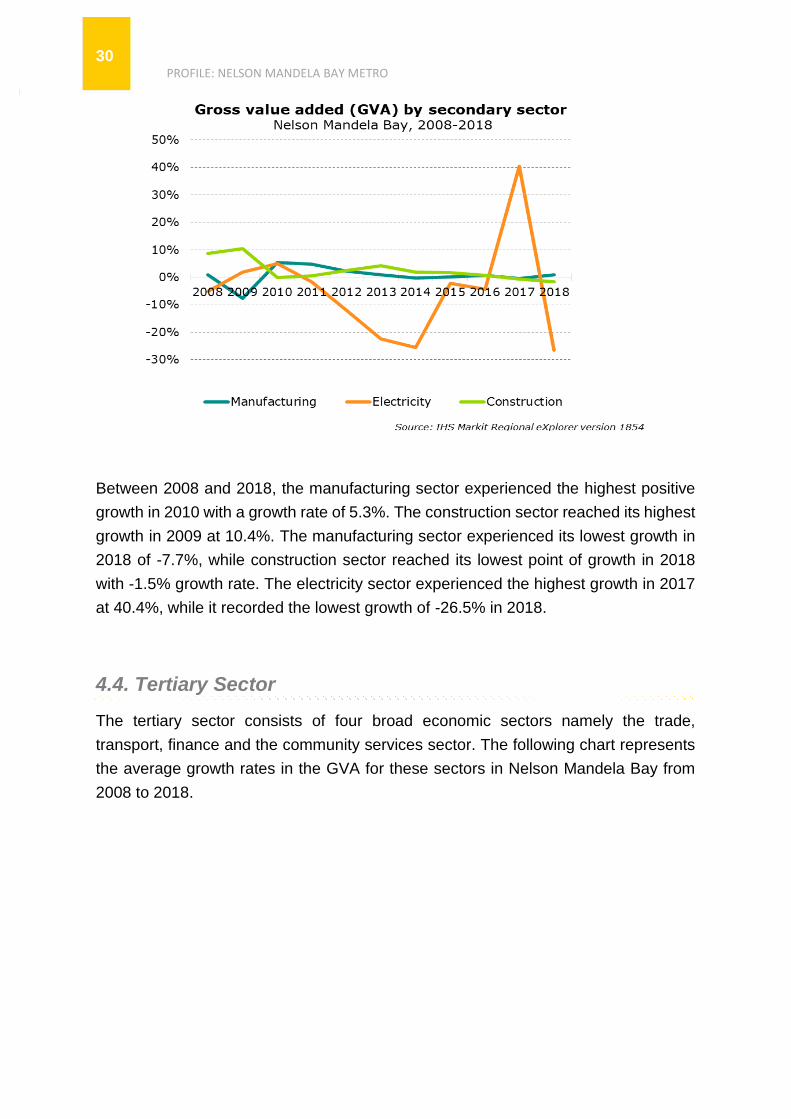
4.3 Secondary Sector
The secondary sector consists of three broad economic sectors namely the
manufacturing, electricity and the construction sector. The following chart
represents the average growth rates in the GVA for these sectors in Nelson
Mandela Bay from 2008 to 2018.
PROFILE: NELSON MANDELA BAY METRO
30
Between 2008 and 2018, the manufacturing sector experienced the highest positive
growth in 2010 with a growth rate of 5.3%. The construction sector reached its highest
growth in 2009 at 10.4%. The manufacturing sector experienced its lowest growth in
2018 of -7.7%, while construction sector reached its lowest point of growth in 2018
with -1.5% growth rate. The electricity sector experienced the highest growth in 2017
at 40.4%, while it recorded the lowest growth of -26.5% in 2018.
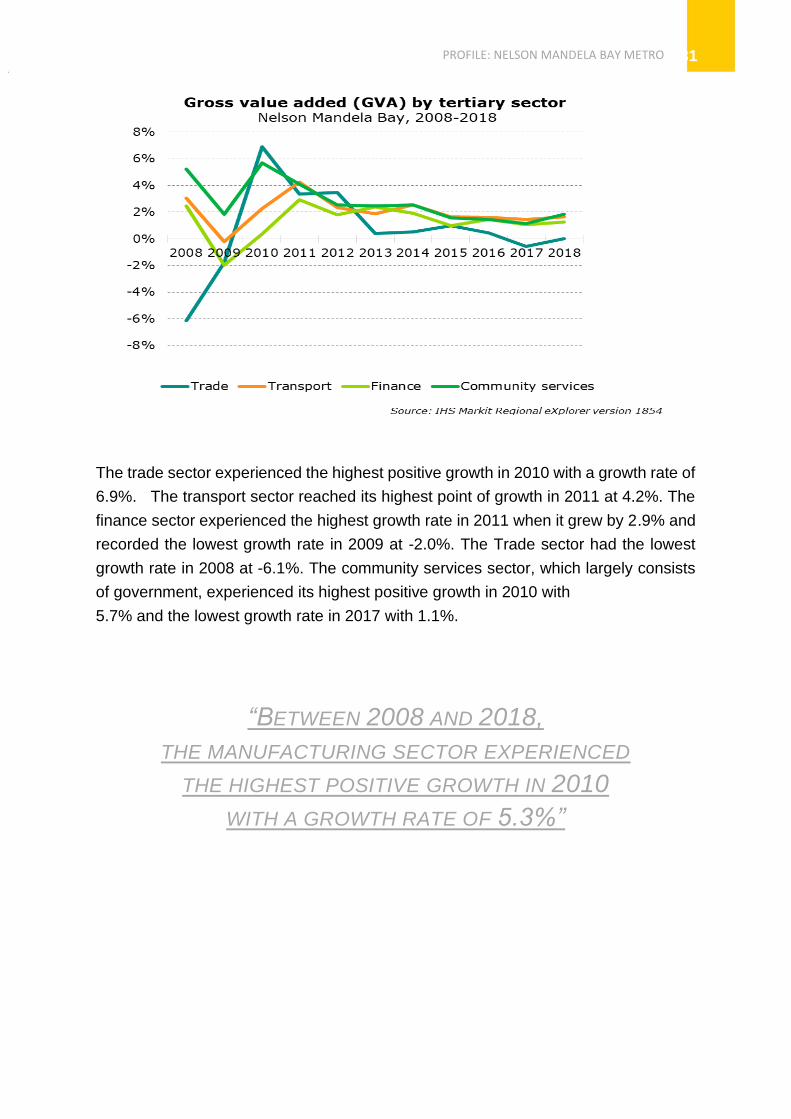
4.4. Tertiary Sector
The tertiary sector consists of four broad economic sectors namely the trade,
transport, finance and the community services sector. The following chart represents
the average growth rates in the GVA for these sectors in Nelson Mandela Bay from
2008 to 2018.
PROFILE: NELSON MANDELA BAY METRO 31
The trade sector experienced the highest positive growth in 2010 with a growth rate of
6.9%. The transport sector reached its highest point of growth in 2011 at 4.2%. The
finance sector experienced the highest growth rate in 2011 when it grew by 2.9% and
recorded the lowest growth rate in 2009 at -2.0%. The Trade sector had the lowest
growth rate in 2008 at -6.1%. The community services sector, which largely consists
of government, experienced its highest positive growth in 2010 with
5.7% and the lowest growth rate in 2017 with 1.1%.
“BETWEEN 2008 AND 2018,
THE MANUFACTURING SECTOR EXPERIENCED
THE HIGHEST POSITIVE GROWTH IN 2010
WITH A GROWTH RATE OF 5.3%”
PROFILE: NELSON MANDELA BAY METRO
32
5. Catalytic Projects to Diversify and Grow the Economy
5.1. Nelson Mandela International Airport
Port Elizabeth International Airport is optimally positioned as a city
airport which is an important gateway to the tourism market, and
easily accessed by business. It is ideally located within 25 kilometres
of the industrial cluster of the Coega Industrial Development Zone;
one of the country’s largest Special Economic Zone.
Port Elizabeth International Airport has a direct, indirect and induced impact on the
growth of the economy in the regional sector.
In 2017 PE International Airport contributed R236 million towards GDP, which
amounted to a 0.1% contribution to provincial GDP. The airport has also created 418
jobs in the region with a total income contribution of R74 million for employees in the
regional sector.
6. Governance
6.1.1. Financial Health
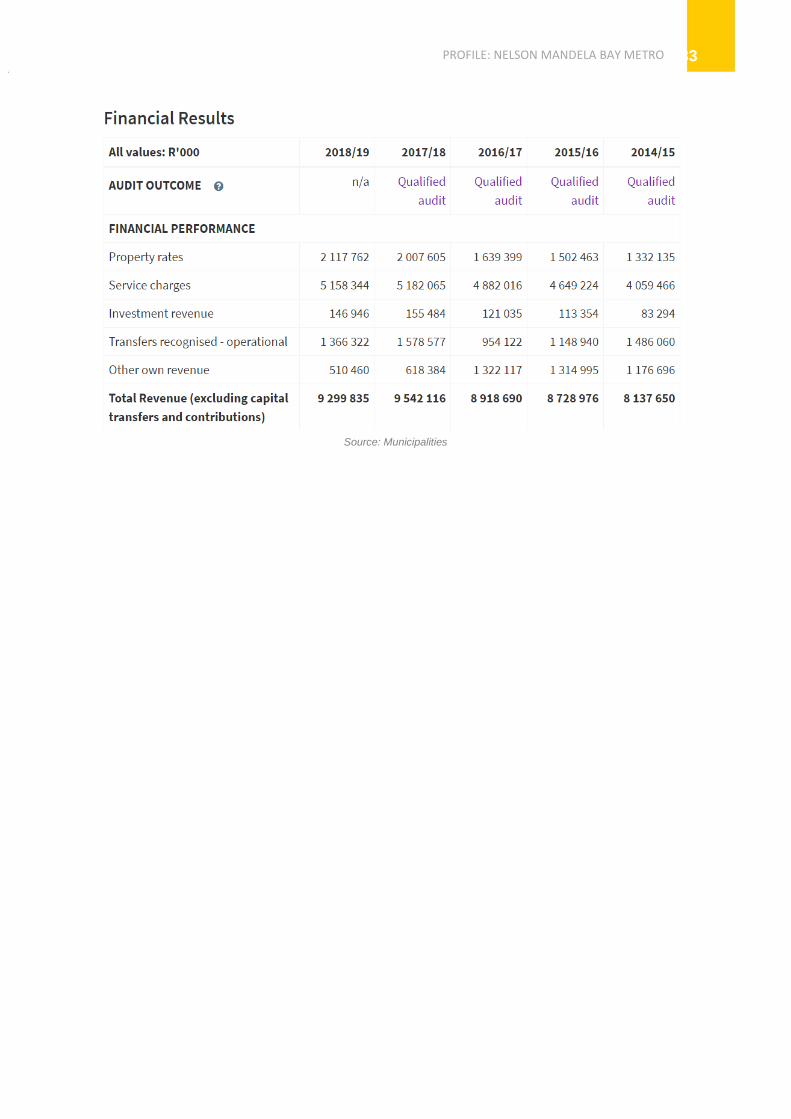
6.1.1.1. Audit Outcome
Nelson Mandela Bay Metropolitan Municipality has recently been
given a qualified audit opinion by the Auditor-General South Africa
(AGSA) which highlighted on the number of issues that the metro
face. Among those mentioned were leadership instability, poor
consequence management and ineffective control systems. Poor
financial records and a R16.5bn irregular expenditure bill dating back
to 2002 were also cited in the auditor-general’s opinion.
PROFILE: NELSON MANDELA BAY METRO 33
Source: Municipalities
PROFILE: NELSON MANDELA BAY METRO
34


