20
Profile of Agricultural Land Resources in Nova Scotia Prepared by: Michael Devanney, Economist Nova Scotia Department of Agriculture June 2010 [email protected] 1

Profile of Agricultural Land Resources in Nova Scotia
Prepared by: Michael Devanney, Economist Nova Scotia Department of Agriculture June 2010 [email protected]
1
NOVA SCOTIA PROFILE of AGRICULTURAL LAND RESOURCES Introduction This report presents an overview of agricultural land resources in Nova Scotia. The following sections describe how much arable land assets the province and its counties have, where the land is located and how it is being used. The report also provides an estimate of how much arable land has been lost to urban development as well as farmland that is threatened by property fragmentation and encroachment. Key terms CLI- Canada Land Inventory. A land classification system, the agricultural portion of which designates land capability for agriculture. CLI2- The best arable land in Nova Scotia (not necessarily used for agriculture). These soils have moderate limitations for crops or require moderate conservation practices. CLI3- Soils have moderately severe limitations that restrict use for crops or require special conservation practices. CLI4- Soils have severe limitations that restrict use for crops or require special conservation practices or both. CLI5 and poorer- Soils have very severe limitations for crops. ALIP- Farmland (including wild blueberries) as designated by the 1998 Agricultural Land Identification Project by the NS Department of Agriculture. Agricultural and blueberry land (DNR)- Farmland and wild blueberry agriculture as identified by the NS Department of Natural Resources.
2

Data and limitations This report relies on three primary data sets: The Canadian Land Inventory (CLI), produced in 1960s to early 1980s provides land capability classifications for agriculture among other rural land uses. While this information is old and at a large geographic scale 1:250,000, the information is useful in providing guidance regarding the province’s agricultural land resources. The main limitation to these data are distortions in certain areas of the province (mainly in southwestern Nova Scotia and Cape Breton). Where these distortions result in the CLI data not fitting with the other data sources used in this report, errors will occur. For most of the main agricultural regions of the province, the CLI data seem to fit with the other data sources well. The Forestry Inventory Geographic Information System of the Nova Scotia Department of Natural Resources (DNR) maintains a spatial dataset which displays and categorizes the land cover of Nova Scotia. These maps were used to determine the location and size of urban areas, agriculture and wild blueberry land. The land classifications were interpreted from air photos and satellite imagery acquired between 1997 and 2006. Data are not collected on a county basis and so counties contain data based on images from multiple years. For this reason, exact comparisons between counties cannot be made. In 1998, the Nova Scotia Department of Agriculture completed the Agricultural Land Identification Project (ALIP). This project used a combination of the DNR forest coverage files mentioned above and ground confirmation (truthing) to determine active and inactive agricultural lands in the province. While very useful, this information is now dated. An updated version of this report with new ALIP data would be significantly more accurate for 2010. Property and civic address data for the province of Nova Scotia were also used in this analysis. Methodology The datasets described above were imported into ESRI’s ArcMap GIS software to arrive at the calculations in this report. The main analysis tools used were the spatial area calculator to determine hectares, and the clip function to determine how much of one land type (e.g. agriculture) occurred on a second land type (e.g. CLI 2). The CLI data were reprojected from coordinate system NAD 1927 UTM Zone 20N to NAD 1983 UTM Zone 20N. This is the closest coordinate system available to shift the data to more accurately fit with the other sources of geographic data used in this report.
3

4
The ALIP data were manually shifted in ArcMap as it was determined that the original projection was not accurate. This small shift helped to fit the ALIP data with the other data used in this report. Overview of land resources Lands most suitable for agricultural production (Canadian Land Inventory (CLI) classes 2,3 and 41) cover slightly less than 30 percent of Nova Scotia’s land area (see Table 1). The province’s best arable land (CLI2) accounts for 3 percent of the land area, while CLI3 and CLI4 cover 18 and 8 percent, respectively. This land is not necessarily used for agriculture and may instead be used for urban development, for other economic uses, or exist in a forested/natural state.
Approximately 235,000 hectares are used for agriculture (including blueberry production) as indicated by the ALIP project in 1998, amounting to 4.3 percent of the province’s area (Figure 1b). Agricultural land as identified by DNR forest inventory data amounts to approximately 229,000 hectares with a further 16,500 hectares estimated to be in wild blueberry production. Land with suitability for agricultural production is concentrated in the Annapolis Valley, throughout most of Hants County, and along the Northumberland Strait. There are also significant concentrations in Digby and Yarmouth counties, in southern Inverness and around the Cape Breton Regional Municipality.
Table 1. Agricultural land resources- Nova Scotia Hectares Percent of
provincial land area
CLI 2,3,4 TOTAL 1,573,160 28.7
CLI 2 164,933 3.1
CLI 3 990,062 18.1
CLI 4 418,166 7.6
Agricultural land (ALIP)* 235,965 4.3
Agricultural land (DNR)** 229,004 4.2
Blueberry land (DNR)** 16,508 0.3 * As indicated by the NSDA Agricultural Land Identification Project. ** Based on forest coverage files from NS Natural Resources (blueberry land is low-bush/ wild) Source: Nova Scotia Department of Agriculture, NS Natural Resources, Natural Resources Canada
1 Nova Scotia does not have any CLI class 1 soil. Class 2 to 4 soils have moderate to severe limitations that restrict the range of crops or require special conservation practices or both. Class 5 soils and below have very severe limitations for agriculture.

5
Figure 1a. Agricultural land resources in Nova Scotia
6
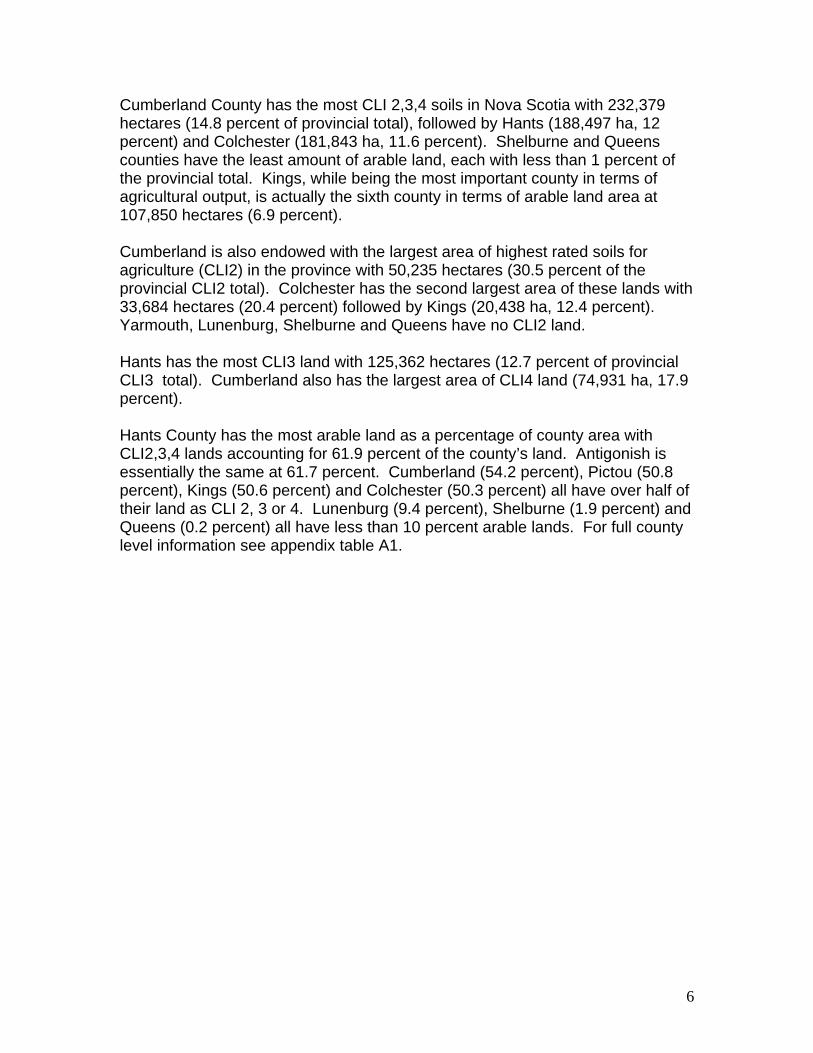
Cumberland County has the most CLI 2,3,4 soils in Nova Scotia with 232,379 hectares (14.8 percent of provincial total), followed by Hants (188,497 ha, 12 percent) and Colchester (181,843 ha, 11.6 percent). Shelburne and Queens counties have the least amount of arable land, each with less than 1 percent of the provincial total. Kings, while being the most important county in terms of agricultural output, is actually the sixth county in terms of arable land area at 107,850 hectares (6.9 percent). Cumberland is also endowed with the largest area of highest rated soils for agriculture (CLI2) in the province with 50,235 hectares (30.5 percent of the provincial CLI2 total). Colchester has the second largest area of these lands with 33,684 hectares (20.4 percent) followed by Kings (20,438 ha, 12.4 percent). Yarmouth, Lunenburg, Shelburne and Queens have no CLI2 land. Hants has the most CLI3 land with 125,362 hectares (12.7 percent of provincial CLI3 total). Cumberland also has the largest area of CLI4 land (74,931 ha, 17.9 percent). Hants County has the most arable land as a percentage of county area with CLI2,3,4 lands accounting for 61.9 percent of the county’s land. Antigonish is essentially the same at 61.7 percent. Cumberland (54.2 percent), Pictou (50.8 percent), Kings (50.6 percent) and Colchester (50.3 percent) all have over half of their land as CLI 2, 3 or 4. Lunenburg (9.4 percent), Shelburne (1.9 percent) and Queens (0.2 percent) all have less than 10 percent arable lands. For full county level information see appendix table A1.

7
Figure 1b. Agriculture and urban land development in Nova Scotia

8
Figure 1c. Agricultural land resources and development (overlay)

Usage of arable land and composition of farmed land Approximately 13 percent of land most suitable for agricultural production (CLI classes 2, 3 and 4) is used for agriculture in Nova Scotia. Slightly less than 1 percent of this land is also used for wild blueberry production. Urban development takes up 5.4 percent of CLI 2,3,4 and the remaining 81 percent is in some other use (natural forest or other natural state, cultivated forest, etc). Kings County makes the most use of its arable land for agricultural production (Figure 2). Over one-third (36 percent) of CLI 2,3,4 land in Kings is in farming. Annapolis County also utilizes a significant portion of its arable land for farming (31 percent). Beyond Kings and Annapolis, utilization rates for arable lands drop off significantly (Antigonish is third highest at 15 percent). This is a result of (1) other counties having relatively large endowments of arable land and/or (2) low utilization of CLI 2,3,4 land for agriculture.
Figure 2. Utilization of soils suitable for agriculture
0.0
10.0
20.0
30.0
40.0
50.0
60.0
70.0
80.0
90.0
100.0
Nova S
cotia
Kings
Annap
olis
Queen
s
Lune
nburg
Colcheste
r
CB Cou
ntyPict
ou
Antigon
ish
Halifax
Cumberlan
dHants
Yarmou
th
Inverne
ss
Victori
aDigby
Richmon
d
Guysb
orough
Shelbu
rne
perc
ent o
f cou
nty
CLI 2
,3,4
land
DNR ag land DNR blueberry land urban land other
Cumberland County uses 2.4 percent of arable land for wild blueberry production, the highest in the province. Most blueberry production takes place on soils not suitable for agriculture. Utilization of arable land for farming is highest on the best arable land (see Figure 2b). Provincially, 29 percent of the best land for agriculture, CLI2, is used for farming. Approximately 12 percent of CLI3 and 8 percent of CLI4 land is used in farming. Urban development takes up 6.9 percent of CLI2 land, 5.4 percent of CLI3 and 4.6 percent of CLI4.
9

Figure 2b- Utilization of soils suitable for agriculture- Nova Scotia (breakdown)
0.0
10.0
20.0
30.0
40.0
50.0
60.0
70.0
80.0
90.0
100.0
CLI2 CLI3 CLI4
perc
ent
Agriculture Wild blueberry land Urban land Other
Kings County utilizes 62 percent of its CLI2 land, the highest in Nova Scotia. Kings is somewhat different than the provincial average in terms of urban use of arable land. While urban utilization of arable land is highest on the best land and decreases as land quality decreases provincially, in Kings urban land takes up 7.6 percent of CLI2, 6.5 percent of CLI3, and 8.7 percent of CLI4. Urban land, relatively speaking, is using up relatively less prime arable land in Kings in favour of the lower classes of soil. This alludes to the importance of agriculture to the economy of Kings and the land use bylaws in place there. Composition of agricultural land Looking at the land base from a slightly different perspective (the composition of lands used for agriculture2, Figure/Table 3) it is apparent that agriculture in Nova Scotia is generally taking place on good agricultural soils. Half of agricultural land is on class 3 soils, while 21 percent is on class 2 soils and 14 percent are on class 4. Only 13 percent of agriculture in Nova Scotia takes place on poorer than CLI 4 land. Wild blueberry production is highly concentrated in CLI 4 land and poorer. Provincially, 45 percent of wild blueberry production takes place on CLI4 land and 34 percent on CLI5 or poorer. Less than 5 percent of wild blueberry production takes place on CLI2 and 16 percent is located on CLI3 land.
2 Rather than arable land with potential for agriculture, but not necessarily farmed.
10
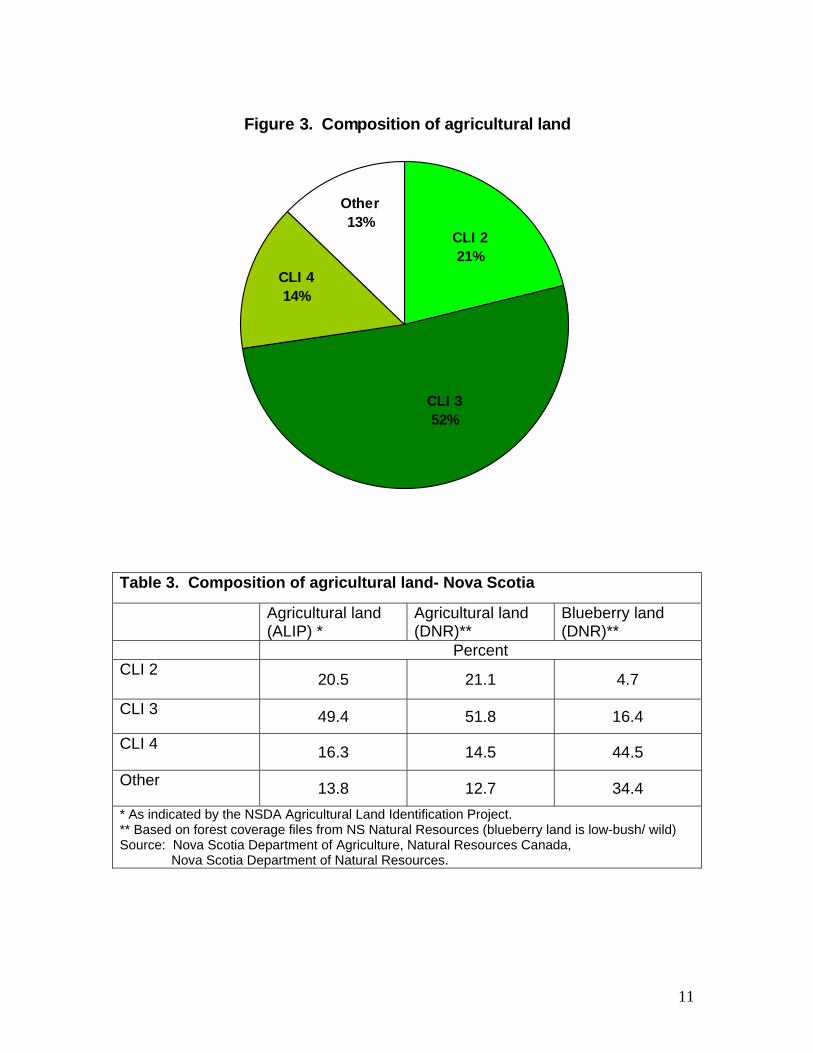
Figure 3. Composition of agricultural land
CLI 414%
Other13%
CLI 221%
CLI 352%
Table 3. Composition of agricultural land- Nova Scotia
Agricultural land (ALIP) *
Agricultural land (DNR)**
Blueberry land (DNR)**
Percent CLI 2 20.5 21.1 4.7
CLI 3 49.4 51.8 16.4
CLI 4 16.3 14.5 44.5
Other 13.8 12.7 34.4 * As indicated by the NSDA Agricultural Land Identification Project. ** Based on forest coverage files from NS Natural Resources (blueberry land is low-bush/ wild) Source: Nova Scotia Department of Agriculture, Natural Resources Canada, Nova Scotia Department of Natural Resources.
11
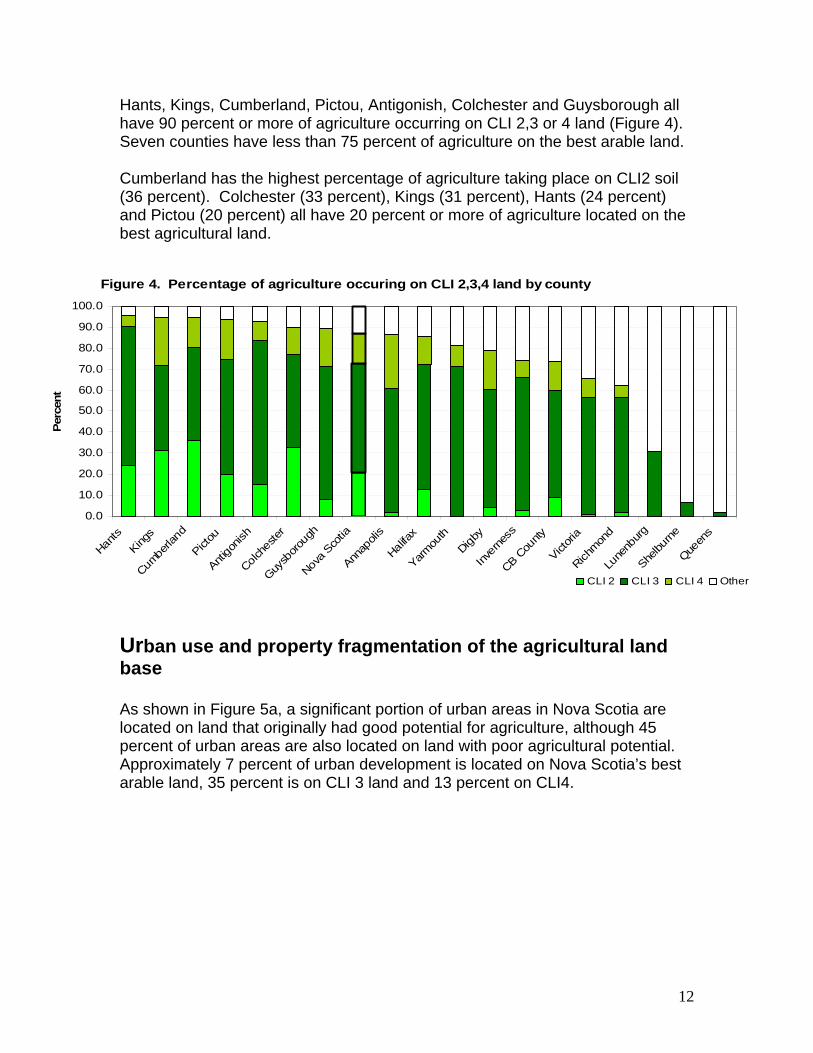
Hants, Kings, Cumberland, Pictou, Antigonish, Colchester and Guysborough all have 90 percent or more of agriculture occurring on CLI 2,3 or 4 land (Figure 4). Seven counties have less than 75 percent of agriculture on the best arable land. Cumberland has the highest percentage of agriculture taking place on CLI2 soil (36 percent). Colchester (33 percent), Kings (31 percent), Hants (24 percent) and Pictou (20 percent) all have 20 percent or more of agriculture located on the best agricultural land.
rban use and property fragmentation of the agricultural land
s shown in Figure 5a, a significant portion of urban areas in Nova Scotia are
l.
Figure 4. Percentage of agriculture occuring on CLI 2,3,4 land by county
0.0
10.0
20.0
30.0
40.0
50.0
60.0
70.0
80.0
90.0
100.0
Hants
Kings
Cumbe
rland
Pictou
Antigo
nish
Colche
ster
Guysb
oroug
h
Nova S
cotia
Annap
olis
Halifax
Yarmou
thDigb
y
Inver
ness
CB Cou
nty
Victori
a
Richmon
d
Lune
nburg
Shelbu
rne
Queen
s
Perc
ent
CLI 2 CLI 3 CLI 4 Other
Ubase Alocated on land that originally had good potential for agriculture, although 45 percent of urban areas are also located on land with poor agricultural potentiaApproximately 7 percent of urban development is located on Nova Scotia’s best arable land, 35 percent is on CLI 3 land and 13 percent on CLI4.
12
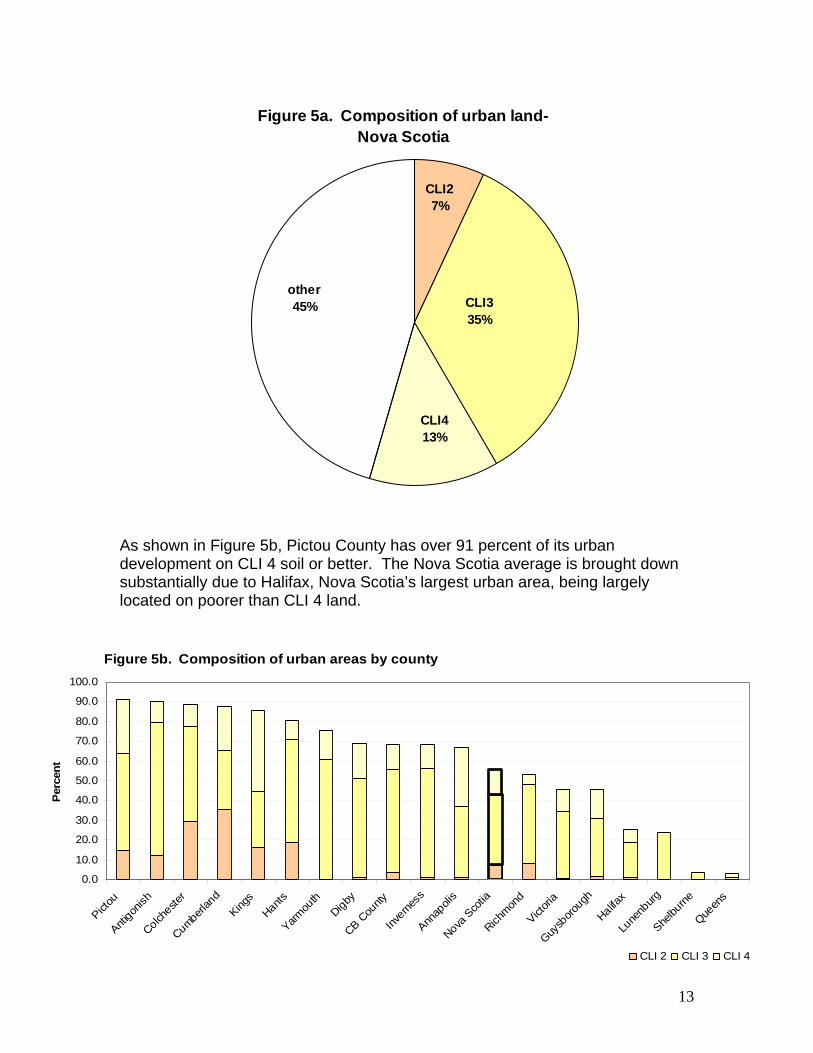
Figure 5a. Composition of urban land- Nova Scotia
CLI27%
other45%
CLI413%
CLI335%
As shown in Figure 5b, Pictou County has over 91 percent of its urban development on CLI 4 soil or better. The Nova Scotia average is brought down substantially due to Halifax, Nova Scotia’s largest urban area, being largely located on poorer than CLI 4 land.
Figure 5b. Composition of urban areas by county
0.0
10.0
20.0
30.0
40.0
50.0
60.0
70.0
80.0
90.0
100.0
Pictou
Antigon
ish
Colcheste
r
Cumberlan
dKing
sHants
Yarmou
thDigby
CB Cou
nty
Inverne
ss
Annap
olis
Nova S
cotia
Richmon
d
Victori
a
Guysb
orough
Halifax
Lune
nburg
Shelbu
rne
Queen
s
Perc
ent
CLI 2 CLI 3 CLI 4
13

Some lands currently in agriculture may be relatively easily removed for other forms of development. A contributing factor is lot size. Nova Scotia has approximately 19,000 properties of less than two hectares in size that are centered in ALIP lands. This amounts to just under 11,500 hectares of ALIP land. Kings County has 3,020 properties and 1,883 hectares of properties less than 2 hectares in area on ALIP land, the most of any county. This amounts to just under 5 percent of Kings ALIP lands. Percentage wise, Digby has by far the most fragmented farmland with 20 percent (837 ha) of ALIP lands being on properties of less than 2 hectares. Neighboring Yarmouth County is second at 9 percent (325 ha). In total, Nova Scotia has a total of 46,000 small (< 2 ha) properties either on, or adjacent to, ALIP farmland. These properties total approximately 30,000 hectares. Once again, Kings has the largest number of these properties with 7,206, but Digby has the highest ratio between small properties and ALIP land, followed again by Yarmouth. Shelburne and Lunenburg also have a large number of small size properties adjacent to ALIP lands relative to the size of land being farmed. Cumberland agriculture is the least threatened, relatively speaking, but does have the third largest number of these properties bordering on ALIP land. An attempt was made to estimate the amount of farm land lost to urban development. A land cover file based on satellite and fly-over images from the NS Department of Natural Resources was compared to the original ALIP file from 1998 to determine which farm lands had become designated as urban as of the date of the DNR images. Approximately 3,500 hectares (1.5 percent) of ALIP lands in Nova Scotia have been lost to urban development since 1998 based on this methodology. Colchester has lost the most land to urban development (819 ha) followed by Cumberland (597 ha) and Kings (400 ha). Shelburne, Queens and Victoria counties have all lost less than 25 hectares of farmland. In relative terms, Digby has lost the highest percentage of farmland (6.1 percent), followed by Shelburne (3.7 percent) and Colchester (2.5 percent). While physical occupancy of land by non farm development or land with the potential for non-farm development can be used to estimate potential loss of land to the sector, the effect of development on adjacent agricultural lands is probably of greater significance in terms of area affected. In order to estimate the area of farmland that is at risk due to the proximity of development, a 300 ft (91.44m) buffer was drawn around the property line of each small (<2ha) property and the amount of ALIP farmland falling under this zone was calculated (Figure 6). The 300 foot buffer was chosen in order to give an estimate of how much agricultural land is close enough to other forms of development that nuisance or
14
15
development conflicts could occur. There are a number of recommended setback distances, from various jurisdictions, and for a wide number of agricultural uses. The 300 foot setback was used by Kings County as a setback distance between livestock barns and residential dwellings, and was recommended by the county’s Agricultural Working Group to increase to 600ft (in the case of siting new non-farm dwellings) in 2007 (Municipality of Kings, 2007). Nova Scotia has about 30 percent of its farmland (as designated by ALIP) within 300 feet of the boundary of properties that are small enough to either currently be developed, or to be relatively easily developed. Of the roughly 70,000 hectares of agriculture in this class, approximately 70 percent are within 300 feet of a small property with a civic address. This indicates that a significant portion of agriculture in Nova Scotia faces the issues that are associated with urban encroachment on farmland. Again, Digby County has the highest percentage of its farmland at risk at 60 percent, followed by Yarmouth (46 percent). Kings has the largest area of farmland at risk (11,920 hectares, 30 percent). Cumberland agriculture is the least threatened in percentage terms (22 percent), while Shelburne has the smallest area of farmland falling into this category (123 hectares).

16
Figure 6. Lost or threatened farmland

Next steps This overview of agricultural land resources can be used to gain a better understanding of the geography and use of arable land and farming in the province. The data used in this report are not perfect, and the accuracy and usefulness of this information could be greatly improved with updated and more precise information. Nonetheless, the findings reported here should be useful in guiding future work regarding agricultural land use in Nova Scotia. Sources Municipality of the County of Kings. 2007. Agricultural Working Group- Final Report. Natural Resources Canada. Canada Land Inventory. Available from: http://geogratis.cgdi.gc.ca/CLI/frames.html. Accessed [25 January 2010]. Nova Scotia Department of Agriculture. Agricultural Land Identification Project (ALIP). Nova Scotia Department of Natural Resources. Forest Inventory- Geographic Information Systems. Available from: www.gov.ns.ca/natr/forestr/gis/forest-inventory.asp. Accessed [25 January 2010]. SNSMR (Service Nova Scotia and Municipal Relations). 2009. NS Civic Address File and property polygons.
17
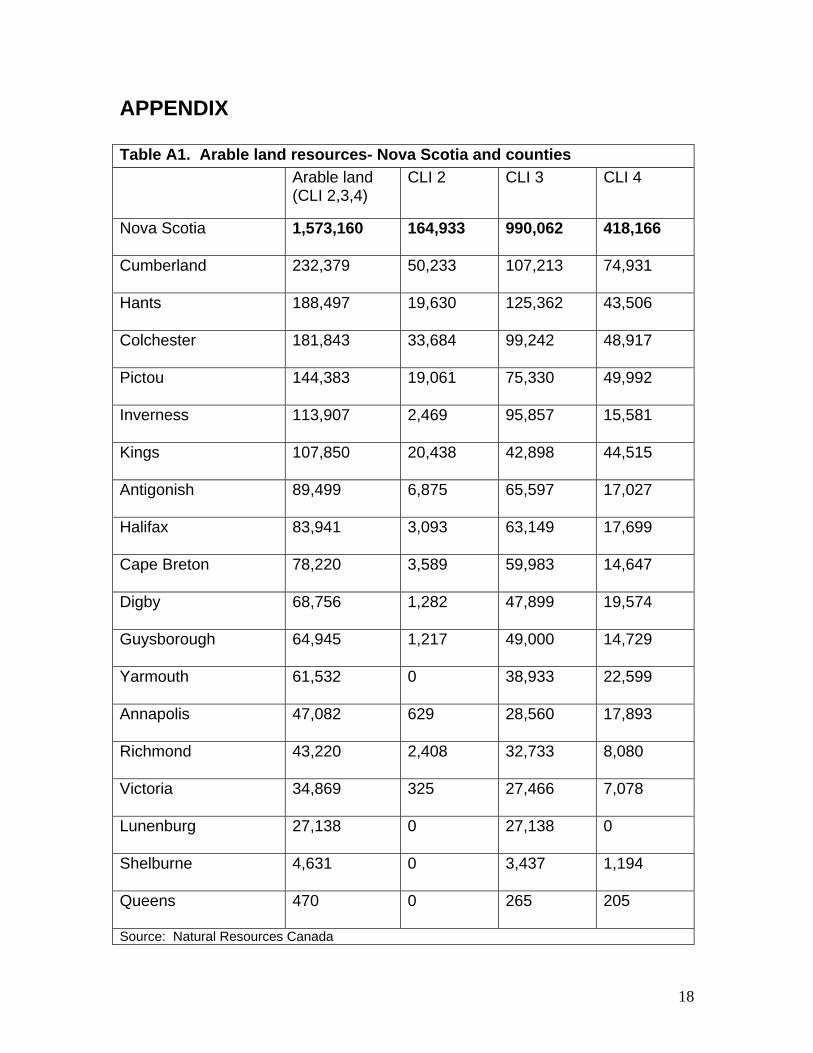
APPENDIX Table A1. Arable land resources- Nova Scotia and counties Arable land
(CLI 2,3,4) CLI 2 CLI 3 CLI 4
Nova Scotia 1,573,160
164,933
990,062
418,166
Cumberland 232,379
50,233
107,213
74,931
Hants 188,497
19,630
125,362
43,506
Colchester 181,843
33,684
99,242
48,917
Pictou 144,383
19,061
75,330
49,992
Inverness 113,907
2,469
95,857
15,581
Kings 107,850
20,438
42,898
44,515
Antigonish 89,499
6,875
65,597
17,027
Halifax 83,941
3,093
63,149
17,699
Cape Breton 78,220
3,589
59,983
14,647
Digby 68,756
1,282
47,899
19,574
Guysborough 64,945
1,217
49,000
14,729
Yarmouth 61,532
0
38,933
22,599
Annapolis 47,082
629
28,560
17,893
Richmond 43,220
2,408
32,733
8,080
Victoria 34,869
325
27,466
7,078
Lunenburg 27,138
0 27,138
0
Shelburne 4,631
0
3,437
1,194
Queens 470
0
265
205
Source: Natural Resources Canada
18

Table A2. Land in Farming- Nova Scotia and counties Agricultural land
(ALIP)* Agricultural land (DNR)**
Blueberry land (DNR)**
Nova Scotia 235,964
229,004
16,508
Kings 40,188
40,461
0
Cumberland 38,775
30,528
8,933
Colchester 33,025
30,108
3,128
Hants 24,795
25,144
420
Pictou 20,994
20,302
1,931
Annapolis 16,134
16,978
61
Antigonish 13,924
14,542
534
Inverness 12,488
13,092
170
Lunenburg 7,716
8,392
33
Halifax 7,676
7,488
538
Cape Breton 5,584
5,635
108
Digby 4,205
4,807
45
Yarmouth 3,514
3,791
21
Victoria 2,725
2,897
0
Guysborough 1,779
2,331
454
Richmond 1,132
1,259
0
Queens 989
1,018
33
Shelburne 322
232
101
* As indicated by the NSDA Agricultural Land Identification Project. ** Based on forest coverage files from NS Natural Resources (blueberry land is low-bush/ wild) Source: NS Agriculture, NS Natural Resources
19

20


