39
Profile of Home Buyers and Sellers January 14, 2016 National Association of REALTORS ® Research Department Jessica Lautz Managing Director, Survey Research and Communications @JessicaLautz

Profile of Home Buyers and
Sellers January 14, 2016
National Association of REALTORS®
Research Department
Jessica Lautz
Managing Director, Survey Research and Communications
@JessicaLautz
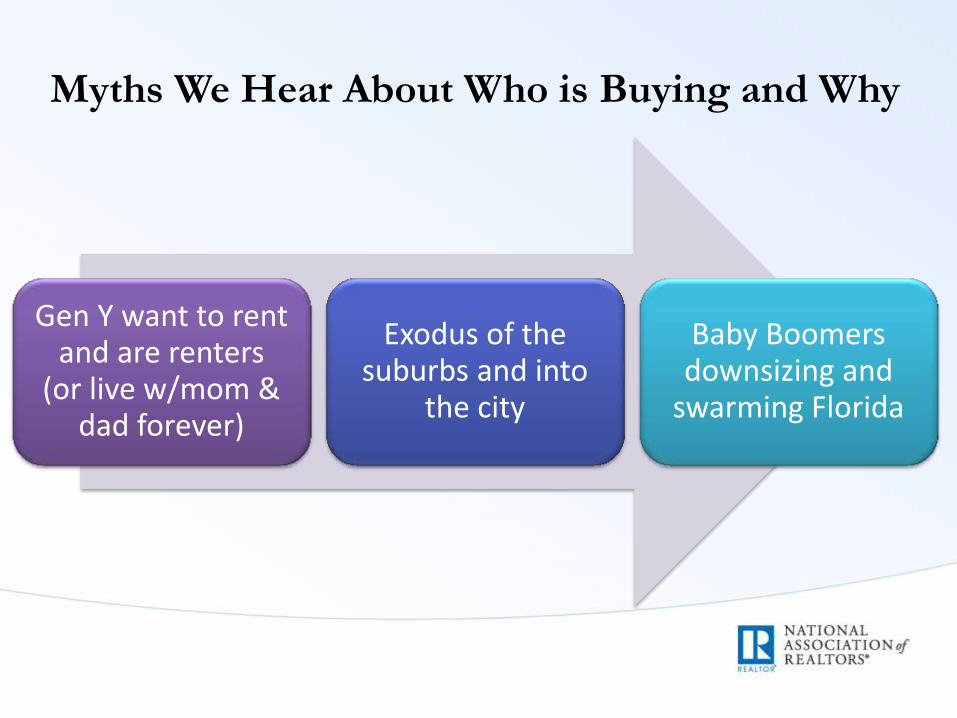
Myths We Hear About Who is Buying and Why
Gen Y want to rent and are renters
(or live w/mom & dad forever)
Exodus of the suburbs and into
the city
Baby Boomers downsizing and
swarming Florida

Share of Home Sales
Primary Home
Buyers, 60%
Investor Buyers,
19%
Vacation Home Buyers,
21%
2015 Investment and Vacation Home Buyers Survey

Profile of Home Buyers and Sellers
• Annual survey of recent home buyers
• Purchased in the last year
• Report started in 1981
– The year MTV was launched
– Reagan was president
– IBM releases its first PC
• Survey 75,000 to 100,000 recent home buyers
• Charlotte oversample is based on 237 recent home buyers
– Statistically significant at 95% confidence interval +/- 6.34%

2015 Profile of Home Buyers and Sellers
Nationally Rise in Household Income
$86,100
$69,400
$98,700
$50,000
$60,000
$70,000
$80,000
$90,000
$100,000
$110,000
2002 2003 2004 2005 2006 2007 2008 2009 2010 2011 2012 2013 2014
All Buyers First-time Buyers Repeat Buyers

Nationally No Longer…All the Single Ladies
Profile of Home Buyers and Sellers
67%
22
15
9 7 2 0%
10%
20%
30%
40%
50%
60%
70%
2001 2003 2004 2005 2006 2007 2008 2009 2010 2011 2012 2013 2014 2015
Married couple Single female Single male Unmarried couple Other
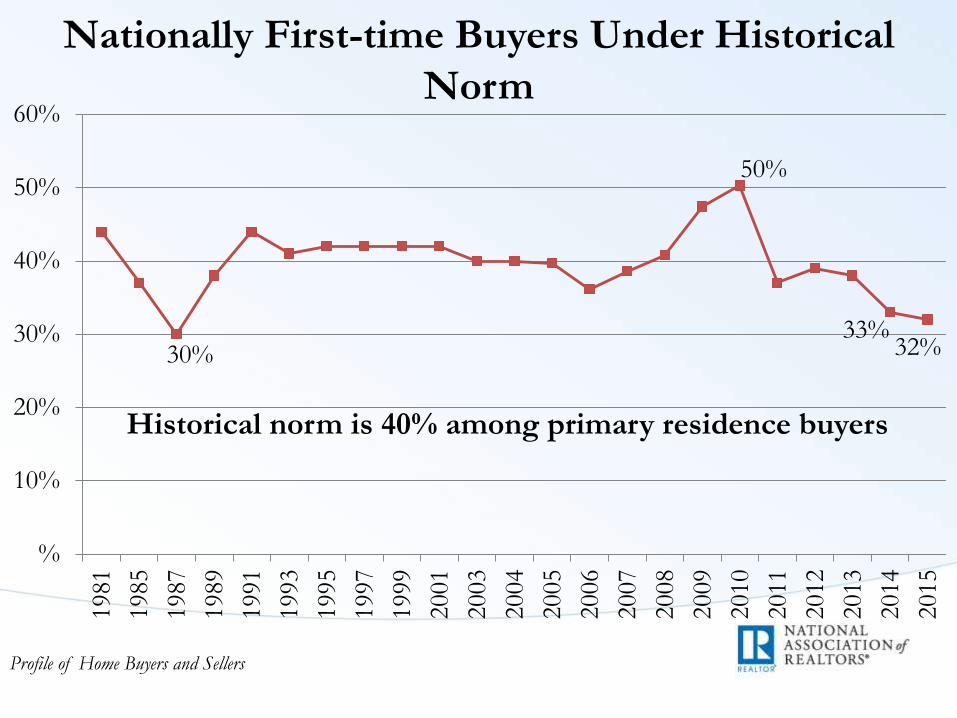
Nationally First-time Buyers Under Historical
Norm
Profile of Home Buyers and Sellers
Historical norm is 40% among primary residence buyers
30%
50%
33% 32%
%
10%
20%
30%
40%
50%
60%1981
1985
1987
1989
1991
1993
1995
1997
1999
2001
2003
2004
2005
2006
2007
2008
2009
2010
2011
2012
2013
2014
2015

How Does that Compare to Charlotte
Age slightly lower: 43
Income slightly lower:
$84,400
Higher share of unmarried couples,
but lower single males
First-time buyer share: 29%
2015 Charlotte Regional Profile of Home Buyers and Sellers

But…
Gen Y is the largest cohort of
home buyers for the
3rd consecutive year and
Charlotte’s largest generation of
buyers
2015 Charlotte Regional Profile of Home Buyers and Sellers

Desire of Gen Y to Buy is Still Present
Fannie Mae, 2013 Demand Institute Housing and Community Survey
59% of young renters (18 to 39) believe owning a home makes more sense
73% of young renters also believe it would be difficult to get a mortgage today
75% believe home ownership is an important long-term goal
73% believe ownership is an excellent investment
In Charlotte 67% of first-time
buyers bought a home for the
pure desire of owning a place of
their own
2015 Charlotte Regional Profile of Home Buyers and Sellers

Where to go?
Pew Research, Federal Reserve Bank of New York
57 million live in a multi-
generational household
Of those who are 25-34
20% of the unemployed
live with parents
12% of employed live with parents
Double the number of
multi-generational
households than 1980

Multi-Generational Home Buying
10% Bought
Multi Gen Home
Spend More Time
w/Aging Parents
Caretaking Aging
Parents
Children Over 18
Moving In
Cost Savings
2015 Charlotte Regional Profile of Home Buyers and Sellers

Expected Tenure Remains High
10
8
10
17
15 14
8
10
15 15
5
7
9
11
13
15
17
19
All Buyers 18 to 24 25 to 44 45 to 64 65 or older
Charlotte, SC U.S.
2015 Charlotte Regional Profile of Home Buyers and Sellers
NC

Buyers are Buying
Where and What

House Type of Choice?
3 bed
2 bath
2,020 sq ft
Detached Single Family Home
• Higher share of new homes: 20% vs 16% nationally • Built in 2000
• Higher share in suburban area: 63%
• Typically move 15 miles
2015 Charlotte Regional Profile of Home Buyers and Sellers

Commuting Costs
Very Important,
32%
Somewhat Important,
37%
Not Important,
31%
2015 Charlotte Regional Profile of Home Buyers and Sellers

Environmentally Friendly Features
2015 Charlotte Regional Profile of Home Buyers and Sellers
31%
22%
21%
9%
8%
1%
50%
45%
46%
38%
42%
7%
19%
33%
33%
52%
50%
92%
0% 20% 40% 60% 80% 100%
Heating and cooling costs
Energy efficient lighting
Energy efficientappliances
Environmentally friendlycommunity features
Landscaping for energyconservation
Solar panels installed onhome
Very Important Somewhat Important Not Important

How Searching?

First Step Taken During the Home Buying
Process
52% - Looked online for properties for sale
24% - Contacted a bank or mortgage lender
12% - Contacted a real estate agent
12% - Drove-by homes and neighborhoods
2015 Charlotte Regional Profile of Home Buyers and Sellers

Value of Website Features
86% Found photos very useful
78% Found detailed
information about properties
42% Found interactive maps
very useful
41% Virtual tours very useful
2015 Charlotte Regional Profile of Home Buyers and Sellers

REALTOR® Preferred Method of
Communication with Clients
93% 89% 88%
E-mail Telephone Text Messaging
Instant Messaging
(IM) Postal
27% 18%
2015 Charlotte Regional Member Profile
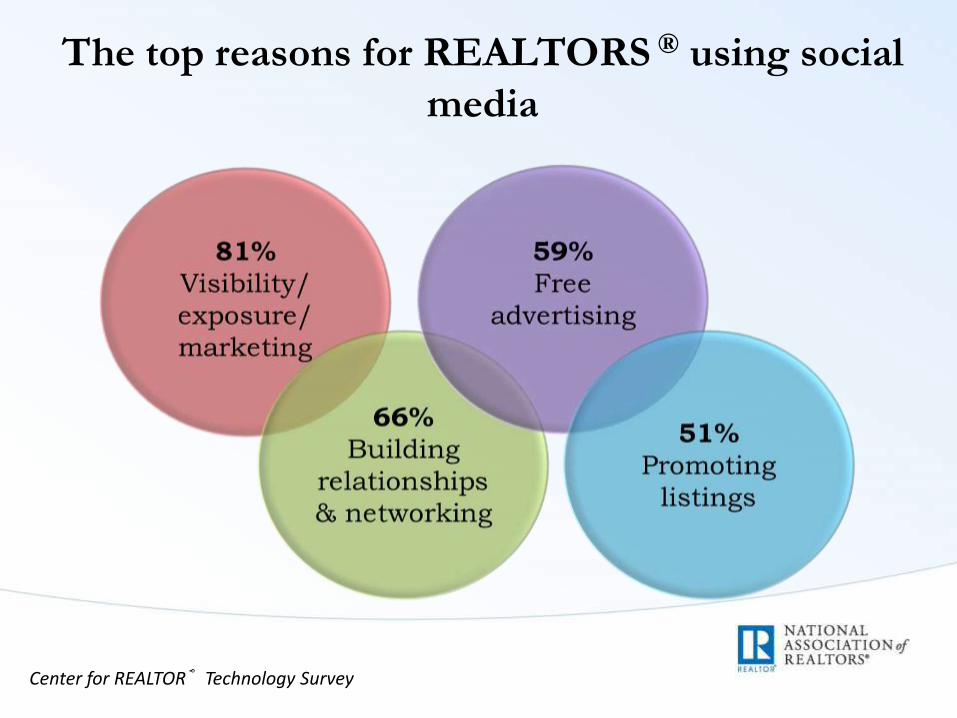
The top reasons for REALTORS ® using social
media
Center for REALTOR® Technology Survey

Dollars and Cents

How Long To Save for a Downpayment
91% of buyers financed
Typically finance 89%
75% of first-time buyers & 56% of repeat buyers use savings for downpayments
2015 Charlotte Regional Profile of Home Buyers and Sellers

Previously Had Distressed Sale
9% previously had a distressed
sale Typical year 2011
2015 Charlotte Regional Profile of Home Buyers and Sellers

Years All Debt Delayed Home Buyers From
Saving for a Downpayment or Buying a Home
All
Buyers
First-time
Buyers Repeat Buyers
One year 15% 5% 24%
Two years 33 38 28
Three years 15 19 12
Four years 11 5 16
Five years 13 19 8
More than five years 13 14 12
Median 3 3 2
2015 Charlotte Regional Profile of Home Buyers and Sellers

Debt Holding Back Buyers
All Buyers
First-time
Buyers
Repeat
Buyers
Share Saving for Downpayment
was Most Difficult Task in
Buying Process:
10% 20% 6%
Debt that Delayed Saving:
Student Loans 62% 62% 63%
Credit card debt 43 46 38
Car loan 29 23 38
Child care expenses 19 15 25
Health care costs 10 15 *
Other 10 15 *
2015 Charlotte Regional Profile of Home Buyers and Sellers

Recent Home Buyers Student Loan Debt
All Buyers
First-time
Buyers
Repeat
Buyers
Have student loan debt 28% 54% 17%
Under $10,000 25% 32% 15%
$10,000 to $24,999 28 27 30
$25,000 to $49,999 22 22 22
$50,000 to $74,999 8 8 7
$75,000 or more 17 11 26
Median amount of student loan debt
$20,000 $20,000 $25,000
2015 Charlotte Regional Profile of Home Buyers and Sellers

Nationally Equity Earned in Home Recently
Sold, By Tenure in Home
TENURE IN
HOME Dollar value Percent
1 year or less $31,000 14%
2 to 3 years $30,000 15%
4 to 5 years $35,000 19%
6 to 7 years $31,000 14%
8 to 10 years $3,000 1%
11 to 15 years $38,000 23%
16 to 20 years $95,000 63%
21 years or more $138,000 145%
All Sellers (median) $40,000 23%
In Charlotte the median was: $31,050 and 18%
2015 Charlotte Regional Profile of Home Buyers and Sellers

13% of sellers wanted to sell earlier but
waited or stalled because the home was
worth less than the mortgage
This rises to 26% among sellers who
originally purchased 11 to 15 years ago
2015 Charlotte Regional Profile of Home Buyers and Sellers


Seller Experience
Typical tenure is 10 years
Time on market: 6
wks 50% did
not reduce asking price
43% offered
incentives 98% sales price as share of asking price
Most common
reason for job
relocation
88% satisfied
with selling process
2015 Charlotte Regional Profile of Home Buyers and Sellers

Real Estate Remains a Business of Relationships

Where Clients Come From
2015 Charlotte Regional Member Profile and 2015 Charlotte Regional Profile of Home Buyers and Sellers
Among members 42% business is from repeat clients and referrals
2/3rds of buyers/sellers only contact 1
agent
62% sellers used an agent
that was referred to them/they had worked
w/before
49% buyers used an agent
that was referred to them/had
worked w/before

Most Difficult Steps of Home Buying Process
Finding the right property
46%
Paperwork 22%
Under-standing
the process
13%
Getting a mortgage
13%
No difficult
steps
18%
Saving for the down payment
10%
22% of Repeat Buyers noted there
were no difficult steps compared to
only 10% of First-time Buyers
Finding the right property was ranked highest
for the MOST DIFFICULT STEP in home
buying
2015 Charlotte Regional Profile of Home Buyers and Sellers

Nationally Buyer Use of Agents has Increased
69%
87%
0%
10%
20%
30%
40%
50%
60%
70%
80%
90%
100%
2001 2003 2004 2005 2006 2007 2008 2009 2010 2011 2012 2013 2014 2015
Through a real estate agent or broker
Directly from builder or builder's agent
Directly from the previous owner
In Charlotte, 88% worked with an agent to purchase
2015 Charlotte Regional Profile of Home Buyers and Sellers

Nationally Agent-Assisted Sales All Time High
19
8
77
89
3 0
10
20
30
40
50
60
70
80
90
100
All FSBO (For-sale-by-owner) Agent-assisted Other
In Charlotte, 88% worked with an agent to sell
2015 Charlotte Regional Profile of Home Buyers and Sellers

Free Webinars: Realtor® University Lectures
• Leading experts discuss important topics related to real estate, housing and the economy.
• Presented front of a live audience
• Free live streaming webinars
• Periscope before and live tweeted
• Videos/webinars posted after: http://www.realtor.org/topics/realtor-university/videos/realtor-university-speaker-series

facebook.com/narresearchgroup
@NAR_Research and @JessicaLautz
economistsoutlook.blogs.realtor.org
pinterest.com/narresearch/
instagram.com/narresearch/
Join NAR Research's Social Media


