BIZTEKA I 014 I December I 2016 - 3- INDUSTRY & COMMODITY Prepared by PT. CITRA CENDEKIA INDONESIA PROFILE OF INDUSTRY PROFILE OF INDUSTRY DEVELOPMENTS AND PROSPECTS OF FINANCE INDUSTRY (MULTIFINANCE) IN INDONESIA D I EditorS INTRODUCTION Slowing growth in the finance industry in Indonesia in the last two years is a result of the general economic slowdown. One of the most affected is the mining sector resulting in a reduction in demand for heavy equipment financing by businesses in the mining sector. Even the decline in the coal mining sector has been started since 2012 ago. But in general the finance industry in Indonesia in the last five years is still growing, especially consumer finance and factoring financing. While leasing for heavy equipment financing decreased. While the credit card financing in the last two years have grown quite passable. Despite many obstacles, the financing business people are quite optimistic that the finance industry in Indonesia will continue to grow in the future. If the Indonesian economy is recovered, the market will be wide open, especially from the automotive sector and public transport which has been the largest market. Besides, APPI also continue working to make BI more ease lending requirements of banks to financing industry sector. Seeing the developments in the financing business in Indonesia so far, BIZTEKA is interested to examine and discuss the extent of the performance of the finance industry in Indonesia in recent years, including the problems and to predict the prospects of financing industry in Indonesia for years to come.
Transcript
BIZTEKA I 014 I December I 2016
- 3-
I N D U S T R Y & C O MM O D I T Y
Prepared by PT. CITRA CENDEKIA INDONESIA PROFILE OF INDUSTRY
PROFILE OF INDUSTRY
DEVELOPMENTS AND PROSPECTS OF FINANCE INDUSTRY (MULTIFINANCE)
IN INDONESIA D I EditorS
INTRODUCTION Slowing growth in the finance industry in Indonesia in the last two years is a result of the general economic slowdown. One of the most affected is the mining sector resulting in a reduction in demand for heavy equipment financing by businesses in the mining sector. Even the decline in the coal mining sector has been started since 2012 ago. But in general the finance industry in Indonesia in the last five years is still growing, especially consumer finance and factoring financing. While leasing for heavy equipment financing decreased. While the credit card financing in the last two years have grown quite passable. Despite many obstacles, the financing business people are quite optimistic that the finance industry in Indonesia will continue to grow in the future. If the Indonesian economy is recovered, the market will be wide open, especially from the automotive sector and public transport which has been the largest market. Besides, APPI also continue working to make BI more ease lending requirements of banks to financing industry sector. Seeing the developments in the financing business in Indonesia so far, BIZTEKA is interested to examine and discuss the extent of the performance of the finance industry in Indonesia in recent years, including the problems and to predict the prospects of financing industry in Indonesia for years to come.
BIZTEKA I 014 I December I 2016
- 4-
I N D U S T R Y & C O MM O D I T Y
Prepared by PT. CITRA CENDEKIA INDONESIA PROFILE OF INDUSTRY
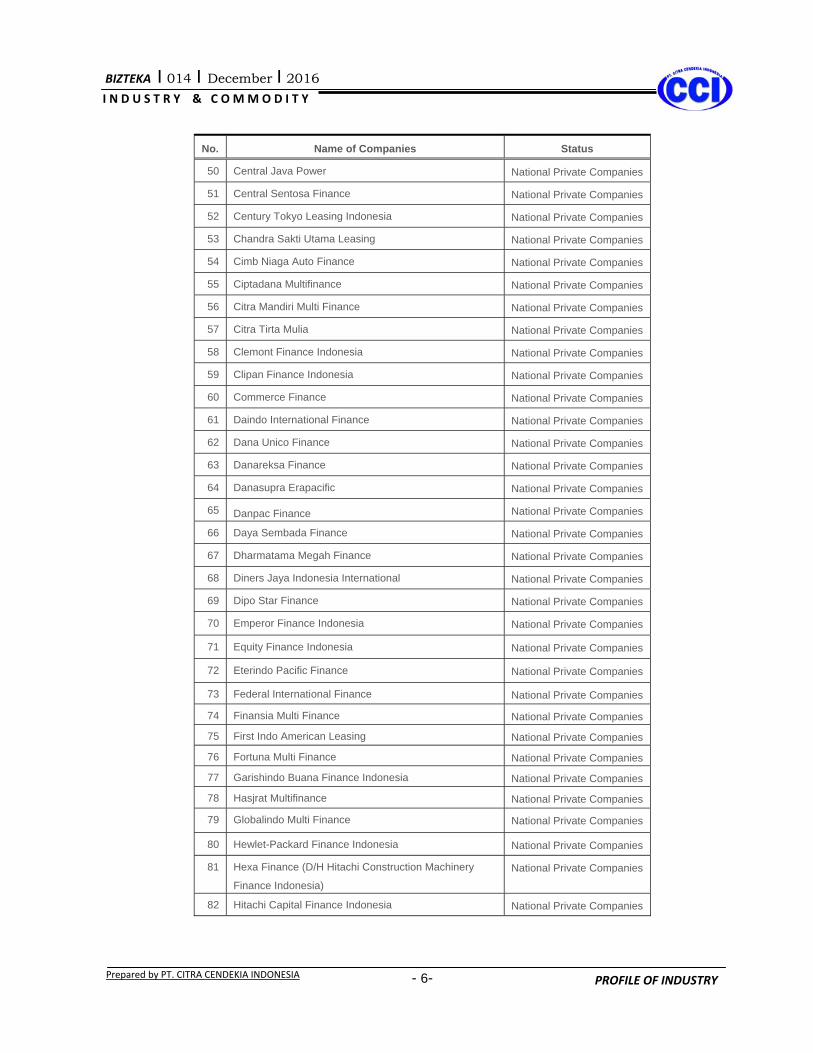
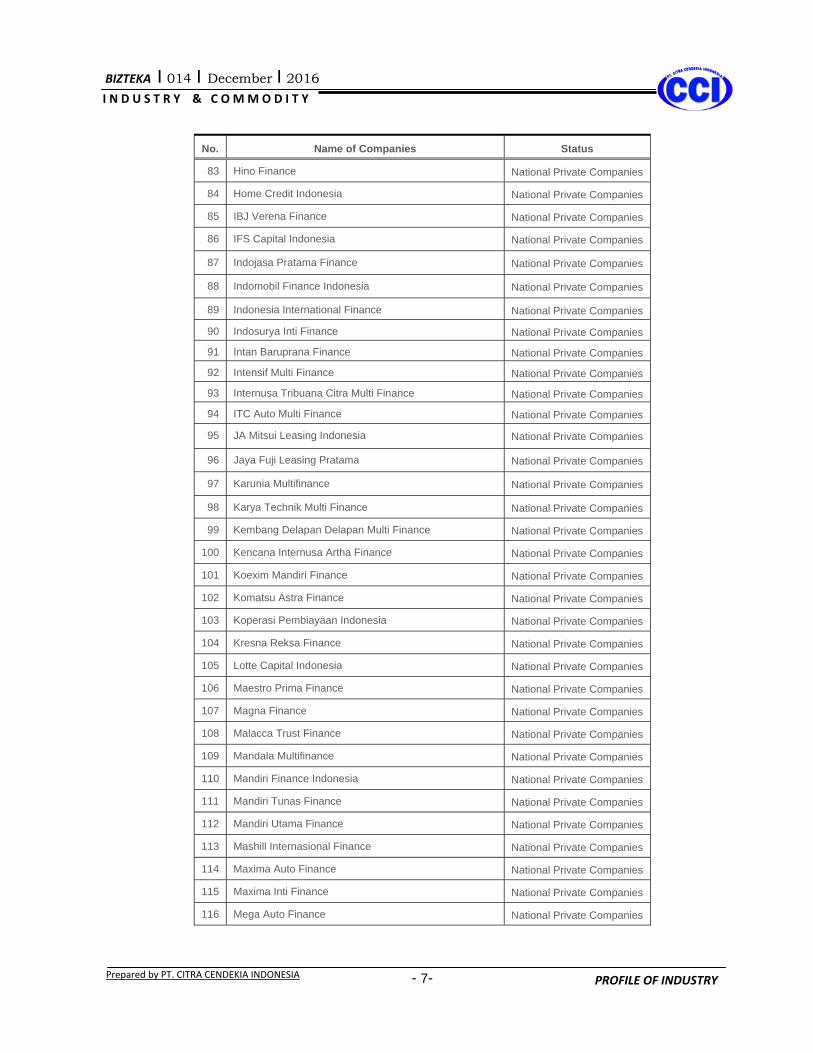
DEVELOPMENT OF FINANCING COMPANY IN INDONESIA Based on the source of the Indonesian Financial Services Association and the Financial Services Authority - the Ministry of Finance said that until the month of September 2016, there are 203 companies operating in Indonesia consisting of 187 national private companies, 14 joint ventures (JV), and 2 state companies. Here can be seen the development of the number of companies operating in Indonesia, during 2012- 2016.
Table – The Development of the Operational Financing Companies In Indonesia, 2012-2016
Type of Company 2012 2013 2014 2015 2016*
State Owned Companies 2 2 2 2 2
National Private Companies 141 143 142 151 151
Joint Ventures 57 57 57 50 50
Total 200 202 201 203 203 *) Up to September Source : FSA- Ministry of Finance processed by BIZTEKA-CCI
Thus, the entire finance company officially licensed to operate in Indonesia until September 2016 are as follows.
Table – Financing Company Operations In Indonesia, 2016
No. Name of Companies Status
1 Pann Multi Finance State Owned Companies
2 Sarana Multi Infrastruktur (Persero) State Owned Companies
3 AB Sinar Mas Multifinance National Private Companies
4 Adhika Primadhana Multifinance National Private Companies 5 Adira Dinamika Multi Finance National Private Companies 6 Adira Quantum Multifinance National Private Companies 7 Aditama Finance National Private Companies 8 Aeon Credit Services Indonesia National Private Companies 9 Al Ijarah Indonesia Finance National Private Companies
10 Amanah Finance National Private Companies 11 Andalan Finance Indonesia National Private Companies 12 Anugerah Utama Multifinance National Private Companies 13 Anugerah Buana Central Multi Finance National Private Companies 14 Arjuna Finance National Private Companies 15 Armada Finance National Private Companies
BIZTEKA I 014 I December I 2016
- 5-
I N D U S T R Y & C O MM O D I T Y
Prepared by PT. CITRA CENDEKIA INDONESIA PROFILE OF INDUSTRY
No. Name of Companies Status
16 Artha Asia Finance National Private Companies 17 Artha Prima Finance National Private Companies 18 Arthabuana Margausaha Finance National Private Companies 19 Asia Multidana National Private Companies 20 Asiatic Sejahtera Finance National Private Companies
21 Astra Auto Finance National Private Companies
22 Astra Multi Finance National Private Companies
23 Astra Sedaya Finance National Private Companies
24 Astrido Pacific Finance National Private Companies
25 Batara Internasional Finansindo National Private Companies
26 Batavia Prosperindo Finance National Private Companies
27 BCA Finance National Private Companies
28 Bentara Sinergies Multifinance National Private Companies
29 Beta Inti Multifinance National Private Companies
30 BFI Finance Indonesia National Private Companies
31 Bhumindo Sentosa Abadi Finance National Private Companies
32 BII Finance Center National Private Companies
33 Bima Multi Finance National Private Companies
34 Bintang Mandiri Finance National Private Companies
35 Bosowa Multifinance National Private Companies 36 BNI Multi Finance National Private Companies 37 Bringin Indotama Sejahtera Finance National Private Companies 38 Bringin Srikandi Finance National Private Companies 39 BTMU-BRI Finance National Private Companies 40 Buana Finance National Private Companies 41 Buana Sejahtera Multidana National Private Companies
42 Bukopin Finance National Private Companies
43 Bumikusuma Multi Finance National Private Companies
44 Bumiputera Bot- Finance National Private Companies
45 Bussan Auto Finance National Private Companies
46 Cakrawala Citra Mega Multifinance National Private Companies
47 Capella Multidana National Private Companies
48 Capitalinc Finance National Private Companies
49 Catterpillar Finance Indonesia National Private Companies
BIZTEKA I 014 I December I 2016
- 6-
I N D U S T R Y & C O MM O D I T Y
Prepared by PT. CITRA CENDEKIA INDONESIA PROFILE OF INDUSTRY
No. Name of Companies Status
50 Central Java Power National Private Companies
51 Central Sentosa Finance National Private Companies
52 Century Tokyo Leasing Indonesia National Private Companies
53 Chandra Sakti Utama Leasing National Private Companies
54 Cimb Niaga Auto Finance National Private Companies
55 Ciptadana Multifinance National Private Companies
56 Citra Mandiri Multi Finance National Private Companies
57 Citra Tirta Mulia National Private Companies
58 Clemont Finance Indonesia National Private Companies
59 Clipan Finance Indonesia National Private Companies
60 Commerce Finance National Private Companies
61 Daindo International Finance National Private Companies
62 Dana Unico Finance National Private Companies
63 Danareksa Finance National Private Companies
64 Danasupra Erapacific National Private Companies
65 Danpac Finance National Private Companies
66 Daya Sembada Finance National Private Companies
67 Dharmatama Megah Finance National Private Companies
68 Diners Jaya Indonesia International National Private Companies
69 Dipo Star Finance National Private Companies
70 Emperor Finance Indonesia National Private Companies
71 Equity Finance Indonesia National Private Companies
72 Eterindo Pacific Finance National Private Companies
73 Federal International Finance National Private Companies 74 Finansia Multi Finance National Private Companies 75 First Indo American Leasing National Private Companies 76 Fortuna Multi Finance National Private Companies 77 Garishindo Buana Finance Indonesia National Private Companies 78 Hasjrat Multifinance National Private Companies 79 Globalindo Multi Finance National Private Companies
80 Hewlet-Packard Finance Indonesia National Private Companies
81 Hexa Finance (D/H Hitachi Construction Machinery
Finance Indonesia) National Private Companies
82 Hitachi Capital Finance Indonesia National Private Companies
BIZTEKA I 014 I December I 2016
- 7-
I N D U S T R Y & C O MM O D I T Y
Prepared by PT. CITRA CENDEKIA INDONESIA PROFILE OF INDUSTRY
No. Name of Companies Status
83 Hino Finance National Private Companies
84 Home Credit Indonesia National Private Companies
85 IBJ Verena Finance National Private Companies
86 IFS Capital Indonesia National Private Companies
87 Indojasa Pratama Finance National Private Companies
88 Indomobil Finance Indonesia National Private Companies
89 Indonesia International Finance National Private Companies 90 Indosurya Inti Finance National Private Companies 91 Intan Baruprana Finance National Private Companies 92 Intensif Multi Finance National Private Companies 93 Internusa Tribuana Citra Multi Finance National Private Companies 94 ITC Auto Multi Finance National Private Companies 95 JA Mitsui Leasing Indonesia National Private Companies
96 Jaya Fuji Leasing Pratama National Private Companies
97 Karunia Multifinance National Private Companies
98 Karya Technik Multi Finance National Private Companies
99 Kembang Delapan Delapan Multi Finance National Private Companies
100 Kencana Internusa Artha Finance National Private Companies
101 Koexim Mandiri Finance National Private Companies
102 Komatsu Astra Finance National Private Companies
103 Koperasi Pembiayaan Indonesia National Private Companies
104 Kresna Reksa Finance National Private Companies
105 Lotte Capital Indonesia National Private Companies
106 Maestro Prima Finance National Private Companies
107 Magna Finance National Private Companies
108 Malacca Trust Finance National Private Companies
109 Mandala Multifinance National Private Companies
110 Mandiri Finance Indonesia National Private Companies
111 Mandiri Tunas Finance National Private Companies
112 Mandiri Utama Finance National Private Companies
113 Mashill Internasional Finance National Private Companies
114 Maxima Auto Finance National Private Companies
115 Maxima Inti Finance National Private Companies
116 Mega Auto Finance National Private Companies
BIZTEKA I 014 I December I 2016
- 8-
I N D U S T R Y & C O MM O D I T Y
Prepared by PT. CITRA CENDEKIA INDONESIA PROFILE OF INDUSTRY
No. Name of Companies Status
117 Mega Central Finance National Private Companies
118 Mega Finadana Finance National Private Companies
119 Mega Finance National Private Companies
120 Mirasurya Multi Finance National Private Companies
121 Mitra Dana Putra Utama Finance National Private Companies
122 Mitra Pinasthika Mustika Finance National Private Companies
123 Mitsubishi Ufj Lease & Finance National Private Companies
124 Mitsui Leasing Capital Indonesia National Private Companies
125 Mizuho Balimor Finance National Private Companies
126 MNC Finance National Private Companies
127 MNC Guna Usaha Indonesia (D/H Indo Finance
Perkasa) National Private Companies
128 Multindo Auto Finance National Private Companies 129 Murni Upaya Raya Value Inti Finance National Private Companies 130 Mutiara Multi Finance National Private Companies 131 National Finance National Private Companies 132 Nissan Financial Services Indonesia National Private Companies 133 Nusa Surya Ciptadana National Private Companies 134 Olympindo Multi Finance National Private Companies 135 Orix Indonesia Finance National Private Companies 136 OTO Multiartha National Private Companies 137 Otomas Multifinance National Private Companies 138 Pacific Multifinance National Private Companies 139 Pan Pacific OTO Finance National Private Companies 140 Panen Arta Indonesia Multi Finance National Private Companies 141 Pann Pembiayaan Maritim National Private Companies 142 Paramitra Multifinance National Private Companies 143 Patra Multifinance National Private Companies 144 Permata Finance Indonesia National Private Companies 145 PPA Finance National Private Companies 146 Pracico Multi Finance National Private Companies 147 Pratama Interdana Finance National Private Companies 148 Pratama Sedaya Finance National Private Companies 149 Prioritas Raditya Multifinance National Private Companies 150 Pro Car International Finance National Private Companies 151 Pro Mitra Finance National Private Companies
BIZTEKA I 014 I December I 2016
- 9-
I N D U S T R Y & C O MM O D I T Y
Prepared by PT. CITRA CENDEKIA INDONESIA PROFILE OF INDUSTRY
No. Name of Companies Status
152 Rabana Investindo National Private Companies 153 Radana Bhaskara Finance National Private Companies 154 Rama Multi Finance National Private Companies 155 Reksa Finance National Private Companies 156 Resona Indonesia Finance National Private Companies 157 Ridean Finance National Private Companies 158 Rindang Sejahtera Finance National Private Companies 159 Rukun Rahardjo Sedoyo National Private Companies 160 Sadira Finance National Private Companies 161 Sahabat Finansial Keluarga National Private Companies 162 Sarana Global Finance Indonesia National Private Companies 163 Satya Adhika Bhakti Multifinance National Private Companies 164 Sejahtera Pertama Multifinance National Private Companies 165 Sinar Mas Multifinance National Private Companies 166 Sinar Mitra Sepadan Finance National Private Companies 167 Smart Multi Finance National Private Companies 168 Smfl Leasing Indonesia National Private Companies 169 Staco Estika Sedaya Finance National Private Companies 170 Star Finance National Private Companies 171 Sumber Artha Mas Finance National Private Companies 172 Summit OTO Finance National Private Companies 173 Sunindo Parama Finance National Private Companies 174 Sunprima Nusantara Pembiayaan National Private Companies 175 Surya Artha Nusantara Finance National Private Companies 176 Surya Nordfinans National Private Companies 177 Suzuki Finance Indonesia National Private Companies 178 Swadesi Finance National Private Companies 179 Swadharma Bhakti Sedaya Finance National Private Companies 180 Swadharma Indotama Finance National Private Companies 181 Swadharma Surya Finance National Private Companies 182 Swarna Niaga Finance National Private Companies 183 Takari Kokoh Sejahtera National Private Companies 184 Tempo Utama Finance National Private Companies 185 Tifa Finance National Private Companies 186 Tirta Finance National Private Companies 187 TOP Finance National Private Companies 188 Topas Multi Finance National Private Companies
BIZTEKA I 014 I December I 2016
- 10-
I N D U S T R Y & C O MM O D I T Y
Prepared by PT. CITRA CENDEKIA INDONESIA PROFILE OF INDUSTRY
No. Name of Companies Status
189 Tossa Salimas Finance National Private Companies 190 Toyota Astra Financial Services Joint Venture
191 Transpacific Finance Joint Venture
192 Trevi Pelita Multifinance Joint Venture
193 Trihamas Finance Joint Venture
194 Triprima Multi Finance Joint Venture
195 Tristar Finance Joint Venture
196 Trust Finance Indonesia Joint Venture
197 U Finance Indonesia Joint Venture
198 Usaha Pembiayaan Reliance Indonesia Joint Venture
199 Varia Intra Finance Joint Venture
200 Verena Multi Finance Joint Venture
201 Wahana Ottomitra Multiartha Joint Venture
202 Wannamas Multi Finance (D/H Harvesia Aktiva
Finance)
Joint Venture
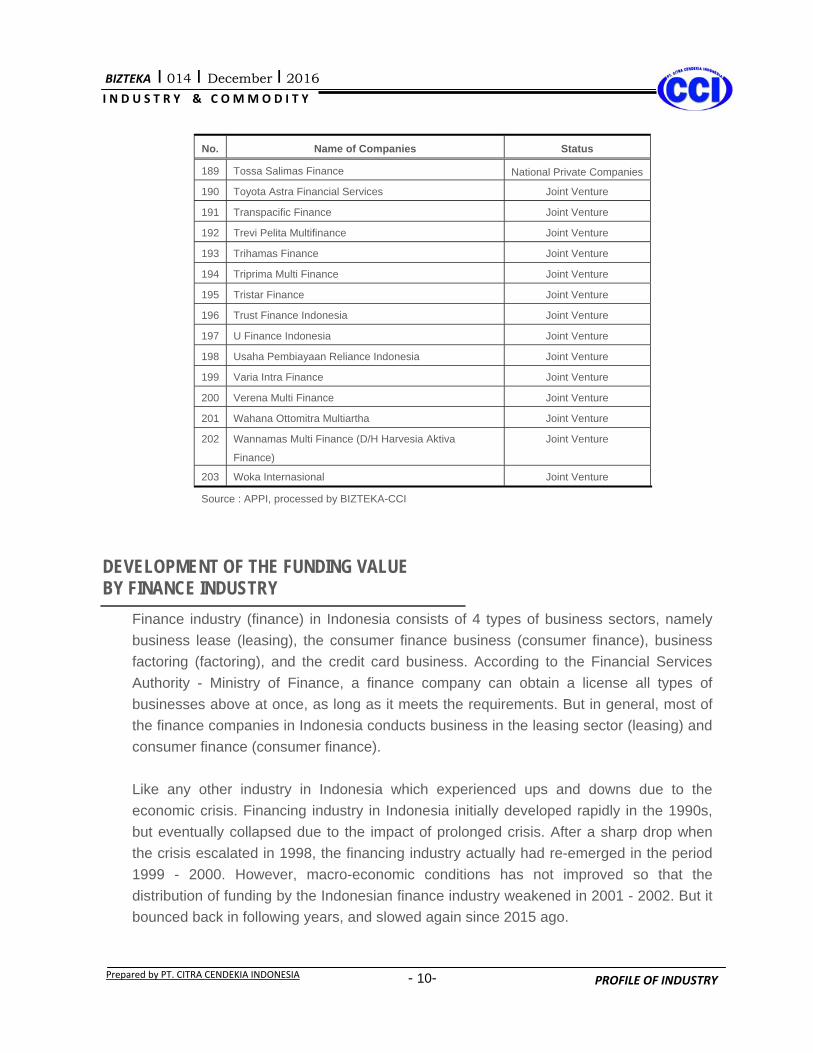
203 Woka Internasional Joint Venture
Source : APPI, processed by BIZTEKA-CCI
DEVELOPMENT OF THE FUNDING VALUE BY FINANCE INDUSTRY
Finance industry (finance) in Indonesia consists of 4 types of business sectors, namely business lease (leasing), the consumer finance business (consumer finance), business factoring (factoring), and the credit card business. According to the Financial Services Authority - Ministry of Finance, a finance company can obtain a license all types of businesses above at once, as long as it meets the requirements. But in general, most of the finance companies in Indonesia conducts business in the leasing sector (leasing) and consumer finance (consumer finance). Like any other industry in Indonesia which experienced ups and downs due to the economic crisis. Financing industry in Indonesia initially developed rapidly in the 1990s, but eventually collapsed due to the impact of prolonged crisis. After a sharp drop when the crisis escalated in 1998, the financing industry actually had re-emerged in the period 1999 - 2000. However, macro-economic conditions has not improved so that the distribution of funding by the Indonesian finance industry weakened in 2001 - 2002. But it bounced back in following years, and slowed again since 2015 ago.
BIZTEKA I 014 I December I 2016
- 11-
I N D U S T R Y & C O MM O D I T Y
Prepared by PT. CITRA CENDEKIA INDONESIA PROFILE OF INDUSTRY
Slowing growth finance business since 2015 is reflected in the declining value of financing provided, both in the consumer finance sector, as well as credit card factoring. Even the value of lease financing decreased since 2014 ago. While growth in the value of credit card financing in the last two years exceeded the growth in consumer finance and factoring. In 2012 the total value of the financing disbursed by the finance industry in Indonesia is Rp 310.76 trillion, then in 2013 it increased to Rp 360.01 trillion, up 15.8%. Then in 2014 when the economy started slowing down, the value of the business financing finance also slowed, Rp. 381.93 trillion, or grew only 6.1%, which means a much lower when compared to growth in 2013. Slowing the value of business finance funding to continue in 2015, even its value has decreased, despite only 0.7% or Rp. 379.25 trillion. This is due to global economic turmoil that contributed to the national economic slowdown. However, following the improvement of macroeconomic Indonesia as a result of the economic policy package issued by the Government of President Joko Widodo since the middle of 2015, the value of financing business finance in 2016 (data until August) has increased, unless the value of leasing. Based on data from the Financial Services Authority - the Ministry of Finance the total value of the business financing multifinance throughout January to August 2016 amounted to Rp. 390.58 trillion, an increase of 3% of the total value of the financing in 2015. Judging from the size of the contribution of each business sector, consumer finance provided the largest contribution to the total value of financing disbursed throughout the finance company. In the last five years consumer finance sector contributed an average of 65.5% of the total value of the financing. The second is the leasing sector (leasing), which contributed an average of 31.1%. Meanwhile factoring sector contributed an average of 3.3%, and credit cards that only contributed an average of 0.01%. The development of the total value of the industry's financing in Indonesia based on their respective business sectors during 2012 - 2016, are as follows.
BIZTEKA I 014 I December I 2016
- 12-
I N D U S T R Y & C O MM O D I T Y
Prepared by PT. CITRA CENDEKIA INDONESIA PROFILE OF INDUSTRY
Table – Development of the Total Value of Financing Distributed by Multifinance In Indonesia, 2012-2016
(In Billion Rupiah)
Company Activities 2012 2013 2014 2015 2016*)
Value of lease contract 109,149.86 123,382.69 118,360.49 112,572.73 99,479.87 Value of consumer financing 196,557.64 228,546.97 253,463.42 255,121.05 263,035.65 Value of factoring financing 5,054.47 8,082.73 10,081.10 11,461.45 27,938.31 Value of credit card financing 0 0 29.49 95.13 127.53
T O T A L 310.761,97 360.012,39 381.934,50 379,250.36 390,581.36
Growth rate (%) 15.85 6.09 (0.70) 2.99
*) up to August Source : FSA-Ministry of Finance processed by BIZTEKA-CCI
Total contract finance companies decre.ased by 3.32% from 21.92 million contracts in 2014 to 21.19 million contracts in 2015. In 2015 contracts Consumer Finance is the largest with a total of 20.94 million or 98.80% of the industry's total contract activity, as can be seen in the following table:
Tabel - Number of Contracts by Type of Multifinance Activity
T o t a l 18,012,879 100.00 21,104,786 100.00 21,919,141 100.00 21,192,239 100.00 21,450,783 100.00
*) up to August Source : FSA-Ministry of Finance processed by BIZTEKA-CCI
While the overall distribution of the largest value of multi business financing to the electricity sector, mining sector, Manufacturing and Trade Sector can be seen in the table below:
BIZTEKA I 014 I December I 2016
- 13-
I N D U S T R Y & C O MM O D I T Y
Prepared by PT. CITRA CENDEKIA INDONESIA PROFILE OF INDUSTRY
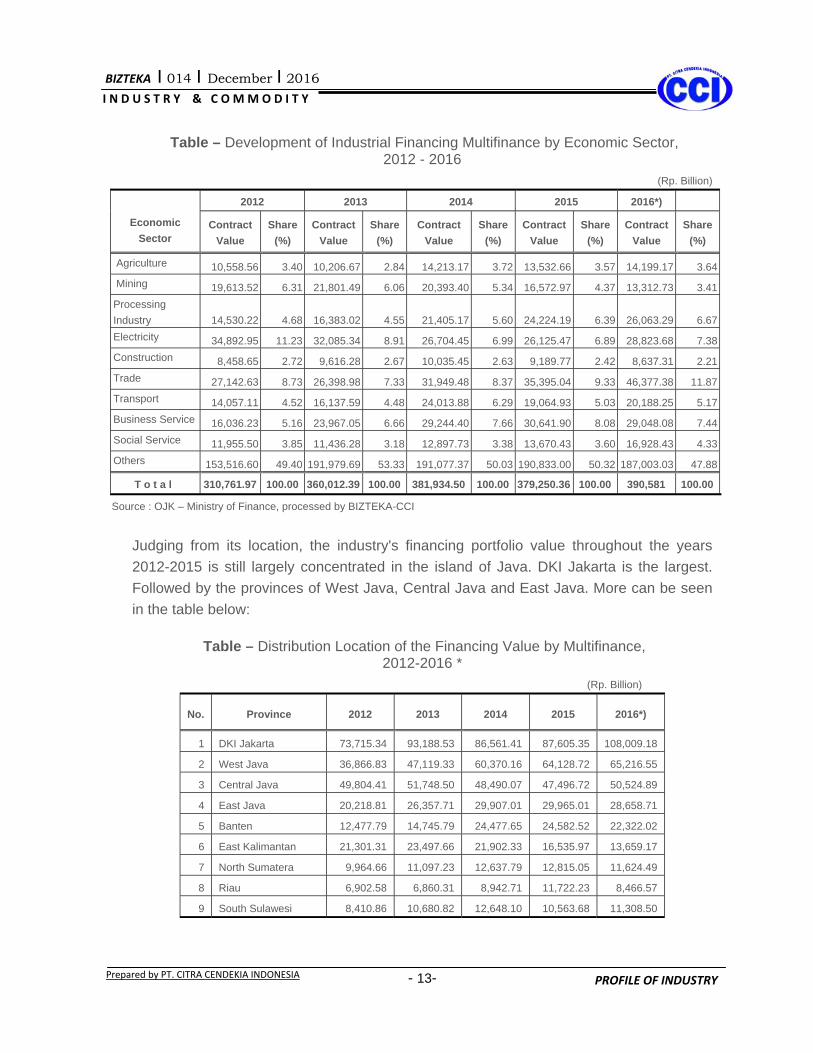
Table – Development of Industrial Financing Multifinance by Economic Sector, 2012 - 2016
T o t a l 310,761.97 100.00 360,012.39 100.00 381,934.50 100.00 379,250.36 100.00 390,581 100.00
Source : OJK – Ministry of Finance, processed by BIZTEKA-CCI
Judging from its location, the industry's financing portfolio value throughout the years 2012-2015 is still largely concentrated in the island of Java. DKI Jakarta is the largest. Followed by the provinces of West Java, Central Java and East Java. More can be seen in the table below:
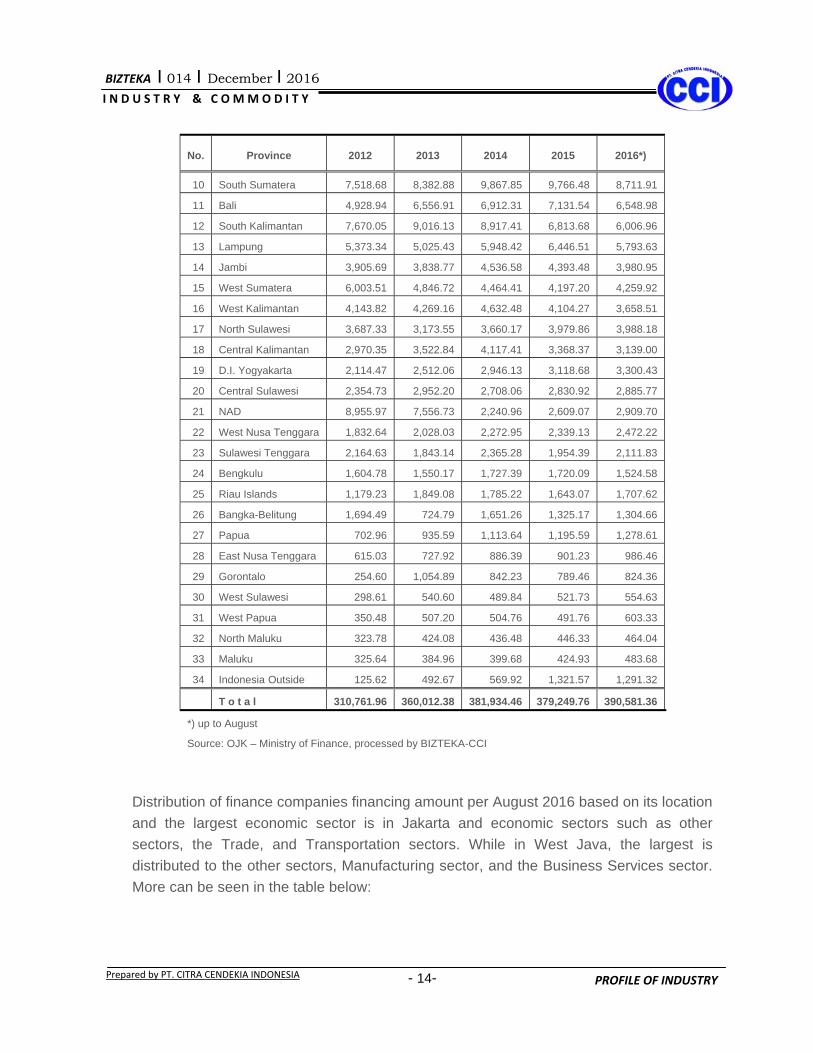
Table – Distribution Location of the Financing Value by Multifinance, 2012-2016 *
(Rp. Billion)
No. Province 2012 2013 2014 2015 2016*)
1 DKI Jakarta 73,715.34 93,188.53 86,561.41 87,605.35 108,009.18
2 West Java 36,866.83 47,119.33 60,370.16 64,128.72 65,216.55
3 Central Java 49,804.41 51,748.50 48,490.07 47,496.72 50,524.89
4 East Java 20,218.81 26,357.71 29,907.01 29,965.01 28,658.71
28 East Nusa Tenggara 615.03 727.92 886.39 901.23 986.46
29 Gorontalo 254.60 1,054.89 842.23 789.46 824.36
30 West Sulawesi 298.61 540.60 489.84 521.73 554.63
31 West Papua 350.48 507.20 504.76 491.76 603.33
32 North Maluku 323.78 424.08 436.48 446.33 464.04
33 Maluku 325.64 384.96 399.68 424.93 483.68
34 Indonesia Outside 125.62 492.67 569.92 1,321.57 1,291.32
T o t a l 310,761.96 360,012.38 381,934.46 379,249.76 390,581.36
*) up to August
Source: OJK – Ministry of Finance, processed by BIZTEKA-CCI Distribution of finance companies financing amount per August 2016 based on its location and the largest economic sector is in Jakarta and economic sectors such as other sectors, the Trade, and Transportation sectors. While in West Java, the largest is distributed to the other sectors, Manufacturing sector, and the Business Services sector. More can be seen in the table below:
BIZTEKA I 014 I December I 2016
- 15-
I N D U S T R Y & C O M M O D I T Y
Prepared by PT. CITRA CENDEKIA INDONESIA PROFILE OF INDUSTRY
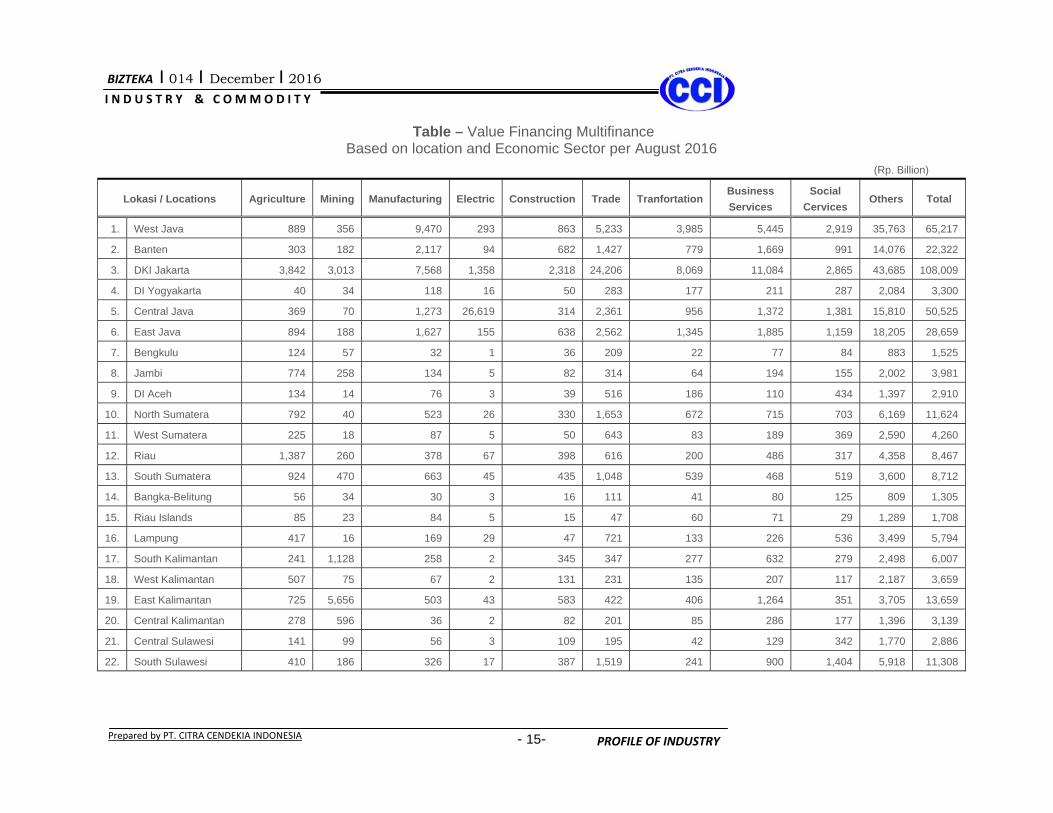
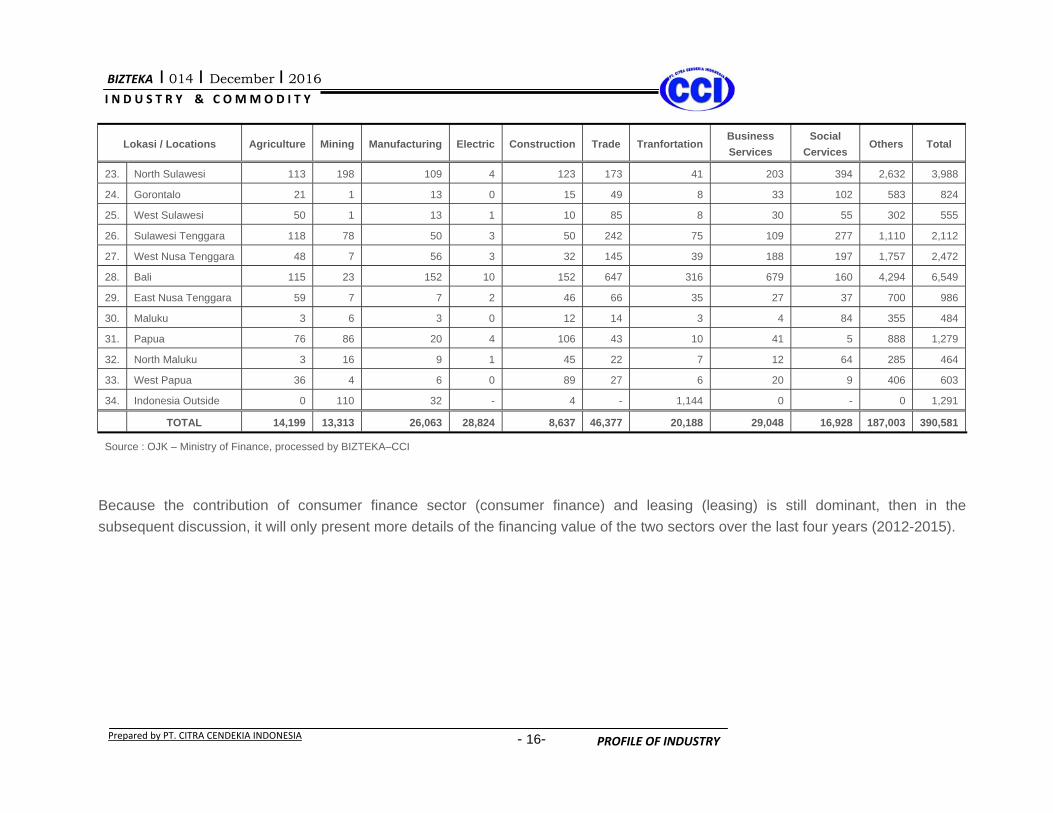
Table – Value Financing Multifinance Based on location and Economic Sector per August 2016
(Rp. Billion)
Lokasi / Locations Agriculture Mining Manufacturing Electric Construction Trade Tranfortation Business Services
Source : OJK – Ministry of Finance, processed by BIZTEKA–CCI
Because the contribution of consumer finance sector (consumer finance) and leasing (leasing) is still dominant, then in the subsequent discussion, it will only present more details of the financing value of the two sectors over the last four years (2012-2015).
BIZTEKA I 014 I December I 2016
- 17-
I N D U S T R Y & C O MM O D I T Y
Prepared by PT. CITRA CENDEKIA INDONESIA PROFILE OF INDUSTRY
FINANCE VALUE / ACCOUNTS DETAILS VALUE OF LEASING
A. Value Financing Leasing
By Economic Sector In the four-year period (2012 - 2015), leasing finance portfolio in Indonesia is still dominated by the electricity and mining sectors. If viewed from the economic sector, during this time the value of financing leasing in Indonesia is grouped in several sectors; agriculture, mining, manufacturing, electricity / gas / water, construction, trade, transport, the business services, social services, and other sectors. Based on information from the FSA - the Ministry of Finance within a period of four years, the value of the business financing extended lease (leasing) in Indonesia remain largely channeled into the electricity sector. During the period, the value of financing channeled to sectors of electricity is on average about 25% of the total value of leasing financing annually. If in 2012 the value of leasing financing to the power sector is Rp.33.31 trillion, then in 2013 dropped to Rp 31.73 trillion. Although the value of leasing financing to electricity sector in the next two years declined due to macro-economic conditions, but the overall value of financing for power sector remains the largest compared to other economic sectors. Another sector getting a large enough portfolio of the leasing industry in Indonesia is the mining sector. The amount of financing channeled to this sector ranked second in the period 2012-2015 an average of approximately 15.34% of the total value of financing annually. If in 2012 the value of financing leasing for the Mining sector amounted to Rp 17.92 trillion, then in 2013 it increased to Rp 20.48 trillion. As electricity sector, the value of the distribution to the mining sector in 2014 and 2015 decreased respectively to Rp. 18.25 trillion and Rp. 14.57 trillion. The third position getting sizeable portfolio of the leasing industry in Indonesia is the processing industry sector. In the period 2012-2015 the value of the leasing industry channeled to the sector is about 11.28% of the total value of financing annually.
BIZTEKA I 014 I December I 2016
- 18-
I N D U S T R Y & C O MM O D I T Y
Prepared by PT. CITRA CENDEKIA INDONESIA PROFILE OF INDUSTRY
If in 2012 the value of financing leasing for Processing Industry is Rp 10.44 trillion, then in 2013 it slightly increased to Rp 12.55 trillion, and increased again to around Rp 14.46 trillion, and rose again to Rp. 14.82 trillion in 2015. Here is the development of the value of lease financing (leasing) in Indonesia, based on the economic sector during 2012-2015.
Table – Development of leasing By Economic Sector, 2012 - 2015 (Rp Billion)
T o t a l 109,149.86 100.00 123,382.69 100.00 118,360.49 100.00 112,572.73 100.00 Source: OJK – Ministry of Finance, processed by BIZTEKA-CCI
B. Value Financing Leasing
By Distribution Regions Seen from its distribution area, the leasing portfolio in Indonesia is still concentrated in Java, especially in Jakarta and Central Java. Based on data from the FSA - the Ministry of Finance, during this time Jakarta is indeed the biggest distribution center of the financing of the leasing business. It is strongly associated with the status of Jakarta as the country's capital, the center of business, and is the most rapid development. But in 2012, Central Java is the highest position as the region getting disbursement of financing leasing. Based on the information the FSA - the Ministry of Finance, in the period 2012-2015 the value of financing provided for the Jakarta area by an average of approximately 25.6% of the total value of leasing each year. If in 2012 the value of leasing financing channeled to
BIZTEKA I 014 I December I 2016
- 19-
I N D U S T R Y & C O MM O D I T Y
Prepared by PT. CITRA CENDEKIA INDONESIA PROFILE OF INDUSTRY
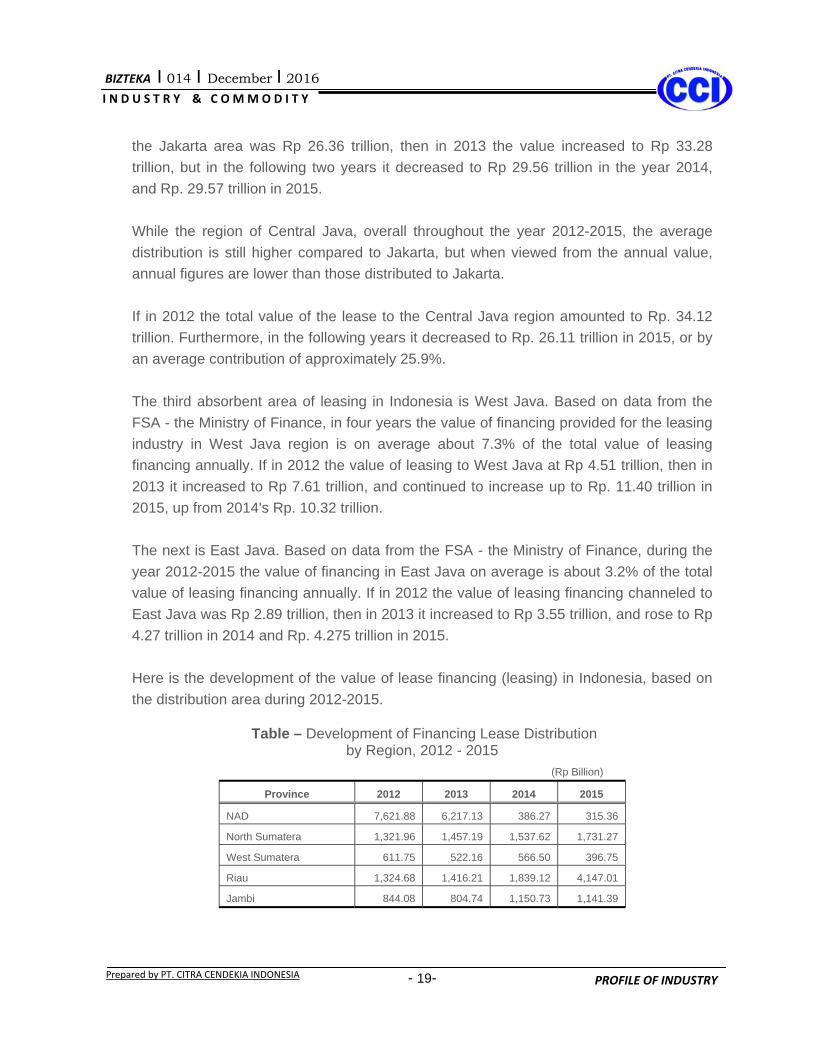
the Jakarta area was Rp 26.36 trillion, then in 2013 the value increased to Rp 33.28 trillion, but in the following two years it decreased to Rp 29.56 trillion in the year 2014, and Rp. 29.57 trillion in 2015. While the region of Central Java, overall throughout the year 2012-2015, the average distribution is still higher compared to Jakarta, but when viewed from the annual value, annual figures are lower than those distributed to Jakarta. If in 2012 the total value of the lease to the Central Java region amounted to Rp. 34.12 trillion. Furthermore, in the following years it decreased to Rp. 26.11 trillion in 2015, or by an average contribution of approximately 25.9%. The third absorbent area of leasing in Indonesia is West Java. Based on data from the FSA - the Ministry of Finance, in four years the value of financing provided for the leasing industry in West Java region is on average about 7.3% of the total value of leasing financing annually. If in 2012 the value of leasing to West Java at Rp 4.51 trillion, then in 2013 it increased to Rp 7.61 trillion, and continued to increase up to Rp. 11.40 trillion in 2015, up from 2014's Rp. 10.32 trillion. The next is East Java. Based on data from the FSA - the Ministry of Finance, during the year 2012-2015 the value of financing in East Java on average is about 3.2% of the total value of leasing financing annually. If in 2012 the value of leasing financing channeled to East Java was Rp 2.89 trillion, then in 2013 it increased to Rp 3.55 trillion, and rose to Rp 4.27 trillion in 2014 and Rp. 4.275 trillion in 2015. Here is the development of the value of lease financing (leasing) in Indonesia, based on the distribution area during 2012-2015.
Table – Development of Financing Lease Distribution by Region, 2012 - 2015
(Rp Billion)
Province 2012 2013 2014 2015
NAD 7,621.88 6,217.13 386.27 315.36
North Sumatera 1,321.96 1,457.19 1,537.62 1,731.27
West Sumatera 611.75 522.16 566.50 396.75
Riau 1,324.68 1,416.21 1,839.12 4,147.01
Jambi 844.08 804.74 1,150.73 1,141.39
BIZTEKA I 014 I December I 2016
- 20-
I N D U S T R Y & C O MM O D I T Y
Prepared by PT. CITRA CENDEKIA INDONESIA PROFILE OF INDUSTRY
Province 2012 2013 2014 2015
South Sumatera 1,235.41 1,488.45 3,176.70 2,937.39
Bengkulu 387.59 374.25 319.95 242.96
Lampung 519.81 666.05 671.57 934.50
Bangka-Belitung 325.24 176.98 212.18 131.49
Riau Islands 227.82 594.54 449.61 349.09
DKI Jakarta 26,362.05 33,285.59 29,559.18 29,574.91
West Java 4,512.09 7,613.38 10,322.61 11,401.53
Central Java 34,119.65 32,607.11 26,802.34 26,117.36
D.I. Yogyakarta 139.29 185.85 160.84 133.00
East Java 2,891.22 3,550.95 4,274.41 4,275.00
Banten 1,693.79 2,350.49 7,605.03 6,318.27
Bali 451.57 632.48 755.51 729.43
West Nusa Tenggara 74.17 106.89 134.81 139.38
East Nusa Tenggara 43.97 64.89 68.95 110.17
West Kalimantan 990.84 1,052.46 1,239.71 939.26
Central Kalimantan 1,226.16 1,617.03 1,854.80 1,197.82
South Kalimantan 3,337.06 4,158.59 4,586.52 2,997.91
East Kalimantan 16,279.56 17,835.00 15,627.81 10,700.75
North Sulawesi 385.10 452.06 566.73 563.93
Central Sulawesi 387.37 847.90 886.59 710.36
South Sulawesi 732.06 1,368.09 1,660.13 1,561.05
Sulawesi Tenggara 367.42 588.16 569.51 502.88
Gorontalo 74.53 124.51 76.13 96.26
West Sulawesi 21.63 57.65 56.16 70.47
Maluku 43.93 47.74 51.83 71.55
North Maluku 169.73 209.71 162.57 156.63
West Papua 178.66 185.22 106.19 130.27
Papua 201.80 328.79 398.14 426.81
Di luar Indonesia 46.01 394.46 523.74 1,319.98
T o t a l 109,149.88 123,382.70 118,360.49 112,572.19
Source : OJK – Ministry of Finance, processed by BIZTEKA-CCI
BIZTEKA I 014 I December I 2016
- 21-
I N D U S T R Y & C O MM O D I T Y
Prepared by PT. CITRA CENDEKIA INDONESIA PROFILE OF INDUSTRY
DETAILS OF CONSUMER FINANCE VALUE A. Value of Consumer Financing
by Economic Sector In contrast to the business lease (leasing) that is largely dominated finance portfolio for business activities, the consumer finance business (consumer finance) is almost the majority, or approximately 70.6% of the value of financing provided is to the other sectors, which are expected to meet personal needs of the public (households). Judging from the type of capital goods, consumer finance sector in Indonesia is grouped into five types of capital goods, namely motor vehicles, houses, tools, home appliances, electronic goods, and other items (excluded the four types of groups mentioned). However, data from the FSA - The Ministry of Finance does not specify capital goods as mentioned above, the portion of which approximately 70.6% is predicted for the personal needs of the community, most of whch are motor vehicles (motorcycles and four-wheeled vehicles). If in 2012 the value of consumer financing for other sectors is Rp. 142.28 trillion, then in 2013 it rose to Rp 172.88 trillion, up 21.5%. But in the years following the financing value to other sectors tended to decrease, Rp. 172.86 trillion in 2014 and Rp. 168.83 trillion in 2015. This condition is in line with sales of motor vehicles (cars and motorcycles) during the year 2012-2015 that tended to decrease. Data Gaikindo showed car sales in 2012 totaled 1.12 million units, in 2013 rose 10.2% to 1.23 million units. Then in 2014 sales dropped, and even sales in 2015 fell sharply which is down 16.1% to 1.01 million units. Motorcycle sales in 2012 recorded 7.06 million units, in 2013 rose to 7.74 million units, up 9.6%. In 2014 sales still rose, despite 1.6%. While 2015 sales of motorcycles fell quite high at 17.6% to 6.48 million units. Although financing for these types of motor vehicles continued to decline during 2014-2015, motor vehicle sector (automotive) remains the biggest market for consumer finance business in Indonesia. If the Indonesian economy was recovered, market finance industry in the automotive sector is predicted to wide open, both cars (sedan and commerce) or motorcycles.
BIZTEKA I 014 I December I 2016
- 22-
I N D U S T R Y & C O MM O D I T Y
Prepared by PT. CITRA CENDEKIA INDONESIA PROFILE OF INDUSTRY
Financing industry has a promising chance both for new and used cars (under five years and I a good condition). Financing for used cars have become trend a few years ago, where a number of finance companies began distributing the funds to finance the public who want to buy used cars. Some automotive analysts said that the used car market in Indonesia is quite large, and become a potential area for finance companies. Meanwhile, other types of capital goods from the consumer finance industry in Indonesia are still very limited in number. This is because most are still tilled by the banking sector (especially for home loans). As for the financing of goods outside the automotive and home products that are relatively inexpensive (such as electronic goods and household appliances), most are handled directly by the store goods. Trade sector also includes the one that gets large enough consumer finance, which in the period 2012-2015 an average of about 7.9%, from Rp. 13.07 trillion in 2012, then in 2013 was down slightly, but the following year it surged to Rp. 23.46 trillion, and in 2015 rose to Rp. 26.09 trillion, up 11.2%. Here is the development of the value of consumer financing in Indonesia, based on the economic sector during 2012-2015.
Table – Development of Consumer Financing By Economic Sector, 2012 - 2015
T o t a l 196,557.64 180.08 228,546.97 185.23 253,463.42 214.15 255,121.05 226.63 Source : OJK – Ministry of Finance, processed by BIZTEKA-CCI
BIZTEKA I 014 I December I 2016
- 23-
I N D U S T R Y & C O MM O D I T Y
Prepared by PT. CITRA CENDEKIA INDONESIA PROFILE OF INDUSTRY
B. Consumer Finance Value By Distribution Regions
As the finance portfolio on the leasing industry, consumer finance portfolio in Indonesia is still concentrated in Java, especially Jakarta. Based on data from the FSA - the Ministry of Finance, Jakarta is the largest distribution center of the consumer finance industry. It is strongly associated with the presence of Jakarta as the center of the course of business, where the per capita income level of the people is relatively so that the purchasing power of people to automotive products is also relatively higher. Based on data from the FSA - the Ministry of Finance, during the period 2012-2015 the value of consumer financing to Jakarta is an average about 68.86% of the total value of consumer financing annually. If in 2012 the value of consumer financing to Jakarta reached Rp 43.15 trillion, and in 2013 rose to Rp. 52.92 trillion, it declined up to Rp 48.33 trillion in 2014 and Rp. 47.83 trillion in 2015, or by an average contribution of 20.7%. The second largest area of consumer finance in Indonesia after Jakarta, is West Java. In the years 2012-2015 the value of consumer financing to West Java an average about 18.4% of the total value of consumer financing annually. In contrast to the area of Jakarta, the total value of consumer financing in West Java in four years continued to rise each year, from Rp 32.07 trillion in 2012, rose to Rp. 49.54 trillion in 2014, and in 2015 its value went up to Rp. 52.39 trillion, or 5.8% up. The third largest area of consumer finance in Indonesia after Jakarta and West Java is East Java. During the period 2012-2015 the value of consumer financing for East Java an average is about 9.7% of the total value of consumer financing annually. In 2012 the value of customer financing to East Java reached Rp 17.21 trillion. Then in subsequent years it continued to rise, Rp. 22.71 trillion in 2013 and Rp. 25.50 trillion in 2015. Here is the development of consumer finance value (consumer finance) in Indonesia, based on the distribution area during 2012-2015.
Table – Development of Consumer Financing By Provinces, 2012 - 2015
(Rp Billion)
Province 2012 2013 2014 2015
NAD 1,334.09 1,339.61 1,854.69 2,276.99
North Sumatera 8,595.64 9,640.03 11,080.26 11,083.78
BIZTEKA I 014 I December I 2016
- 24-
I N D U S T R Y & C O MM O D I T Y
Prepared by PT. CITRA CENDEKIA INDONESIA PROFILE OF INDUSTRY
Province 2012 2013 2014 2015
West Sumatera 5,391.76 4,287.74 3,858.11 3,792.97
Riau 5,565.64 5,438.88 7,103.59 7,575.22
Jambi 3,061.27 3,022.62 3,381.40 3,237.84
South Sumatera 6,257.25 6,886.98 6,671.03 6,724.50
Bengkulu 1,173.40 1,136.12 1,407.44 1,477.13
Lampung 4,853.36 4,359.37 5,249.01 5,500.58
Bangka-Belitung 1,362.98 546.95 1,432.91 1,192.96
Riau Islands 951.41 1,254.54 1,335.61 1,293.97
DKI Jakarta 43,146.36 52,923.50 48,335.72 47,834.77
West Java 32,073.29 39,162.93 49,541.51 52,390.54
Central Java 15,673.22 19,060.55 21,646.52 21,355.51
West Nusa Tenggara 1,758.47 1,921.14 2,138.14 2,199.75
East Nusa Tenggara 571.06 663.09 817.45 791.06
West Kalimantan 3,117.90 3,186.07 3,388.28 3,156.03
Central Kalimantan 1,740.04 1,905.81 2,262.60 2,170.56
South Kalimantan 4,268.13 4,937.25 4,259.43 3,798.81
East Kalimantan 4,998.03 5,533.79 6,231.21 5,762.98
North Sulawesi 3,302.22 2,721.48 3,093.45 3,409.66
Central Sulawesi 1,967.36 2,093.79 1,804.55 2,120.57
South Sulawesi 7,673.10 9,285.99 10,981.79 8,998.62
Sulawesi Tenggara 1,786.26 1,254.98 1,795.77 1,451.51
Gorontalo 180.07 913.91 766.10 693.20
West Sulawesi 276.99 482.95 433.68 451.27
Maluku 281.71 334.22 347.86 353.38
North Maluku 154.05 214.37 273.91 289.70
West Papua 171.82 318.29 398.57 361.49
Papua 501.16 606.79 715.50 738.78
Indonesia outside 71.73 63.37 5.55 1.59
T o t a l 196,558.62 228,647.02 253,463.42 255,121.00 Source: OJK – Ministry of Finance, processed by BIZTEKA-CCI
BIZTEKA I 014 I December I 2016
- 25-
I N D U S T R Y & C O MM O D I T Y
Prepared by PT. CITRA CENDEKIA INDONESIA PROFILE OF INDUSTRY
DEVELOPMENT FUNDING SOURCE The funding source for the finance industry in Indonesia during this time is mostly from the banking sector. At the beginning of its development, a finance company in Indonesia is not restricted in an effort to get the funds. However, starting from the beginning of 1996, the company engaged in the financing industry can no longer enjoy the freedom the search for funds from the bank. This is related to the issuance of the Minister of Finance Decree No. 606 / KMK.017 / 1995 on the provision of loans received, and the reporting of finance companies. As well as the Joint Decree of the Minister of Finance and BI No. 607 / KMK.017 / 1995 and 28/9 / KEP / GBI concerning the supervision of finance companies by BI. Efforts supervision by BI since 1996 because the financing company became an agent for banks to extend credit for their own business group. It is closely linked with the regulations issued by the Government of the Lending Limit (LLL). To anticipate the chances of collusion between banks and finance companies, the government needs to conduct surveillance for finance companies. Trouble finding funding to strengthen the capital structure for a financing company in Indonesia is more so since the crisis in mid-1997. The Bank did not freely disburse funds as a source of primary capital to financial institutions. The banking sector performance became worse during the crisis. The surge in lending rates and ballooning bad loans became a major factor for financing companies to obtain funding from banks. The difficulty of getting the disbursement of this funding is mainly felt by the majority of national private companies. Meanwhile the joint venture conditions are still better, because they are generally still able to obtain funding from their parent companies abroad. In addition, the joint venture is also easier to obtain funding sources from abroad (offshore loan), whether from banks or non-bank financial institutions. So in general, the funding source of multifinance comes from subordinated loans, issuance of securities, domestic or overseas loans sourced from banks and / or other business entities. Based on data from the FSA - the Ministry of Finance during the 2012 - 2015 funding sources of finance companies are largely from domestic and foreign loans.
BIZTEKA I 014 I December I 2016
- 26-
I N D U S T R Y & C O MM O D I T Y
Prepared by PT. CITRA CENDEKIA INDONESIA PROFILE OF INDUSTRY
Sources of funding from domestic loans in 2012 recorded at Rp. 124.54 trillion, or with a portion of 48.8%, in 2013 rose to Rp. 142.11 trillion or 47.85% portion. Furthermore, in 2014 and 2015 funding from domestic loans continued to fall to Rp. 140.73 trillion in 2014, and in 2015 it decreased again to Rp. 137.7 trillion. While the funding source of foreign loans which ranked second largest of Rp. 86.61 trillion in 2012, jumped to Rp. 101.24 trillion in 2013, and up again to Rp. 114.34 trillion in 2014. While in 2015 it decreased to Rp. 107.21 trillion, or with a portion of 35%. Funding from securities issuance increased in the period 2012-2015. In 2012 it reached Rp. 43.77 trillion, then in 2013 increased to Rp. 53.21 trillion, and in 2014 recorded at Rp. 53.16 trillion, even in 2015 increased to Rp. 60.79 trillion, with a contribution of 19.85%. Here is the development of the loan proceeds for financing industry in Indonesia, during 2012-2015.
Table – Business Development Funding Sources For Multifinance In Indonesia, 2012-2015
(Rp Trillion)
Funding Sources 2012 2013 2014 2015
Subordinated Loans 0.24 0.4 0.41 0.57
Share (%) 0.09 0.13 0.13 0.19
Issuance of Securities 43.77 53.21 53.16 60.79
Share (%) 17.15 17.92 17.22 19.85
Foreign Loans 86.61 101.24 114.34 107.21
Share (%) 33.94 34.09 37.05 35.01
Domestic Loans 124.54 142.11 140.73 137.7
Share (%) 48.81 47.85 45.60 44.96
T o t a l 255.16 296.96 308.64 306.27
100.00 100.00 100.00 100.00
Source : OJK – Ministry of Finance, processed by BIZTEKA- CCI
BIZTEKA I 014 I December I 2016
- 27-
I N D U S T R Y & C O MM O D I T Y
Prepared by PT. CITRA CENDEKIA INDONESIA PROFILE OF INDUSTRY
CAPITAL FINANCE COMPANY As noted earlier, the toughest problems in the finance industry in Indonesia is the lack of capital. Moreover, the Financial Services Authority (FSA) since 2015 required that the finance company in limited liability (PT) must have a minimum capital of Rp. 100 billion in stages. Previously, the minimum capital adequacy fulfilled by the finance company is only Rp. 25 billion, and a minimum capital of Rp. 50 billion if it is a cooperative. Although it has already been effective in 2015, supervision of the financial industry and banking in Indonesia is still giving a five-year period for the finance company to meet the obligations of a minimum capital of Rp. 100 billion in stages. In 2016, the finance company must have a minimum capital of Rp. 40 billion. In 2019 there is no longer the companies that have paid-up capital of less than Rp. 100 billion. The minimum capital requirement indicates that the company's financial structure should be healthy financing, so that banks do not hesitate to disburse the funds. Facing the problem of the lack of capital (especially for national private finance companies), APPI has long suggested that the Government or in this case Bank Indonesia to further ease the requirements of bank lending to the industrial financing sector. APPI also suggested that financial institutions may publish commercial paper to help its capital structure. APPI and a leasing company executives also suggested the Government try other alternatives (outside banks) in terms of disbursement of funds for financial institutions. The government could use the funds from the insurance company or pension fund of the institution. By allowing the finance industry to access funds from insurance and pension institutions, then the problem of scarcity of funding can be overcome with the medium-term funding instruments.
BIZTEKA I 014 I December I 2016
- 28-
I N D U S T R Y & C O MM O D I T Y
Prepared by PT. CITRA CENDEKIA INDONESIA PROFILE OF INDUSTRY
FINANCIAL PERFORMANCE DEVELOPMENT OF FINANCE INDUSTRY
As noted, the growth of the finance industry (finance) in Indonesia since the 2014 slowdown. This condition is caused by global economic turmoil impact on the weakening national economy, thus affecting the performance of finance companies in the past two years. Based on data from the FSA - the Ministry of Finance, a number of indicators of the financial performance of Indonesian finance industry before the 2014 growing quite well, by 2014 the growth began to slow. Financial indicators showing a slowdown growth of mutifinance include total assets, total equity, the value of financing, as well as net profit. The total assets of the entire company's finance Indonesia in 2012 reached Rp 341.77 trillion, then jumped to Rp 400.63 trillion in 2013. The total assets increased up to Rp. 425.71 trillion in 2015. While the data until August 2016 total assets is recorded at Rp. 374.06 trillion. Meanwhile, the total equity (capital) continued to increase in recent years. If in 2012 the total equity was Rp 66.72 trillion, then a year later increased to Rp. 82.75 trillion, and it recorded Rp. 96.01 trillion in 2015. On the other hand the value of financing of Indonesia’s finance industry development seems to be increasing in recent years. If in 2012 the value of financing amounted to Rp 310.76 trillion, then a year later increased to Rp. 360.01 trillion, and continued to be Rp. 381.93 trillion in 2014. Meanwhile, in 2015 the value of financing decreased, ie to Rp. 379.25 trillion. But along with the improvement in the national economy, the value of financing in 2016 (data until August) has exceeded the value of financing in 2015. Meanwhile, the total net profit of Indonesian finance industry also began to improve in 2015. If in 2012 the finance industry still recorded a net profit of Rp 12.16 trillion, then a year later increased to Rp. 14.47 trillion. in 2014 net profit fell, lower than profit in 2013. Similarly in 2015 and 2016 (data until August).
BIZTEKA I 014 I December I 2016
- 29-
I N D U S T R Y & C O MM O D I T Y
Prepared by PT. CITRA CENDEKIA INDONESIA PROFILE OF INDUSTRY
The development of the finance industry performance indicators Indonesia during 2012 - 2016 are as follows.
Tabel - Financial Performance Development of Financing (Multifinance) Industry In Indonesia, 2012-2016
(In Trillion Rupiah)
Indicators 2012 2013 2014 2015 2016*
Total Asset 341.77 400.63 420.44 425.71 374.06 Total Equity 66.72 82.75 87.41 96.01 t.d. Financing Value 310.76 360.01 381.93 379.25 390.58 Profit (Loss) 12.16 14.47 12.22 10.67 7.76
*) Until August t.d. = no data Source: OJK - Ministry of Finance, Processed BIZTEKA-CCI
FINANCE INDUSTRY (MULTIFINANCE) OUTLOOK IN INDONESIA
Despite some slowdown in growth in the last two years, the finance industry in Indonesia in the coming years is still growing. The sign has been considered since 2016. One indicator of the improving finance business in Indonesia is the value of the financing, which until August 2016 reached Rp. 390.58 trillion, which means it is exceeded the value of the financing achieved throughout 2015. Other indicators that may affect the industry's business is the running national economic recovery, the successful tax amnesty program, the low bank interest rates, accelerating the development of infrastructure, and increase public confidence. As one of the non-bank financial institutions, financial industry is believed to still be interested in the community considering the few advantages compared to the banking sector. Moreover, over 80% of purchases of motor vehicles in Indonesia is done by a credit system, and consumers generally prefer finance company to banking. Nevertheless, competition in the market is still on the banking sector. The banking sector has long disbursed credit, especially credit Small and Medium Enterprises (SMEs) and multipurpose loans (consumer loans). The intense competition is unavoidable, given the interest rate offered by the banking sector is relatively lower than the interest rate given finance industry.
BIZTEKA I 014 I December I 2016
- 30-
I N D U S T R Y & C O MM O D I T Y
Prepared by PT. CITRA CENDEKIA INDONESIA PROFILE OF INDUSTRY
But on the other hand the finance industry also has some distinct advantages compared to the banking sector, the requirements are relatively easier (such as collateral requirements were not asked), and the procedure is simpler than banking. Finance companies also assessed more quickly in terms of providing lending to their customers than banks that are much more cautious and bureaucratic. Finance industry has to be more innovative in developing its business in order to better compete with the banking industry. The relatively large Indonesia's automotive market is a promising market for the finance industry, despite the recent sales decline. But in the future automotive market in Indonesia will be recovering. If the Indonesian economy improved in the next few years, the automotive market will re-open wide, given its automotive market is the biggest market for consumer finance business (consumer finance). Heavy equipment industry is a good market for lease (leasing) business, the demand for heavy equipment in Indonesia is expected to increase again in the coming years. Other sectors are financing other than motor vehicles. In addition to the new auto market, the opportunities for financing industry is also in the used car market (under five year car and in a good condition). Financing for used cars has become trend since several years ago, where a number of finance companies distributing the funds to finance people who buy used cars (second hand). Some automotive analysts said that the used car market in Indonesia is quite large, and become a potential area for finance companies. Nevertheless the finance industry also has to face the toughest obstacles; the problem of capital. Faced with that problem, Indonesian Financial Services Association (IFSA) will continue working to make that obstacle can be overcome. APPI seek BI more ease lending requirements of banks to financing industry sector. In addition APPI also suggested that the Government try other alternatives (outside banks) in the disbursement of funds for the finance institutions, such as the use of funds from the insurance company or the pension institution. Some finance companies are optimistic that the finance business climate in 2017 and the coming year will be better, and it is started in 2016. PT. Mandiri Tunas Finance (MTF) for example, the company is focusing its finance portfolio in the new car segment, and set a target of financing growth of 11% in the year 2017. Business strategy to achieve the target is by developing a network to several regions in Indonesia.
BIZTEKA I 014 I December I 2016
- 31-
I N D U S T R Y & C O MM O D I T Y
Prepared by PT. CITRA CENDEKIA INDONESIA PROFILE OF INDUSTRY
In addition, the subsidiary of PT. Bank Mandiri (Persero) Tbk., will alsol improve the status of satellite offices that have rapid growth market into branch offices. The company will also strengthen marketing through telemarketing team for credit products and multipurpose vehicles. Similar optimism is also delivered by PT. Andalan Finance, which targets the financing to grow about 20% in 2017. Finance portfolio companies focus on the segment of used car and target to Rp. 3.4 trillion. Assuming a growth of 20%, then the financing target in 2017 is estimated to reach Rp. 4.1 trillion. To encourage financing in 2017, the company will actively approach the used car dealership, and increase market penetration by opening new sales points. Apart from all the above factors, the prospect of financing industry in Indonesia will not be separated from the development of the overall macro-economic conditions, as well as the political and security situation in the country. If the Government has consistently implemented the economic recovery program and is able to control the social and political upheavals in the country, then it certainly will be a positive impact on various financial business in Indonesia, including the finance industry.
CONCLUSION As one alternative to non-bank financing, the finance industry is a potential business that continues to grow in Indonesia. Finance business development in Indonesia is largely determined by the development of the motor vehicle market as well as other factors such as competition with banks, and regulation by the government. Based on data from the FSA - the Ministry of Finance, the total value of the financing by the Indonesian finance industry continues to increase throughout the year 2012-2016, except 2015 which decreased only 0,7%. The decrease was due to a slowing national economy. The decline in the value of the financing by the finance industry occurred in the leasing (lease) business sector, and consumer finance both of which are the mainstay of finance business. While the contribution of financing in the credit card and factoring is relatively small. The toughest problem in the finance industry is capital. FSA - The Ministry of Finance as an institution that oversees the business required the finance companies have a minimum capital of Rp. 100 billion until 2019 to come.
BIZTEKA I 014 I December I 2016
- 32-
I N D U S T R Y & C O MM O D I T Y
Prepared by PT. CITRA CENDEKIA INDONESIA PROFILE OF INDUSTRY
Faced with this problem, the Indonesian Financial Services Association (IFSA) urged BI more ease lending requirements of banks to financing industry sector. In addition APPI also suggested that the Government seek other alternatives (non banks) to disburse funds for finance institutions from the insurance company or pension fund institution. Having to compete with the banking, finance industry has its own advantages in ease of procedures and requirements than banks. Automotive growth lately is a potential market for the finance industry. If the Indonesian economy improved in the next few years, the automotive market is expected to be back open, given its automotive market is the biggest market for consumer finance business. Heavy equipment industry is a good market for the lease (leasing) business, the demand for heavy equipment in Indonesia in the coming years is expected to rise in line with the vigorous development of infrastructure in Indonesia. In addition to the new auto market, the opportunities for financing industry is also in the used car market (under five year car and in a good condition). Financing for used cars has become trend since several years ago, where a number of finance companies distributing the funds to finance people who buy used cars (second hand). Some automotive analysts said that the used car market in Indonesia is quite large, and become a potential area for finance companies. Nevertheless the finance industry also has to face the toughest obstacles; the problem of capital. Faced with that problem, Indonesian Financial Services Association (IFSA) will continue working to make that obstacle can be overcome. APPI seek BI more ease lending requirements of banks to financing industry sector. In addition APPI also suggested that the Government try other alternatives (outside banks) in the disbursement of funds for the finance institutions, such as the use of funds from the insurance company or the pension institution. Apart from all the above factors, the prospect of financing industry in Indonesia will not be separated from the development of the overall macro-economic conditions, as well as the political and security situation in the country. If the Government has consistently implemented the economic recovery program and is able to control the social and political upheavals in the country, then it certainly will be a positive impact on various financial business in Indonesia, including the finance industry.
BIZTEKA I 014 I December I 2016
- 33-
I N D U S T R Y & C O MM O D I T Y
Prepared by PT. CITRA CENDEKIA INDONESIA PROFILE OF COMPANY
PROFILE OF COMPANY
ADIRA DINAMIKA MULTI FINANCE Tbk., PT D I Editors
A d d r e s s
Head Office GEDUNG THE LANDMARK TOWER, 26-31th Floor Jalan Jend. Sudirman No.1 Jakarta 12910 DKI Jakarta Phones - (021) 52963232-3322 Fax. - 021 – 52964159 E-mail [email protected] Website - http://www.adira.co.id
Date of Establishment 13 November 1990
Legal Status PT. (Perseroan Terbatas) or Limited Liability Company
Category Public Listed Company
P e r m i t s The Department of Industry No. C2-19.HT.01.01.TH.1991 Dated 08 January 1991 No. AHU-0935663.AH.01.02 TH.2015 Dated 22 May 2015
Lines of Business - Consumer Financing - Factoring - Rent
Shareholders a. PT Bank Danamon Indonesia Tbk b. PT Asuransi Adira Dinamika c. The Publics
Capitalization Authorized Capital - Rp 400,000,000,000.- Issued Capital - Rp 100,000,000,000.- Paid Up Capital - Rp 100,000,000,000.-
BIZTEKA I 014 I December I 2016
- 34-
I N D U S T R Y & C O MM O D I T Y
Prepared by PT. CITRA CENDEKIA INDONESIA PROFILE OF COMPANY
Total Assets : 2013 – Rp 30,994,411,000,000.- 2014 – Rp 29,930,882,000,000.- 2015 – Rp 27,744,207,000,000.- 2016 – Rp 22,012,384,000,000.- (Januari-September) Net Profits : 2013 – Rp 1,695,518,000,000.- 2014 – Rp 745,584,000,000.- 2015 – Rp 723,114,000,000.- 2016 – Rp 849,917,000,000.- (Januari – September) Sales Turnover/Revenues: 2013 – Rp 8,064,626,000,000.- 2014 – Rp 8,251,148,000,000.- 2015 – Rp 8,063,757,000,000.- 2016 – Rp 6,233,117,000,000.- (Januari-September)
B a n k e r s
a. PT Bank MANDIRI Tbk. b. PT Bank CENTRAL ASIA Tbk. c. PT Bank CIMB NIAGA Tbk d. PT Bank NEGARA INDONESIA Tbk e. PT Bank DANAMON INDONESIA Tbk
Started Operation
1991 Total Employees
14,552 persons Supervisory Board
Chairman - Mr. Sng Seow Wah M e m b e r - Mr. Djoko Sudyatmiko Mr. Krisna Wijaya Mr. Eng Heng Nee Philip Ms. Vera Eve Lim Mr. Loh Niap Juan
Board of Management President Director - Mr. Willy Suwandi Dharma Vice President Director - Mr. Marwoto Soebiakno Directors - Mr. Hafid Hadeli Mr. Ho Lioeng Min
BIZTEKA I 014 I December I 2016
- 35-
I N D U S T R Y & C O MM O D I T Y
Prepared by PT. CITRA CENDEKIA INDONESIA PROFILE OF COMPANY
Mr. I Dewa Made Susila Mr. Cornel Hugroseno Mr. Swandajani Gunadi
Associated Companies
The ADIRA Group Members R e m a r k s
In Production Information: One of the largest financing business in the country is PT. Adira Dinamika Multi Finance Tbk. Adira Finance was established based on Deed of Misahardi Wilamarta, SH, No. 131. This deed was approved by the Minister of Justice of the Republic of Indonesia in Decree No. C2-19.HT.01.01.TH.91 dated January 8, 1991 and published in Supplement No. 421 in the Official Gazette of the Republic of Indonesia No. 12 dated February 8, 1991. The Company obtained a license as a finance company of the Minister of Finance in Decree No. 253 / KMK.013 / 1991 dated March 4, 1991. According to Article 3 of the Articles of Association, the scope of the Company's activities is in the field of financing including leasing, factoring, consumer finance and credit card business. At this time, the Company is primarily engaged in consumer financing. In January 2004, PT Bank Danamon Indonesia Tbk became the majority shareholder with a stake of 75%. Bank Danamon is a subsidiary company of Asia Financial (Indonesia) Pte. Ltd, in which the final shareholder is Temasek Holdings Pte. Ltd., an investment company based in Singapore and wholly owned by the Singapore Government. In 2009, Bank Danamon added 20% ownership stake, so that it becomes 95%. The company's stock ownership is constantly changing. And up to September 2016 the shareholders of the company controlled by PT Bank Danamon Indonesia Tbk., Which owns shares of up to 92,07%, and PT Asuransi Adira Dinamika at 0,42% and public amounted to 7,51%. The company carried out Initial Public Offering of 100,000,000 shares with a nominal value of Rp100 (full amount) per share at the offering price of Rp 2.325 (full amount) per share on March 23, 2004. All shares have been listed on the Jakarta Stock Exchange and the Surabaya Stock Exchange on March 31, 2004.
BIZTEKA I 014 I December I 2016
- 36-
I N D U S T R Y & C O MM O D I T Y
Prepared by PT. CITRA CENDEKIA INDONESIA PROFILE OF COMPANY
In 2012, the company added the scope of its activities with financing based on Islamic principles. Until 2015, Adira Finance operated 558 business networks throughout Indonesia, supported by more than 14,5 thousand employees. Entering the age of 25 in 2015, Adira is connoting Faithful Companions Forever. The commitment will be realized by providing a friendly and profitable experience for the consumers, so that the long-term friendship relationship is established between Adira Finance and customers. Adira Finance is committed to carry out the mission that led to the welfare of Indonesian society. This was done through the provision of products and services that vary according to the life cycle of customers, and provide experiences that benefit the consumers. Company Performance Number of new financing in the last five years (2011-2015) tends to fluctuate with the rate of minus 1.5% per year. In 2011 the number of new financing of PT Adira Finance recorded at Rp 32.6 trillion, which later increased to Rp 34.1 trillion in 2014. However, in 2015 the number of new financing decreased 10.6% to Rp 30.5 trillion.
Until 2015 the PT Adira Finance has developed three new finance user segments, namely the financing of motorcycles, cars and household appliances (durables) but the motorcycle financing segment was the biggest. In 2015 for example, the number of new financing for motorcycle is Rp 17.6 trillion, while the number of new financing for cars at Rp 12.7 trillion, a new financing for household appliances (durables) reached Rp 270 billion, as stated in the table following.
BIZTEKA I 014 I December I 2016
- 37-
I N D U S T R Y & C O MM O D I T Y
Prepared by PT. CITRA CENDEKIA INDONESIA PROFILE OF COMPANY
In 2015, consumer financing receivables performing (NPL) stood at 1.7%, an increase compared to the NPL in 2014 at 1.5% and NPL in 2013 only at 1.3%.
Table – Development of NPL, 2011-2015 Year
NPL, (%)
2011 1,3 2012 1,4 2013 1,3 2014 1,5 2015 1,7
Total assets owned by PT Adira Finance during 2011 to 2013 has increased from Rp 16.9 trillion to Rp 31.0 trillion. However, beginning 2014 its assets began to decline to Rp 29.9 trillion and decreased again to Rp 27.7 trillion in 2015, as detailed in the following table.
In 2015, PT Adira Dinamika Multi Finance Tbk., recorded a net profit of Rp 665 billion. While the number of business networks is as much as 558 network and the number of active customers are 3.3 million consumers.