32
Arizona State University University Student Initiatives, 2007 Profile of the New American University October 2007
| Date post: | 30-Dec-2015 |
| Category: |
Documents |
| Upload: | nigel-holcomb |
| View: | 15 times |
| Download: | 1 times |
Arizona State University University Student Initiatives, 2007
Profile of theNew American University
October 2007
Arizona State University University Student Initiatives, 2007
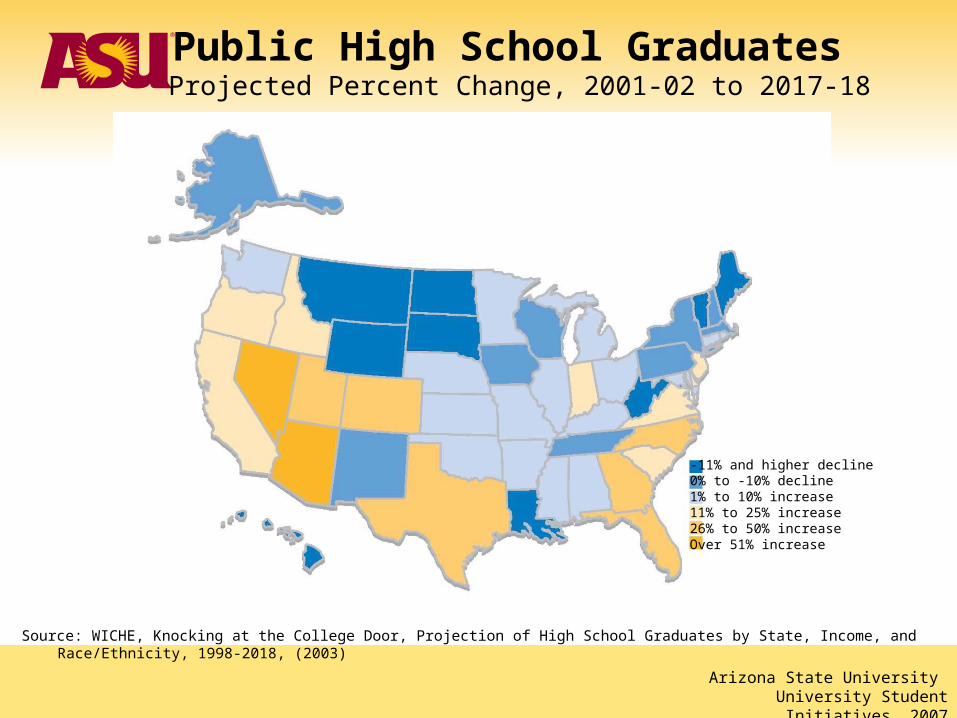
Public High School Graduates Projected Percent Change, 2001-02 to 2017-18
-11% and higher decline 0% to -10% decline 1% to 10% increase11% to 25% increase26% to 50% increaseOver 51% increase
Source: WICHE, Knocking at the College Door, Projection of High School Graduates by State, Income, and Race/Ethnicity, 1998-2018, (2003)
Arizona State University University Student Initiatives, 2007
New School Growth in Arizona
Over the past five years…
– 35 new public high schools (grades 9-12) have been constructed
– 41,152 additional students have enrolled in these schools
Source: Arizona Department of Education, September 2007

Arizona State University University Student Initiatives, 2007
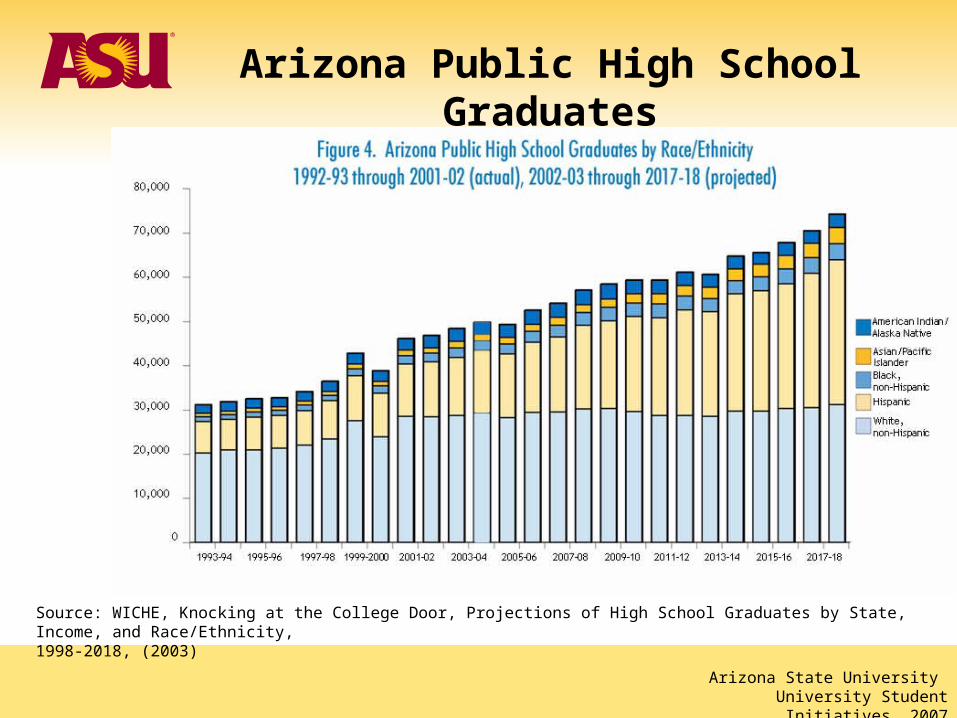
Arizona Public High School Graduates
31,130
30,000
35,000
40,000
45,000
50,000
55,000
60,000
65,000
70,000
75,000
1987
-88
1989
-90
1991
-92
1993
-94
1995
-96
1997
-98
1999
-00
2001
-02
2003
-04
2005
-06
2007
-08
2009
-10
2011
-12
2013
-14
2015
-16
2017
-18
63,663
80,274
Source: Chronicle of Higher Education, 2007
80,000
Arizona State University University Student Initiatives, 2007
Source: WICHE, Knocking at the College Door, Projections of High School Graduates by State, Income, and Race/Ethnicity,1998-2018, (2003)
Arizona Public High School Graduates
Arizona State University University Student Initiatives, 2007
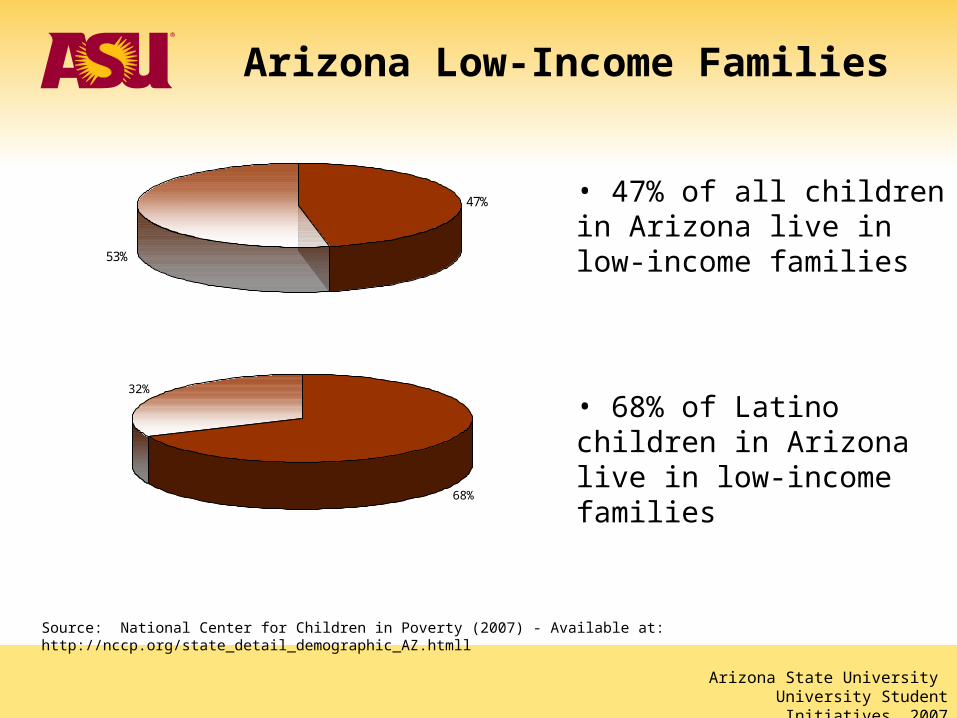
• 47% of all children in Arizona live in low-income families
• 68% of Latino children in Arizona live in low-income families
Source: National Center for Children in Poverty (2007) - Available at: http://nccp.org/state_detail_demographic_AZ.htmll
47%
53%
32%
68%
Arizona Low-Income Families
Arizona State University University Student Initiatives, 2007
0
5
10
15
20
25
30
35
40
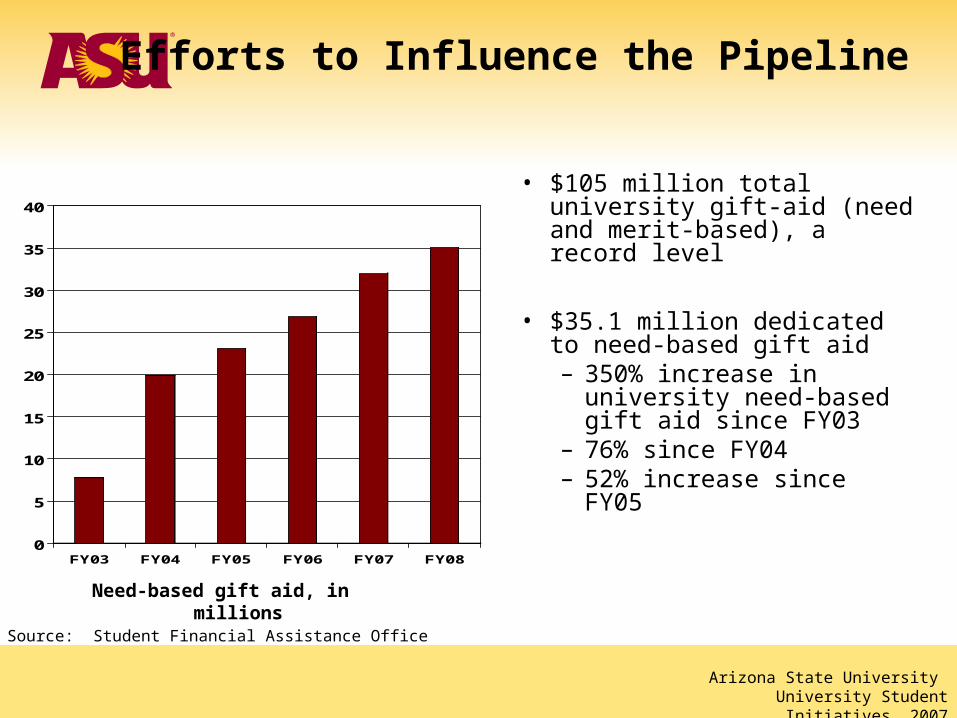
FY03 FY04 FY05 FY06 FY07 FY08
Efforts to Influence the Pipeline
• $105 million total university gift-aid (need and merit-based), a record level
• $35.1 million dedicated to need-based gift aid– 350% increase in
university need-based gift aid since FY03
– 76% since FY04– 52% increase since FY05
Need-based gift aid, in millions
Source: Student Financial Assistance Office

Arizona State University University Student Initiatives, 2007
First-time Freshmen from Arizona Families with Low Income
0
100
200
300
400
500
2002 2003 2004 2005 2006 2007
818% growth from 2002 to 2007
49 67
205
*288
* ASU Advantage Program began in 2005. Income eligibility rose to $25,000 in 2007.
Source: Student Financial Assistance Office
450419

Arizona State University University Student Initiatives, 2007
1209
1517 14431644
1764
0
500
1,000
1,500
2,000
2003-03 2003-04 2004-05 2005-06 2006-07
46% growth from 02-03 to 06-07
Source: Student Financial Assistance Office
Freshman Pell Grant Recipients

Arizona State University University Student Initiatives, 2007
$0
$2,000
$4,000
$6,000
$8,000
$10,000
$12,000
0 -$20,000
$20,000 -$34,999
$35,000 -$49,999
$50,000 -$64,999
$65,000 -$79,999
$80,000 -$119,999
$120,000+
Family Income
Aid Package
Gif t A id
Institutional Aid
Financial Aid Awarded by Income LevelArizona Full-Time Undergraduate Students, 2006-2007
Source: Student Financial Assistance Office Data based on students who completed FAFSA.
Arizona State University University Student Initiatives, 2007
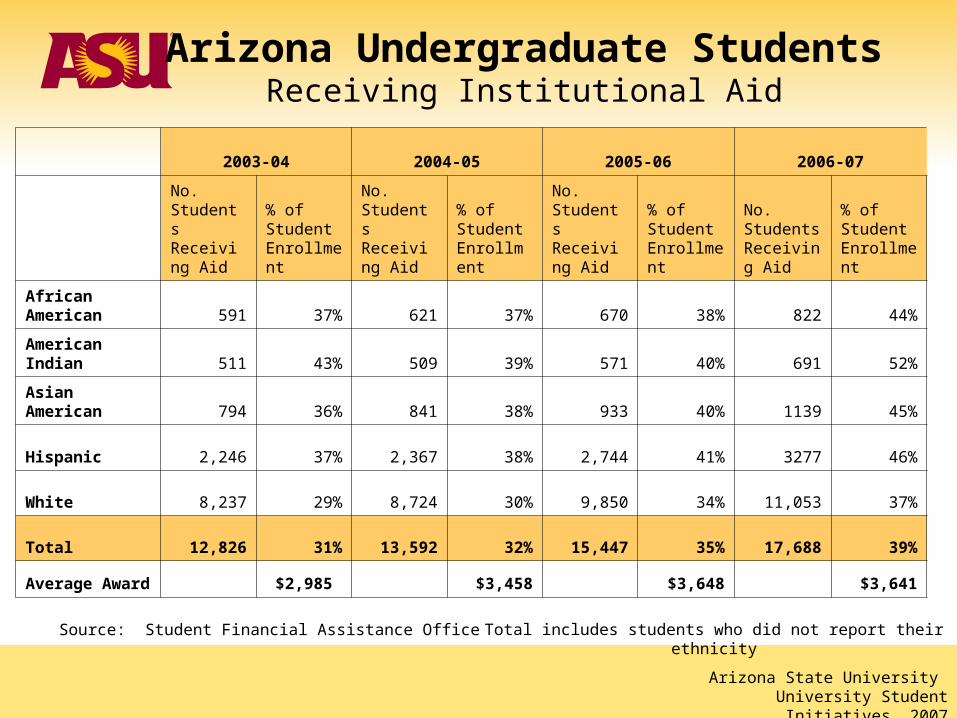
Total includes students who did not report their ethnicity
2003-04 2004-05 2005-06 2006-07
No. Students Receiving Aid
% of Student Enrollment
No. Students Receiving Aid
% of Student Enrollment
No. Students Receiving Aid
% of Student Enrollment
No. Students Receiving Aid
% of Student Enrollment
African American 591 37% 621 37% 670 38% 822 44%
American Indian 511 43% 509 39% 571 40% 691 52%
Asian American 794 36% 841 38% 933 40% 1139 45%
Hispanic 2,246 37% 2,367 38% 2,744 41% 3277 46%
White 8,237 29% 8,724 30% 9,850 34% 11,053 37%
Total 12,826 31% 13,592 32% 15,447 35% 17,688 39%
Average Award $2,985 $3,458 $3,648 $3,641
Source: Student Financial Assistance Office
Arizona Undergraduate StudentsReceiving Institutional Aid
Arizona State University University Student Initiatives, 2007
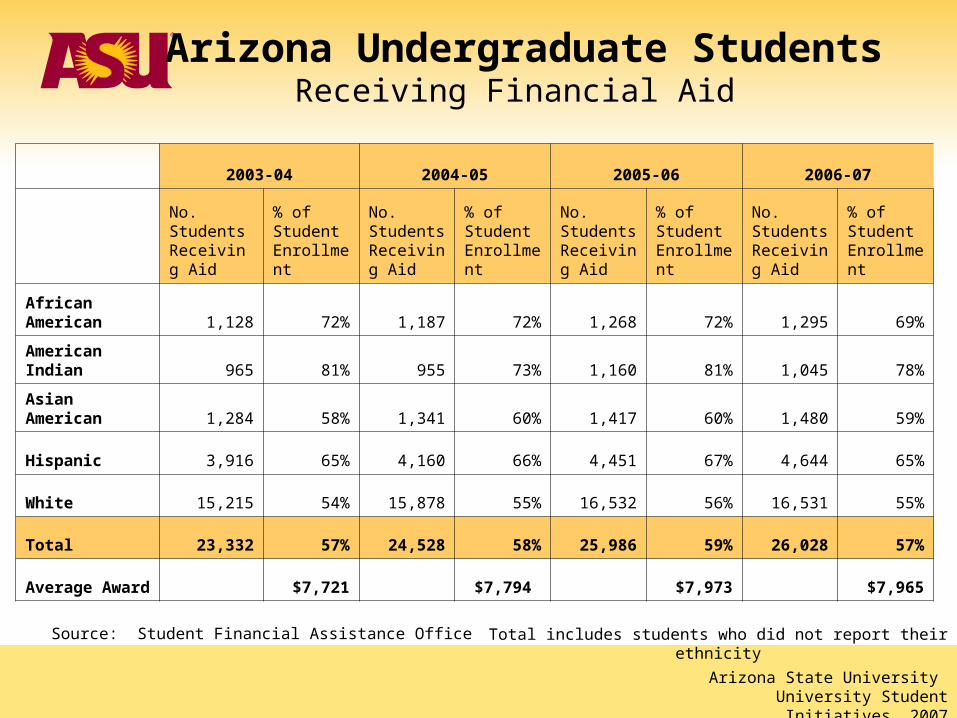
Total includes students who did not report their ethnicity
2003-04 2004-05 2005-06 2006-07
No. Students Receiving Aid
% of Student Enrollment
No. Students Receiving Aid
% of Student Enrollment
No. Students Receiving Aid
% of Student Enrollment
No. Students Receiving Aid
% of Student Enrollment
African American 1,128 72% 1,187 72% 1,268 72% 1,295 69%
American Indian 965 81% 955 73% 1,160 81% 1,045 78%
Asian American 1,284 58% 1,341 60% 1,417 60% 1,480 59%
Hispanic 3,916 65% 4,160 66% 4,451 67% 4,644 65%
White 15,215 54% 15,878 55% 16,532 56% 16,531 55%
Total 23,332 57% 24,528 58% 25,986 59% 26,028 57%
Average Award $7,721 $7,794 $7,973 $7,965
Source: Student Financial Assistance Office
Arizona Undergraduate StudentsReceiving Financial Aid
Arizona State University University Student Initiatives, 2007
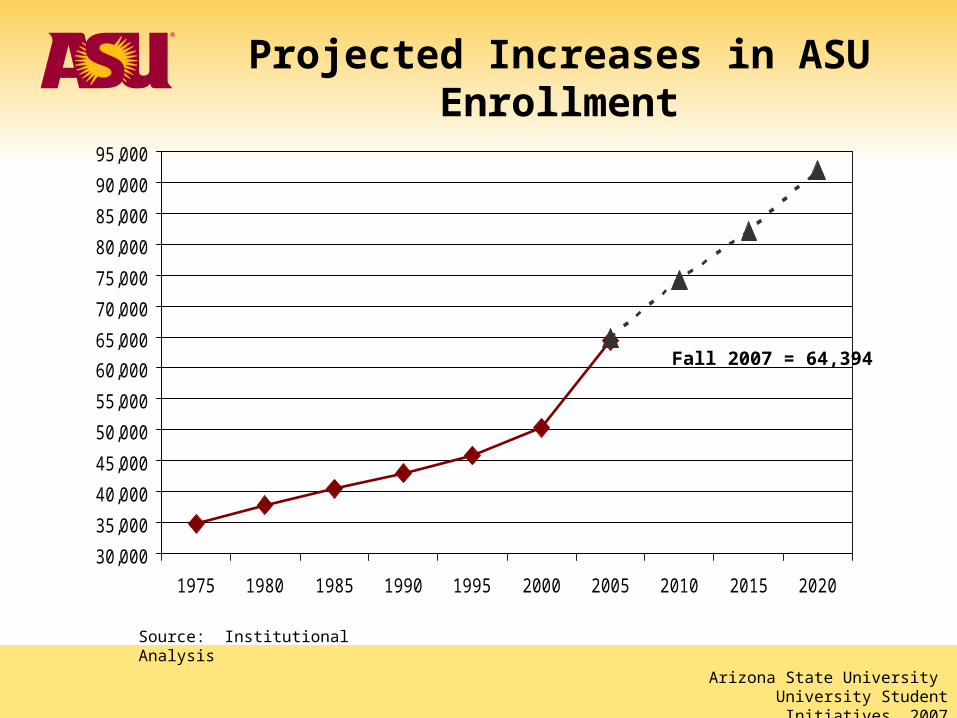
Projected Increases in ASU Enrollment
30,000
35,000
40,000
45,000
50,000
55,000
60,000
65,000
70,000
75,000
80,000
85,000
90,000
95,000
1975 1980 1985 1990 1995 2000 2005 2010 2015 2020
Source: Institutional Analysis
Fall 2007 = 64,394
Arizona State University University Student Initiatives, 2007
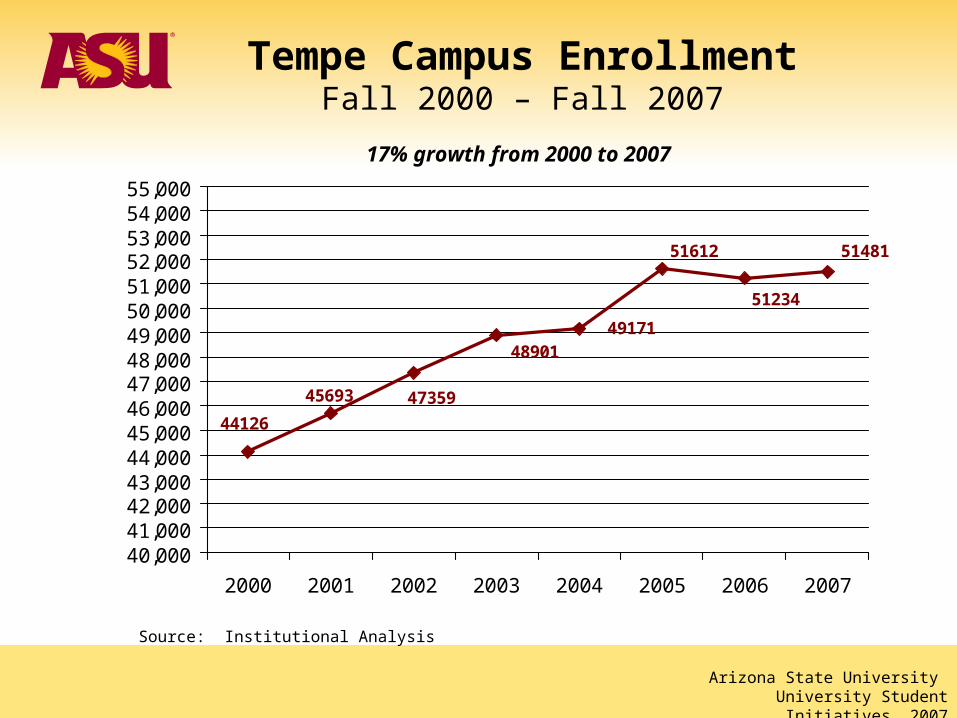
51481
51234
49171
51612
48901
4735945693
44126
40,00041,00042,00043,00044,00045,00046,00047,00048,00049,00050,00051,00052,00053,00054,00055,000
2000 2001 2002 2003 2004 2005 2006 2007
17% growth from 2000 to 2007
Source: Institutional Analysis
Tempe Campus EnrollmentFall 2000 – Fall 2007
Arizona State University University Student Initiatives, 2007
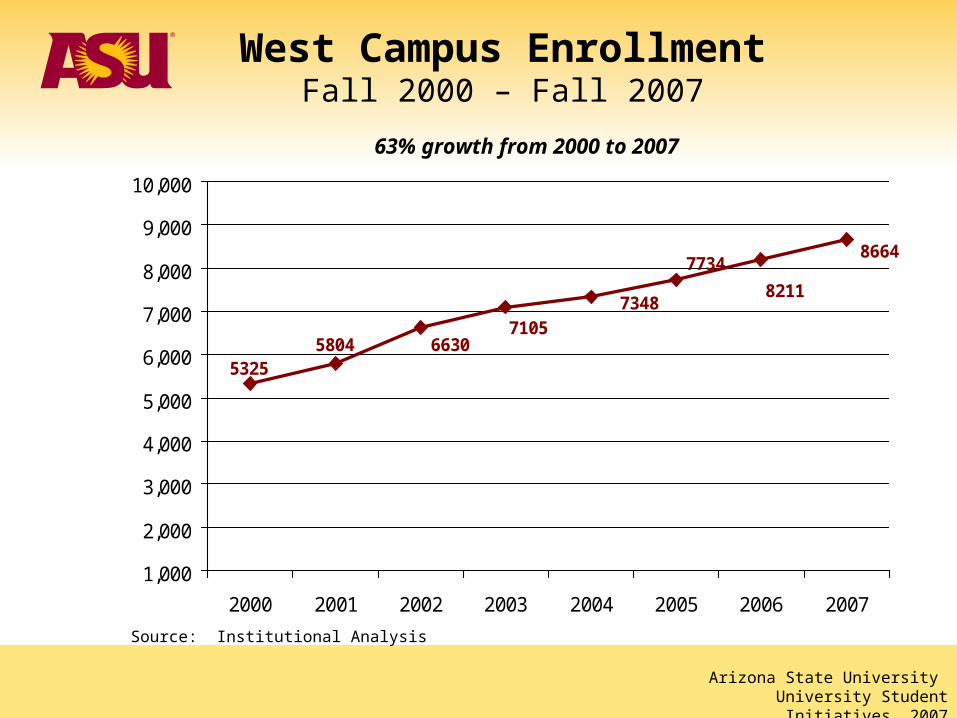
8664
82117348
7734
710566305804
5325
1,000
2,000
3,000
4,000
5,000
6,000
7,000
8,000
9,000
10,000
2000 2001 2002 2003 2004 2005 2006 2007
63% growth from 2000 to 2007
Source: Institutional Analysis
West Campus EnrollmentFall 2000 – Fall 2007

Arizona State University University Student Initiatives, 2007
19392403
3126
3551
4865
3983
6545
8752
1,000
2,000
3,000
4,000
5,000
6,000
7,000
8,000
9,000
10,000
2000 2001 2002 2003 2004 2005 2006 2007
351% growth from 2000 to 2007
Source: Institutional Analysis
Polytechnic Campus EnrollmentFall 2000 – Fall 2007

Arizona State University University Student Initiatives, 2007
Downtown Phoenix Campus EnrollmentFall 2006 – Fall 2007
4,000
5,000
6,000
7,000
8,000
9,000
10,000
11,000
12,000
13,000
14,000
15,000
2006 2007 2010 2015 2020
Source: Institutional Analysis
6,5956,251
15,000
6% growth from 2006 to 2007
Arizona State University University Student Initiatives, 2007
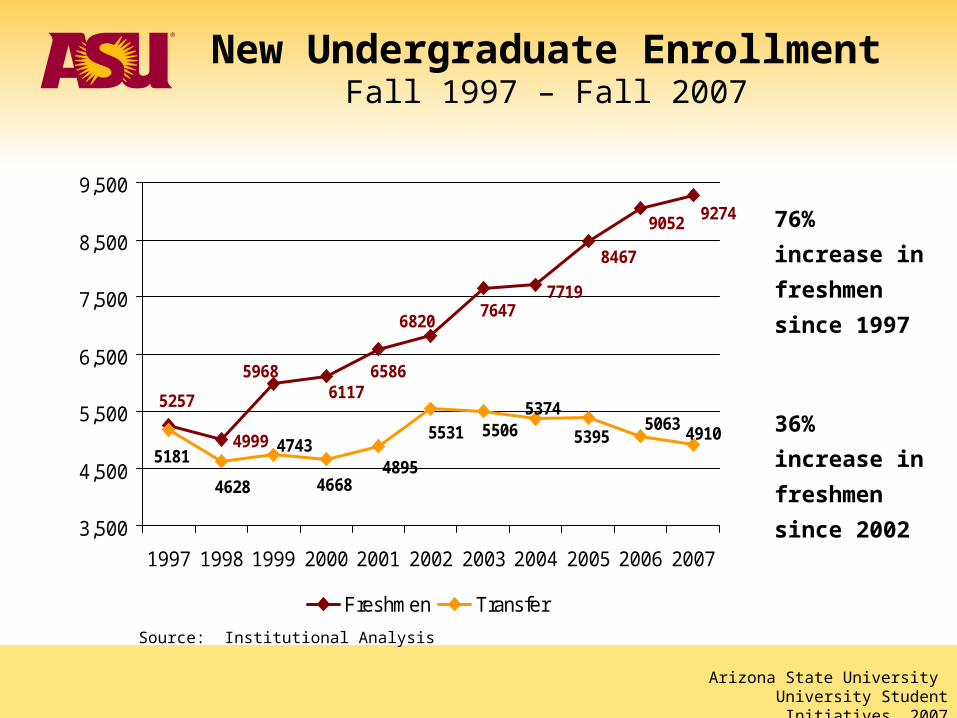
5257
4999
59686117
6820
6586
7647
8467
7719
90529274
5395
53745531
48954668
47435181
4628
506349105506
3,500
4,500
5,500
6,500
7,500
8,500
9,500
1997 1998 1999 2000 2001 2002 2003 2004 2005 2006 2007
Freshmen Transfer
76% increase
in freshmen
since 1997
36% increase
in freshmen
since 2002
Source: Institutional Analysis
New Undergraduate EnrollmentFall 1997 – Fall 2007
Arizona State University University Student Initiatives, 2007
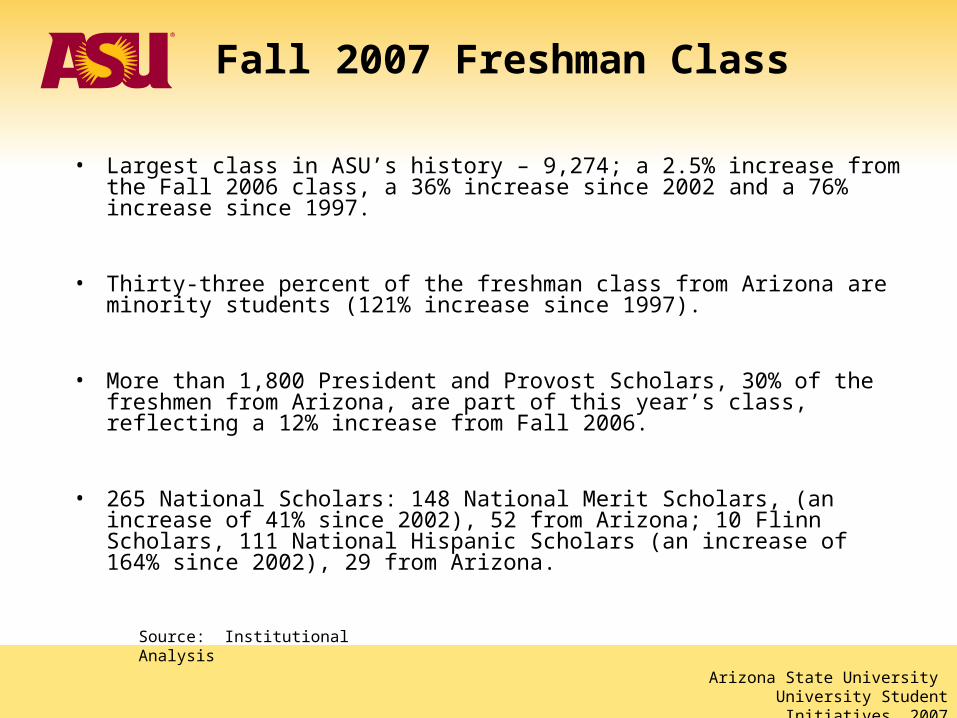
Fall 2007 Freshman Class
• Largest class in ASU’s history – 9,274; a 2.5% increase from the Fall 2006 class, a 36% increase since 2002 and a 76% increase since 1997.
• Thirty-three percent of the freshman class from Arizona are minority students (121% increase since 1997).
• More than 1,800 President and Provost Scholars, 30% of the freshmen from Arizona, are part of this year’s class, reflecting a 12% increase from Fall 2006.
• 265 National Scholars: 148 National Merit Scholars, (an increase of 41% since 2002), 52 from Arizona; 10 Flinn Scholars, 111 National Hispanic Scholars (an increase of 164% since 2002), 29 from Arizona.
Source: Institutional Analysis

Arizona State University University Student Initiatives, 2007
Arizona Freshman Scholar ProfileFall 2002 – Fall 2007
Arizona Freshmen Fall 2002
Fall 2003
Fall2004
Fall2005
Fall 2006
Fall 2007
President/Provost Scholars 928 1091 1367 1566 1615 1809
Percent of Students in Top 5% 16.8% 17.6% 17.8% 19.5% 19.5% 17.0%
Percent of Students in Top 10% 30.0% 30.1% 31.1% 32.3% 33.3% 30.7%
Percent of Students in Top 15% 39.9% 41.2% 41.2% 42.7% 43.8% 41.1%
Source: Institutional Analysis

Arizona State University University Student Initiatives, 2007
President/Provost Scholarships
1809
16151566
1367
1091
924
400
600
800
1000
1200
1400
1600
1800
2000
2002 2003 2004 2005 2006 2007
96% growth from 2002 to 2007
Source: Student Financial Assistance Office
Arizona State University University Student Initiatives, 2007
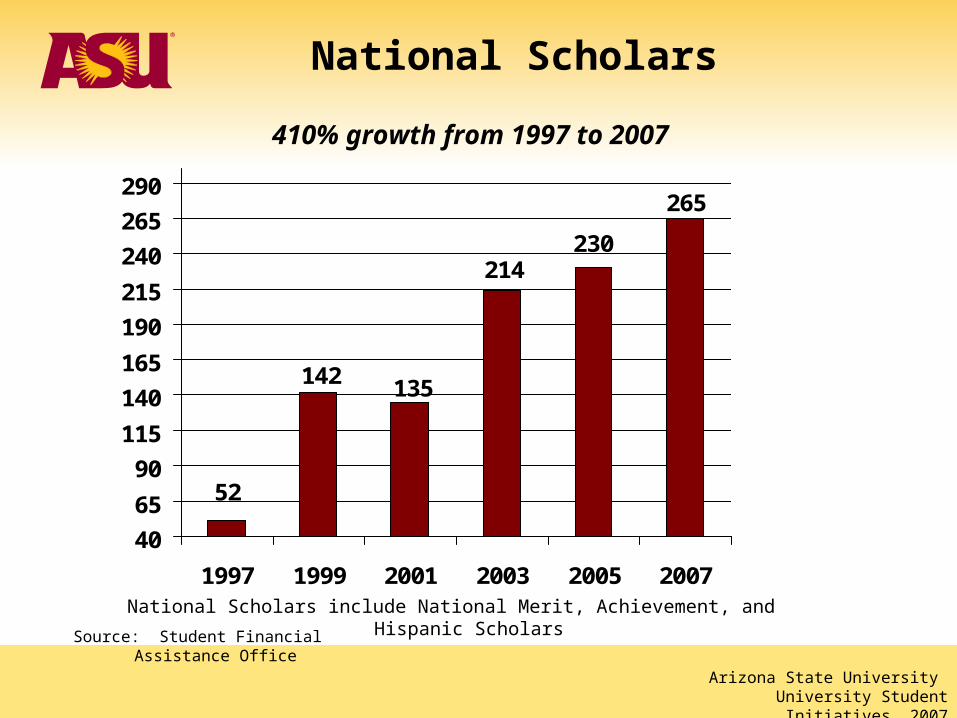
National Scholars
230
265
214
135142
52
40
65
90
115
140
165
190
215
240
265
290
1997 1999 2001 2003 2005 2007
410% growth from 1997 to 2007
National Scholars include National Merit, Achievement, and Hispanic Scholars
Source: Student Financial Assistance Office
Arizona State University University Student Initiatives, 2007
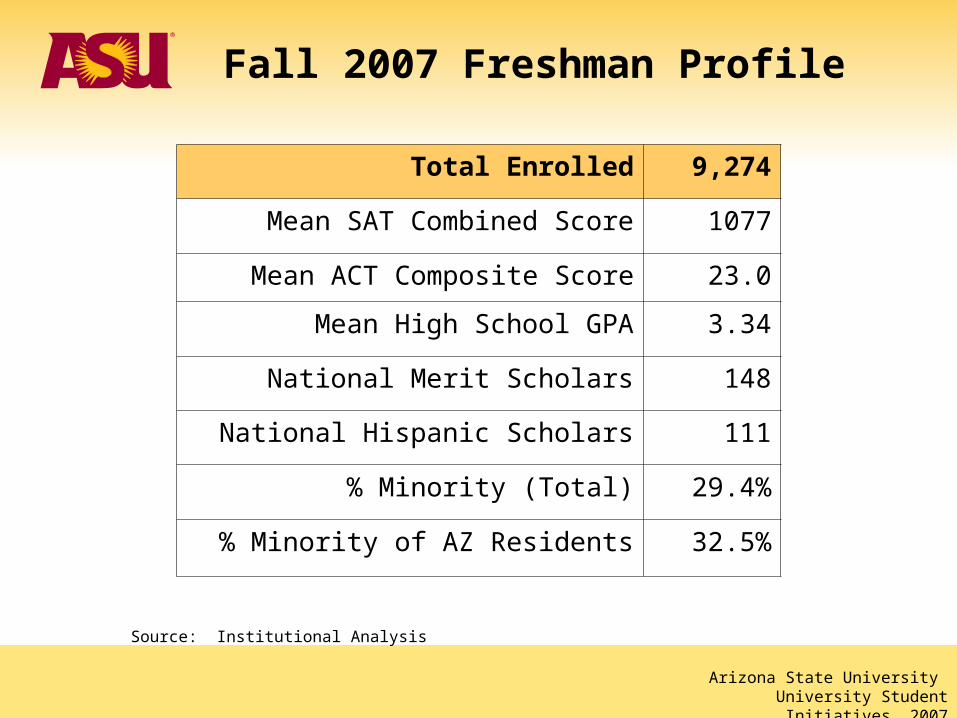
Total Enrolled 9,274
Mean SAT Combined Score 1077
Mean ACT Composite Score 23.0
Mean High School GPA 3.34
National Merit Scholars 148
National Hispanic Scholars 111
% Minority (Total) 29.4%
% Minority of AZ Residents 32.5%
Source: Institutional Analysis
Fall 2007 Freshman Profile
Arizona State University University Student Initiatives, 2007
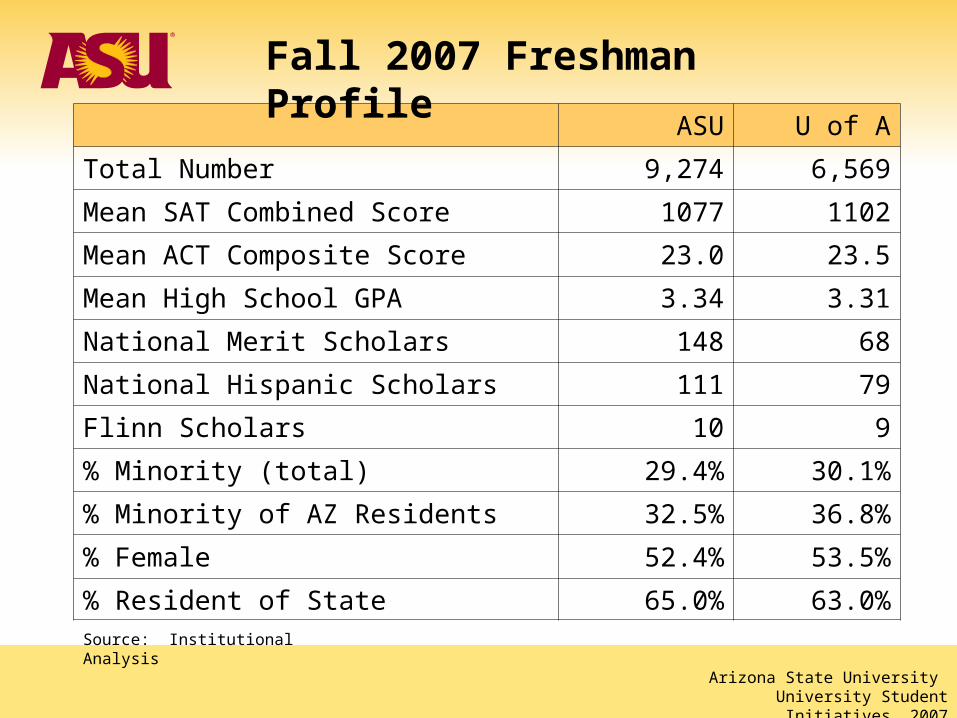
ASU U of A
Total Number 9,274 6,569
Mean SAT Combined Score 1077 1102
Mean ACT Composite Score 23.0 23.5
Mean High School GPA 3.34 3.31
National Merit Scholars 148 68
National Hispanic Scholars 111 79
Flinn Scholars 10 9
% Minority (total) 29.4% 30.1%
% Minority of AZ Residents 32.5% 36.8%
% Female 52.4% 53.5%
% Resident of State 65.0% 63.0%Source: Institutional Analysis
Fall 2007 Freshman Profile

Arizona State University University Student Initiatives, 2007
491 478568 562 631 667
365 420435
456482 516
372 369382
409448 473
295 308
339349
407 395
624 668 763 855829
889
0
500
1,000
1,500
2,000
2,500
3,000
3,500
2002 2003 2004 2005 2006 2007
Top 25%
Top 20%
Top 15%
Top 10%
Top 5%
Source: Institutional Analysis
The Best of Arizona at ASU Fall 2002 – Fall 2007
Arizona State University University Student Initiatives, 2007
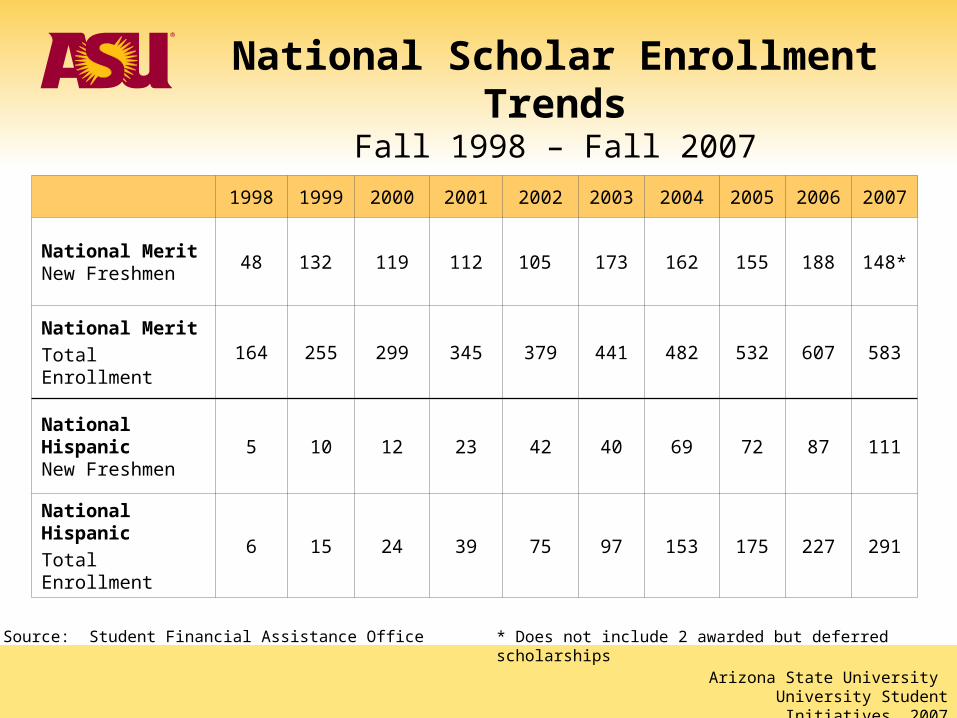
1998 1999 2000 2001 2002 2003 2004 2005 2006 2007
National Merit New Freshmen
48 132 119 112 105 173 162 155 188 148*
National Merit
Total Enrollment164 255 299 345 379 441 482 532 607 583
National HispanicNew Freshmen
5 10 12 23 42 40 69 72 87 111
National Hispanic
Total Enrollment6 15 24 39 75 97 153 175 227 291
National Scholar Enrollment TrendsFall 1998 – Fall 2007
* Does not include 2 awarded but deferred scholarshipsSource: Student Financial Assistance Office
Arizona State University University Student Initiatives, 2007
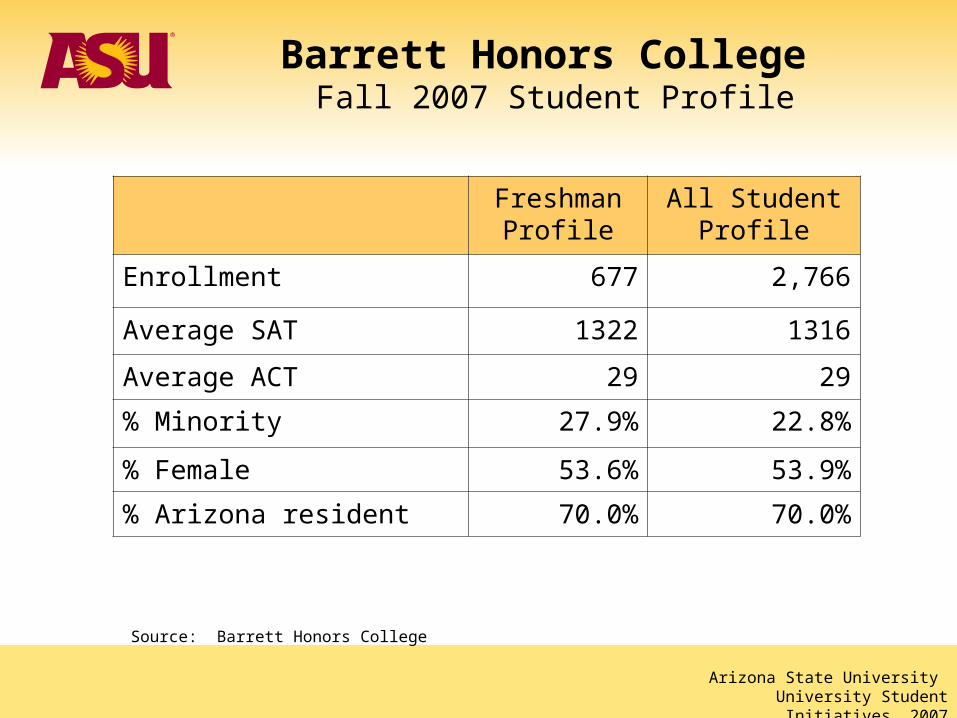
Barrett Honors College Fall 2007 Student Profile
Source: Barrett Honors College
Freshman Profile
All Student Profile
Enrollment 677 2,766
Average SAT 1322 1316
Average ACT 29 29
% Minority 27.9% 22.8%
% Female 53.6% 53.9%
% Arizona resident 70.0% 70.0%

Arizona State University University Student Initiatives, 2007
132
148
248
120
129 16
7199
273
431
435
672
1114
0
200
400
600
800
1000
1200
Fall 1997 Fall 2002 Fall 2007
AfricanAmerican
AmericanIndian
AsianAmerican
Hispanic
88%
39%
117%
156%
Source: Institutional Analysis
Ten-Year Growth
Arizona Minority Freshman Enrollment Fall 1997 – Fall 2007
Arizona State University University Student Initiatives, 2007
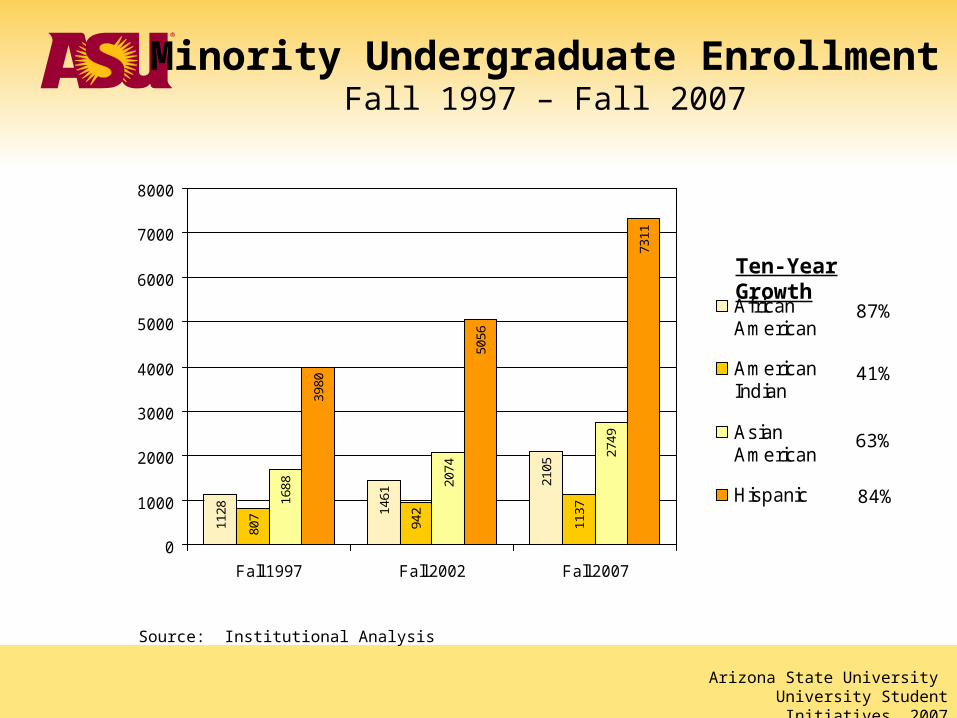
1128 14
61
2105
807
942
1137
1688 20
74
2749
3980
5056
7311
0
1000
2000
3000
4000
5000
6000
7000
8000
Fall 1997 Fall 2002 Fall 2007
AfricanAmerican
AmericanIndian
AsianAmerican
Hispanic
87%
41%
Ten-Year Growth
84%
63%
Source: Institutional Analysis
Minority Undergraduate EnrollmentFall 1997 – Fall 2007
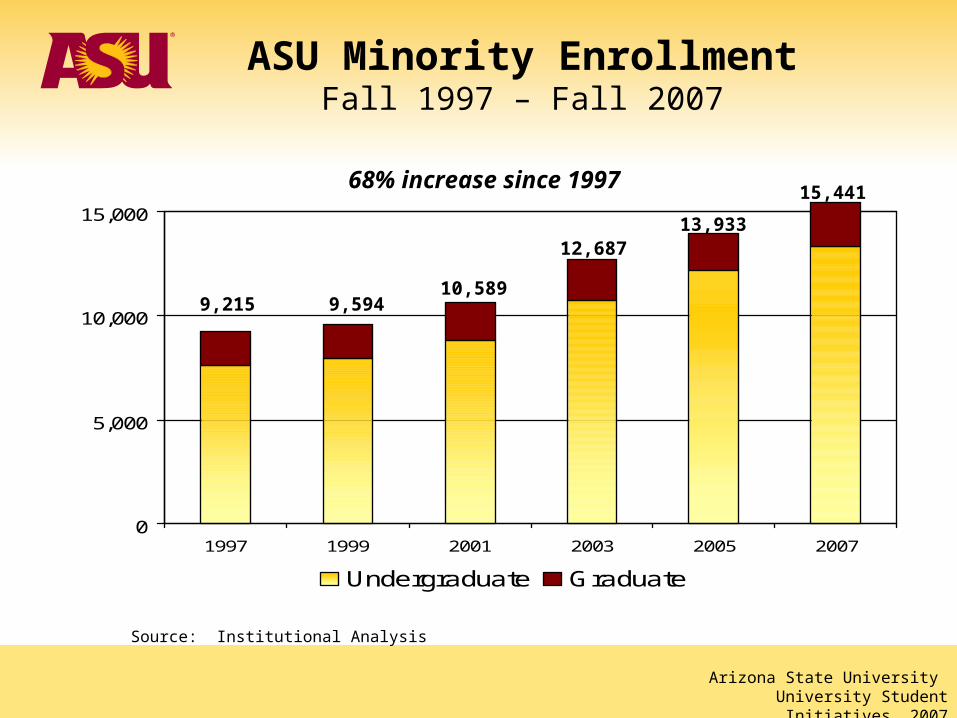
Arizona State University University Student Initiatives, 2007
0
5,000
10,000
15,000
1997 1999 2001 2003 2005 2007
Undergraduate Graduate
9,59410,589
12,68713,933
15,44168% increase since 1997
Source: Institutional Analysis
9,215
ASU Minority EnrollmentFall 1997 – Fall 2007
Arizona State University University Student Initiatives, 2007
Summary
• Unprecedented growth in the next 12 years
• Building capacity to respond
• Central focus: Excellence at every level –Regional, National, World Class
• Hallmark: The Highest Quality, Most Accessible Public University
Arizona State University University Student Initiatives, 2007


