WHAT WOULD HELP?Respondents were asked: “What would help improve your present situaon and make emergency food assistance less necessary for your family?” As in past HFA surveys, respondents focused on employment, living wages, aordable housing, educaon and health care. These obvious and basic components of a successful, producve life connue to remain out of reach for many Oregonians. 0 100,000 200,000 300,000 400,000 500,000 600,000 700,000 800,000 900,000 98/99 99/00 00/01 01/02 02/03 03/04 04/05 05/06 06/07 07/08 08/09 09/10 10/11 11/12 M o n t h l y a v e r a g e : P e o p l e R e c e i v i n g A s s i s t a n c e More people are using food stamps … yet requests for emergency food remain high Food Stamps/SNAPEmergency Food BoxesWHAT TO DOOregon Food Bank is commied to helping Oregonians get back to work when the economy recovers. Food, housing and job readiness are essenal to geng and keeping a job. Here are some examples of policy acons that would move Oregon toward eliminang hunger and its root causes:Feeding Hungry Oregonians Oregon Hunger Response Fund (formerly GFFP), Farm Direct, Farm -to-SchoolHousing Oregonians State Homelessness Assistance Program, Emergency Housing Account Encouraging Job Success Temporary Assistance to Needy Families (TANF), Employment -Related Day Care, Earned Income Tax CreditFor more informaon, see www.oregonfoodbank.org/Advocate/Take -acon61% of respondents are currently receiving SNAP benets; of those not receiving SNAP benets, the most c ommon reason was not knowing if they qualied (22%)When asked if they were able to meet their food needs for the month when adding the emergency food box to the rest of their food supply, 72% ofsurvey respondents said yes. 2012 Proles of Hunger and Poverty in Oregon & Annual Stascs : Execuve SummaryThis year’s Hunger Factors Assessment Survey reects the connuing fallout of massive job losses caused by the Great Recession. The percentage of respondents reporng long -term unemployment as a reason for seeking help stood at 27% — higher than the 22% reported in 2008 at the very beginning of the recession. Even as the economy slowly improves, Oregon and Clark County, Washington families are facing familiar problems that have only goen worse; recovery will take a long me. Last year, partner agencies provided a record 1,117,000 emergency food boxes – an increase of 9%.There were 435 pantries in the Network in 2011-2012. The number of food boxes distributed range from 500 per year to over 25,000 at several large urban pantries. The food bank network added 45 more pantries in the last four years while the number of food boxes dis tributed increased by 41%, or 330,000 boxes . Food Industry Donations 54% USDA 11% Food Drives 14% Purchased Product 21% The average number of pantry visits per household rose sl ightly to about four mes per year.Oregon Food Bank and the Network together received 81.7 million pounds of food for distribuon: OFB and 4 Branches: 43.5 million16 Regional Food Banks: 17.6 million945 Partner Agencies: 20.6 millionANNUAL STATISTICS 2011 - 2012 NETWORK SOURCES OF FOOD500000 600000 700000 800000 900000 1000000 1100000 1200000 FY 03/04 FY 04/05 FY 05/06 FY 06/07 FY 07/08 FY 08/09 FY 09/10 FY 10/11 FY 11/12 EMERGENCY FOOD BOX DISTRIBUTION
State Homelessness Assistance Program, Emergency Housing Account
Encouraging Job Success
Temporary Assistance to Needy Families (TANF), Employment-Related Day Care, Earned Income Tax Credit
For more informaon, see www.oregonfoodbank.org/Advocate/Take-acon
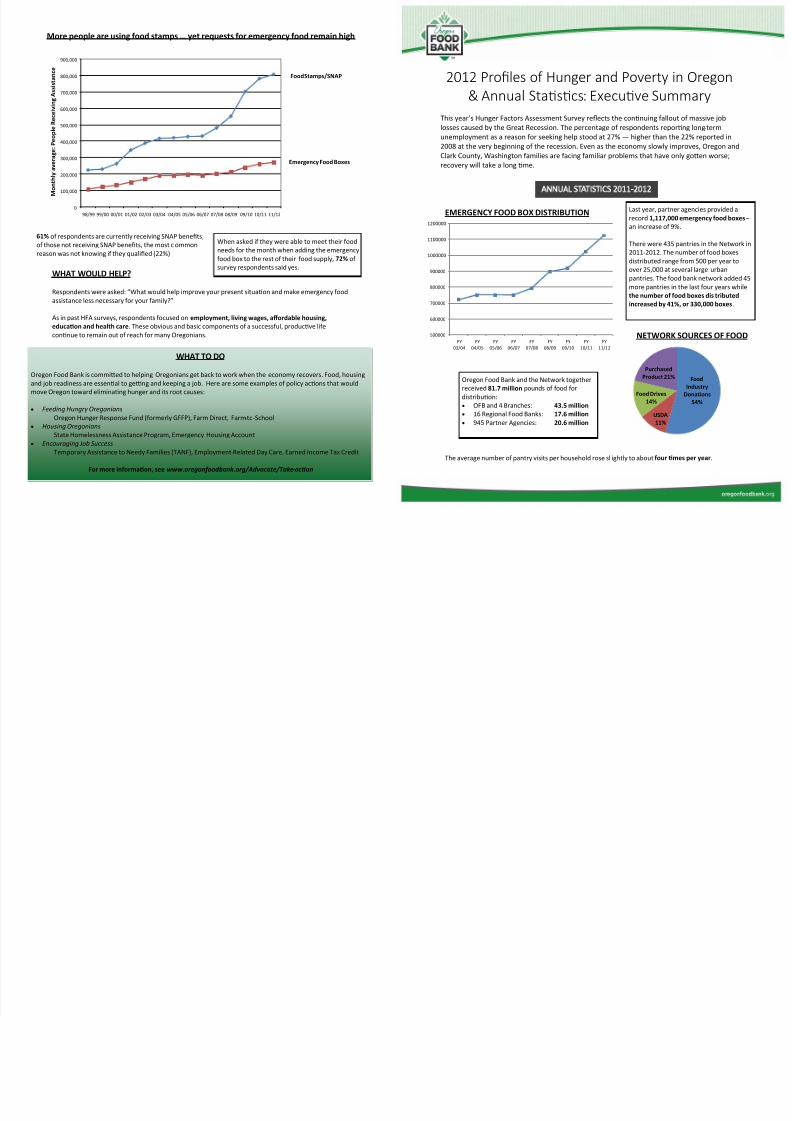
61% of respondents are currently receiving SNAP benets;
of those not receiving SNAP benets, the most c ommon
reason was not knowing if they qualied (22%)
When asked if they were able to meet their food
needs for the month when adding the emergency
food box to the rest of their food supply, 72% of
survey respondents said yes.
2012 Proles of Hunger and Poverty in Orego
& Annual Stascs: Execuve Summary This year’s Hunger Factors Assessment Survey reects the connuing fallout of massive job
losses caused by the Great Recession. The percentage of respondents reporng long-term
unemployment as a reason for seeking help stood at 27% — higher than the 22% reported 2008 at the very beginning of the recession. Even as the economy slowly improves, Oregon
Clark County, Washington families are facing familiar problems that have only goen worse
recovery will take a long me.
Last year, partner agencies provid
record 1,117,000 emergency food
an increase of 9%.
There were 435 pantries in the Ne
2011-2012. The number of food b
distributed range from 500 per ye
over 25,000 at several large urban
pantries. The food bank network amore pantries in the last four yea
the number of food boxes dis trib
increased by 41%, or 330,000 box
Food
Industry
Donations
54%
USDA11%
Food Drives
14%
Purchased
Product 21%
The average number of pantry visits per household rose sl ightly to about four mes per year.