255


To become a world-class investment group underpinned by the twin drivers of “Insurance-oriented Integrated Financial Capability” &“Global Industrial Integration Capability Taking Roots in China”
Note to the cover design
“Birth”, which means creation of value from scratch – Fosun adheres to providing products and services that impress clients in three business segments including wealth, health and happiness, persistently creating value for clients and the society. “Growth”, which means we focus on sustainable growth – to integrate resources and achieve organizational evolution. We propose “Thriving”, aiming at achieving changes in quantity from scalable growth, and also changes in quality from the intelligent & vital entity evolution.
The rapid growth of Fosun was not incidental but was a result of how we have built up our strength for the long-term development. After two years of rapid development, Fosun has completed its initial landscape of “insurance + investment” twin drivers and achieved economies of scale and good results from the strategy for “focusing on wealth, health and happiness businesses”. Meanwhile, Fosun also started its global partnership system and is evolving into an elite organization.
From 2016, especially in the complex and ever-changing global economy environment, Fosun will more focus on its organic growth, to discover, invest and nurture “Unicorns” as well as to implement its light-asset strategy. We will also be devoted to penetrating internal and external core resources of Fosun, polishing our products with artisan spirit, with a view to providing families with one-stop solution integrating wealth, health and happiness. By leveraging new technologies including internet, Fosun will concentrate on launching products and services that astonish clients. Product strength and organic growth will be the theme of the next stage of Fosun’s development.
PROFIT ATTRIBUTABLE TO OWNERS OF THE PARENT
8,038.3MILLION
RMB

CONTENTS
2 Financial Summary
3 Business Overview
6 Fosun’s Achievements
12 Letter to Shareholders
19 Corporate Structure
21 Management Discussion & Analysis
58 Five-Year Statistics
59 Corporate Governance Report
66 Biographical Details of Directors and Senior Management
72 Directors’ Report
87 Corporate Social Responsibility
100 Independent Auditors’ Report
102 Consolidated Statement of Profit or Loss
103 Consolidated Statement of Comprehensive Income
104 Consolidated Statement of Financial Position
107 Consolidated Statement of Changes in Equity
109 Consolidated Statement of Cash Flows
113 Notes to Financial Statements
248 Corporate Information
250 Glossary

FOSUN INTERNATIONAL LIMITED Annual Report 20152
FINANCIAL SUMMARY
For the year ended 31 December In RMB million 2015 2014
Revenue 78,796.9 61,738.4
Integrated Finance (Wealth) 15,615.8 9,016.2 Insurance 14,667.4 7,867.6 Investment 442.5 700.5 Wealth Management 505.3 448.1 Internet Finance 0.6 — Industrial Operations 63,563.8 52,948.6 Health 15,614.9 11,938.2 Happiness 7,441.6 — Steel 21,986.0 27,272.0 Property Development and Sales 16,893.7 12,149.2 Resources 1,627.6 1,589.2 Eliminations (382.7) (226.4)
Profit/(loss) attributable to owners of the parent 8,038.3 6,853.9
Integrated Finance (Wealth) 5,730.4 3,615.7 Insurance 2,104.2 1,117.0 Investment 2,930.5 2,195.3 Wealth Management 589.9 306.1 Internet Finance 105.8 (2.7) Industrial Operations 3,529.6 4,376.9 Health 1,754.2 1,096.0 Happiness 175.1 473.5 Steel (929.7) 280.0 Property Development and Sales 2,993.5 2,397.5 Resources (463.5) 129.9 Unallocated expenses (1,267.5) (1,022.1) Eliminations 45.8 (116.6)
Earnings per share – basic (in RMB) 1.06 1.02
Earnings per share – diluted (in RMB) 1.05 0.99
Dividend per share (in HKD) 0.17 0.17

FOSUN INTERNATIONAL LIMITED Annual Report 2015 3
BUSINESS OVERVIEW
Fosun has been persistently taking roots in China and investing in China’s growth fundamentals. It has been actively implementing its investment model of “Combining China’s Growth Momentum with Global Resources”. Fosun is dedicated to making a major stride towards becoming a world-class investment group underpinned by the twin drivers of “insurance-oriented integrated financial capability” and “global industrial integration capability taking roots in China”. Today, Fosun’s businesses include two major segments, integrated finance (wealth) and industrial operations.

BUSINESS OVERVIEW
FOSUN INTERNATIONAL LIMITED Annual Report 20154
INTEGRATED FINANCE (WEALTH)The Group’s integrated finance (wealth) business includes four major segments, namely insurance, investment, wealth management and internet finance.
InsuranceThe Group’s insurance segment mainly includes Fosun Insurance Portugal (the largest insurance group in Portugal which occupies a leading market share in the businesses of life insurance and general insurance and has a diversified distribution platform and a brand portfolio highly recognized by the market), Yong’an P&C Insurance (an insurance company headquartered in Xi’an with a nationwide presence, which operates all kinds of non-life insurance business), Pramerica Fosun Life Insurance (its principal scope of business includes insurance businesses such as life insurance, health insurance, casualty insurance and reinsurance of the above-mentioned insurance businesses), Peak Reinsurance (its principal scope of business includes providing life and non-life reinsurance as well as investing using its investable assets), Ironshore (a global insurance company focusing on specialty insurance), MIG (a professional property and casualty insurer and insurance administration services company focused on specialty niche markets).
InvestmentWe adhere to our unique investment model of “Combining China’s Growth Momentum with Global Resources” and capture investment opportunities benefiting from China’s growth momentum through our in-depth understanding of China’s macroeconomic and
microeconomic trends and our insightful analysis of the global market, together with our established operational experience that has been accumulated over many years and our strong execution capabilities. The investment business includes three major parts, namely strategic investment, private equity and venture capital investment and capital contribution to the Group’s asset management business as a limited partner (PE/VC/LP investments), and secondary market investments.
Wealth ManagementThe Group’s wealth management business mainly includes asset management, banking and other financial business. The Group engages in raising and managing funds from third parties and collects management fee and shares of investment gains through the asset management business. We act as a general partner of the funds that we manage. At present, we mainly manage (i) US dollar fund, namely, Pramerica-Fosun China Opportunity Fund and CMF, (ii) Qualified Foreign Limited Partner Fund, namely Carlyle-Fosun, (iii) RMB Private Equity Fund, (iv) Star Capital, (v) Xinghong Fund, (vi) real estate series fund of Forte, and (vii) Foreign Currency Denominated Real Estate Funds. Moreover, we own the entire or partial equity interest of Fosun Finance Company, Fosun Hani Securities and Hangzhou Financial Investment Leasing. The above-mentioned businesses will further increase our integrated financial capabilities to consolidate domestic and overseas financial resources.
Internet FinanceThe Group actively plans for a new type of financial industry with internet cloud computing technology as its core, and has successfully invested and developed several projects with industrial depth and multi-dimension ecosystem features, including Mybank, Cainiao, Chuangfu Finance Leasing, Yuntong Small Loan and Fosunling.

BUSINESS OVERVIEW
FOSUN INTERNATIONAL LIMITED Annual Report 2015 5
INDUSTRIAL OPERATIONSThe Group’s industrial operations include five key segments, including health, happiness, steel, property development and sales, and resources.
HealthWe operate businesses of the health segment principally through a subsidiary, Fosun Pharma as well as a joint venture, Starcastle Senior Living, and Star Healthcare. Fosun Pharma is a leading healthcare company in China listed on the SSE (Stock Code: 600196) and the Hong Kong Stock Exchange (Stock Code: 02196). Its main business includes pharmaceutical manufacturing, pharmaceutical distribution and retail, healthcare services and diagnosis products and medical devices. Fosun Pharma has established a leading position in the pharmaceutical distribution sector through its shareholding in Sinopharm. Starcastle Senior Living is a joint venture company established by the Group and Fortress Investment Group LLC for the purpose of developing properties for senior citizens in China. Star Healthcare is a wholly-owned company of the Group, combining its internal and external outstanding medical resources, with an aim to provide one-stop and whole-process health management service and third-party insurance service for mid- to high-profile customer members.
HappinessWe operate happiness industries adapting to the living style of families through acquiring shareholdings in Yuyuan, Club Med, Atlantis, Studio 8, BONA, Cirque du Soleil and Thomas Cook.
SteelWe operate the steel business principally through a joint venture, Nanjing Nangang, and an associate Tianjin Jianlong. Nanjing Iron & Steel, the main investee of Nanjing Nangang, is listed on the SSE (Stock Code: 600282). Located in East China, Nanjing Iron & Steel is an integrated steel company with a complete production process, including mining, coking, sintering, iron smelting, steel smelting and steel rolling. Nanjing Iron & Steel is one of the few steel product producers in China with the ability to produce 9% Ni steel, and its principal products include medium and heavy steel plates, high strength ship plates, boilers and pressure vessel plates, pipeline steel plates (straight seam) and bearing steel. Tianjin Jianlong is a large enterprise group which integrates resources, steel, shipping, and mechanical and electrical equipment.
Property Development and SalesWe operate our property development and sales business principally through Forte, The Bund Finance Center, Dalian Donggang and Resource Property.
ResourcesWe engage in the development and sales of natural resources business such as iron ore, petroleum and natural gas through our subsidiaries, Hainan Mining and ROC. Hainan Mining is a company listed on the SSE (Stock Code: 601969), and its core business includes mining and sales of iron ore. ROC is one of the main independent upstream oil and gas companies in Australia and has established petroleum and natural gas mining businesses in China, Southeast Asia and Australia.

FOSUN INTERNATIONAL LIMITED Annual Report 20156
2015 Fosun’s Achievements
INVESTABLE INSURANCE ASSETS CONTINUED TO GROW RAPIDLY AND PROFIT FROM INSURANCE SEGMENT INCREASED SIGNIFICANTLY
Insurance business expanded quickly:
• In 2015, investable insurance assets reached a new record again to exceed RMB160.0 billion, increased significantly by RMB53.6 billion as compared to the end of 2014;
• The total assets under the insurance segment of Fosun already reached RMB180.6 billion, accounting for 44.6% of the Group’s total assets, increased from 32.9% at the end of 2014;
• Profit attributable to owners of the parent from the insurance segment surged to RMB2.1 billion, with a year-on-year growth of 88.4%;
• In the second half of 2015, Fosun finished consolidating the financial statements of Ironshore, a global insurance company engaged in specialty insurances, and MIG, an American P&C insurance company with rich experience in labor insurance. As such, a prototype of Fosun’s global insurance network took shape; and
• Fosun actively explored new models for the growth of the investable assets of our insurance business, for example, renewal - oriented insurance business (Run-off) assets portfolio.
All of the insurance companies under Fosun performed well in terms of cost control:
• For non-life insurance business, apart from the newly acquired MIG, whose net combined ratio was 100.3%, net combined ratios of Ironshore, Yong’an P&C Insurance and Fosun Insurance Portugal are all below 100% at 96.7%, 98% and 98.4%, respectively; and
• For life insurance business, average guaranteed interest rate at Fosun Insurance Portugal’s existing deposit-oriented life insurance was 2.20%. The average guaranteed interest rate of Fosun Insurance Portugal’s new deposit-oriented life insurance business was merely 1.8%. The average guaranteed interest rate of Pramerica Fosun Life Insurance-related products was 2.7%.
More Diversified and Balanced Currency Sources for Investable Assets:

FOSUN’S ACHIEVEMENTS
FOSUN INTERNATIONAL LIMITED Annual Report 2015 7
ASSETS TO FOCUS ON DEMAND FOR WEALTH, HEALTH AND HAPPINESS FROM FAMILIESFosun believes that China’s economy will be increasingly driven by consumption. On the demand side, the most noteworthy are the desires to preserve and increase the value of household wealth and those for maintaining health and happy life of the family. Therefore, Fosun persistently focused its assets on B2F (Business to Family) and invested in wealth, health and happiness industries in 2015.
• As at 31 December 2015, total assets from wealth, health and happiness segments reached RMB303.4 billion, accounting for 74.8% of the Group’s total assets, or enlarged 11.6 percentage points from the end of 2014;
• Net assets of the three business segments increased by 77.2% compared with that of the end of 2014 to RMB44.3 billion, which accounted for 45.1% of the Group’s total net assets;
• Revenue grew by 84.6% on a year-on-year basis to RMB38.7 billion, accounting for 49.1% of the Group’s total revenue; and
• Profit attributable to the owners of the parent amounted to RMB7.66 billion, with a year-on-year growth of 47.7% and accounting for 95.3% of the Group’s total profit attributable to the owners of the parent.
Wealth segment: Fosun is now engaged in building up a global wealth management platform. This platform includes not only risk management and wealth
protection provided by various kinds of insurance products but also more diversified and comprehensive financial services such as management of growth in household wealth, allocation of household wealth as well as internet finance:
• As at the end of 2015, Fosun’s investable assets of insurance segment reached RMB160.4 billion; and
• Funds under the Group’s direct management amounted to RMB63.4 billion.
2015 was a fruitful year for the wealth segment, which includes:
• Mybank, which was set up along with Ant Financial as well as a few other shareholders, formally opened for business;
• Following investment in IDERA in Japan, Resolution Property, a British property investment and assets management platform, and Fosun Eurasia Capital, a comprehensive financial platform in Russia, were established; and
• Innovative financing companies such as Yuntong Small Loan, Fosunling and Fortune Credit were launched in China; and the Group’s wholly-owned Hani Securities (H.K.) Limited was formally renamed as Fosun Hani Securities in early 2016 and became a crucial part of Fosun’s global wealth management network.
Health segment: The health segment of Fosun is ready to grasp opportunity for consolidating its advantages and it will focus on four main areas,
specifically population aging, newborns, sub-health and tumors. In 2015, net profit attributable to owners of the parent from the Group’s health segment reached RMB1.75 billion, with a year-on-year growth of 60.1%.
• As at 31 December 2015, Fosun has already invested 13 hospitals, 2 professional nursing units and 7 private clinics with 3,777 beds in total; and
• The Group’s senior living communities, including the high-end senior living organization Starcastle Senior Living, have a total GFA of 96,700 sq.m. with 1,090 beds in total opened for business. The total GFA under development was 342,259 sq.m. with 2,977 beds in total in 2015.
In addition, Fosun stepped up efforts to invest in innovative medical care projects built upon modern information technologies such as mobile internet and big data.
• So far, Fosun has already invested in a number of mobile internet health brands, such as Guahao.com, Mingyizhudao, Easyhin, etc.; and
• Fosun also set up venture capital fund and angel investment team dedicated to internet healthcare in order to build up an incubation platform conducive to rapid development of innovative medical care model.
Happiness segment: In 2015, Fosun completed consolidating the financial statement of Club Med, a global high-end tourism chain brand, and invested in Thomas
Cook, a British leisure tourism group, Cirque du Soleil, the quintessence of Canada, and Silver Cross, a British high-end nursery brand;
Studio 8, a Hollywood movie producer in which Fosun invested, has invested in the shooting of four new movies, including two directed by famous director Ang Lee and one of which will be released in the second half of this year; and
Furthermore, Yuyuan, which is under the wings of Fosun, successfully acquired Hokkaido Hoshino Tamamu Resort, one of the world’s top ski resorts located in Hokkaido, Japan.

FOSUN’S ACHIEVEMENTS
FOSUN INTERNATIONAL LIMITED Annual Report 20158
ENDEAVOURED TO HAVE THE GROUP’S RATING UPGRADED THROUGH OPTIMIZATION OF LIABILITY STRUCTURE1. Net gearing ratio of the Group continued to decrease
2. Enhancing liquidity of the invested enterprises• Promoted the invested projects to go public: 8 IPOs in A- or H-share markets in 2015, 4 listed on NEEQ; and
• New model of listed company + PE: Cooperate with Sinolife United, Jiashili, Grandblue and Ellassay.
3. Optimizing liability structure within low interest rate cycle• Extended loan tenure, lowered costs and allocated currencies reasonably; and
• Up to the end of March 2016, total sum of approved issuance of medium to long term bond was RMB36.8 billion, total sum of actual issued medium to long term bond was RMB16.82 billion.
4. Optimized capital structure• Ratio of wealth, health and happiness accounted for 74.8% of total assets and 95.3% of profit attributable to owners of the parent;
• Diversified the investments in wealth, health and happiness segments based on the same population to lower the industrial concentration risk; and
• Nanjing Nangang was no longer consolidated.
5. Continued growth in equity attributable to owners of the parent• Equity attributable to owners of the parent per share continued to grow rapidly, with a year-on-year growth of 22.5%; and
• Equity attributable to owners of the parent reached RMB75.25 billion, with a year-on-year growth of 52.3%, CAGR of equity attributable to owners of the parent has reached 43.1% in the past 11 years.
6. Flexible onshore and offshore investment and financing platform• Offshore platform: Fosun International Limited; and
• Onshore platform: Fosun High Technology.

FOSUN’S ACHIEVEMENTS
FOSUN INTERNATIONAL LIMITED Annual Report 2015 9
DEVELOP LIGHT-ASSET STRATEGY AND “UNICORN” STRATEGY VIGOROUSLY
Fosun established “light-asset” strategy in 2015. Fosun firmly proceeded light-asset strategy of the Group, and strictly defined capital expenditures regulations of Group platform, listed holding subsidiaries platform, insurance companies platform and funds platform, which had greatly reduced the demand of capital expenditures from the macroscopic aspect. Meanwhile, Fosun could better enjoy the advantage of natural high leverage in insurance and increase the total asset return. Total investable assets in six insurance companies/Accumulated equity investments for the Group in these insurance companies = 4.48; Net gearing ratio continued to decrease, from 73.3% at the end of 2014 lowered to 69.3% at the end of 2015.
Fosun developed ‘‘Unicorn’’ strategy vigorously since the beginning of 2016. Fosun believed that it could forge a group of highly competitive unicorns in the industries of wealth, health, happiness and innovation production apart from the past internet enterprises, by utilizing idle and cheap resources through mature products or models, and by promoting traditional industries to be integrated with mobile internet and artificial intelligence.
Fosun developed ‘‘Unicorn’’ strategy vigorously for new investments at first:
• Focus on discovering/investing in “Unicorn” for new investments
1. VC/PE investments: Guahao.com and etc.
2. Greenfield investments: Mybank, Cainiao and etc.
3. State-owned enterprise reform: Sinopharm and etc.
4. Public market investment: Focus Media and etc.
• Promote investments to transform into “Unicorns”
Fosun Medical, Fosun Tourism and etc.
• Transform the Group into a “Unicorn” in long-term
• Increase cooperation with “Unicorn” enterprises

FOSUN’S ACHIEVEMENTS
FOSUN INTERNATIONAL LIMITED Annual Report 201510
DEEPLY INTEGRATED WITH MOBILE INTERNET AND BENEFITED FROM GLOBAL INDUSTRY EVOLUTIONFosun believed that China’s huge demographic dividend was switching from the advantages in manufacturing industry brought about by huge cheap labor to the growth of the world’s biggest consumption market brought about by huge population as well as the growth of world’s biggest mobile internet market brought about by the world’s biggest group of internet users. Because of this, Fosun believed China is having a great opportunity —— traditional industry comprehensively based on mobile internet, big data, cloud computing and other modern information technology, evolving a higher efficiency of “intellectual economy” business model, and thus become the “unicorn” boom.
Fosun has successful explorations and investments now:
Built strong middle and back offices to share the Group’s resources and huge customer resources
On the internal management, considered “Fosunlink” APP as a comprehensive mobile internet platform for business development and internal management, broke through personnel, legal, financial, auditing and other global internal support resources with the mobile internet technology to build a strong middle and back offices and shared the Group’s global internal support resources, better realizing goal of “Front-end essential team + Globally big Group resources”. Fosunlink connects approximately 40,000 employees and over 100 enterprises; and
Vigorously promoted Star plan based on data-driven Online to Offline (O2O) solutions, and implemented customer resources sharing with all investment enterprises. The plan had covered real behaviour data of over 30 million users in industries such as finance, health, happiness and real estate.
In addition, Fosun invested and cultivated vigorously in mobile internet applications related to wealth, health, happiness, especially driving integration between traditional business and internet applications. For example, Redcollar Kute Smart focused on customer-to-manufacturer (C2M) massive suit-making business model, which had been industry-wide popularized; Guahao.com, Mybank, Cainiao.com and so on also showed enormous growth room in the future.
EVOLUTION IN ORGANIZATION AND TALENT DEVELOPMENT STRATEGY In early 2016, Fosun announced building system of global core management staff, and published the first batch of 18 global core
management staff. Fosun granted options to subscribe for an aggregate of 111,000,000 Shares at HKD11.53 per Share to the first 18 global core management staffs;
Fosun required each core management staff being sustained in entrepreneurial state: always want to innovate and create, always study, always contemplating new business model, and have energy, capability to reach goals;
Fosun established a professional investment team of global market, and the population of managing director reached 196 worldwide; and
Fosun had established flattened organizational structure: adapting “small organization – big group” global structure to adapt to the internet environment forming multiple small but flexible organizational forms to quickly respond to market changes, establishing project oriented, efficient, flattened, networked elite organization.

FOSUN’S ACHIEVEMENTS
FOSUN INTERNATIONAL LIMITED Annual Report 2015 11
CONTINUED TO REFINE PRODUCT STRENGTH, INTEGRATE RESOURCES IN ECOSYSTEM AND STIMULATE ORGANIC GROWTH
Continued to Refine Product Strength, Created New Products and Services Derived from Mature Brands
Wealth
‧ United Family Hospital and Chancheng Hospital joined hands with Yong’an P&C Insurance to launch special health insurance products; and
‧ Fosunling and Chuangfu Finance Leasing jointly launched asset-backed securitization products.
Health
‧ Fidelidade and Luz Saúde jointly launched healthcare management services;
‧ Fosun Pharma: applied for a total of 89 pharmaceutical manufacturing and R&D patents, obtained 15 licensed patents, among them: 9 invention patents (including 1 U.S. patent); invested in U.S. daytime operation center to explore new medical service model; and
‧ Put great emphasis on following four major sectors: population aging, newborns, sub-health and tumors.
Happiness
‧ Club Med launched clubs for families and children; and
‧ Thomas Cook launched differentiated and extensive overseas tourism products for Chinese customers.
Integrated Resources in Ecosystem, for example: Building Up Tourism Ecosystem
In face of growth and upgrade of tourism consumption of the Chinese families class, integrated excellent resources globally and built up the tourism ecosystem that has tourism destination and content as its core, tourism channel as its resource link and development capability for tourism complex as its backbone to generate multi-level synergies.

FOSUN INTERNATIONAL LIMITED Annual Report 201512
LETTER TO SHAREHOLDERS
Chairman Fosun International Limited
Guo Guangchang
To all shareholders of Fosun:Thank you for your trust in Fosun and the management all these years!
As I stated in the letter to shareholders last year, “Fosun has undeniably entered a high-growth superhighway”. During the past year, we did make substantial progress on top of our achievements made in the previous year. Specifically, benefiting from its unique “insurance + investment” twin drivers core strategy in the past year, Fosun continued to make great strides in financing, investment and the optimization of its overall asset-and-liability structure.
These improvements were directly reflected by the consistent and substantial growth in the major indicators of Fosun’s performance during the past few years. As at 31 December 2015, the total assets of the Group reached RMB405.34 billion, representing a year-on-year growth of 24.8%; equity attributable to owners of the parent reached RMB75.3 billion, representing an increase of 52.3% from the end of 2014, and the net asset recorded a CAGR of 43.1% for 11 consecutive years since 2004. Profit attributable to owners of the parent reached RMB8.04 billion, representing an increase of 17.3% from that of 2014 and also a CAGR of 24.0% for the last four years. The Board resolved to recommend payment of a final dividend of HKD0.17 per Share for the year ended 31 December 2015.
The rapid growth of Fosun was not incidental but was a result of how we have built up our strength for the long-term development. Especially in the complex and ever-changing global economy environment, the Board, the management and I as a whole are fully aware of what Fosun has to do, and that is to be more focused on its organic growth, to discover, invest and nurture “Unicorns” to penetrate internal and external core resources of Fosun, to polish our products with artisan spirit, so as to provide families with one-stop solution integrating wealth, health and happiness and to serve our clients well while creating value for them.
In 2015, we achieved encouraging results in many different aspects. We are confident that the growth in these areas will continue in 2016.
Scale of investable assets in insurance continued to grow rapidly; profit increased significantly in insurance segmentInsurance remains the most significant business segment of Fosun. In 2015, we further increased our shareholding in Fidelidade to 84.986%, and injected supplemental capital of Euro500 million in December 2015. We successfully completed two important transactions, namely the acquisition of Ironshore, which is a global insurance company focusing on specialty insurance, and MIG, a US property and casualty insurance company with rich experience in labor insurance. Fosun, therefore, has begun to take its own shape of global insurance business network that consists of Yong’an P&C Insurance, Pramerica Fosun Life Insurance, Peak Reinsurance, Fosun Insurance Portugal, Ironshore and MIG.

FOSUN INTERNATIONAL LIMITED Annual Report 2015 13
LETTER TO SHAREHOLDERS
As at 31 December 2015, the total assets under the insurance segment of Fosun already reached RMB180.6 billion, accounted for 44.6% of the Group’s total assets, representing an increase from 32.9% at the end of 2014. Total investable assets reached RMB160.4 billion, representing a significant increase of 50.2% compared with that of 2014. Profit attributable to the owners of the parent from the insurance business segment rose by 88.4% year-on-year to RMB2.10 billion, which accounted for 26.2% of the profit attributable to the owners of the parent of the Group. The profit attributable to owners of the parent from the insurance segment increased at a CAGR of 100.5% from 2013 to 2015.
The growth in the scale of the insurance segment continued rapidly, but a more important meaning to us was that the insurance-oriented integrated financial gene of Fosun that comes from its insurance business has been rapidly evolving and developing. It had a profound impact on our overall operation and profit model:
First of all, each of the insurance companies under Fosun performed excellently in terms of cost control. As to the non-life insurance business, other than MIG, which was newly consolidated, that had a net combined ratio of 100.3%, the net combined ratios of Ironshore, Yong’an P&C Insurance and Fosun Insurance Portugal were less than 100%, namely 96.7%, 98.0% and 98.4% respectively. As to the life insurance business, Fosun Insurance Portugal had an average guaranteed interest rate of 2.2% for the existing deposit life insurance, of which, the average guaranteed interest rate of the new deposit life insurance was only 1.8%. The average guaranteed interest rate of the relevant products of Pramerica Fosun Life Insurance was 2.7%. The insurance segment has cost control capability that makes it competitive in the industry. This, together with Fosun’s competencies in professional global investment, allowed the insurance segment to maintain its average spread1 at 2.9% in the volatile and fluctuating global capital market in 2015.
Furthermore, as the insurance companies under Fosun were located across the world, our liabilities and assets were denominated in a more diversified and balanced portfolio of currencies. As at 31 December 2015, assets denominated in Euro, USD, RMB and HKD accounted for 42.7%, 38.7%, 8.8%, and 4.2% respectively of the total investable assets of the insurance segment. Apart from the assets denominated in the above-mentioned currencies, there were a few held in GBP, JPY and other currencies. This diversified insurance liability structure allowed us to deal with the increasing volatility in the global exchange rates with ease and form a natural hedge position to mitigate the risks.
Additionally, the insurance companies under Fosun provide diversified products and services of risk management and wealth protection to families as well as providing stable and rapidly increasing profits for Fosun. We are confident about the prospect of Fosun’s insurance business. Either at present or in the future, our core competence is to build up a global insurance business network with the resources and
support from Fosun. The synergies between different businesses of the different insurance companies and the flow and development of talents have let the value of the whole insurance segment keep rising.
Our operations will have two focuses in 2016 and the coming year -- strengthening post-investment management so as to expand and improve the existing insurance companies and, at the same time, formulating comprehensive mechanisms for post-investment management. While consolidating our post-investment management, we will continue to identify quality businesses as investment targets. We will look for acquisition targets which enable synergies with existing insurance companies and whose products can supplement ours. For instance, Peak Reinsurance acquired 50% shareholding of a Caribbean property insurance company, namely NAGICO Holdings Limited, which is under regulatory approval. On the other hand, we will actively explore new models for the growth of the investable assets of our insurance business, for example, the Run-off of insurance assets. In this way, we will be able to steadily expand our foothold in insurance segment to build a first-class insurance group in the world.
Asset-end to focus on demand for wealth, health and happiness from familiesDuring the past few years we discovered a very important trend, China is experiencing a “quality revolution” in consumer goods. As at the end of 2015, retail consumption already contributed 66.4% of China’s GDP growth. Middle-class families were rapidly emerging in China, and they are no longer content with low-end and cheap goods. They were already seeking for high-quality products. The middle class families are becoming the key driving force of the consumption growth of China. We believe that the future growth of China will be increasingly driven by consumption. Wealth preservation and appreciation, health management and happy lifestyle of each person will feature prominently in consumption. These are also the same values being pursued by families all over the world. Therefore, our asset-end will focus more firmly on Business-to-Family (B2F). We will make families wealthier, healthier and happier through Fosun’s products and services.
As at 31 December 2015, the total scale of the assets of the three business segments, namely wealth, health and happiness rose by 47.7% compared to that as at the end of 2014 to RMB303.4 billion, which accounted for 74.8% of the total assets of the Group. Their net assets increased by 77.2% compared to that as at the end of 2014 to RMB44.3 billion, which accounted for 45.1% of the Group’s total net assets. Operating revenue grew by 84.6% compared to the same period of 2014 to RMB38.7 billion, which accounted for 49.1% of the total revenue of the Group. Profit attributable to owners of the parent increased by 47.7% compared to the same period of 2014, to RMB7.7 billion, which accounted for 95.3% of the profit of the Group attributable to owners of the parent.
1 Based on total investment yield.

LETTER TO SHAREHOLDERS
FOSUN INTERNATIONAL LIMITED Annual Report 201514
Wealth segment: Fosun hopes to provide its customers with a comprehensive solution for a wealthy life through the development and accumulation of its wealth segment. We are devoted to building a global platform of household wealth management, which includes not only the risk management and the wealth protection provided by different insurance products, but also integrated financial services in a more diversified manner including families’ wealth development management allocation and internet finance. As at the end of 2015, total investable assets of our insurance business were RMB160.4 billion; the size of fund under the Group’s direct management was RMB63.39 billion. We had multiple business licenses to support the diversified development of Fosun’s finance business. We wish to provide our clients with diversified investment options and higher investment return by combining the wide scope of Fosun’s businesses and its competence in investment, thereby enhancing our integrated financial capability.
On top of the past achievements of Fosun’s wealth segment, we have made progress in numerous areas in 2015. This included the official opening of Mybank, which was jointly established by a number of shareholders, including Ant Financial and other parties. Following its investment in IDERA in Japan, Fosun set up a real estate investment and asset management platform, Resolution Property, in the United Kingdom (UK) and an integrated financial platform, Fosun Eurasia Capital, in Russia. It also established innovative financial entities such as Yuntong Small Loan, Fosunling and Fortune Credit in China. The Group announced its acquisition of the 100% equity interest in H&A, one of the largest independent private banks in Germany. The transaction is now pending for regulatory approval. Apart from the above, Hani Securities (H.K.) Limited, wholly-owned by Fosun was officially renamed as Fosun Hani Securities in early 2016, which will become an integral component in our global wealth management network. The household wealth management model of wealth segment helps the Group obtain long-term and stable management income by managing and operating the light-assets.
Health segment: Since the establishment of Fosun, pharmaceuticals and healthcare have been one of its core industry segments. After more than 20 years of development, the health segment of Fosun has become the pioneer in the pharmaceutical and healthcare industry in China. Absolute competitive advantages had been formed over various aspects such as pharmaceutical industry, pharmaceutical distribution and retail, medical devices and diagnosis, as well as healthcare services. The global pharmaceutical and healthcare industry is now undergoing a new round of explosive growth. In particular, there is a lot of room for development in market segments such as hospitals, senior living, health insurance and internet medical care.
Against this backdrop, the health segment of Fosun is ready to grasp opportunity for consolidating its advantages and it is to focus on four main areas, namely population aging, newborns, sub-health and
tumors. We will build a closed-loop ecosystem for the mega-health industry by comprehensively upgrading medical services and medical technology, connecting health management and health insurance, and actively adopting modern information technology. Here, I would like to emphasize the three new directions for the health segment of Fosun:
Firstly, it is about the establishment of the medical service system of Fosun, for which the core is comprised hospital and senior living, which we undertook in the past few years. As at 31 December 2015, we had already invested in 13 hospitals, 2 healthcare units, 7 private clinics with a total of 3,777 beds. The total area of our senior living communities, including the high-end senior living service provider Starcastle Senior Living, have a total GFA of 96,700 sq.m., with 1,090 beds in total; the total GFA under construction was 342,259 sq.m., with 2,977 beds in total in 2015. On such basis, we also consolidated offline medical care services with mobile internet medical care, thus forming a closed-loop mega-health ecological system that comprises “Insurance + Medical Care + Rehabilitative Senior Care” through health insurance.
Secondly, it is about health management + health insurance. This is the most powerful driving force in enhancing the value of Fosun’s health segment. In Portugal, Fosun Insurance Portugal and Luz Saúde cooperated in launching the product MultiCare, which is a leading product in the industries of local health management and health insurance. A series of products that the two companies have since developed also enhanced their competitiveness in the market. In China, Yong’an P&C Insurance launched health insurance products with United Family Hospital and Foshan Chancheng Hospital separately and launched healthcare management with Star Healthcare, thus became important participants and innovator in the industry within a short time. The key to the development of “health management + health insurance” is bringing satisfaction to the customers through products, services of premium quality and protection that is timely and convenient. Moreover, we also hope that the incident rate of customers’ illnesses will be at a low level, and that our customers enjoy a healthy life by using our products and services. This is in fact our ultimate wish.
Thirdly, it is about the innovative medical care based on modern information technology such as mobile internet and big data. We had invested in a number of distinguished new medical projects. We had also set up venture capital teams and Angel investment teams that are specialized in internet health, aiming to create incubation platforms suitable for the rapid development of new healthcare models. These initiatives enable us to predict the future trend of medical services and technologies proactively so that better technologies, services and business models can be adopted to bring healthier life to the families.

LETTER TO SHAREHOLDERS
FOSUN INTERNATIONAL LIMITED Annual Report 2015 15
Happiness segment: A memorable family vacation, a wonderful show or movie, a delightful meal, and fashionable clothes -- every good experience formed a part of our happy life. Fosun is searching for the best resources in the world to bring such happiness to our clients.
In 2015, we completed the acquisition of Club Med, a global brand of high-end tourism chain. We invested in Thomas Cook, a leisure travel group in the UK, and Cirque du Soleil, which is part of the quintessence of Canada, as well as Silver Cross, a high-end nursery brand in the UK. Meanwhile, Studio 8 had invested in four films including two films directed by Lee Ang, one of which will be released in the second half of 2016. Yuyuan also acquired Hokkaido Hoshino Tamamu Resort, which is one of the most popular vacation destinations for tourists in Japan. These were achievements that my partners and I felt proud of.
What was more exciting was that under the strategy of “Combining China’s Growth Momentum with Global Resources”, Club Med substantially expanded its development in China. There are now four resorts, located in Yabuli, Guilin, Zhuhai Dong’ao Island and Sanya and there are plans to open 15 more resorts in the coming three years. Fosun had formed a joint venture with Thomas Cook in China to encourage overseas tourists to visit China and Chinese tourists to travel overseas. The construction of Sanya Atlantis is on schedule and it is expected to have a soft opening in July 2017 and an official opening sometime in the second half of 2017. Cirque du Soleil has built its first permanent venue for performance in Hangzhou, which is the first one in China. The latest world tour Toruk – The First Flight had its premiere in December 2015 in Canada, it is planned to be shown in China in 2017.
Continue to enhance the Group’s rating through optimization of liability structureFosun is a responsible global financial enterprise. Therefore, we have to be very proactive in controlling risk and abiding by local laws and regulations. This is our corporate culture and also our values. Meanwhile, there is another point that is very important to us, we have to enhance our financial strength through ongoing optimization. From 2013 onwards, our net gearing ratio declined from 86.0% of 2013 to 73.3% of 2014, and to 69.3% as of 31 December 2015. At present, we have stated a clearer goal - Fosun has to optimize its financial structure and maintain its financial stability with the fastest speed from now on, aiming for a higher global rating of Fosun, that is, investment grade.
First of all, we will integrate with the capital market better, keep speeding up the liquidity of the invested enterprises. This will enhance our advantage in asset liquidity continually. For instance, we are actively seeking to list our investment projects on the stock exchanges. In 2015, there were already eight projects that were listed as A shares or H shares and four projects listed on NEEQ. We create a “listed companies + PE” investment model, to realize the market liquidity of the investment project outside China through the A-share stock market.
Secondly, we fully take advantage of the low interest rate and the rate cut cycle in China to optimize the debt structure so as to reduce financing cost, extend the loan tenure and increase RMB liability. As of 25 March 2016, the total amount of approved issuance of medium-long-term bonds was RMB36.8 billion and the total amount of issued medium-long-term bond was RMB16.8 billion. Specifically, from 1 January 2016 to 25 March 2016, Shanghai Fosun High Technology (Group) Co., Ltd. issued RMB4.0 billion worth of corporate bonds, with a term of five years and a coupon rate of 3.78%. Fosun Pharma issued RMB3.0 billion worth of corporate bonds with a term of five years and a coupon rate of 3.35%. Forte issued RMB1.0 billion worth of corporate bonds, with a term of three years and a coupon rate of 3.6%. Yuyuan issued RMB0.4 billion worth of medium term notes, with a term of three years and a coupon rate of 3.5%. Sinopharm also issued RMB4.0 billion worth of corporate bonds with a term of five years and a coupon rate of 2.92%. Meanwhile, we are also actively promoting asset securitization. For instance, Forte launched property management fee asset-backed securitization (ABS), with total amount of RMB1.5 billion. At present, the debts which will mature in three years or beyond accounted for 40.0% of Fosun’s total debts as at the end of 2015, up from the 31.1% as of 31 December 2014 in its consolidated financial statements.
Thirdly, with respect of the industries we are operating, we will continue to benefit from strong economic growth in China, and we will continue to develop our businesses in wealth, health and happiness. Currently, the total assets of the three major segments of wealth, health and happiness already accounted for 74.8% of the total assets of Fosun. As previously mentioned, we have to deliver to our clients the best one-stop integrated solution, based on our concept that we, through our three business segments, can tap into the same families which invested in industries related to wealth, health and happiness that satisfied their core demands. This will also allow us to minimize the risk of over-reliance on a certain industry, use an asset-light business model to operate asset-heavy industries and improve the return on assets as a whole.

LETTER TO SHAREHOLDERS
FOSUN INTERNATIONAL LIMITED Annual Report 201516
Fourthly, besides the operational performance, a growth in equity attributable to owners of the parent is also noteworthy. As of 31 December 2015, our equity attributable to owners of the parent grew by 52.3% to RMB75.3 billion, and equity attributable to owners of the parent per share increased by 22.5% to RMB8.74. Fosun attained a CAGR of 43.1% in the equity attributable to owners of the parent in the past 11 years. Meanwhile, the cumulative share dilution of the controlling shareholders is less than 30.0%.
Develop light-asset strategy and “Unicorn” strategy vigorouslyFosun provides clients with products and services related to wealth, health and happiness. Meanwhile, it constantly optimize its debt structure, aiming for a higher rating of the Group. This means that we have to vigorously develop light-asset strategy and “Unicorn” strategy and keep refining the products.
Let us start by discussing our light-asset strategy. “Light-asset” is probably a catchphrase on most people’s lips. However, when we emphasize “Light-asset”, we do not mean that Fosun will not work on asset-heavy businesses. In a nutshell, we will make the best use of investment platforms from different levels of listed industrial companies, insurance companies and funds, etc. under control to help to control the Group’s capital expenditure and capitalize on the high leverage of insurance. Furthermore, Fosun will combine its asset-light strategy with asset-heavy businesses, thus building up its capability of operating both asset-light and asset heavy assets.
Fosun’s core competence in “light + heavy” assets management is to upgrade the capability of operating light asset by refining the products and services, and then leverage its light assets to operate heavy assets thereby enhancing the rate of return on assets as a whole. During the past year, we had finalized a number of projects through the model of “Insurance + Industry + Hive 1 + 1 + 1”, including the Ningbo Rehabilitation Medical Care Community and Shenyang Yulongcheng, etc.. Now, some heavy assets are lying idle or not adequately utilized in China, and we will build up our competences in “Wealth +”, “Health +” and “Happiness +” more quickly so as to demonstrate the extent of vertical integration and competitive advantages enjoyed by Fosun. We have to utilize Club Med and Atlantis to take charge of hotels which have previously been poorly managed. We have to deploy the management of United Family Hospital and Luz Saúde to revitalize the hospitals which have been run with low efficiency. We will utilize Cirque du Soleil to add impetus to a large number of performing arts venues which are lying idle in China. Our insurance assets should also be managed and operated with a light-asset model to secure stable revenue in the long term.
As a part of the light-asset strategy, how to define “Unicorn” enterprise? In my opinion, first of all, the “Unicorn” gene is necessary, and product is the most important criteria to determine. It may be the product, or the business model underlying the product, which can be used to revitalize enormous resources which have been run with low efficiency or have been lying idle. In other words, the development of a “Unicorn” requires the support of enormous resources. This is an advantage of Fosun. Secondly, in order to become a real “Unicorn”, one has to focus on clients and products, so that the Unicorn is forged step by step with artisan spirit.
In addition to the internet companies in the past, we can also create a number of competitive Unicorn companies in the industries related to wealth, health, happiness and innovative manufacture with our capability of combining light and heavy assets. We can achieve this by adopting mobile internet and artificial intelligence in traditional industries and by using mature products or business models to assemble the idle and low-cost resources.
Based on the logic mentioned above, we will make effort to seek for “Unicorn” enterprises for investment. We will endeavor to transform the existing projects into “Unicorn” enterprises and enhance the cooperation with enterprises with “Unicorn” gene. The Group will also work to develop itself into a “Unicorn” enterprise in the long term. These are the initiatives we will take under our “Unicorn” strategy in 2016. We want to identify the enterprises with the best “Unicorn” gene. We will combine full advantages of Fosun’s resources to speed up the development of the Group into a “Unicorn” in the industry.
Deeply integrated with mobile internet and benefited from global industry evolutionThe demographic dividend of China’s huge population is now transferring from the huge cheap labor force in manufacturing industry to the growth of the biggest consuming market based on its huge middle class population and the increase in the biggest mobile internet market based on its largest internet-using population in the world. The new technologies, such as artificial intelligence (AI), virtual reality (VR), augmented reality (AR), big data and Industries 4.0 and etc. are emerging one after another. Even the mobile internet is already becoming the past to some extent. The speed of technological development had far exceeded everyone’s imagination, whilst the rapid development of technology had greatly accelerated the pace of information dissemination. Now, no matter what had happened at anywhere in the world, this would soon impact the whole world. As to China, due to the spread of smartphones and mobile internet, progresses in informatization and internet coverage accelerated in the whole society, including the rural areas. It is hard to predict what would happen when the united economy of 1.3 billion of population are all relying heavily on the mobile internet. Maybe all principles of economics in the past will fail, as this is something that has never happened in human history before.

LETTER TO SHAREHOLDERS
FOSUN INTERNATIONAL LIMITED Annual Report 2015 17
Against this backdrop, I sincerely believe that China has great opportunity – traditional industries are adopting “intelligent economic entity” business models by adopting such modern information technologies as, mobile internet, big data and cloud computing. Such industries and China can emerge as “Unicorns”.
Fosun is most well-positioned to capitalize on this situation because it is the earliest company to have further developed in the industries in China from a global perspective and to have acquired and consolidated resources and combined them with the driving forces in the country. In recent years, we have also explored internet and adopted it in traditional industries. Now, there are successful examples of such attempts in recent years:
Firstly, with mobile internet technology, Fosun has built a strong middle and back offices. Fosun will be the only platform, with each business segment serving as a “battle force” with specific functionality. Moreover, those “battle forces” share the middle and back offices, and their clients’ data, IT system and data entry are in a unified and accessible format at the Group level. The combination of such competent, agile front-line teams and the unified middle and back offices allows Fosun to adapt itself promptly to changes. Specifically, this includes an APP named “Fosunlink”, which is the unified mobile internet platform for our business development and overall internal management enabled on mobile telecommunication devices, share the resources from all over the world within the Group, in order to achieve the goal of “Front-end essential team + Globally big Group resources”. Currently, Fosunlink covers about 40,000 employees in over 100 enterprises. In the future, the middle office and the back office of Fosun will be refined and assembled based on the mobile internet. This is not to turn the personnel at middle and back offices into a group of bureaucrats who are far removed from the battle, but to make them a part of the battle force, embed them who have been engaged in the operation process into the business process, support the staff at “the front” with “bullets” and “firepower” at all time. Meanwhile, our staff in “the front” should be more compact, flexible and agile.
Secondly, vigorous promotion of the Star Plan which is based on the data-driven Online to Offline (O2O) solutions achieves the resources sharing between all the invested enterprises of the Group and the huge family clients. The plan already covered the business of finance, health, happiness, real estate and etc. with real consumption behavior data of over 30 million users. Specifically, Fosun is paying attention to the rising consumption of the E-generation, who are born internet followers and live with the mobile internet. We have to create astonishing products which are pleasant surprises through mobile internet.
Thirdly, Fosun always has sensitivity, judgement and preparation to the new technology and new business models. It is geared up for opportunities presented by new businesses. We set up Fosun Kinzon Capital VC teams and Angel investment teams that are specializing in internet finance, internet health, internet real estate and vehicle, O2O operations, internet education, online tourism, medium small
enterprises’ services and etc.. As of 31 December 2015, Fosun Kinzon Capital invested in 35 projects, with a total invested asset of approximately HKD1,452 million. On the other hand, we actively invest in and cultivate wealth-related, health-related and happiness-related APPs, especially those that combine traditional business with internet. For instance, the model of Redcollar Kute Smart in which the investment focuses on Customers-to-Manufactory (C2M) suit-making on a large scale has been promoted to the whole industry. Other projects like Mybank, Cainiao and guahao.com (掛號網) etc. show big room for growth as well.
With the global partnership system, Fosun is evolving into an elite organizationThere is another thing I wish to share with you. Fosun is evolving into an elite organization. At the beginning of 2016, we announced the first 18 global partners2 of Fosun at the group level. I also wrote a letter to the global partners. In the letter, I had discussed a lot of my thoughts. But I would like to repeat the most important things here. I still wish to share with you why Fosun has to establish the global partnership system. What can the global partnership system bring to Fosun?
Fosun has been an organization that never get tired of learning. We keep learning from the world’s most outstanding enterprises, and flexibly apply what we have learnt to our development. Specifically, Fosun was most attracted to three models: the first one was Buffett’s “insurance + investment” twin drivers core strategy; the second one was the model we learnt from GE, that is, the one that enables us to enhance productivity while reinforcing the advantages of Fosun’s industries. The third model was the culture of elite organization and partnership we should learn from Goldman Sachs.
What we expected to our partners, first, the global partners of Fosun are just like entrepreneurs. They have got to have such entrepreneurial spirit and continuously operate the businesses with it. An entrepreneur has to keep on fighting. They must be that type of people who will try again and again to achieve the goal no matter what difficulties he would meet. Meanwhile, our partners should be versatile players, they should have expertise and spirit, understand and know each business segment of Fosun very well, have the capacity of quick learning and promote adaptability in management, core business operation (such as insurance), product enhancement and etc..
The global partners of Fosun must also have a consistent set of value propositions, who sincerely recognize the mission and vision of Fosun from the most inner parts of the mind. Since the partners are members of the “Fosun families”, we have to communicate frankly, we have to try our best in learning, and we have to achieve evolution on our own. We ask our partners to constantly think of innovating, creating, and learning. They have to think of new business models continuously, whilst having the ability and energy to implement them. I am very pleased that among the first batch of global partners, there were international faces like the CEO of Fidelidade. We believe that in the near future we will have more and more young, energetic new faces who are willing to learn and meeting our standards to join us.

LETTER TO SHAREHOLDERS
FOSUN INTERNATIONAL LIMITED Annual Report 201518
The global partnership of Fosun is a management tool with visions and thinking, which can be demonstrated at every level. The partners are not engaged on permanent basis, and cannot be ranked in terms of seniority. Those who fail to meet the standard must withdraw. First of all, it is a culture, and ultimately it becomes a form of motivation. And it is complementary to the global partnership system. The evolution of our organization is based on projects, with the aim of becoming an elite organization that is comprehensive, efficient and flat. We must take full advantage of mobile internet technology to further reduce the hierarchy of the organization system so that it is becoming more and more efficient. Therefore we have developed the “Fosunlink”. I hope all our members of Fosun Family can create a transparent network structure on “Fosunlink” that covers the world with the fastest speed of response mapping our organization.
In 2016, Fosun will maintain the momentum of its consistent and rapid growth by more focusing on its organic growth and product refinementI also want to discuss with you a question I thought a lot recently, that is the relationship between “slow” and “fast” of an enterprise’s development. In the past, all of you witnessed the fast development of Fosun, but now we have to cultivate “Unicorn”, which have to focus on safe and sound assets. Therefore, we must handle the relationship between “slow” and “fast” in a proper manner.
First, we emphasize “slow” because we want to refine the products and services, and insist on doing the right things. If we do not pay attention to such details, and fail to proceed step by step, then our products will not be able to attract the customers. In such case, there will be no future for us. Therefore, we have to slow down, and we have to constantly refine our products. Only then can we emphasize the second word –“fast”. When we have a very good product, we will allocate all resources to it, so that it quickly develops into a “Unicorn”. Fosun eventually will become a giant “Unicorn” with enormous power.
Based on Fosun’s well-developed strengths and fundamentals, we will build up the capabilities of “wealth+”, “health+” and “happiness+”, quickly, enhance the products patiently, and replicate speedily the products and models which have become mature, fully leverage the strength and advantages of Fosun’s businesses and create value for our clients consistently. At the same time, we will support Fosun’s existing enterprises in their investment and consolidation of resources related to the themes of wealth, health and happiness around the world. This will also enable them to refine their products, thus enhancing their competitiveness. For instance, we have found that
the “Mini Club” in the resorts of Club Med is always the most popular place among the children, and the parents also like it very much, since they get more leisure time because of it. We will speed up the promotion of the popular products like this in the future by introducing them into Fosun Hive, for example, “Mini Club” will be located in BFC Shanghai to let people enjoy high-quality services in their daily lives. As another example, we will tap into the growth and the trading up of Chinese families’ demand for tourism by integrating the high-quality resources from Club Med, Cirque du Soleil, Atlantis, Thomas Cook and Yuyuan. Leveraging the sales channel resources of our invested enterprises and our profound capability of establishing the integrated tourism complexes, we can then build a synergistic tourism ecosystem with tourist destinations and tour program as its core.
I think the most competitive enterprises in the future are those which understand the mobile internet, traditional industries, supply chain, how to create services and are well-versed in finance and capital market. Fosun has a strong first-mover advantage in businesses because it has the capability of making anticipatory moves to invest in them and to integrate global resources according to the characteristics of the new economy. Therefore, Fosun takes a two-pronged approach to building a closed-loop ecosystem of businesses – on one hand, it has to seek out the most competitive products in the world in terms of content, service and intellectual property (IP); on the other hand, it has to integrate the flow of information and capital and logistics by gaining direct access to clients and understanding their needs and wants through the various and widely scattered mobile devices. On this basis, we will seamlessly match the products and clients and continue to seek for Unicorns which enable the business model of customer-to-manufacturer (“C2M”) in design and production.
At last, I would like to thank again all of you for your trust in me and Fosun. Fosun and I deeply care for China, and love the staffs, clients and every partner all over the world! You have my words that both Fosun and I will sincerely and devotedly provide a broader platform for our family to grow! You have my words that Fosun will certainly become a great global multinational enterprise!
Guo Guangchang30 March 2016
2 It refers to the core management of the Group, which is different from the legal concept of “partners” under partnership.

FOSUN INTERNATIONAL LIMITED Annual Report 2015 19
CORPORATE STRUCTURE

FOSUN INTERNATIONAL LIMITED Annual Report 201520
CORPORATE STRUCTURE
Notes:
1. Percentages of shareholdings held represent effective equity interests as at 31 December 2015.
2. Dotted line indicates the projects which were not yet closed as at 31 December 2015.
3. The Group held 84.986% equity interest in Fidelidade, 80% equity interest in Multicare and 80% equity interest in Fidelidade Assistência.
4. The ordinary shares of MIG were delisted and ceased trading on the New York Stock Exchange in July 2015.
5. The Group held 90% effective equity interest in Lloyds Chambers as a limited partner and 0.005% effective equity interest as general partner.
6. The Group held 3.57% equity interest in Zhaojin Mining via its wholly-owned subsidiary Shanghai Fosun Industrial Investment Co., Ltd. In addition, Yuyuan, a
26.45% owned associate of the Group, also held 25.73% equity interest in Zhaojin Mining.
7. As at 31 December 2015, the Group held 9.96% equity interest in Folli Follie. In addition, Pramerica-Fosun China Opportunity Fund held 3.89% equity interest
through its wholly-owned subsidiary. In February 2016, the Group increased its equity interest in Folli Follie to 10%.
8. In July 2015, the Group made an offer to acquire all of the registered no-par value ordinary shares of H&A, which had been accepted by a number of
shareholders wihch hold more than 80% of the registered no-par value ordinary shares in H&A as of 7 July 2015. Currently, the acquisition is still in the
process of obtaining regulatory approval.
9. The Group held in aggregate 86% equity interest in Fosun Finance Company via Fosun High Technology and Fosun Pharma. In addition, Nanjing Iron &
Steel United Co., Ltd., a wholly-owned subsidiary of Nanjing Nangang (a joint venture in which the Group had 60% equity interest), held 9% equity interest in
Fosun Finance Company, and Yuyuan, a 26.45% owned associate of the Group, held 5% equity interest in Fosun Finance Company.
10. The Group held in aggregate 68% equity interest in Yuntong Small Loan through its wholly-owned subsidiaries Fosun South Investment Management
Co., Ltd., Shanghai Xingxin Investment Consulting Co., Ltd. and Shanghai Yuzhi Investment Management Co., Ltd. In addition, Yuyuan, a 26.45% owned
associate of the Group, held 16% equity interest in Yuntong Small Loan.
11. The Group and Fosun Chuanghong under its management held 16.67% and 3.78% equity interest, respectively, in Sanyuan Foods.
12. The Group held 80% equity interest in Class A investors of Studio 8, and the shares held by Class A investors represent 60% of the total share capital of
Studio 8.
13. CMF and Zhejiang Growth Fund managed by the Group and Yuyuan, an associate of the Group, held in aggregate 25% equity interest in Cirque du Soleil.
14. The Group held 5.76% equity interest in Thomas Cook through Fidelidade.
15. The Group held 60% equity interest in Nanjing Nangang through Fosun High Technology, Shanghai Fosun Industrial Investment Co., Ltd. and Fosun
Industrial Development, but the Group was deemed to be indirectly interested in 50% of voting rights of Nanjing Nangang.
16. Results of the real estate series funds of Forte are included.
17. The Group directly owned 50% equity interest in Dalian Donggang, and held the other 50% equity interest through Star Capital, and in turn held 64% effective
interest in Dalian Donggang.

FOSUN INTERNATIONAL LIMITED Annual Report 2015 21
MANAGEMENT DISCUSSION & ANALYSIS
BUSINESS REVIEWAs at the end of the Reporting Period, net assets attributable to owners of the parent of the Group reached RMB75,252.5 million, representing an increase of 52.3% from the end of 2014. During the Reporting Period, profit attributable to owners of the parent of the Group amounted to RMB8,038.3 million, representing an increase of 17.3% over the same period of 2014.
ASSET ALLOCATION OF THE GROUPDuring the Reporting Period, the Group adhered to the philosophy of value investment, actively optimized its asset allocation and continued to implement the investment mode of “Combining China’s Growth Momentum with Global Resources” to build an investment portfolio benefiting from China’s growth momentum.
Unit: RMB million
Segment
Total assetsin 2015 (As at
31 December 2015)
Total assetsin 2014 (As at
31 December 2014)
Changeover the sameperiod in 2014
Integrated Finance (Wealth) 235,840.3 155,086.7 52.1% Insurance 180,597.6 106,902.8 68.9% Investment 37,835.6 37,472.2 1.0% Wealth Management 15,185.8 9,635.5 57.6% Internet Finance 2,221.3 1,076.2 106.4%Industrial Operations 180,753.3 182,118.7 - 0.7% Health 48,037.5 43,286.2 11.0% Happiness 19,507.0 7,042.8 177.0% Steel 9,244.8 43,533.3 - 78.8% Property Development and Sales 95,593.8 78,901.6 21.2% Resources 8,370.2 9,354.8 - 10.5%Eliminations (11,258.4) (12,372.6) - 9.0%Total 405,335.2 324,832.8 24.8%

22
MANAGEMENT DISCUSSION & ANALYSIS
FOSUN INTERNATIONAL LIMITED Annual Report 2015
INTEGRATED FINANCE (WEALTH)
The Group’s integrated finance (wealth) business includes the four major segments: insurance, investment, wealth management and internet finance.

Insurance
Investment
Wealth Management
Internet Finance
23
MANAGEMENT DISCUSSION & ANALYSIS
FOSUN INTERNATIONAL LIMITED Annual Report 2015

MANAGEMENT DISCUSSION & ANALYSIS
FOSUN INTERNATIONAL LIMITED Annual Report 201524
INSURANCENOTE
The Group’s insurance segment mainly includes Fosun Insurance Portugal, Yong’an P&C Insurance, Pramerica Fosun Life Insurance, Peak Reinsurance, Ironshore and MIG.
The Group has regarded insurance as a good means to connect Fosun’s investment capability to high quality long-term capital. On one hand, the above-mentioned insurance companies can improve their profits from underwriting by leveraging on the Group’s extensive industrial operations experience and expertise in insurance and finance, and on the other hand may also help the Group to realize higher investment revenue through effective investment practices. As a result, insurance plus investment will be our core business in the future.
During the Reporting Period, the revenue and profit attributable to owners of the parent of the insurance segment were as follows:
Unit: RMB million
2015 2014
Changeover the sameperiod in 2014
Revenue 14,667.4 7,867.6 86.4%Profit attributable to owners of the parent 2,104.2 1,117.0 88.4%
During the Reporting Period, the increase in both revenue and profit attributable to owners of the parent of the insurance segment was mainly attributable to the business growth of both Fosun Insurance Portugal and Peak Reinsurance. The increase in profit attributable to owners of the parent was also in line with the Group’s acquisitions of 100% equity interest in both MIG and Ironshore which were completed in July and November 2015, respectively.
Note: Financial data presented in this section is based on local accounting standards of individual portfolio companies.

MANAGEMENT DISCUSSION & ANALYSIS
FOSUN INTERNATIONAL LIMITED Annual Report 2015 25
Fosun Insurance PortugalNote
Fosun Insurance Portugal is a global operator in the Portuguese insurance market, selling products in all key lines of business and benefiting from the largest and most diversified insurance sales network in Portugal, including exclusive and multibrand agents, brokers, own branches, Internet and telephone channels and having strong distribution partnerships with the post office and Caixa Geral de Depósitos S.A., a leading Portuguese bank. It also has an international presence in seven countries in three continents (Europe, Asia and Africa). The Group owns 84.986% equity interest in Fidelidade and 80.0% equity interest in each of Multicare and Fidelidade Assistência respectively.
During the Reporting Period, Fosun Insurance Portugal reached a gross premium income of Euro3,971.2 million, a non-life business net combined ratio of 98.4%, a solvency adequacy ratio of 215.7% and the net profit reached Euro301.1 million. Its investable assets totalled Euro13,864.8 million, the total investment return reached 4.7%.
International business of Fosun Insurance Portugal continued to reveal a strong commercial performance, reaching overall Euro202.1 million in direct insurance premiums, an increase of 13.7% when compared to 2014.
Fosun Insurance Portugal’s strong positioning and levels of service in the Portuguese market allowed it to win several distinguished awards in 2015, such as Seguradora com a Melhor Reputação (Best Reputation Insurance Company), Marktest Reputation Index, Marca de Confiança 2015 (Most Trusted Brand), Global Banking & Finance Review: “Best Non-Life Insurance Company Portugal 2015” and “Best Customer Service Insurance Company Portugal 2015”.
Note: Financial data of Luz Saúde and Thomas Cook are included in that of Fosun Insurance Portugal disclosed in Management Discussion and Analysis, however financial data of Luz Saúde is consolidated in the health segment of the Company, while financial data of Thomas Cook is consolidated in the happiness segment of the Company.
Yong’an P&C InsuranceThe Group holds 19.93% equity interest in Yong’an P&C Insurance. Yong’an P&C Insurance is a nat ional insurance company headquartered in Xi’an and operates all types of non-life insurance business. Yong’an P&C Insurance has taken the initiative and will be continuing to adjust and transform its business in 2016. It has discontinued certain less efficient businesses and constantly optimized business portfolio; increased per capita production capacity, reduced the claim settlement cost, enhanced innovative development, and actively explored Internet applications. During the Reporting Period, Yong’an P&C Insurance recorded gross premium income of RMB8,139.6 million, net profit of RMB833.3 million, investable assets of RMB10,855.7 million, net combined ratio of 98.0%, solvency adequacy ratio of 264% and the total investment return reached 10.0%.

MANAGEMENT DISCUSSION & ANALYSIS
FOSUN INTERNATIONAL LIMITED Annual Report 201526
Pramerica Fosun Life InsuranceThe Group holds 50% equity interest in Pramerica Fosun Life Insurance which was established in September 2012. In recent years, the premium received by Pramerica Fosun Life Insurance has been growing rapidly and it has launched several innovative projects, such as Health Manager, Star-Go-Shine Sales Platform, Star-Alliance Plan and PFL Pal. The company continuously promotes products innovation in aspects like Product Segmentation, Best Tailored Insurance Plan, etc.. It is also exploring new sales model of “Insurance + Health Manager + Retirement Community + Overseas Asset Allocation”, and crowdfunding insurance project, etc.. Today, Pramerica Fosun Life Insurance possesses a comprehensive set of product lines spanning from life insurance, accident insurance, critical illness insurance to universal life insurance and health insurance.
During the Reporting Period, the new annualized premium income and the total premium of Pramerica Fosun Life Insurance reached RMB125.3 million and RMB978.1 million respectively (both including universal life insurance policyholders’ deposits). During the Reporting Period, Pramerica Fosun Life Insurance recorded gross premium income of RMB57.2 million, net loss of RMB113.0 million, investable assets of RMB1,903.2 million, solvency adequacy ratio of 985.5%, total investment return reached 6.9%.
Peak ReinsurancePeak Reinsurance obtained its certificate of authorization in respect of the property and casualty reinsurance business from the Office of the Commissioner of Insurance of Hong Kong in December 2012 and the license for underwriting long-term reinsurance business in June 2014. This makes Peak Reinsurance one of the few locally established reinsurance companies in Asia Pacific underwriting both life & health and property & casualty reinsurance business. During the Reporting Period, Peak Reinsurance further expanded its business and brand globally. It announced its plan to acquire a 50% stake in Caribbean insurance group NAGICO Holdings Limited in July 2015. This transaction is currently pending for regulatory approvals. Peak Reinsurance has also set up a Zurich branch in September 2015 to emphasize client’s proximity in Europe. Its business
in Asia Pacific expanded steadily and it has also made solid progress in Europe and North America. In 2015, the gross premium written from Europe and North America accounted for 41.5% of the total premium income, which had an increase of 24.4 percentage points from 17.1% of same period in 2014. As at the end of the Reporting Period, Peak Reinsurance has served over 285 customers in 47 markets around the world, compared to 175 customers as at the end of 2014.
During the Reporting Period, Peak Reinsurance’s gross premium written was USD582.7 million, compared to USD288.1 million for the same period in 2014; net profit was USD59.2 million, increased by USD17.6 million compared to the same period in 2014; net combined ratio was 96.8%; solvency adequacy ratio was 754%; investable assets were USD913 million; and total return on investment was 6.4%. The Group owns 85.1% equity interest in Peak Reinsurance, while International Finance Corporation owns the remaining 14.9% equity interest.

MANAGEMENT DISCUSSION & ANALYSIS
FOSUN INTERNATIONAL LIMITED Annual Report 2015 27
IronshoreIn February 2015, the Group completed the acquis i t ion of approximately 20% of the total outstanding ordinary shares of Ironshore. The purchase price was approximately USD466.6 million. In November 2015, the Group completed the acquisition of all of the remaining interests in Ironshore that the Group did not own previously. The purchase price was USD2,052.0 million in cash. Ironshore is a global specialty insurance company operating principally in Bermuda, the United States, Lloyd’s and Ireland. Its management team has in-depth experience in the insurance industry, broad industry network and outstanding ability to operate a large enterprise, and is regarded highly by peers in the industry.
During the Reporting Period, Ironshore’s gross premium income reached USD2,163.9 million, net profit of USD57.8 million and a net combined ratio was 96.7%, the solvency adequacy ratio was approximately 166.0%. Total investable assets were USD5,103.1 million, and total return on investment reached 1.3%.
MIGIn December 2014, the Group entered into a merger agreement with MIG at a purchase price of USD8.65 per share, representing an aggregate transactional value of approximately USD439.0 million to acquire its 100% equity interest. MIG is a professional property and casualty insurer and an insurance administration services company focusing on niche markets. MIG markets and underwrites specialty property and casualty insurance programs and products on both an admitted and non-admitted basis through a broad and diverse network of independent retail agents, wholesalers, program administrators and general agencies that value service and have specialized knowledge and focused expertise. The acquisition was completed in July 2015 and MIG was delisted and ceased trading on the New York Stock Exchange.
During the Reporting Period, MIG recorded gross premium income of USD726.5 million, net profit of USD34.3 million, net combined ratio of 100.3%, solvency adequacy ratio of 200.3%, investable assets of USD1,570.6 million, and total return on investment reached 2.9%.

MANAGEMENT DISCUSSION & ANALYSIS
FOSUN INTERNATIONAL LIMITED Annual Report 201528
INVESTMENT
The Group adheres to the concept of value investment and follows the model of “Combining China’s Growth Momentum with Global Resources” to invest in a series of enterprises benefiting from the growth momentum of China in both domestic and global markets. The Group’s investment business is divided into three segments, which are strategic investment, private equity investment, venture capital investment and capital contribution to the Group’s asset management business as a limited partner (PE/VC/LP investments), and secondary market investments.
During the Reporting Period, the revenue and profit attributable to owners of the parent of the investment segment were as follows:
Unit: RMB million
2015 2014
Changeover the sameperiod in 2014
Revenue 442.5 700.5 - 36.8%Profit attributable to owners of the parent 2,930.5 2,195.3 33.5%
During the Reporting Period, the decrease in revenue of the investment segment was mainly due to the declining rental income from 28 Liberty, as a result of its property renovation project. The increase in profit attributable to owners of the parent of the investment segment was mainly attributable to the gain on disposal of the Group’s subsidiary, partial investment in an associate available-for-sale investments, and so on, offsetting by the loss on fair value adjustment of investments at fair value through profit or loss.

MANAGEMENT DISCUSSION & ANALYSIS
FOSUN INTERNATIONAL LIMITED Annual Report 2015 29
Strategic InvestmentThe Group’s strategic investment includes Focus Media, Lloyds Chambers, 28 Liberty and Zhaojin Mining, etc..
Focus MediaFocus Media is an important investment of the Group in the culture and media industry. At the end of December 2015, the backdoor listing of Focus Media in A-share market through Hedy Holding Co., Ltd. (stock code: 002027.SZ) was successfully completed, which was among one of the first Chinese concept shares to be relisted in the A-share market. The Group holds 8.09% equity interest in the listed company, and is entitled to a board seat and remains as one of the significant shareholders of Focus Media. In this mobile Internet era, Focus Media capitalizes on its in-depth understanding of advertising and its insights into the consumer landscape and uses its mobile Internet technology that integrates offline with online information to target the 200 million most commercially valuable customers as its driver of brand sales. Focus Media strives to build an O2O (Online to Offline) portal with an offline big data, aiming to be an important player of mobile Internet portal.
Lloyds ChambersIn October 2013, the Group purchased Lloyds Chambers with its partner at a purchase price of GBP64.5 million. The project is located at 1 Portsoken Street E1 in the financial district of London. Lloyds Chambers has a sound financing, taxation, property management and corporate governance structure. During the Reporting Period, its rental income was GBP7.1 million. Asset management of the project is being implemented in accordance with the business plan and progress has been achieved in value enhancement.
28 LibertyIn December 2013, the Group completed the acquisition of 28 Liberty, freehold for
investment purposes at a purchase price of USD725 million. 28 Liberty, located in the Financial District of Lower Manhattan of New York, is a 60-storey Grade A office building landmark with a leasable area of 2,215,000 sq.ft. During the Reporting Period, the rental revenue of the project amounted to USD47.5 million.
Zhaojin MiningZhaojin Mining is a large conglomerate with exploration, mining, processing and smelting operations and focuses on the gold production business, with mine-produced gold as its main product. Zhaojin Mining is committed to maintaining strategic cooperation with local governments, large-scale geological exploration institutes and large enterprises. Through equity mergers and acquisitions as well as implementation of full-scale development strategies, it aims to seize high-quality resources and play a leading role in driving the industrial bases in Shandong, Xinjiang and Gansu provinces. It also increased its efforts in resources integration in the periphery of industrial clusters, which has further enhanced the company’s resource strength. During 2015, gold production of Zhaojin Mining was approximately 20 tonnes (2014: 20 tonnes), gold ore resources of Zhaojin MiningNote was 1,228 tonnes (2014: 811 tonnes), and its sales revenue amounted to RMB5,886.85 million, representing an increase of 5.01% over the same period in 2014.
Note: Measured according to the Code of the Joint Ore Reserves Committee in Australia (JORC).

MANAGEMENT DISCUSSION & ANALYSIS
FOSUN INTERNATIONAL LIMITED Annual Report 201530
PE/VC/LP InvestmentsPE InvestmentsThe Group’s investment in PE involves international fashion, mass consumption, advanced manufacturing and other industries. The amount of new investment in 2015 was around RMB68.9 million. The amount of exit investment in 2015 was around RMB623.2 million. As of 31 December 2015, the Group has invested in 24 PE projects with total remaining investment amount of approximately RMB1,586.1 million.
VC InvestmentsFosun Kinzon Capital is the Group’s venture capital platform investing in early and growth stage Internet-related enterprises. Fosun Kinzon Capital team focuses on high-potential early stage ventures utilizing mobile-Internet (including Internet finance, digital health, Internet-related real estate & automotive, O2O (Online to Offline), Internet education, on-line travel and services to small and medium enterprises) and is committed to promoting the rapid development of investee companies by leveraging the Group’s industrial depth and resources. As of 31 December 2015, Fosun Kinzon Capital team has invested in 35 projects with total investment amount of approximately HKD1,452.4 million.
LP InvestmentsThe Group made investment through capital contribution as a limited partner while proactively developing its asset management business. As of 31 December 2015, the Group committed to contribute a total of RMB7,684.4 million (RMB691.2 million was committed to contribute by Forte), of which RMB6,020.3 million was actually contributed (RMB691.2 million was contributed by Forte to the real estate series funds of Forte).
Secondary Market InvestmentsThe Group’s investments in the secondary market comprise Folli Follie. For other investments in the secondary market, please refer to “Significant Secondary Market Holdings Held by the Group”.
Folli FollieFolli Follie, a globally renowned fashion retail group, was an overseas strategic investment of the Group in 2011. As of 31 December 2015, the Group held 9.96% equity interest and Pramerica-Fosun China Opportunity Fund, a fund managed by the Group, held 3.89% equity interest in Folli Follie, amounting to 13.85% equity interest in total. The Group increased its equity interest in Folli Follie to 10% in February 2016 that resulted in an increase of total equity interest to 13.89%.
The sales revenue of Folli Follie for the first three quarters of its financial year in 2015 amounted to Euro875.5 million, representing an increase of 20.9% over the same period in 2014. Its EBITDA was Euro175.1 million, representing an increase of 8.5% over the same period in 2014. The operating profit amounted to Euro154.6 million, representing an increase of 5.4% over the same period in 2014. The sales of its self-owned core brand business increased by 22.6%, with EBITDA increased by 10.3% and operating profit increased by 7.7% as compared with the same period in 2014. The other two business segments of Folli Follie – wholesale/retail and department stores achieved growth of 20.6% and 13.3% respectively in sales revenue over the same period in 2014.
Since its investment in 2011, the Group has leveraged on its solid industrial foundation and extensive online and offline channel resources in China to assist Folli Follie’s development in the Greater China Region, in respect of its sales network expansion and brand building. Folli Follie achieved a continuous steady growth in the sales performance in China and a significant acceleration of the expansion of sales network.

MANAGEMENT DISCUSSION & ANALYSIS
FOSUN INTERNATIONAL LIMITED Annual Report 2015 31
Significant Secondary Market Holdings Held by the Group1
No. Stock Code Stock Name
Number ofSecurities (As at
31 December 2015)
Percentage oftotal number
of shares CurrencyAccountingTreatment2
1 TCG.LN Thomas Cook 88,494,290 5.76% GBP B2 1988.HK Minsheng Bank (H)3 773,019,800 2.12% HKD A
3 1336.HK New China Life Insurance (H)44,865,900 1.44% HKD A44,661,800 1.43% B
4SINA SINA 4,554,032 6.55% USD
B— SINA Convertible Bonds 222,312 N/A USD
5 BHFKB.BB BHF4 25,768,724 19.49% Euro B6 YOKU Youku 5,270,314 2.69% USD B7 FFGRP.GA Folli Follie 6,669,828 9.96% Euro A
8YY YY 1,839,516 3.36% USD
B— YY Convertible Bonds 609,754 N/A USD
9SFUN SouFun 12,815,718 2.97% USD B— SouFun Convertible Bonds 3,924,766 N/A USD A
101398.HK ICBC (H) 53,939,000 0.02% HKD
B601398.SS ICBC (A) 54,000,027 0.02% RMB
Notes:
1. The calculation range covers the securities investments on the secondary markets of the Group, excluding the securities invested by the funds of the Group.
2. A: Equity investments at fair value through profit and loss; B: Available-for-sale investments.
3. Including derivative interests of 390 million shares.
4. As of March 2016, the Group no longer held any share in BHF KB.

MANAGEMENT DISCUSSION & ANALYSIS
FOSUN INTERNATIONAL LIMITED Annual Report 201532
WEALTH MANAGEMENT
During the Reporting Period, the revenue and profit attributable to owners of the parent of the wealth management segment were as follows:
Unit: RMB million
2015 2014
Changeover the sameperiod in 2014
Revenue 505.3 448.1 12.8%Profit attributable to owners of the parent 589.9 306.1 92.7%
During the Reporting Period, the increase in both revenue and profit attributable to owners of the parent of the wealth management segment was mainly attributable to the business expansion of asset management.
Asset ManagementDuring the Reporting Period, the Group continuously expanded its asset management business by upholding the investment philosophy of value investment and “Combining China’s Growth Momentum with Global Resources” and consistently generated long term and stable returns for limited partners.
The funds currently managed by the Group mainly include various RMB funds and USD funds, covering various types of assets portfolio, such as growth funds and property development funds, i.e. Zhejiang Growth Fund, Weishi Fund, Fosun Capital, Fosun Chuanghong, Star Capital, Shanghai Sunvision Xicheng Equity Investment Center (Limited Partnership), Shanghai Sunvision Binhe Equity Investment Center (Limited Partnership), Ji’nan Financial Development Investment Fund Partnership (Limited Partnership), Pramerica-Fosun China Opportunity Fund, Carlye-Fosun, real estate series funds of Forte and others.
Meanwhile, the Group also actively expanded the size of its managed assets through acquisitions. The Group had acquired IDERA, a Japanese real estate capital management company, in May 2014. The Group had acquired 60% equity interest in Resolution Property, a European real estate capital management company headquartered in London, in June 2015. In August 2015, the Group had established Fosun Eurasia Capital, a Russian asset management company.
The asset management business of the Group mainly targets domestic and international high-end large institutional clients and high net worth individual clients and will continue to actively seek institutional investors, large enterprises and family capital to become limited partners of the Group for long term cooperation.
As at the end of the Reporting Period, the scale of the asset management business of the Group reached RMB63,387.0 million, of which RMB11,136.9 million was managed by IDERA, RMB7,958.4 million was managed by Resolution Property, RMB5.1 million was managed by Fosun Eurasia Capital. The Group contributed RMB791.9 million through its commitment as a general partner and RMB7,684.4 million through its commitment as a limited partner to the asset management business. The management fee derived from the asset management business amounted to RMB471.1 million. In addition, during the Reporting Period, the asset management business of the Group invested in 33 new projects, and increased investment in one existing project, with an accumulated investment of RMB7,907.0 million.

MANAGEMENT DISCUSSION & ANALYSIS
FOSUN INTERNATIONAL LIMITED Annual Report 2015 33
IDERA
In May 2014, the Group completed its acquisition of 98% equity interest in IDERA, a Japanese real estate capital management company, at a consideration of JPY6,811.0 million. This investment is an important step of Fosun’s pursuit of “insurance + investment” strategy to build its global investment capability. IDERA is a leading Japanese independent real estate capital management and fund platform and as at the end of the Reporting Period, its assets under management was over JPY206,717.4 million (approximately RMB11,136.9 million). IDERA will become the real estate investment platform of Fosun in the Japanese market and will continue to provide outstanding real estate fund and asset management services for investors in Europe and America, Asia, the Middle East and Japan.
During the Reporting Period, IDERA recorded an unaudited operating revenue of JPY2,846.5 million, net profit of JPY815.3 million and net asset book value of JPY9,326.4 million according to the Japanese accounting standards.
Resolution PropertyIn June 2015, the Group acquired 60% equity interest in Resolution Property, a European real estate capital management company headquartered in London, for a consideration of Euro15.6 million. This investment is also an important step of Fosun’s pursuit of “insurance + investment” strategy to build its global investment capability. Resolution Property is a leading fund manager focusing on real estate value-added and opportunistic investment in Europe and will become a priority platform of Fosun in the European market for real estate investment. As at the end of the Reporting Period, total funds under its management were approximately RMB7,958.4 million.
Fosun Eurasia CapitalEstablished in Moscow in August 2015, Fosun Eurasia Capital is 75% held by the Group. Fosun Eurasia Capital serves as a major comprehensive financial platform for the Group, providing financial, asset management and investment advisory services throughout Russia and its neighbouring countries. Fosun Eurasia Capital’s scope of investment deploys across all asset classes, including fixed income, direct investments, real estate, bonds, listed and private equity, and identifies and evaluates investment opportunities in various industries including energy, natural resources, consumer and manufacturing industries. Fosun Eurasia Capital also provides foreign investment advisory services and seeks for underlying high-quality investment projects for local Russian and international investors. As at the end of the Reporting Period, total assets under its management were approximately RMB5.1 million.
BANKING AND OTHER FINANCIAL BUSINESS
H&AIn July 2015, the Group made an offer to acquire at least 80% of the share capital and voting rights plus one H&A share and voting right at an offer price of Euro682.5 per no-par value ordinary share of H&A and the maximum amount of consideration payable is expected to be not more than Euro210 million. The acquisition is currently in the process of obtaining regulatory approvals. The acquisition will enhance the Group’s capability of providing financial services in Europe, in the areas of private banking asset management, financial markets and fund custodian services to individual, corporate and institutional clients, particularly the small and medium sized enterprises.

MANAGEMENT DISCUSSION & ANALYSIS
FOSUN INTERNATIONAL LIMITED Annual Report 201534
Fosun Finance CompanyFosun Finance Company officially commenced operations in September 2011. During the Reporting Period, Fosun Finance Company operated in a steady and sound manner and achieved operating revenue of RMB140.7 million, net assets of RMB1,772.3 million and net profit after tax of RMB88.1 million. In September 2015, Fosun Finance Company increased its registered capital to RMB1,500 million. As of 31 December 2015, Fosun Finance Company had 131 members in total, with deposits amounting to RMB3,481.4 million and loans amounting to RMB2,690.0 million. Fosun Finance Company has obtained the loan and entrusted loan business qualification and the interbank lending market business qualification.
Fosun Hani SecuritiesFosun Hani Securities is an important investment of the Group to acquire a financial platform in Hong Kong in July 2014. The Company indirectly holds 100% equity interest in Fosun Hani Securities. The acquisition of Fosun Hani Securities is of significant importance to the opening up of domestic and overseas funding channels and the enhancement of overseas assets management capability.
Established in 1987, Fosun Hani Securities is a registered securities broker with license in Hong Kong to deal in securities on behalf of retail customers and corporate customers. During the Reporting Period, with the issued capital of HKD385.0 million, Fosun Hani Securities owns four types of securities business related licenses: dealing in securities (Type 1), advising on securities (Type 4), advising on corporate finance (Type 6) and asset management (Type 9). During the Reporting Period, Fosun Hani Securities managed the assets of customers amounting to HKD2,903.9 million and its total assets and net profit reached HKD408.7 million and HKD8.1 million, respectively. The Group has started to participate in the Shanghai-Hong Kong Stock Connect through Fosun Hani Securities and has provided windows for the capital operation in the capital market of Hong Kong for investees of the Group.
Hangzhou Financial Investment LeasingHangzhou Financial Investment Leasing is a financing leasing platform jointly established by the Group and Hangzhou Financial Investment Group in June 2013 with an initial registered capital of USD99 million. It is mainly engaged in the business of providing finance optimization, financing and vendor marketing services to quality growth-based small and medium sized enterprises and public utility units. With strong financial and industrial background of its shareholders, the company pays close attention to the needs of its customers, implements its differentiation strategy and makes full use of the unique functions of financing leasing so as to serve real economy, small and medium sized enterprises and urban construction. As at the end of the Reporting Period, the amount of assets leased by Hangzhou Financial Investment Leasing was approximately RMB917 million.
INTERNET FINANCE
MybankThe Group, as a founder, injected registered capital of RMB1,000 million into Mybank to acquire 25% of the total share capital of Mybank.
Commencing operation in June 2015, Mybank is a joint-stock commercial bank which provides financial services for small and micro businesses and individual consumers on the Internet, and operated in the mode of a platform with light assets held for trading. The Group considers that Mybank has an investment value as it operates its business on the basis of real economy and real trading backgrounds, and utilizes unique risk control technologies to realize whole process network operation, providing online financing and other financial services for target clients with characteristics of large scale, great volume, intensive operation and information support.
As of 31 December 2015, loans granted by Mybank were summed up to RMB9,130 million with cumulative 570 thousand borrowers. Average loan balance per borrower was nearly RMB16 thousand. Among the loans, one loan product, Wangnongdai (an Internet micro-loan product for agricultural borrowers) has been granted to 226 customers, with an average single loan balance of approximately RMB10 million. Overall Non Performing Loan ratio of Mybank was 0.18%. Meanwhile, Yulibao, a fund distributed by Mybank, had a balance of approximately RMB339 million.

MANAGEMENT DISCUSSION & ANALYSIS
FOSUN INTERNATIONAL LIMITED Annual Report 2015 35
CainiaoIn May 2013, the Group invested RMB500 million to subscribe for shares in Cainiao, representing 10% of Cainiao’s equity interest. Cainiao’s vision is to develop a China Smart Logistics Network that can help to deliver online shopping in all cities across China within 24 hours to enhance merchants’ logistics service capabilities and service quality in order to reduce total logistics costs and eliminate the logistics bottleneck.
As of 31 December 2015, Cainiao had commenced construction for nine projects with a total area of approximately 1,200,000 sq.m. and had completed seven projects in Wuqing of Tianjin, Konggang of Tianjin, Jinyi of Zhejiang, Haining of Zhejiang, Shangyu of Zhejiang, Zengcheng of Guangzhou and Jiangxia of Wuhan. In addition, 24 projects were signed in Guangdong, Chongqing, Hubei, Shaanxi, Sichuan, Zhejiang, Tianjin and Shenyang, etc..
Chuangfu Finance LeasingChuangfu Finance Leasing is mainly engaged in automobile finance leasing for corporate and individual consumers who need mid- to high-profile automobile related financial services. As a market leader in its field, the company maintains strategic collaborations with a number of high-end automobile manufacturers and dealers such as BMW Automobile Finance, Audi and Mercedes Benz. As at the end of the Reporting Period, the Group had a shareholding of 59.4% in Chuangfu Finance Leasing. As of 31 December 2015, the scale of leasing assets of Chuangfu Finance Leasing amounted to RMB617 million, representing an increase of 29.4% compared to the same period of 2014.
Yuntong Small LoanThe Group began its preparations for investing in Guangzhou Yun Tong Micro Credit Co., Ltd. (“Yuntong Small Loan”) during the Reporting Period. Yuntong Small Loan was approved to commence operations in December 2015. During the Reporting Period, only dozens of large Internet enterprises were granted this type of licenses in China and license resources were relatively scarce. Since the national online small loan license has outreached the regional restrictions, we can conduct business across the country through the Internet, so that we can have more opportunities to deal with customers which are much larger than traditional small loan companies, and it is easier for us to pick out loan customers of relatively high quality, which is conducive to large-scale development.
Yuntong Small Loan has a registered capital of RMB200 million. As at the end of the Reporting Period, the Group held a total equity interest of 68%. Yuntong Small Loan will establish an open online loan system based on big data geared to the needs of the whole society. In the initial stage, the company will mainly conduct the scenario-based loans business. In the advance stage, it will conduct the business of individual consumer loans by relying on the credit weakening scene with Internet big data as the major risk management method and start with the Group’s dominant industries and proceed with deep excavation and concentrate its efforts on one to three industries (including loans relating to real estate/cars/commodities/individual consumption).
FosunlingThe Group invested in Fosunling in 2015, as a critical part of the overall strategy of building up its own internet-based financial platform. The Group owns 100% equity interest in Fosunling, with a registered capital of RMB100 million.
Fosunling concentrates on building an integrated internet-based investment and financing platform characterized by industrial depth and multi-dimensional ecosystem, providing an entry point of customers for Fosun’s own Internet-based financial platform and ecosystem. The online platform was launched in mid-September of 2015. As of 31 December 2015, it had completed the offline securitization of around RMB800 million value of assets, and total value of online transactions of financial products was approximately RMB48.8 million. More than 15,000 individuals became registered members, including around 5,200 individuals who linked their bank accounts to the platform. Fosunling will continue to build an innovative and low-cost financing channel through the Internet, and provide all-round services including financial, entertainment, healthcare and medical services etc. for its clients.

Health
Happiness
MANAGEMENT DISCUSSION & ANALYSIS
FOSUN INTERNATIONAL LIMITED Annual Report 201536
INDUSTRIAL OPERATIONSThe industrial operations of the Group include five key segments: health, happiness, steel, property development and sales, and resources. The health segment mainly includes Fosun Pharma, Starcastle Senior Living, Luz Saúde, Star Healthcare, Sanyuan Foods, Zhongshan Public Utilities and Silver Cross; the happiness segment mainly includes Yuyuan, Club Med, Atlantis, Studio 8, BONA, Cirque du Soleil and Thomas Cook; the steel segment mainly includes Nanjing Nangang and Tianjin Jianlong; the property development and sales segment mainly includes Forte, The Bund Finance Center, Dalian Donggang and Resource Property; the resources segment mainly includes Hainan Mining and ROC.

Steel
Property Development
and Sales
Resources
MANAGEMENT DISCUSSION & ANALYSIS
FOSUN INTERNATIONAL LIMITED Annual Report 2015 37

MANAGEMENT DISCUSSION & ANALYSIS
FOSUN INTERNATIONAL LIMITED Annual Report 201538
HEALTH
During the Reporting Period, the revenue and profit attributable to owners of the parent of the health segment were as follows:
Unit: RMB million
2015 2014
Changeover the sameperiod in 2014
Revenue 15,614.9 11,938.2 30.8%Profit attributable to owners of the parent 1,754.2 1,096.0 60.1%
During the Reporting Period, the increase in both revenue and profit attributable to owners of the parent of the health segment was mainly due to the continuous and steady business growth from manufacturing, distribution service of medical devices and healthcare service segments of Fosun Pharma.
Fosun PharmaIn 2015, amidst the severe situation of global economic downturn and deceleration of the domestic economic growth, continuous reform of the medical system in the PRC and slowdown of pharmaceutical manufacturing industry growth have brought policy opportunities to the development of medical services. During the Reporting Period, Fosun Pharma adhered to its business philosophy of “Innovation for Good Health”, focused on its core pharmaceutical and healthcare businesses, continued to develop product innovation and improve management, actively promoted the strategies of organic growth, external expansion and integrated development, thereby maintaining the growth of its principal businesses.
During the Reporting Period, Fosun Pharma realized revenue of RMB12,502.2 million, representing an increase of 4.72% as compared to 2014. The increase in revenue of Fosun Pharma was mainly due to the growth in revenue from the business segments of manufacturing, healthcare services and distribution of medical devices. In 2015, Fosun Pharma recorded profit before tax of RMB3,371.8 million and profit attributable to owners of the parent of RMB2,460.1 million, representing an increase of 24.05% and 16.43% respectively, as compared with that in the retrospective adjusted consolidated financial statements of 2014.

MANAGEMENT DISCUSSION & ANALYSIS
FOSUN INTERNATIONAL LIMITED Annual Report 2015 39
During the Reporting Period, the pharmaceutical research and development (R&D) and manufacturing business of Fosun Pharma maintained steady growth. The development of its professional management team was further strengthened. In 2015, the sales of Fosun Pharma’s key products in therapeutic areas such as cardiovascular system, metabolism and alimentary system, anti-infection and anti-tumor achieved rapid growth. Among the new products, the sales of alprostadil dried emulsion (You Di Er), a product in the cardiovascular system therapeutic area, and febuxostat tablets (You Li Tong), a product in the metabolism therapeutic area, had experienced prominent sales growth. As at the end of the Reporting Period, Fosun Pharma continued to increase its investments in R&D with 161 R&D projects in the pipeline, including new drugs, generic drugs, bio-similar drugs and vaccines. During the Reporting period, the R&D expenses in the pharmaceutical manufacturing and R&D segment were RMB537.6 million, representing an increase of 18.94% as compared to 2014, accounting for 6.02% of the revenue of the pharmaceutical R&D and manufacturing segment.
In 2015, Fosun Pharma continued to reinforce its substantially completed strategic deployment of healthcare services segment with high-end healthcare institutions in developed coastal cities and specialty and general hospitals in second-tier and third-tier cities in the PRC, accelerated the development of Internet healthcare strategy, actively explored industrial allocation for the healthcare industry, and continued to improve the business scale and profitability. During the Reporting Period, a new complex of the Chancheng Hospital (禪城醫院), “Excelsior Tower” (精進樓), commenced operations. The commencement of the construction of the rehabilitation and medical examination hospital initiated by Zhongwu Hospital (鐘吾醫院) has further diversified the healthcare service platform of Fosun Pharma. Fosun Pharma participated in the establishment of Wenzhou Geriatric Hospital Co., Ltd. (溫州老年病醫院有限公司) and Qingdao Shandong University Qilu Hospital Management Co., Ltd. (青島山大齊魯醫院投資管理有限公司) to search for new models for social capital to enter the healthcare industry. The construction of the “Taizhou Zanyang Medical Care Project” has been launched, and Shanghai Xingshuangjian Medical Investment was established, to consolidate medical and senior care resources for new healthcare models. Fosun Pharma commenced deployment in the hemodialysis area for further integration in the industrial chain and formed strategic cooperation with Guahao.com (掛號網) and led the investment in the A-round funding of Mingyizhudao to realize the connection of online and offline service and formed a closed O2O loop, striving for innovation on new formats and models of healthcare services. In addition, during the Reporting Period, Fosun Pharma actively supported and facilitated the development and deployment of hospital and clinic network under “United Family Hospital”, a leading premium healthcare services brand under Chindex International, Inc..
While devoting itself to the domestic healthcare services industry, Fosun Pharma also paid close attention to exploring new operating models in healthcare services segment of the overseas mainstream market. In 2015, Fosun Pharma invested in approximately 30% equity interest of Sovereign Medical Services, Inc., a day surgery center in the United States, for further studies for exemplars and implementation of new healthcare services model in the PRC market in the future.
In 2015, Fosun Pharma kept pushing forward its business development in medical diagnosis and medical devices areas. During the Reporting Period, Fosun Pharma actively fostered the business development of Alma Lasers Ltd. and enhanced the expansion of the distribution business of Chindex Medical Limited. The volume of surgeries performed by Da Vinci surgical robotic system experienced a significant increase in 2015. Alma Lasers Ltd. recorded revenue of RMB688.5 million for 2015, representing an increase of 10.79% as compared to 2014. During the Reporting Period, the medical diagnosis and medical devices manufacturing segment realized revenue of RMB1,716 million, representing an increase of 14.71% as compared to 2014. The revenue of distribution business amounted to RMB528 million, representing an increase of 21.38% as compared to 2014; the increase in revenue of distribution business was mainly due to an increase in sales of consumables brought by the accelerated sales of Da Vinci surgical robotic system and the increased volume of surgeries.
At the beginning of 2015, Fosun Pharma and Sinopharm have completed the integration of drug distribution and retail business as well as the optimization of resource allocation among Fosun Pharmaceutical, For Me Pharmacy and Jin Xiang Pharmacy. During the Reporting Period, Sinopharm, an associate of Fosun Pharma, put continuous efforts in accelerating industry consolidation, expanding distribution network of pharmaceutical products and maintaining rapid growth in business.

MANAGEMENT DISCUSSION & ANALYSIS
FOSUN INTERNATIONAL LIMITED Annual Report 201540
Starcastle Senior LivingStarcastle Senior Living is a joint venture jointly established by the Group and Fortress Investment Group LLC, each holding 50% of its equity interest, for the purpose of developing the property market for senior citizens in China. The company’s first high-end healthcare project customized for Chinese senior citizens has commenced operations in May 2013. The first phase has a total number of 218 suite units with an occupancy rate of 92%.
Luz SaúdeLuz Saúde is one of the largest groups providing healthcare services in the Portuguese market, providing its services through 20 units (eight private hospitals, one national health service hospital under a public private partnership regime, two long term specialized care units, seven private clinics operating day-care regimes and two residences for the elderly) and is present in the north, middle and middle-south of Portugal.
As at the end of the Reporting Period, Fidelidade held 98.4% equity interest in Luz Saúde. In 2015, Luz Saúde provided 1,179 beds and recorded good operational and financial results due to the growth in the Portuguese private healthcare market and the achievement of some synergies with the insurance business of Fidelidade.
Consolidated operational revenues of Luz Saúde reached Euro423.8 million, an increase of 5.5% year-on-year, driven both by 6.3% growth in the private health segment and 3.4% growth in the public health segment. EBITDA reached Euro60.7 million, with an EBITDA margin of 14.3%, a 0.1 percentage point increase compared with 2014. Net income attributable to shareholders also grew and totalled Euro21.7 million, representing a 20% growth versus 2014.
Star HealthcareShanghai Star Healthcare Co., Ltd. (“Star Healthcare”) is a wholly-owned investment company of the Group, combining the Group’s internal and external outstanding medical resources, with an aim to provide one-stop and whole-process health management service and third-party insurance service for mid- to high-profile customers.
As at the end of the Reporting Period, Star Healthcare has developed six major series of products, basically completed the construction of the business system and the deployment of professional health evaluation system and achieved health evaluation and final-period of intervention management for customer members. Star Healthcare has formed a professional service team comprised of various talents such as insurance-claiming specialists, medical experts, health managers and nutritionists, through which multimedia health management service can be offered to customers through the company’s website, WeChat platform and hotlines. It has also initiated the development of its APP at the end of 2015 in order to realize closed-loop management for services related to users’ health.
Facing the service demand in the insurance market, Star Healthcare has built up the medical network resources in over 200 countries across the world. In mainland China, 200 cooperative medical institutions in 16 provinces and cities (including Beijing, Shanghai, Guangdong, Shenzhen, etc.) have been covered by the direct billing network resources, which can provide insurance companies with professional medical direct billing management and settlement services.

MANAGEMENT DISCUSSION & ANALYSIS
FOSUN INTERNATIONAL LIMITED Annual Report 2015 41
Sanyuan FoodsThe private placing of Sanyuan Foods was completed in February 2015. As at the end of the Reporting Period, the Group and Fosun Chuanghong, a fund managed by the Group, held 16.67% and 3.78% equity interest in Sanyuan Foods respectively. Sanyuan Foods is a renowned brand in the dairy industry of China, famous for the quality and safety of its products, and enjoys significant market advantages in Beijing and the peripheral markets. Fosun is optimistic about the future growth of dairy consumer goods in China.
After acquiring shares of Sanyuan Foods, Fosun utilized global resources to assist in formulating corporate strategies, introducing merger and acquisition targets and transforming operation mechanisms for realizing integrated development in Sanyuan Foods and enhancing its leading position in the dairy industry of China.
Facing falling international milk prices and intensive competition in the domestic dairy product market, Sanyuan Foods actively launched new products, adjusted product structure and strengthened brand publicity. During the Reporting Period, it recorded operating revenue of RMB4,549.9 million, and net profit attributable to owners of the parent amounted to RMB78.7 million.
Zhongshan Public UtilitiesAs at the end of the Reporting Period, the Group held 12.35% equity interest in Zhongshan Public Utilities. Zhongshan Public Utilities, being an industry-leading professional integrated environmental service operator, acquired 100% equity interest in Zhongshan Tianyi Energy Resources Co., Ltd. during the Reporting Period and it formally entered the solid waste industry. During the Reporting Period, net profit of Zhongshan Public Utilities attributable to shareholders of the listed company amounted to RMB1,484.4 million, an increase of 98.46% over the same period of 2014.
Silver CrossSilver Cross was an overseas investment made by the Group and the transaction was completed in July 2015. The Company indirectly held 82% equity interest in Silver Cross through its wholly-owned subsidiary as at the end of the Reporting Period.
Silver Cross, which was established in 1877 by William Wilson, has established itself as a leading UK nursery brand. The company incorporates the latest product design with engineering mechanism to offer its customers a range of multifunctional and lightweight strollers alongside its hand-built legacy prams and complemented by its nursery furniture range. Silver Cross has a multichannel distribution network covering UK, Europe, the Middle East, Asia and Asia Pacific regions. In UK, it has a significant retail presence with a strong national retail footprint and an extensive network of 170 independent retailers. Silver Cross has three major flagship stores in Shanghai, Hong Kong and Moscow and presence in a number of high-end maternal and infant chain stores. The key growth market like Southeast Asia region has also proven to be very successful for Silver Cross. Silver Cross has won numerous high profile awards such as Illustrious Junior Design Award and Which! Best Buy Award.
From July 2015 to the end of Reporting Period, it recorded operating revenue amounting to GBP20.6 million, profit before tax was GBP2.7 million.

MANAGEMENT DISCUSSION & ANALYSIS
FOSUN INTERNATIONAL LIMITED Annual Report 201542
HAPPINESS
During the Reporting Period, the revenue and profit attributable to owners of the parent of the happiness segment were as follows:
Unit: RMB million
2015 2014
Changeover the sameperiod in 2014
Revenue 7,441.6 — N/AProfit attributable to owners of the parent 175.1 473.5 - 63.0%
During the Reporting Period, revenue of the happiness segment was, in principle, contributed by the operating income from Club Med. By completing the Group’s public offer, Club Med was finally delisted from Euronext in March 2015. Excluding the gain on fair value adjustment of the Group’s investments in Club Med in 2014, profit attributable to owners of the parent of the happiness segment decreased by 33.5% as compared with the same period of 2014, mainly due to the loss suffered for the Reporting Period by Club Med, as a result of a troubled economic and geopolitical environment and additional delisting and restructuring costs.
YuyuanYuyuan is mainly engaged in commercial retail, wholesale and retail of gold and jewellery, and holds certain equity interest in Zhaojin Mining. During the Reporting Period, Yuyuan recorded operating revenue of RMB17,551.48 million, a decrease of 8.36% year-on-year. Profit before tax was RMB966.48 million, a decrease of 17.23% year-on-year. The net profit attributable to shareholders of the listed company amounted to RMB807.20 million, a decrease of 19.52% year-on-year. Yuyuan recorded lower operating revenue when compared with the same period of 2014 mainly due to the decreased revenue from the gold and jewellery segment as compared to the same period in 2014. Yuyuan recorded lower net profit for two main reasons: (1) affected by the declining trend of international gold prices throughout 2015, Yuyuan’s sales performance in the retail and wholesale business of gold and jewellery was below expectation; and (2) revenue from Yuyuan’s
investment in Zhaojin Mining and the project of Wuhan Zhongbei Real Estate Development Co., Ltd. decreased as compared to the same period in 2014, as a result the investment income realized for 2015 was lower as compared to the same period in 2014.
During the Reporting Period, Yuyuan continued to develop its principal businesses and expansion of sales of gold and jewellery with particular emphasis on establishing sales channels for high value consumer products. Yuyuan established Shanghai Yuyuan Gold and Jewellery Group Co., Limited (上海豫園黃金珠寶集團有限公司) by operating its two major brands “Laomiao Gold” and “Yayi Gold” under the same management to promote the integration of its principal businesses and transformation into a new operating model. During the Reporting Period, the company changed the brand of “Yayi Gold” to “Yayi Jewellery”. There were 1,816 chain stores in aggregate for both retailers as at the end of the Reporting Period. The Group will assist Yuyuan to develop the potential value of vast tourist traffic flows, explore O2O business models and seek opportunities actively to consolidate high-quality assets in the industry to create value for the shareholders.

MANAGEMENT DISCUSSION & ANALYSIS
FOSUN INTERNATIONAL LIMITED Annual Report 2015 43
Club MedClub Med was an important investment of the Group in the “Combining China’s Growth Momentum with Global Resources” investment model implemented in 2010. During the Reporting Period, by completing the public offer of Euro24.6 per share in December 2014, Club Med was delisted from Euronext in March 2015.
In a troubled economic and geopolitical environment that has affected its outbound markets and some of its destinations, Club Med has recorded a 4% year-on-year increase in revenue which amounted to Euro1,439.0 million in its financial year of 2015, confirming the pertinence of its strategy based on increasing its upscale offer and international reach.
During the Reporting Period, Club Med opened three new resorts, including a new flagship skiing resort Val Thorens Sensations in the Alps region of France, 52 exceptional villas on the island of Finolhu in the Maldives and the four Trident resort in Dong’Ao Island in China which comes to complete the Dong’Ao five Trident Luxury space opened in 2014. In addition, the fourth resort in China has commenced business in Sanya in January 2016.
In line with Club Med’s development plan, China has become the second largest market after France in 2015, with the number of Chinese tourists increased by 29% year-on-year to 123,000. The Greater China Region continues to accelerate its development under the support of its major brand Club Med and the new brand Joyview by Club Med.
AtlantisThe Atlantis project is located in Haitang Bay, Sanya, Hainan, China, and is a large-scale high-end theme resort hotel project with a water park and aquarium as its signature jointly developed by the Group and Kerzner Group. The scale of the project amounts to nearly RMB10 billion and it is designated as the key construction project of Hainan Province. The project commenced construction in 2013 and will be completed by the end of 2016. As of 31 December 2015, RMB3,046.7 million was invested; this project has obtained the “Construction Project Planning Permit (Provisional)”; the first phase of this project and the water park have obtained the “Construction Works Commencement Permit”. The second phase of this project has also obtained the “Construction Works Commencement Permit” in January 2016.
Nameof project Usage Land area Total GFA
Ownershipof interest Land cost
Developmentprogress
Expectedcompletion time
Construction andinstallation costs
(sq.m.) (sq.m.) (RMB million) (RMB million) Atlantis Accommodation, food and beverage,
cultural, sports and entertainment537,420.2 492,215.1 99.98% 2,159.1Note Under
development2016 887.6
Note: The municipal infrastructure facilities related fees and deed taxes were added into the land cost, compared to the same period in 2014.

MANAGEMENT DISCUSSION & ANALYSIS
FOSUN INTERNATIONAL LIMITED Annual Report 201544
Studio 8Studio 8 is an important investment made by the Group in the film industry, a significant step for the Group to enter the film and television entertainment industry. As at the end of the Reporting Period, the Group held 80% equity interest in the Class A investors of Studio 8. The Group exercises significant influence over the distribution arrangement of movies produced by Studio 8 in mainland China, Hong Kong, Macau and Taiwan, whereby the Company will build a global media entertainment investment, financing and operating platform with its base in China’s culture consumer market and focusing on the global film and television industry. During the Reporting Period, Studio 8 and Columbia TriStar Motion Picture Group, a company under Sony, co-invested and produced Billy Lynn’s Long Halftime Walk directed by Ang Lee, which will be released in November 2016 in North America. The second film Soluirean began filming in February 2016. Moreover, several excellent films are under development and it is expected to announce the greenlight projects soon.
BONAInvestment in BONA is an important strategic move of the Group in the film and television entertainment industry. As at the end of the Reporting Period, the Group held 6.2% equity interest in BONA. The Group believes that rapid and robust growth will continue in the film and entertainment market of China in the future. BONA has extensive experience in local film production, distribution and cinema operation in China. It has also achieved remarkable performance in recent years and takes the lead in the local film market. BONA distributed 15 movies through its cinemas in 2015 and box office of movies reached RMB3,128 million, ranking as one of the top three private companies, including movies such as The Man From Macau II, A Time for Consequences, Bride Wars and The Dead End. The Group will consistently integrate resources and complementary advantages to support the sustainable growth of BONA in the future. In June 2015, the Group, together with Mr. Yu Dong, the founder, chairman of the board and chief executive officer of BONA, and Sequoia Capital China Fund, issued a non-binding privatization offer to BONA.
Cirque du SoleilCirque du Soleil from Canada, was an overseas investment completed by the Group in July 2015. CMF and Zhejiang Growth Fund, two funds managed by the Group, together with Yuyuan jointly held 25% equity interest in Cirque du Soleil. Among which, CMF held approximately 14.14% equity interest, while Zhejiang Growth Fund and Yuyuan held approximately 8.03% and 2.83% equity interest, respectively.
Cirque du Soleil is primarily a creative content provider for a wide variety of unique projects. In addition to shows, the company, which has its international headquarters in Montréal, extends its creative talent to other spheres of activity. While maintaining stringent standards of artistic quality and originality, Cirque du Soleil brings to each innovative project the same energy and spirit that characterize each of its shows. Cirque du Soleil is a Quebec-based organisation providing high-quality artistic entertainment. Since its beginning in 1984, almost 160 million spectators in over 330 cities and 48 countries have been thrilled by the performances of Cirque du Soleil. In 2015, 19 shows were simultaneously presented around the world. Cirque du Soleil has been the recipient of many prestigious awards, including the Emmy, Drama Desk, Bambi, ACE, Gémeaux, Félix and Rose d’Or de Montreux.
The investment in Cirque du Soleil is a renewed plan for the Group’s happiness segment after privatization of Club Med by the Group. In future, the Group, together with TPG VII CDS Holdings and Cirque du Soleil will cooperate to drive the business development of Cirque du Soleil in the market of China.

MANAGEMENT DISCUSSION & ANALYSIS
FOSUN INTERNATIONAL LIMITED Annual Report 2015 45
Thomas CookDuring the Reporting Period, Fidelidade made strategic investment in the world renowned travel group Thomas Cook. As of 31 December 2015, Fidelidade held 5.76% equity interest in Thomas Cook. Thomas Cook recorded sales revenue of GBP7,834 million in the financial year of 2015, EBIT increased by 291% year-on-year to GBP211 million. The company turned from loss to profit for the first time in five years and recorded a net profit of GBP19 million.
As one of the first travel agents in the world and the pioneer of modern tourism industry, Thomas Cook began to bring European tourists into China as early as in 1909, and opened offices in Hong Kong, Shanghai and Beijing respectively. After strategically investing in Thomas Cook, the Group and Thomas Cook have established a joint venture travel agency in Shanghai, in which the Group held 51% equity interest. In addition, Thomas Cook and Club Med established a strategic partnership driven by the Group’s support. The strategic partnership will build on Club Med’s current relationship in France with Thomas Cook, aiming to achieve Euro100 million of product revenue through Thomas Cook’s sales channels by 2018, representing a 60% growth, to attract new customers in the UK, Germany, Finland, Sweden, Denmark, Norway, Russia, Belgium, the Netherlands, Poland, the Czech Republic and Hungary. At the same time, the Group and Thomas Cook are seeking further cooperation opportunities in areas including hotel management fund and airline business.
STEEL
During the Reporting Period, the revenue and profit attributable to owners of the parent of the steel segment were as follows:
Unit: RMB million
2015 2014
Changeover the sameperiod in 2014
Revenue 21,986.0 27,272.0 - 19.4%(Loss)/profit attributable to owners of the parent (929.7) 280.0 N/A
During the Reporting Period, the decrease in revenue of the steel segment was mainly due to the declining average selling prices of Nanjing Nangang’s products, as affected by market influence. The decrease in profit attributable to owners of the parent of the steel segment was due to the losses suffered by Nanjing Nangang and Tianjin Jianlong, as a result of the weakening in steel industry.

MANAGEMENT DISCUSSION & ANALYSIS
FOSUN INTERNATIONAL LIMITED Annual Report 201546
Nanjing NangangAs China’s economy entered a new normal phase, domestic economic growth slowed down and the overcapacity problem in the manufacturing industry became more obvious.
During the Reporting Period, Nanjing Nangang enhanced its competitiveness through a longitudinal process reengineering on the one hand, and on the other hand accelerated enterprise transformation and development. By incorporating national development plans and using steel manufacturing platform as foundation to develop non-steel industries such as energy efficiency and environmental protection industries, intelligent manufacturing and “Internet+” for building the company into an integrated service provider with global competitiveness and constituted by “advanced materials manufacturing platform of steel segment” and the “green, environmental friendly and intelligent industries” as organic overall structure. During the Reporting Period, the output of pig iron, crude steel and finished steel product of Nanjing Nangang amounted to 8,429.4 thousand tonnes, 8,590.4 thousand tonnes and 7,920.6 thousand tonnes respectively, a year-on-year increase of 3.12%, 6.83% and 8.09%, respectively. The sales of steel was 7,950 thousand tonnes during the same period in 2015 and achieved a balance in production and marketing.
Shanghai Fosun Industrial Technology Development Co., Ltd. (“Fosun Industrial Development”, an indirect wholly-owned subsidiary of the Company) executed a proxy in December 2015 to appoint Nanjing Iron & Steel Group as its proxy in respect of all the shares held by Fosun Industrial Development in Nanjing Nangang. Upon execution, the Company was deemed to be indirectly interested in 50% of the voting rights of Nanjing Nangang, and Nanjing Nangang ceased to be accounted for as a subsidiary of the Company in accordance with the prevailing accounting standards under the Hong Kong Financial Reporting Standards. The Company will account for its interest in Nanjing Nangang as an interest in a joint venture.
Meanwhile, Jin’an Mining, in which Nanjing Nangang owns a controlling stake, produced 1,020.9 thousand tonnes of iron concentrate, representing a year-on-year increase of 4.2%.
Jin’an Mining produces iron ore as its key product and the key production data during the Reporting Period were as follows:
Ironconcentrate output
(thousand tonnes) Reserves of iron oreNote
2015 1,020.9 67.1 million tonnes2014 980.1 73.8 million tonnesChange over the same period in 2014 4.2%
Note: According to the standards under the “Solid Minerals Geological Prospecting Standards” of the PRC, the figures in 2015 were estimated figures.
Tianjin JianlongTianjin Jianlong is the operating entity in the resources and steel industry of Beijing Jianlong Heavy Industry Group Co., Ltd.. During the Reporting Period, by adhering to a low cost strategy, paying attention to product structure adjustment, strengthening the research and development of new product and upgrading the product, participating in the merger and acquisition and reorganization of domestic steel enterprises, Tianjin Jianlong strived to gain economies of scale and produced synergistic effect while it was also under greater financial pressure.
During the Reporting Period, Tianjin Jianlong produced steel of 15.14 million tonnes, representing a year-on-year decrease of 0.76%; iron concentrate of 3.97 million tonnes, representing a year-on-year increase of 15.8%; phosphorous concentrate of 281.7 thousand tonnes; and sulfur concentrate of 130.1 thousand tonnes.

MANAGEMENT DISCUSSION & ANALYSIS
FOSUN INTERNATIONAL LIMITED Annual Report 2015 47
PROPERTY DEVELOPMENT AND SALES
During the Reporting Period, the revenue and profit attributable to owners of the parent of the property development and sales segment were as follows:
Unit: RMB million
2015 2014
Change over thesame period in
2014 Revenue 16,893.7 12,149.2 39.1%Profit attributable to owners of the parent 2,993.5 2,397.5 24.9%
During the Reporting Period, the increase in both revenue and profit attributable to owners of the parent of the property development and sales segment was mainly attributable to Forte’s business growth, as well as the fair value adjustment of investment properties.
ForteIn 2015, China’s real estate market continued the upward trend since the second half of 2014, and the successive introduction of a number of government policies to support the property market has played a significant role in promoting the China’s real estate market, thereby further warming the property market in 2015, with the market trade volume increasing significantly.
Against the backdrop of an overall improvement in the real estate market in 2015, Forte seized the opportunity to actively accelerate its pace in investment, financing, marketing and internal operation management, and built up the foundation for driving the future growth of the company. With the support of major shareholders, Forte actively accessed domestic and foreign insurance funds and low-cost fundings with high quality, and at the same time relied on major shareholders to integrate industrial resources, obtained land bank at reasonable cost with support from the government, and enhanced product value through industrial operation, achieved overall premium of projects and further improve overall profitability.
In 2015, Forte maintained a cautiously optimistic attitude, paid attention to market changes, strengthened marketing plans to capture market opportunities and adopted active and effective measures to accelerate the sales rate of products. Meanwhile, different property projects within the same regional market will adopt differentiated treatment methods. For property projects with scarce resources, a higher value was achieved through quality upgrading and improvement in marketing channels. Through financing facilities provided by all kinds of internal and external channels of the Group, including domestic and overseas insurance funds, Internet finance and equity funds, and by issuing corporate bonds with Forte’s own credit rating, leveraging on Forte’s own existing business to launch property cost asset backed schemes, more low-cost and stable sources of funds were used to further reduce the overall funding costs of the Group. In 2015, realization of Hive City was the core strategy of Forte. Forte is developing towards the same direction as the Group. By leveraging on more global resources and diverse product lines of the Group internally, Forte has been actively transforming into a real estate enterprise with industrial characteristics, and seeking a breakthrough in the light-asset model in the financial context to enhance corporate profitability, endeavoring to achieve the corporate vision of becoming a real estate developer with integrated global resources.

MANAGEMENT DISCUSSION & ANALYSIS
FOSUN INTERNATIONAL LIMITED Annual Report 201548
Project DevelopmentDuring the Reporting Period, Forte’s GFA under development was approximately 6,811,540.2 sq.m., and attributable GFA amounted to approximately 4,242,113.6 sq.m., representing an increase of approximately 4.4% compared with the same period in 2014 (2014: attributable GFA of approximately 4,062,132 sq.m.).
During the Reporting Period, the GFA of newly commenced projects was approximately 2,103,413.3 sq.m., and attributable GFA amounted to approximately 1,391,452.4 sq.m., representing an increase of approximately 44.2% compared with the same period in 2014 (2014: attributable GFA of approximately 964,788 sq.m.).
During the Reporting Period, the GFA of completed projects was approximately 1,979,224.5 sq.m., and attributable GFA amounted to approximately 1,438,964.9 sq.m., representing an increase of approximately 10.7% compared with the same period in 2014 (2014: attributable GFA was approximately 1,299,823 sq.m.).
Project ReservesDuring the Reporting Period, Forte obtained four projects as additional project reserves with planned GFA of approximately 786,769 sq.m. and attributable
GFA was approximately 646,109 sq.m., representing a decrease of approximately 27.3% compared with the same period in 2014 (2014: attributable GFA was approximately 889,212 sq.m.).
As at the end of the Reporting Period, Forte owned project reserves with planned GFA of approximately 13,140,114.9 sq.m. and attributable GFA was approximately 8,476,587.0 sq.m., representing a decrease of approximately 15.8% compared with the same period in 2014 (2014: attributable GFA was approximately 10,063,876 sq.m.).
Property SalesDuring the Reporting Period, Forte realized property contract sales area and contract sales revenue of approximately 1,496,836.4 sq.m. and RMB21,141.4 million respectively, and attributable contract sales area and contract sales revenue were approximately 1,017,910.8 sq.m. and RMB14,595.1 million respectively, representing an increase of approximately 0.7% and 8.3% respectively, compared with the same period in 2014 (2014: attributable contract sales area and contract sales revenue were approximately 1,011,106 sq.m. and RMB13,474.4 million, respectively).
Property BookedDuring the Reporting Period, the property area (booked area) and property amount (booked amount) by Forte were approximately 1,634,537.7 sq.m. and RMB26,753.0 million respectively, attributable booked area and booked amount were approximately 1,148,021.6 sq.m. and RMB18,911.4 million respectively, representing an increase of approximately 8.6% and an increase of approximately 66.3% respectively, compared with the same period in 2014 (2014: attributable booked area and booked amount were approximately 1,056,940 sq.m. and RMB11,375.1 million respectively).
As at 31 December 2015, the area and amount sold but not booked were approximately 1,149,743.7 sq.m. and RMB16,077.1 million respectively, and the attributable area and amount sold but not booked were approximately 765,367.0 sq.m. and RMB10,544.4 million respectively, representing a decrease of approximately 2.3% and a decrease of approximately 2.9% respectively when compared with the same period in 2014 (2014: attributable area and amount sold but not booked were approximately 783,604 sq.m. and RMB10,854.4 million respectively).

MANAGEMENT DISCUSSION & ANALYSIS
FOSUN INTERNATIONAL LIMITED Annual Report 2015 49
The Bund Finance CenterThe Bund Finance Center is a high-end complex project located in the core district of the Bund in Shanghai and is expected to pass acceptance examination upon its completion in 2016. The Bund Finance Center is an experiential financial complex in the Bund financial zone and this project will comprise four different business modes, including Grade A offices, shopping center, Fosun arts center and boutique hotel, in order to facilitate multiple functions of finance, commerce, tourism, culture, arts and so forth under one roof.
During the Reporting Period, the particulars of the project were as follows:
Name of project Floor Area (sq.m.) GFA 425,391Grade A offices S1 79,039
S2 76,642N1 10,898N2 12,848N4 5,263
Shopping center 93,861Boutique hotel 36,331Fosun arts center 3,959
Dalian DonggangThe project is located in the Donggang District, which will be the Central Business District of Dalian in the future and is a district with the highest potential for development and appreciation in Dalian. It is the home to a number of world-class landmark buildings and functional buildings such as Dalian International Conference Center (the venue for Summer Davos), Dalian Art Gallery, Coastal Landscape Area, Israeli Kardan Shopping Center, International Cruise Terminal, etc.. After appreciation in its value, Dalian Donggang is expected to become the international window and hub of Dalian. The project is comprised of five parcels of land with a total site area of approximately 141,600 sq.m. and a total capacity building area of approximately 586,859 sq.m..

MANAGEMENT DISCUSSION & ANALYSIS
FOSUN INTERNATIONAL LIMITED Annual Report 201550
The project was launched for sale at the end of 2012 and had achieved contracted sales of approximately RMB2,096.2 million at the end of 2015. It is estimated that the completion of the overall project will take place in December 2016.
Name of project Usage Land area GFAOwnershipof interest Land costs
Developmentprogress
Expectedcompletion
Constructionand installation
costs(sq.m.) (sq.m.) (RMB million) (RMB million)
The Bund Finance Center Office, commerce
and hotels45,472 425,391 100% 9,550 Under
development2016 3,591
Dalian Donggang Residential, officeand hotels
141,600 761,003 64% 3,835 Underdevelopment
2016 1,432.2
Resource PropertyResource Property is an integrated service provider in the property circulation sector of the Group, and was listed successfully on NEEQ in September 2015 (stock code: 833517). Based on the global development strategy of the Group, Resource Property is dedicated to building an O2O (Online to Offline) service platform for overseas living and housing purchase for the property sector of the Group. It will fully finance the overseas industrial resources of the Group and work together with the renowned global companies. Taking house purchase as a starting point, Resource Property is striving to provide Chinese customers with one-stop services covering the whole industry chain, including house purchase, immigration, education, health, finance and other aspects of living abroad. The services offered combine online convenient transaction and offline friendly experience, helping Chinese customers to realize their global living dreams.
RESOURCES
During the Reporting Period, the revenue and profit attributable to owners of the parent of the resources segment were as follows:
Unit: RMB million
2015 2014
Change over thesame period in
2014 Revenue 1,627.6 1,589.2 2.4%(Loss)/profit attributable to owners of the parent (463.5) 129.9 N/A
During the Reporting Period, the increase in revenue of the resources segment was mainly related to the completion of ROC’s delisting from the Australian Stock Exchange in January 2015 and the fact that ROC was wholly-owned by the Group. The decrease in profit attributable to owners of the parent of the resources segment was attributable to the decrease in Hainan Mining’s profit and the loss suffered by ROC, as a result of industry decline.

MANAGEMENT DISCUSSION & ANALYSIS
FOSUN INTERNATIONAL LIMITED Annual Report 2015 51
Hainan MiningThe Group engages in iron ore production and operation through a subsidiary, Hainan Mining. Hainan Mining owns a large open-pit, high-grade iron ore mine in China. Its core business includes mining and sales of iron ore. By investing in the existing mining projects and other mining companies, Hainan Mining aims to accelerate the expansion of its scale and promote its industry position.
The main product of Hainan Mining is iron ore. During the Reporting Period, prices of iron ore fell sharply, affected by market fluctuation in the
downstream steel industry. Relying on its own advantages, Hainan Mining overcame market difficulties and enhanced its sales, with its sales of finished iron ore reaching 3,319.6 thousand tonnes in 2015, basically the same as the sales in 2014. The finished ore production reached 3,009.3 thousand tonnes, representing a decrease of 24.3% when compared with the same period in 2014.
Hainan Mining produces iron ore as its key product and the key production data during the Reporting Period was as follows:
Finished ironore output
(thousand tonnes) Reserves of iron ore Note
2015 3,009.3 265 million tonnes2014 3,974.9 270 million tonnesChange over the same period of last year - 24.3%
Note: According to the “Solid Minerals Geological Prospecting Standards” of the PRC, the figures in 2015 were estimated figures.

MANAGEMENT DISCUSSION & ANALYSIS
FOSUN INTERNATIONAL LIMITED Annual Report 201552
ROCThe Company launched an offer of acquisition to ROC in August 2014. In January 2015, ROC was wholly-owned by the Group and officially delisted from the Australian Stock Exchange.
From January 2015, 100% of the financial results of ROC have been consolidated into the Company’s consolidated financial statements. During the Reporting Period, ROC realized sales income of USD130.5 million, net loss of USD31.3 million, EBITDA of USD48.4 million and net cash inflow from operating activities of USD34.9 million.
The Company intended to utilize ROC as its strategic platform in the oil and gas sector in the future. Leveraging on its leading operational and management capabilities and business development potentials, the Company will integrate its existing business bases in the PRC, Southeast Asia and Australia to capture the global oil and gas investment opportunities under the environment of declining oil prices, so as to obtain sustainable returns.
RECENT DEVELOPMENTPhoenix HoldingsSince certain conditions precedent had not been fulfilled or waived, the Group and Phoenix Holdings agreed to terminate the share purchase agreement in relation to the acquisition of 130,623,262 ordinary shares of Phoenix Holdings in February 2016. The Board is of the view that the termination of the share purchase agreement is fair and reasonable and in the interests of the Company and its shareholders as a whole, and will not have any material adverse effect on the business operation and financial position of the Group. The Group will continue to focus on strengthening its core competitiveness and look forward to future opportunities in working with the Delek Group Ltd. and Phoenix Holdings in Israel in addition to more opportunities of value investments in the country.
BHF KBAs set out in the announcement of the Company dated 26 January 2016, the Group accepted Oddo et Cie’s offer on the Group’s indirect holding of 37,838,980 shares in BHF KB (representing approximately 28.61% of its total issued share capital) at the price of Euro5.75 per share of BHF KB with a total sales price of Euro217,574,135. This transaction was completed in February 2016, and the Company will no longer hold any share in BHF KB either directly or indirectly after the completion. The Group will continue to adhere to the “value-investing” philosophy in anticipation of more opportunities of value investments in Germany and wider European markets.

MANAGEMENT DISCUSSION & ANALYSIS
FOSUN INTERNATIONAL LIMITED Annual Report 2015 53
FINANCIAL REVIEW
NET INTEREST EXPENDITURESNet interest expenditures, net of capitalized amounts of the Group, increased to RMB4,492.7 million in 2015 from RMB3,667.4 million in 2014. The increase in net interest expenditures in 2015 was mainly attributable to the growth in scale of total borrowings. The interest rates of borrowings in 2015 were approximately between 0.57% and 8.70%, as compared with approximately between 0.52% and 11.00% for the same period in 2014.
TAXTax of the Group increased to RMB5,229.1 million in 2015 from RMB3,119.2 million in 2014. The increase in tax was mainly resulted from the increase in taxable profit from the Group.
BASIC EARNINGS PER SHARE OF ORDINARY SHARESBasic earnings per share attributable to ordinary equity holders of ordinary shares of the parent was RMB1.06 in 2015, representing an increase of 3.9% from RMB1.02 per share in 2014. Diluted earnings per share attributable to ordinary equity holders of ordinary shares of the parent was RMB1.05 in 2015. The weighted average number of shares was 7,580.4 million shares for 2015, which was 6,727.6 million shares for 2014.
EQUITY PER SHARE ATTRIBUTABLE TO OWNERS OF THE PARENTAs at 31 December 2015, equity per share attributable to owners of the parent was RMB8.74, representing an increase of RMB1.60 per share from RMB7.14 per share as at 31 December 2014. The increase in equity per share attributable to owners of the parent was primarily due to the difference between RMB7,619.0 million and RMB1,035.1 million, which were the total comprehensive income attributable to owners of the parent in 2015 and the dividend distributed on 28 May 2015, respectively.
PROPOSED FINAL DIVIDENDThe Board has recommended the payment of a proposed final dividend of HKD0.17 per ordinary share for the year ended 31 December 2015. Subject to the approval of the Company’s shareholders at the Company’s annual general meeting to be held on 1 June 2016, the proposed final dividend will be paid to the Company’s shareholders on or around 18 July 2016. There is no arrangement under which a shareholder of the Company has waived or agreed to waive any dividends.

MANAGEMENT DISCUSSION & ANALYSIS
FOSUN INTERNATIONAL LIMITED Annual Report 201554
CAPITAL EXPENDITURES AND CAPITAL COMMITMENTThe capital expenditures of the Group mainly consists of additions to property, plant and equipment, prepaid land lease payments, exploration and evaluation assets, mining rights and intangible assets. We have been increasing our investment in the research and development of pharmaceutical products in order to produce more proprietary products with higher gross profit margin. We continued our commitment in property development, but will adjust our strategy according to market conditions. With an aim to further strengthen our leading role in the happiness industry, we have made extra efforts in the happiness segment. The amount of capital expenditures of the Group during the Reporting Period was RMB8,575.3 million. Details of capital expenditures of each business segment are set out in note 5 to financial statements.
As at 31 December 2015, the Group’s capital commitment contracted but not provided for was RMB20,006.9 million. These were mainly committed for property development, addition of plant and machinery and investments. Details of capital commitment are set out in note 57 to financial statements.
INDEBTEDNESS AND LIQUIDITY OF THE GROUPAs at 31 December 2015, the total debt of the Group was RMB115,110.0 million, representing a slight increase over RMB95,834.2 million as at 31 December 2014, which was mainly due to the increase in borrowings as a result of business expansion of all segments of the Group. As at 31 December 2015, mid-to-long-term debt of the Group accounted for 57.4% of total debt, as opposed to 51.4% as at 31 December 2014. As at 31 December 2015, cash and bank and term deposits increased by 16.7% to RMB47,066.9 million as compared with RMB40,338.6 million as at 31 December 2014.
Unit: RMB million
31 December 2015 31 December 2014 Total debt 115,110.0 95,834.2Cash and bank and term deposits 47,066.9 40,338.6
The original denomination of the Group’s debt as well as cash and bank and term deposits by currencies, equivalent in RMB, as at 31 December 2015, is summarized as follows:
Unit: RMB million equivalent

MANAGEMENT DISCUSSION & ANALYSIS
FOSUN INTERNATIONAL LIMITED Annual Report 2015 55
TOTAL DEBT TO TOTAL CAPITALISATION RATIOAs at 31 December 2015, the ratio of total debt to total capitalisation was 54.0% as compared with 55.9% as at 31 December 2014. This ratio has decreased as a result of the increase of the total capitalisation. Healthy debt ratios and abundant funds can reinforce the Group’s ability to defend against risk exposure, and provide support to the Group in capturing investment opportunities.
BASIS OF CALCULATING INTEREST RATETo stabilize interest expenses, the Group endeavored to maintain appropriate borrowings at fixed interest rates and floating interest rates. The Group made timely adjustment to the debt structure according to the interest rate policy, seeking to optimise the interest rate level. As at 31 December 2015, 37.4% of the Group’s total borrowings bore interest at a fixed interest rate.
THE MATURITY PROFILE OF OUTSTANDING BORROWINGSThe Group sought to manage and extend the maturity of outstanding borrowings, so as to ensure that the outstanding borrowings of the Group due to mature every year would not exceed the expected cash flow of that year and the Group has the re-financing ability for the relevant liabilities in that year.
Outstanding borrowings classified by year of maturity as at 31 December 2015 are as follows:
AVAILABLE FACILITIESAs at 31 December 2015, save for cash and bank and term deposits of RMB47,066.9 million, the Group had unutilized banking facilities of RMB132,279.9 million. The Group has entered into cooperation agreements with various major banks in China. According to these agreements, the banks granted the Group general banking facilities to support its capital needs. Prior approval of individual projects from banks in accordance with bank regulations of China must be obtained before the use of these banking facilities. As at 31 December 2015, available banking facilities under these arrangements totalled RMB214,584.9 million, of which RMB82,305.0 million was utilized.

MANAGEMENT DISCUSSION & ANALYSIS
FOSUN INTERNATIONAL LIMITED Annual Report 201556
CASH FLOWIn 2015, net cash flow used in operating activities was RMB3,420.2 million. Profit before tax for the year was RMB16,182.5 million. After making aggregate adjustment for the items such as investment gain and loss and financing costs included in profit before tax and offsetting the total amount of depreciation and amortisation which did not result in cash outflow, cash flow generated from operating activities decreased by RMB13,355.7 million. However, owing to the increase in properties under development of RMB11,392.1 million, the increase in prepayments, deposits and other receivables of RMB3,051.2 million, trade and notes receivables of RMB1,133.4 million and insurance and reinsurance debtors of RMB1,533.9 million, the decrease in accrued liabilities and other payables of RMB2,799.6 million and income tax payment of RMB4,467.3 million, cash flow generated from operating activities decreased. The decrease in completed properties held for sale of RMB12,533.8 million, the increase in investment contract liabilities of RMB3,588.3 million contributed to an increase in the cash flow from operating activities. The increase in properties under development was mainly due to the increase in the investment in property development projects; the increase in insurance and reinsurance debtors was mainly due to the expansion of insurance business; the decrease in completed properties held for sale was mainly due to the sales of Forte; the increase in investment contract liabilities was mainly due to the increase in Fosun Insurance Portugal’s investment contract liabilities.
In 2015, net cash flow used in investing activities was RMB20,512.7 million, mainly used for the purchase of property, plant and equipment, purchase of equity investments at fair value through profit and loss and available-for-sale investments, acquisition of subsidiaries, associates and jointly-controlled entities, which was partly offset by proceeds from disposal of equity investments at fair value through profit and loss and available-for-sale investments, disposal of associates and disposal of partial interests in associates, dividends received from available-for-sale investments and decrease in pledged bank balances and time deposits with original maturity of more than three months.
In 2015, net cash flow from financing activities was RMB36,462.6 million, mainly generated from the new bank and other borrowings, as well as rights issue of new shares (net of share issue expenses) and placing of shares, which was partly offset by the repayment of bank and other loans, interest payment of bank loans and payment of dividends.
PLEDGED ASSETSAs at 31 December 2015, the Group had pledged assets of RMB50,485.9 million (31 December 2014: RMB30,629.0 million) for bank borrowings. Details of pledged assets are set out in note 37 to financial statements.
CONTINGENT LIABILITIESThe Group’s contingent liabilities were RMB8,045.7 million as at 31 December 2015 (31 December 2014: RMB2,657.8 million). Details of contingent liabilities are set out in note 58 to financial statements.
INTEREST COVERAGEIn 2015, EBITDA divided by net interest expenditures was 5.4 times as compared with 5.1 times in 2014, the increase was mainly due to the 30.7% increase of the Group’s EBITDA during the Reporting Period compared with 2014.

MANAGEMENT DISCUSSION & ANALYSIS
FOSUN INTERNATIONAL LIMITED Annual Report 2015 57
FINANCIAL POLICIES AND RISK MANAGEMENTGeneral policyThe Company maintains the financial independence of different business segments. Nevertheless, the Company also gives appropriate guidance on the fund management of different segments so as to ensure that risks of the Group are well monitored and financial resources are being effectively applied. To maintain multiple financing channels, the Group tries to obtain funds from different channels through banks and capital markets. Finance arrangements are organised to meet the needs of business development and match the Group’s cash flow.
Foreign currency exposureRMB is the functional and presentation currency of the Group. While the launching of global strategy, the Group held the proportion of assets denominated in currencies other than RMB had increased. Financial settlement and currency conversion as at the reporting date of these non-RMB assets may generate a certain amount of foreign exchange losses or gains, thereby affecting the Group’s profits or net assets. Since the exchange rate reform in August 2015, the exchange rate of RMB against USD depreciated for a time and the volatility increased. We are uncertain of the trend of the exchange rate of RMB in the future. The cost of conversion of RMB into foreign currencies will be subject to the fluctuation of the exchange rate of RMB.
Interest rate exposureThe Group uses bank loans and other borrowings to meet its capital expenditure and working capital requirements from time to time and is subject to the risk of interest rate fluctuation. Since a certain amount of the Group’s borrowings is provided at floating interest rates which are subject to change by the lenders as required by amendments of regulations of the People’s Bank of China and the market conditions in and outside Mainland China, the interest expenses of the Group will increase if the People’s Bank of China or foreign banks increase their interest rates.
Application of derivativesThe Group will apply derivative instruments as necessary to hedge the risk exposure instead of speculation.
FORWARD-LOOKING STATEMENTSThis anuual report includes certain forward-looking statements which involve the financial conditions, results and businesses of the Group. These forward-looking statements are the Group’s expectation or beliefs on future events and they involve known and unknown risks and uncertainties, which may cause actual results, performance or development of the situation to differ materially from the situation expressed or implied by these statements.

FOSUN INTERNATIONAL LIMITED Annual Report 201558
FIVE-YEAR STATISTICS
Unit: RMB million
Year 2011 2012 2013 2014 2015 Total equity 48,486.2 57,218.4 61,299.8 75,684.5 98,154.1Equity attributable to owners of the parent 31,830.2 35,197.3 39,628.2 49,408.4 75,252.5Equity per share attributable to owners of the parent (in RMB) 4.96 5.48 6.17 7.14 8.74Indebtedness Total debt 54,057.5 56,902.6 69,084.4 95,834.2 115,110.0 Total debt/Total capitalization (%) 52.7% 49.9% 53.0% 55.9% 54.0%Interest coverage (times) 4.9 3.9 5.3 5.1 5.4Capital employed 85,887.7 92,099.9 108,712.6 145,242.6 190,362.5Cash and bank balances 16,777.8 22,088.5 16,387.2 40,338.6 47,066.9Property, plant and equipment 21,513.2 24,295.9 30,215.7 36,037.9 17,176.4Investment property 3,026.0 3,985.0 9,896.3 16,883.9 40,898.7Property under development 29,313.9 35,300.9 30,859.9 37,101.8 35,882.4Prepaid land lease payments 1,405.9 1,801.2 1,994.0 2,921.4 2,143.9Mining rights 421.6 821.6 794.6 784.9 564.5Interest in associates 17,275.6 15,258.7 20,369.7 26,976.4 31,209.7Available-for-sale investments 8,437.3 7,382.9 10,050.3 77,237.8 118,132.7Investments at fair value through profit or loss 7,406.7 10,656.1 13,466.0 14,867.2 10,716.2Profit attributable to owners of the parent 3,403.6 3,707.2 5,518.9 6,853.9 8,038.3Basic earnings per share (in RMB) 0.53 0.58 0.86 1.02 1.06Diluted earnings per share (in RMB) 0.53 0.58 0.86 0.99 1.05Profit contribution by each business segment Insurance — (54.9) 523.6 1,117.0 2,104.2 Investment 249.7 1,884.8 1,301.3 2,195.3 2,930.5 Wealth management 6.4 61.0 51.0 306.1 589.9 Internet finance 0.9 26.8 61.0 (2.7) 105.8 Health 560.3 721.4 818.1 1,096.0 1,754.2 Happiness 79.7 169.1 332.2 473.5 175.1 Steel 416.5 (335.0) 415.5 280.0 (929.7) Property development and sales 1,649.1 1,494.9 2,087.0 2,397.5 2,993.5 Resources 743.3 462.8 602.4 129.9 (463.5)EBITDA 11,460.5 10,748.9 14,163.2 18,682.1 24,422.5Proposed dividend per share (in HKD) 0.157 0.170 0.150 0.170 0.170

FOSUN INTERNATIONAL LIMITED Annual Report 2015 59
CORPORATE GOVERNANCE REPORT
The Board is pleased to present the corporate governance report of the Group for the year ended 31 December 2015.
CORPOARTE GOVERNANCE PRACTICES OF THE COMPANYThe Company is committed to achieving high standards of corporate governance to safeguard the interests of shareholders and to enhance its corporate value and accountability.
During the Reporting Period, the Company applied the principles of and fully complied with all code provisions as set out in the CG Code. The Company regularly reviews its corporate governance practices to ensure compliance with the CG Code.
A. THE BOARDa) Responsibilities
The Board is responsible for the leadership and control of the Company and oversees the businesses, strategic decisions and performance of the Group. The Board has established Board committees and has delegated to these Board committees various responsibilities as set out in their respective terms of reference.
All Directors have carried out their duties in good faith and in compliance with the standards of applicable laws and regulations, and have acted in the interests of the Company and its shareholders at all times.
b) Delegation of Management FunctionThe Board takes responsibility for all major matters of the Company including the approval and monitoring of all policy matters, overall strategies and budgets, internal control and risk management systems, material transactions (in particular those that may involve conflicts of interest), financial information, appointment of Directors and other significant financial and operational matters.
All Directors have full and timely access to all relevant information to ensure that Board procedures and all applicable rules and regulations are followed. Each Director is able to seek independent professional advice in appropriate circumstances at the Company’s expense, upon making request to the Board.
The day-to-day management, administration and operation of the Company are delegated to the senior management by the Board. The delegated functions and work tasks are periodically reviewed. Under the leadership of the Chief Executive Officer, the management is responsible for the daily operation of the Company.
On a monthly basis, the senior management provides the Directors with operational and financial reports of the Group’s performance, position and prospects. All Directors are kept informed of and duly briefed of major changes and information that may affect the Group’s businesses in a timely manner.
c) Board CompositionThe Board for the year ended 31 December 2015 comprised the following Directors:
Executive DirectorsMr. Guo Guangchang (Chairman)Mr. Liang Xinjun (Vice Chairman and Chief Executive Officer)Mr. Wang Qunbin (President)Mr. Ding GuoqiMr. Qin XuetangMr. Chen Qiyu (appointed on 10 July 2015)Mr. Xu Xiaoliang (appointed on 10 July 2015)
Independent Non-executive DirectorsMr. Zhang ShengmanMr. Zhang HuaqiaoMr. David T. ZhangMr. Yang Chao
The former executive Director Mr. Wu Ping resigned on 10 July 2015.
The former non-executive Director Mr. Fan Wei resigned on 10 July 2015.

CORPORATE GOVERNANCE REPORT
FOSUN INTERNATIONAL LIMITED Annual Report 201560
The list of Directors (by category) is also disclosed in all corporate communications issued by the Company from time to time pursuant to the Listing Rules. The independent non-executive Directors are expressly identified in all corporate communications pursuant to the Listing Rules.There is no financial, business, family or other material/relevant relationship among the Directors.
The Company has received a written annual confirmation from each independent non-executive Director of his independence pursuant to the requirements of the Listing Rules. The Company considers all independent non-executive Directors to be independent in accordance with the independence guidelines set out in the Listing Rules.
The non-executive Director and independent non-executive Directors bring a wide range of business and financial expertise, experience and independent judgement to the Board. Through active participation in Board meetings, and serving on Board committees, all non-executive Director and independent non-executive Directors have made various positive contributions to the development of the Company.
d) Appointment and Re-election of DirectorsThe procedures of appointment, re-election and removal of Directors are laid down in the Articles of Association. The Nomination Committee of the Company is responsible for reviewing the Board composition, developing and formulating the relevant procedures for nomination and appointment of Directors, monitoring the appointment and succession planning of Directors and assessing the independence of independent non-executive Directors.
Mr. Chen Qiyu and Mr. Xu Xiaoliang were appointed as executive Directors on 10 July 2015 and have entered into service contracts with the Company for a term of 3 years from the date of their appointment. Mr. Yang Chao was appointed as independent non-executive Director on 23 December 2014 and has entered into service contract with the Company for a term of 3 years from the date of his appointment. Other Directors have entered into service contracts with the Company for a term of 3 years from 23 June 2014.
At every annual general meeting, at least one-third of the Directors shall retire from office by rotation. All Directors are subject to retirement by rotation at least once every three years and any new Director appointed to fill a casual vacancy or as an addition to the Board shall submit himself for re-election by shareholders at the next following general meeting after appointment.
According to the board diversity policy of the Company, all Board appointments will continue to be made on a merit basis with due regard for the benefits of diversity of the board members. Selection of candidates will be based on a range of diversity perspectives, including but not limited to gender, age, cultural and educational background, experience (professional or otherwise), skills and knowledge. The ultimate decision will be made upon the merits and contribution that the selected candidates will bring to the Board.
e) Continuous Professional Development of DirectorsEach newly appointed Director receives comprehensive induction on the first occasion of his appointment, so as to ensure that he has appropriate understanding of the businesses and operations of the Company and that he is fully aware of his responsibilities and obligations under the Listing Rules and relevant regulatory requirements. Continuing briefing and professional development for Directors will be arranged whenever necessary.
Directors should participate in appropriate continuous professional development to develop and refresh their knowledge and skills to ensure that their contribution to the Board remains informed and relevant. Internal briefings for Directors will be arranged by the Company and reading materials on relevant topics will be issued to Directors where appropriate. All Directors are encouraged to attend relevant training courses at the Company’s expenses.
During the Reporting Period, the Company arranged a training session conducted by King & Wood Mallesons on regulations on stock transaction and offered relevant reading materials including legal and regulatory update to the Board.
f) Board MeetingsThe Board meets regularly to review the financial and operating performance of the Group and approve future strategy. The Board held four regular Board meetings and four other Board meetings during the Reporting Period. In respect of corporate governance matters, the Board reviewed, among others, policies on corporate governance, code of conduct and the Company’s policies and practices on compliance with legal and regulatory requirements in regular meetings. The attendance records of each Director are set out below in the section “ATTENDANCE RECORD OF DIRECTORS AND COMMITTEE MEMBERS”.

CORPORATE GOVERNANCE REPORT
FOSUN INTERNATIONAL LIMITED Annual Report 2015 61
g) Practice and Conduct of Board MeetingsNotices of regular Board meetings are served to all Directors at least 14 days before the meetings. For other Board and committee meetings, reasonable notice is generally given.
Board papers together with all appropriate, complete and reliable information are sent to all Directors at least 3 days before each Board meeting or committee meeting to keep the Directors apprised of the latest developments and financial position of the Company and to enable them to make informed decisions. The Board and each Director also have separate and independent access to the senior management whenever necessary.
The senior managements where necessary, attend regular Board meetings and other Board and committee meetings to advise on business developments, financial and accounting matters, statutory compliance, corporate governance and other major aspects of the Company.
The Articles of Association contains provisions requiring Directors to abstain from voting and not to be counted in the quorum at meetings for approving transactions in which such Directors or any of their associates have a material interest.
B. CHAIRMAN AND CHIEF EXECUTIVE OFFICERThe posts of Chairman and Chief Executive Officer are held by Mr. Guo Guangchang and Mr. Liang Xinjun respectively. This segregation ensures a clear distinction between the Chairman’s responsibility to manage the Board and the Chief Executive Officer’s responsibility to manage the Company’s business operations. Their respective responsibilities are clearly established and set out in writing.
The Chairman’s job responsibilities are to ensure all Directors are informed of the matters to be resolved or discussed in the Board meetings; to ensure that Directors receive adequate information in a timely manner, and the relevant information is accurate, detail, complete and reliable; to lead the Board; to ensure the Board operates effectively, performs its duties, and discusses all important and appropriate matters in a timely manner; to be primarily responsible to decide and approve the agenda of each Board meeting and add other items into the agenda upon request from other Directors (where applicable), this responsibility can be delegated to other Directors or the company secretary; to ensure the Company to adopt a sound corporate governance code and procedure; to encourage all Directors devoting themselves to the Board’s matters and to ensure the Board acts in the best interest of the Company by making himself an example; to encourage Directors with different opinions to express their concerns and give adequate time to discuss and to ensure the decisions of the Board reflect consensus of the Board; to meet with the non-executive Directors (including the independent non-executive Director) at least once annually, without the presence of the executive Directors; to ensure appropriate procedures to keep effective communication with the shareholders and to ensure shareholder’s opinions are delivered to the whole Board; to promote open and positive culture to discuss, to promote Directors (especially non-executive Directors) to make effective contribution to the Board, and to ensure constructive relationship between executive Directors and non-executive Directors.
The Chief Executive Officer’s job responsibilities are to lead the management to operate the business of the Group in line with the business plan and budget approved by the Board; to lead the management to ensure an efficient co-operation relationship with the Chairman and the Board and to meet or communicate with the Chairman regularly to review the key development, matters, opportunities and concerns; to establish and give advice on the Group’s strategy and policy for Board’s consideration; to implement the strategy and policy approved by the Board and Board Committees and achieve the goal of the Group with the assistance of the management; to continuously discuss with the Chairman on those key and fundamental topics and to ensure the Board are informed of those topics; to ensure the management to provide report to the Board in priority, including appropriate, accurate, timely and clear material to assist the Board in performing its responsibilities; to ensure the Board (especially the Chairman) to notice the complicated, controversial and sensitive matters of the Group in advance; to lead the communication plan with the equity holders (including shareholders); and to direct the Group’s business in line with the common practice and procedures adopted by the Board, to encourage the Group to maintain the highest integrity, justice and corporate governance level.
C. BOARD COMMITTEESThe Board has established the Audit Committee, Remuneration Committee and Nomination Committee, for overseeing particular aspects of the Company’s affairs. All Board committees of the Company were established with defined written terms of reference. The terms of reference of the Board committees are posted on the Company’s website (www.fosun.com) and the Hong Kong Stock Exchange’s website (www.hkexnews.hk) and are available to shareholders upon request.

CORPORATE GOVERNANCE REPORT
FOSUN INTERNATIONAL LIMITED Annual Report 201562
The majority of the members of each Board committee are independent non-executive Directors. The Board committees are provided with sufficient resources to discharge their duties, and upon reasonable request, are able to seek independent professional advice in appropriate circumstances, at the Company’s expense.
Audit CommitteeThe Audit Committee comprises four independent non-executive Directors, namely Mr. Zhang Shengman (Chairman), Mr. Zhang Huaqiao, Mr. David T. Zhang and Mr. Yang Chao. None of the members of the Audit Committee is a former partner of the Company’s existing external auditors.
The main duties of the Audit Committee include the following:
‧ To review the financial statements and reports and consider any significant or unusual items raised by the Company’s staff responsible for the accounting and financial reporting function or external auditors before submission to the Board;
‧ To review the relationship with the external auditors by reference to the work performed by the auditors, their fees and terms of engagement, and make recommendations to the Board on the appointment, re-appointment and removal of external auditors; and
‧ To review the adequacy and effectiveness of the Company’s financial reporting system, risk management and internal control system (including ensuring the adequacy of resources, qualification and experience of staff of the Company’s accounting, internal audit and financial reporting function, their training programmes and budget) and associated procedures.
The Audit Committee held two meetings during the Reporting Period to review, among others, the financial results and reports, financial reporting and compliance procedures, internal control and risk management systems, appointment and scope of work of external auditors. The attendance records of each member of the Audit Committee are set out below in the section “ATTENDANCE RECORD OF DIRECTORS AND COMMITTEE MEMBERS”.
The Company’s annual results for the year ended 31 December 2015 have been reviewed by the Audit Committee.
Remuneration CommitteeThe Remuneration Committee comprises five Directors, namely Mr. Zhang Huaqiao (Chairman), Mr. Liang Xinjun, Mr. Zhang Shengman, Mr. David T. Zhang and Mr. Yang Chao and the majority of them are independent non-executive Directors.
The primary work of the Remuneration Committee includes making recommendations to the Board on the remuneration packages of individual executive Directors and senior management after assessing their performance, as well as on the remuneration policy and structure for all Directors and senior management. The Remuneration Committee is also responsible for establishing transparent procedures for developing such remuneration policy and structure to ensure that no Director or any of his close associates will participate in deciding his own remuneration, which will be determined by reference to the performance of the individual and the Company as well as market practice and conditions.
The Remuneration Committee held one meeting during the Reporting Period to review and make recommendations to the Board on, among others, the remuneration policy and structure of the Company, the remuneration packages of the Directors and senior management and other related matters. The attendance records of each member of the Remuneration Committee are set out below in the section “ATTENDANCE RECORD OF DIRECTORS AND COMMITTEE MEMBERS”.
During the Reporting Period, the Remuneration Committee also recommended to the Board on the proposed remuneration of the newly appointed Directors.
Nomination CommitteeThe Nomination Committee comprises five Directors, namely Mr. David T. Zhang (Chairman), Mr. Wang Qunbin, Mr. Zhang Shengman, Mr. Zhang Huaqiao and Mr. Yang Chao and the majority of them are independent non-executive Directors.
The main duties of the Nomination Committee include the following:
‧ To review the structure, size and composition (including the skills, knowledge and experience) of the Board on a regular basis and make recommendations to the Board regarding any proposed changes;

CORPORATE GOVERNANCE REPORT
FOSUN INTERNATIONAL LIMITED Annual Report 2015 63
‧ To identify individuals suitably qualified to become Board members and nominate and select or make recommendations to the Board on the selection of individuals nominated for directorships;
‧ To assess the independence of independent non-executive Directors; and
‧ To make recommendations to the Board on relevant matters relating to the appointment or re-appointment of directors and succession planning for Directors.
The Nomination Committee held one meeting during the Reporting Period to review the structure, size and composition of the Board, the independence of the independent non-executive Directors and make recommendation to the Board in relation to the re-appointment of retiring Directors at the 2015 annual general meeting. The attendance records of each member of the Nomination Committee are set out below in the section “ATTENDANCE RECORD OF DIRECTORS AND COMMITTEE MEMBERS”.
During the Reporting Period, the Nomination Committee also recommended to the Board on the selection of individuals for directorships.
The Nomination Committee has adopted a set of nomination procedures for selection of candidates for directorship of the Company by making reference to the Company’s board diversity policy, skills, experience, professional knowledge, personal integrity and time commitments of such individuals, the Company’s needs and other relevant statutory requirements and regulations.
D. ATTENDANCE RECORD OF DIRECTORS AND COMMITTEE MEMBERSThe attendance record of each Director at the Board and Board committee meetings, and annual general meeting of the Company held for the year of 2015 is set out in the table below:
Attendance/Number of Meetings
Name of Director BoardAudit
CommitteeRemuneration
CommitteeNominationCommittee
AnnualGeneralMeeting
Guo Guangchang 8/8 — — — 1/1Liang Xinjun 8/8 — 1/1 — 1/1Wang Qunbin 8/8 — — 1/1 0/1Ding Guoqi 8/8 — — — 1/1Qin Xuetang 8/8 — — — 1/1Wu Ping(1) 4/4 — — — 0/1Fan Wei(1) 4/4 — — — 0/1Chen Qiyu(2) 3/3 — — — N/AXu Xiaoliang(2) 3/3 — — — N/AZhang Shengman 8/8 2/2 1/1 1/1 0/1Zhang Huaqiao 8/8 2/2 1/1 1/1 0/1David T. Zhang 8/8 2/2 1/1 1/1 1/1Yang Chao 8/8 2/2 1/1 1/1 0/1
Notes:
(1) The former executive Director Mr.Wu Ping and the former non-executive Director Mr. Fan Wei resigned on 10 July 2015. They attended all the Board meetings held prior to their date of resignations.
(2) Mr. Chen Qiyu and Mr. Xu Xiaoliang were appointed as executive Directors on 10 July 2015. They attended all the Board meetings held subsequent to their date of appointments.
E. MODEL CODE FOR SECURITIES TRANSACTIONSThe Company has adopted the Model Code. Specific enquiry has been made to all Directors and the Directors have confirmed that they have complied with the Model Code throughout the Reporting Period. The Company has also established written guidelines on no less exacting terms than the Model Code for securities transactions by the relevant employees who are likely to be in possession of unpublished inside information of the Company. No incident of non-compliance of the above-mentioned written guidelines by the relevant employees of the Company was noted by the Company.

CORPORATE GOVERNANCE REPORT
FOSUN INTERNATIONAL LIMITED Annual Report 201564
F. DIRECTORS’ RESPONSIBILITES FOR FINANCIAL REPORTINGThe Board is responsible for presenting a balanced and clear assessment of annual and interim reports, inside information announcements and other disclosures required under the Listing Rules and other regulatory requirements. The Directors acknowledge their responsibility for preparing the financial statements of the Company for the year ended 31 December 2015. The senior management has provided such explanation and information to the Board as necessary to enable the Board to carry out an informed assessment of the financial information and position of the Company put to the Board for approval.
G. EXTERNAL AUDITORS AND AUDITORS’ REMUNERATIONThe statement of Ernst & Young, the external auditors of the Company, about their reporting responsibilities for the financial statements is set out in the “Independent Auditors’ Report” on page 100.
During the Reporting Period, the remuneration paid to Ernst & Young, the external auditors of the Company, in respect of professional audit services, amounted to RMB10.7 million and no significant non-audit services were provided by Ernst & Young to the Company.
H. RISK MANAGEMENT AND INTERNAL CONTROLThe Board is responsible for evaluating and determining the nature and extent of the risks it is willing to take in achieving the Company’s strategic objectives, and ensuring that the Company establishes and maintains appropriate and effective risk management and internal control systems. The Board oversees the management in the design, implementation and monitoring of the risk management and internal control systems efficiently, and the management provides a confirmation to the Board on the effectiveness of these systems. The Company identifies, evaluates and monitors significant risks faced by the Company and builds up its risk management and internal control system, taking into consideration the findings of internal audits and issues revealed during operation and management as well as audit findings of external auditors to achieve the goal of risk control. Such significant risks include decision-making risks of operation, financial control risks, and the risks arising from changes in business environment. We reviewed the risk management and internal control systems of the Company on a regular and ad hoc basis.
The internal audit department of the Company conducts independent evaluation on the effectiveness of the existing risk management and internal control system according to the audit strategy and annual audit plan of the Company. It is also responsible for monitoring the stable and proper operation and improvement of the risk management and internal control system. Audit findings of the Company are reported to the Board and the management, and the management oversees the implementation of any remedial and improvement measures to be taken. After following up and checking, such measures have been taken as expected.
During the Reporting Period, the Board has reviewed the effectiveness of the risk management and internal control system of the Group. The Company continued to improve the standardization and systematic development of the internal control system, covering the functions of financial control, operational control, compliance control and risk management. The internal audit department of the Company has carried out independent internal control audits in respect of those significant risk areas, such as corporate governance, financial income and expenses, equity investment, project management, asset management, information management etc., and has reported to the Directors regularly in respect of the effectiveness of the risk management and internal control system and significant risks. The boards of directors of the subsidiaries have submitted evaluation reports to the Company on the effectiveness of the risk management and internal control systems. The Company considers that its risk management and internal control system are effective and adequate.
The Anti-Corruption and Supervision Department of the Company was established in 2013, which continued to strengthen anti-corruption risk control by adopting measures including the formation of the “One Fosun” system for disciplinary inspection and supervision, the establishment of a joint working conference for anti-corruption supervisors, the deployment of general managers for anti-corruption supervision to subsidiaries, as well as the establishment of a vertical leadership mechanism for anti-corruption supervisors. The anti-corruption supervision hotline and mailbox were announced through the portal website for the collection of reported information internally and externally and conducting relevant investigations, the probity of managers in performing their duties was supervised. The anti-corruption system was continuously improved through exploring the feasibility of establishing a concurrent anti-corruption supervision system for post-investment management of material investment projects and implementing the requirements under the “Personal Matters Reporting System for Key Position Cadres of Fosun Group” to build an atmosphere of integrity in performing duties by combining self-discipline and supervision. Meanwhile, anti-corruption inspections on subsidiaries continued to increase. Inspection opinions of supervisors were issued in the course of inspection on aspects of material risks, such as tender and bidding, project management, financial income and expenses, and reported directly to the Board and the management. Non-compliances with legal and disciplinary requirements were supervised by the management for rectifications. The rectification result was reported to the Board and attained the expected effects.

CORPORATE GOVERNANCE REPORT
FOSUN INTERNATIONAL LIMITED Annual Report 2015 65
I. COMMUNICATION WITH SHAREHOLDERS AND INVESTORSThe Company considers that effective communication with shareholders is essential for enhancing investor relations and investors’ understanding of the Group’s business performance and strategies.
The Company also recognizes the importance of transparency and timely disclosure of corporate information, which will enable shareholders and investors to make the best investment decisions. The Group delivers its most updated information through announcements made on the Hong Kong Stock Exchange’s website, communication with analysts, meetings with investors, maintenance of the website of the Company concerning investor relations, dissemination of investor’s newsletter and public forum.
The general meetings of the Company provide a forum for communication between the Board and the shareholders. The Chairman as well as the chairmens of the Audit, Remuneration and Nomination Committees and, in their absence, other members of the respective committees and, where applicable, the Chairman of the independent Board committee, are available to answer questions at general meetings.
There are no changes in the Company’s Articles of Association during the Reporting Period. The up-to-date version of the Company’s Articles of Association is available on the Company’s website and the Hong Kong Stock Exchange’s website.
The Company endeavors to distribute material information about the Group to the public. To promote effective communication, the Company maintains a website at www.fosun.com, where information and updates on the Company’s business developments and operations, financial information and other information are available to the public.
J. SHAREHOLDER RIGHTSShareholders holding not less than one-twentieth of the paid-up capital of the Company may request the Board to convene an extraordinary general meeting of the Company subject to Sections 566 to 580 of the Companies Ordinance (Chapter 622) and Article 56 of the Articles of Association. The objects of the meeting must be stated in the related requisition which must be signed by the requisitionist(s) and deposited at the registered office of the Company.
To safeguard shareholders’ interests and rights, separate resolutions are proposed at general meetings for each substantially separate issue, including the election of individual Directors.
Subject to Sections 580 to 583 of the Companies Ordinance (Chapter 622), qualified shareholder(s) may put forward any proposals for discussion at the next annual general meeting of the Company by making requisition to the Board using contact details below in the section “Contact Details”.
The rights of shareholders and the procedures for demanding a poll on resolutions at general meetings are contained in the Articles of Association and the Companies Ordinance (Chapter 622). Pursuant to the Listing Rules, any vote of shareholders at a general meeting must be taken by poll, except where the Chairman, in good faith, decides to allow a resolution which relates purely to a procedural or administrative matter to be voted on by a show of hands. Poll results announcement will be posted on the websites of the Company and the Hong Kong Stock Exchange in the manner prescribed by the Listing Rules.
Putting Forward Enquiry/Requisition to the BoardFor putting forward any enquiries or requisitions to the Board, shareholders may send written enquiries/requisitions to the Company.
Contact DetailsShareholders may send their enquiries or requisitions as mentioned above to the following:
Name: Fosun International LimitedAddress: Room 808, ICBC Tower, 3 Garden Road, Central, Hong Kong
For the avoidance of doubt, shareholders must send the original duly signed written requisition, notice or statement, or enquiry (as the case may be) to the above address, and provide their full name, contact details and identification in order to give effect thereto. Shareholders’ information may be disclosed as required by law.

FOSUN INTERNATIONAL LIMITED Annual Report 201566
EXECUTIVEDIRECTORS
BIOGRAPHICAL DETAILS OF DIRECTORSAND SENIOR MANAGEMENT
FOSUN INTERNATIONAL LIMITED Annual Report 201566
Guo Guangchang, aged 48, is an Executive Director and Chairman of the Company. Mr. Guo was one of the founders of the Group and has been chairman of Fosun High Technology since its establishment in November 1994. He is now also a non-executive director of Fosun Pharma (listed on the Hong Kong Stock Exchange and the Shanghai Stock Exchange) and Minsheng Bank (listed on the Hong Kong Stock Exchange and the Shanghai Stock Exchange), a director of both Fosun Holdings and Fosun International Holdings (the direct and indirect controlling shareholders of the Company, respectively), a director of Club Med and the director of various companies within the Group. Mr. Guo is now a member of the 12th National Committee of the Chinese People’s Political Consultative Conference, a member of the 11th Standing Committee of All-China Federation of Industry & Commerce and All-China Youth Federation, vice chairman of The Zhejiang Chamber of Commerce, chairman of The Zhejiang Chamber of Commerce in Shanghai, etc.. Mr. Guo was a deputy to the 10th and 11th National People’s Congress of the PRC, a member of the 9th National Committee of the Chinese People’s Political Consultative Conference, etc.. Mr. Guo was awarded, among others, “2015 Most Influential Corporate Leader in China” issued by China Enterpreneur Summit and Chinese Entrepreneur 30th Award Ceremony, and named, among others, in the “50 Most Influential Individuals of the Portuguese Economy in 2015” by the Portuguese mainstream media Jornal de Negócios, Bloomberg Markets “50 Most Influential List 2014 - Corporate Power Broker” and a famous American business magazine Fast Company (Chinese edition) “China 100 Most Creative People in Business 2014”. Mr. Guo received a bachelor’s degree in philosophy in 1989 and a master’s degree in business administration in 1999, both from Fudan University.
Liang Xinjun, aged 47, is an Executive Director, Vice Chairman and Chief Executive Officer of the Company. Mr. Liang was one of the founders of the Group and has been vice chairman of Fosun High Technology since its establishment in November 1994. He is also a non-executive director and vice chairman of Zhaojin Mining (listed on the Hong Kong Stock Exchange) and the director of various companies within the Group. Mr. Liang was an independent director of Shanghai Oriental Pearl (Group) Co., Ltd. (listed on the Shanghai Stock Exchange with stock code: 600832). Mr. Liang is now
Guo Guangchang Liang Xinjun Wang Qunbin

FOSUN INTERNATIONAL LIMITED Annual Report 2015 67
范偉 丁國其 秦學棠 吳平
BIOGRAPHICAL DETAILS OF DIRECTORS AND SENIOR MANAGEMENT
FOSUN INTERNATIONAL LIMITED Annual Report 2015 67
Ding Guoqi Qin Xuetang Chen Qiyu Xu Xiaoliang
the Chinese Representative Designate of the Asia-Pacific Economic Cooperation (APEC) Business Advisory Council (ABAC), a member of China Industrial and Commerce Council and Management Committee of Asia-Pacific Economic Cooperation (APEC), a member of the 12th Shanghai Committee of the Chinese People’s Political Consultative Conference, executive council chairman of Shanghai League of TMT Industry Service, executive vice council chairman of China Science and Technology Private Entrepreneurs Association, chairman of The Taizhou Chamber of Commerce in Shanghai, chairman of the Fudan University Alumni Association (Shanghai), executive vice council chairman of Cheung Kong Graduate School of Business Alumni Association, etc.. Mr. Liang was awarded, among others, “Top Ten China Private Equity Investor” from 2011 to 2015 by Zero2IPO Group, “Asia’s Best CEO” at the Asian Excellence Recognition Awards 2014 issued by Corporate Governance Asia and “2014 Achievement Awards — Capital Markets Person of the Year” issued by FinanceAsia, and named, among others, “China’s Best Industrial Investor TOP10”, “China’s Best Internet Industry Investor TOP10” and “China’s Best Modern Agricultural Industry Investor TOP10” in 2015 China VC/PE Industry List as well as “China’s TOP5 Best PE Investor (60s) by Chinese LPs” in 2015 China VC/PE Innovation List issued by China Venture. Mr. Liang received a bachelor’s degree in genetic engineering in 1991 from Fudan University, a master’s degree in business administration in 2007 from Cheung Kong Graduate School of Business and a doctor’s degree in business administration (global financial management) from Arizona State University in 2015.
Wang Qunbin, aged 46, is an Executive Director and President of the Company. Mr. Wang was one of the founders of the Group and has been a director of Fosun High Technology since its establishment in November 1994. He is also a director of Henan Lingrui Pharmaceutical Co., Ltd. (listed on the Shanghai Stock Exchange with stock code: 600285) and Yuyuan (listed on the Shanghai Stock Exchange), non-executive director in Sinopharm (listed on the Hong Kong Stock Exchange) and Fosun Pharma (listed on the Hong Kong Stock Exchange and the Shanghai Stock Exchange) and the director of various companies within the Group. Mr. Wang holds various positions including honorary chairman of the Shanghai Bio Pharmaceutics Industry Association, honorary chairman of The Huzhou Chamber of Commerce in Shanghai and vice chairman of China Chamber of International Commerce. Mr. Wang was awarded “Asia Pacific Outstanding Entrepreneur Awards” issued by Enterprise Asia in 2014 and “Best Asian Corporate Director” at the Asian Excellence Recognition Awards 2014 by Corporate Governance Asia, and was named one of “China’s 50 Top-performing Corporate Leaders” by Harvard Business Review. Mr. Wang received a bachelor’s degree in genetic engineering from Fudan University in 1991.

FOSUN INTERNATIONAL LIMITED Annual Report 201568
BIOGRAPHICAL DETAILS OF DIRECTORS AND SENIOR MANAGEMENT
Ding Guoqi, aged 46, is an Executive Director and Senior Vice President of the Company. Mr. Ding resigned as the CFO of the Company in November 2015. Mr. Ding joined the Group in 1995, he is also a director of Hainan mining (listed on the Shanghai Stock Exchange) and the director of various companies within the Group. Mr. Ding was a director of Shanghai Ganglian E-Commerce Holdings Co., Ltd. (listed on the Shenzhen Stock Exchange with stock code:300226). Mr. Ding is now the chairman of The Anji Chamber of Commerce in Shanghai, standing vice chairman of The Huzhou Chamber of Commerce in Shanghai, director of the school board of Shanghai University of Finance and Economics and chairman of the alumni association of Shanghai University of Finance and Economics, School of Accounting. Mr. Ding was awarded “Asia’s Best CFO” at the Asian Excellence Recognition Awards 2015 by Corporate Governance Asia. Mr. Ding received a bachelor’s degree in accounting from Shanghai University of Finance and Economics in 1991.
Qin Xuetang, aged 52, is an Executive Director and Senior Vice President of the Company. Mr. Qin is also acting as the director of various overseas companies within the Group. Since joining the Group in 1995, Mr. Qin has been in charge of the legal affairs of the Company, possessing in-depth knowledge in the area of mergers and acquisitions, as well as in corporate governance affairs of A-share listed companies. In addition, Mr. Qin oversees all matters related to the Company’s audit, compliance, risk control and information disclosure systems. Mr. Qin received a bachelor’s degree in law in 1985 from the Southwest University of Political Science and Law and was admitted to practice law in the PRC in 1990. Prior to joining the Group, Mr. Qin worked in the Law School of Fudan University.
Chen Qiyu, aged 43, is an Executive Director and Vice President of the Company. Mr. Chen joined the Group in 1994. He is also an executive-director and chairman of Fosun Pharma (listed on the Hong Kong Stock Exchange and the Shanghai Stock Exchange), a non-executive director and vice chairman of Sinopharm (listed on the Hong Kong Stock Exchange), a director of Zhejiang D.A. Diagnostic Company Limited (listed on the Growth Enterprise Board of the Shenzhen Stock Exchange with stock code: 300244), Beijing Sanyuan Food Co., Ltd. (listed on the Shanghai Stock Exchange) and Maxigen Biotech Inc. (listed on the Taiwan Stock Exchange with stock code: 1783) and the director of various companies within the Group. Mr. Chen is a member of the 12th Shanghai Committee of the Chinese People’s Political Consultative Conference, the chairman of China Medical Pharmaceutical Material Association, a vice president of China Pharmaceutical Industry Research and Development Association, a vice president of China Pharmaceutical Industry Association, the chairman of Shanghai Biopharmaceutical Industry Association and vice council chairman of Shanghai Society of Genetics. Mr. Chen received a bachelor’s degree in genetics from Fudan University in 1993 and an EMBA degree from China Europe International Business School in 2005.
Xu Xiaoliang, aged 42, is an Executive Director and Vice President of the Company. Mr. Xu joined the Group in 1998, he is also the chairman of Yuyuan (listed on the Shanghai Stock Exchange), a non-executive director of Zhaojin Mining (listed on the Hong Kong Stock Exchange) and Shanghai Zendai Property Limited (listed on the Hong Kong Stock Exchange with stock code: 0755), a director of Resource Property (listed on NEEQ) and the director of various companies within the Group. Mr. Xu is now the co-chairman of Real Estate Association of The Zhejiang Chamber of Commerce, a member of Shanghai Youth Federation and a vice chairman of China Real Estate Chamber of Commerce. Mr. Xu was successively awarded the “Shanghai 4 May Youth Medal” and “Shanghai Top Ten Youth Business People”. Mr. Xu graduated from the Innova Education School of Singapore with a diploma in 1995 and received a master’s degree in business administration from the East China Normal University in 2002.

FOSUN INTERNATIONAL LIMITED Annual Report 2015 69
Zhang Shengman Zhang Huaqiao David T. Zhang Yang Chao
INDEPENDENT NON-EXECUTIVE DIRECTORS
BIOGRAPHICAL DETAILS OF DIRECTORS AND SENIOR MANAGEMENT
Zhang Shengman, aged 58, has been an Independent Non-Executive Director of the Company since December 2006. Mr. Zhang is chairman of Asia Pacific of Citigroup (listed on the New York Stock Exchange with stock code: C), before that he was president of Asia Pacific of Citigroup. Mr. Zhang joined Citigroup in February 2006 as chairman of the Public Sector Group. Mr. Zhang worked in the PRC Ministry of Finance as deputy director and vice secretary from 1994 to 1995. From 1994 to 1995, Mr. Zhang was an executive director for China at the World Bank. From 1995 to 1997, Mr. Zhang was vice president and chief secretary of the World Bank. From 1997 to 2001, Mr. Zhang was senior vice director of the World Bank. Mr. Zhang was a managing director of the World Bank and chairman of World Bank’s operations committee, the sanctions committee and the corporate committee on fraud and corruption policy from 2001 to 2005. Mr. Zhang received a bachelor’s degree in English literature in 1978 from Fudan University and a master’s degree in public administration in 1985 from University of the District of Columbia. Mr. Zhang completed the Harvard Advanced Management Program in 1997.
Zhang Huaqiao, aged 52, has been an Independent Non-Executive Director of the Company since March 2012. Mr. Zhang is also an executive director and chairman of China Smartpay Group Holdings Limited (stock code: 08325), a non-executive director of Boer Power Holdings Ltd. (stock code: 01685), an independent non-executive director of Zhong An Real Estate Limited (stock code: 00672), China Huirong Financial Holdings Limited (stock code: 01290), Logan Property Holdings Company Limited (stock code: 03380), Luye Pharma Group Ltd. (stock code: 02186), Wanda Hotel Development Company Limited (stock code: 00169) and Sinopec
Oilfield Service Corporation (stock code: 01033), all of which are listed on the Hong Kong Stock Exchange, an independent non-executive director of Yancoal Australia Ltd. (listed on the Austrialian Stock Exchange with stock code: YAL). From July 1986 to January 1989, Mr. Zhang was employed at the People’s Bank of China in Beijing and from June 1999 to April 2006, Mr. Zhang worked at the Equities Department of UBS AG, Hong Kong Branch at which he first served as the head of the China research team and later became the co-head of the China research team. Mr. Zhang was the chief operating officer from March 2006 to September 2008 and executive director from May 2006 to September 2008 of Shenzhen Investment Limited (listed on the Hong Kong Stock Exchange with stock code: 00604). From September 2008 to June 2011, he was deputy head of China Investment Banking at UBS Securities Asia Limited. Mr. Zhang was an executive director and chief executive officer of Man Sang International Limited (listed on the Hong Kong Stock Exchange with stock code: 00938) from September 2011 to April 2012, a director of Nanjing Central Emporium (Group) Stocks Co., Ltd. (listed on the Shanghai Stock Exchange with stock code: 600280) from February 2013 to June 2015 and an independent non-executive director of Fuguiniao Co., Ltd. (listed on the Hong Kong Stock Exchange with stock code: 01819) from May 2013 to June 2014 and Ernest Borel Holdings Limited (listed on the Hong Kong Stock Exchange with stock code: 01856) from June 2014 to November 2014. Mr. Zhang graduated from the Graduate School of the People’s Bank of China with a master’s degree in economics in 1986; and from the Australian National University with a master’s degree in economics in 1991.

BIOGRAPHICAL DETAILS OF DIRECTORS AND SENIOR MANAGEMENT
FOSUN INTERNATIONAL LIMITED Annual Report 201570
David T. Zhang, aged 53, has been an Independent Non-Executive Director of the Company since June 2012. Mr. Zhang is also a partner of Kirkland & Ellis LLP, a leading international law firm. Admitted to the practice of law in the State of New York, USA and based in Hong Kong, Mr. Zhang specializes in securities offerings and M&A transactions. He has extensive experience representing Chinese issuers and leading investment banks in US initial public offerings, Hong Kong initial public offerings and other Rule 144A and Regulation S offerings of equity, debt and convertible securities. Additionally, Mr. Zhang has represented a number of leading private equity funds, multinational corporations and sovereign wealth funds in connection with their investments and M&A transactions in the Greater China region and Southeast Asia. Mr. Zhang has been rated as a top capital markets attorney by Chambers Global, Legal 500 Asia Pacific, IFLR1000 and Chambers Asia Pacific. Prior to joining Kirkland & Ellis LLP in August 2011, Mr. Zhang was a partner of Latham & Watkins LLP, a leading international law firm, for eight years. Mr. Zhang graduated from Beijing Foreign Studies University in 1981 and received his J.D. from Tulane University Law School in 1991.
Yang Chao, aged 65, has been an Independent Non-Executive Director of the Company since December 2014. Mr. Yang was the chairman of China Life Insurance Company Limited (listed on the Hong Kong Stock Exchange with stock code: 02628) from July 2005 to June 2011, the president and secretary of party committee of China Life Insurance (Group) Company from May 2005 to May 2011 and an independent non-executive director of SRE Group Limited (listed on the Hong Kong Stock Exchange with stock code: 01207) from November 2013 to December 2015. Mr. Yang is currently a member of the National Committee of the Chinese People’s Political Consultative Conference and its Social and Legislative Committee. Mr. Yang, a Senior Economist, has more than 30 years of experience in the insurance and banking industries, and was awarded special allowance by the State Council. Mr. Yang graduated from Shanghai International Studies University and Middlesex University in the United Kingdom, majoring in English and business administration respect ively, and received a master ’s degree in business administration.
SENIOR MANAGEMENT OF THE COMPANY (IN ALPHABETICAL ORDER OF LAST NAME)Kang Lan, aged 46, is the Vice President and Chief Human Resources Officer of the Company and the President of Fosun Insurance Group. Ms. Kang joined the Group in 2010, and is also the director of various insurance companies (Peak Reinsurance, Yong’an P&C Insurance, Fosun Insurance Portugal, Pramerica Fosun Life Insurance, Ironshore and MIG) and other companies within the Group. Ms. Kang was the project manager of Nanjing High Technology Industry Development Company from August 1991 to June 1993, a researcher of Memorial Sloan-Kettering Cancer Center in the United States from October 1995 to May 1998, a research and development scientist in Wyeth from May 1998 to August 2000, a consultant of McKinsey & Company, Greater China Office from August 2002 to February 2007, and a senior client partner of Korn/Ferry International Consulting Ltd., Greater China Office from March 2007 to August 2010. Ms. Kang received her bachelor’s degree in biological sciences and biotechnology from Zhejiang University in 1991, master’s degree in biochemistry from Tulane University in the United States in 1995, and MBA degree from the Wharton School of the University of Pennsylvania in 2002.
Li Haifeng, aged 57, is the Vice President of the Company and the Chief Representative of Beijing office of the Group. Mr. Li is also the General Manager of the Public Affairs Department and Head of comprehensive lines of the Group. Mr. Li joined the Group in 2001 and set up the Beijing office of the Group, and is now also the director of various companies within the Group. Mr. Li is responsible for integrating and maintaining public resources of the Group through building long-term cooperation in public sector, attending major foreign affairs and important activities on behalf of the Group, and conducting daily operational management and internal resources sharing of the comprehensive lines of the Group. Mr. Li also takes lead on substantial collaboration and projects involving diverse-ownership reform, participates in the decision-making process of major foreign affairs, and deals with unexpected events of the Group. Mr. Li received a graduation certificate in Marxist theory from East China University of Science and Technology in 1996, a postgraduate certificate in Marxist philosophy from Fudan University in 2009 and a master’s degree in business administration from Tsinghua University in 2013.

BIOGRAPHICAL DETAILS OF DIRECTORS AND SENIOR MANAGEMENT
FOSUN INTERNATIONAL LIMITED Annual Report 2015 71
Pan Donghui, aged 46, is the Vice President of the Company, the President of Fosun TMT & Entertainment Investment Group and the President of Internet and Global Strategy Group. Mr. Pan joined the Group in 1994 and is now also the director of various companies within the Group. For the past twenty more years, he served as project manager of Forte, the chief representative of Hong Kong office, the general manager of Investor Relations Department of the Company and senior assistant to president of Fosun High Technology. Mr. Pan has helped the Group achieve exponential growth and high turnarounds by managing investment in telecom, media and technology, venture capital and secondary market investment, directing investor relations affairs, and leading several large real estate development projects as well as pharmaceutical projects. Mr. Pan has rich experience in effective execution and value creation in respect of LBO and IPOs. Mr. Pan received a bachelor’s degree in 1991 from Shanghai Jiao Tong University and graduated from University of Southern California with a master’s degree in business administration in 2009.
Qian Jiannong, aged 53, is the Vice President of the Company and the President of Fosun Tourism & Commercial Group. Mr. Qian is also a director of Club Med, Grupo Osborne, S.A. and Folli Follie, president of Thomas Cook JV China, co-president managing director of China Momentum Fund, L.P. and the director of other companies within the Group. Mr. Qian joined the Group in 2009 and took the lead of the team in completing a series of investments in Club Med (France), Folli Follie (Greece), Atlantis (PRC), Vigor Kobo (Taiwan), Secret Recipe (Malaysia), CITS (PRC), Osborne (Spain) and Thomas Cook (UK), etc. Mr. Qian was a lecturer of Shanghai University of Finance and Economics, a senior manager of Metro Germany, a vice president of OBI (China), a vice general manager of Wumart Stores, Inc. (listed on the Hong Kong Stock Exchange with stock code: 01025) and the CEO and board member of China NEPSTAR Chain Drugstore Ltd. (China) (listed on the New York Stock Exchange with stock code: NPD). Mr. Qian has more than 20 years of experience in domestic and overseas retail and investment industries. Mr. Qian graduated from Shandong University with a bachelor’s degree in economics in 1983 and obtained master’s degree in the economics in 1992 in University of Essen in Germany.
Wang Can, aged 36, is the Vice President and the Chief Financial Officer (CFO) of the Company. Mr. Wang joined the Group in 2012, and is now also the general manager of Chairman & President Office and Investment Management & Strategy Center and the director of other companies within the Group. He once worked as the general manager of Investment Management Department, deputy CFO and general manager of Financial Planning & Analysis Department of the Group. Prior to joining the Group, Mr. Wang worked in Kingdee Software (China) Co., Ltd., PricewaterhouseCoopers Zhong Tian LLP, Standard Chartered Bank (China) Limited and China Lodging Group, Limited (NASDAQ: HTHT). Mr. Wang is a non-practicing member of Chinese Institute of Certified Public Accountants (CICPA). Mr. Wang graduated from Anhui University in 1997 and received an EMBA degree from China Europe International Business School (CEIBS) in 2014.
Zhang Houlin, aged 47, is the Vice President of the Company, standing Deputy General Manager of Finance Department and General Manager of Treasury Department. Mr. Zhang is also the chairman of Fosun Finance Company and the director of other companies within the Group. Mr. Zhang joined the Group in 2000 and takes comprehensive responsibility of the overall financing management of the Group, including capital strategic planning and capital risk control. Mr. Zhang worked at Agricultural Bank of China, Waigaoqiao branch from December 1993 to October 2000. Mr. Zhang received a bachelor’s degree in history in 1991 and a master’s degree in business administration in1998, both from Fudan University.
COMPANY SECRETARYSze Mei Ming, aged 38, was appointed Company Secretary of the Company in March 2009. Ms. Sze joined the Group in 2007. Ms. Sze holds a bachelor’s degree in Arts from the University of Hong Kong, a bachelor’s degree in laws from the University of London and a master’s degree in Chinese and Comparative Law from the City University of Hong Kong. Ms. Sze has experience in the company secretarial industry for years and is a fellow member of the Institute of Chartered Secretaries and Administrators and The Hong Kong Institute of Chartered Secretaries.

FOSUN INTERNATIONAL LIMITED Annual Report 201572
DIRECTORS’ REPORT
The Board is pleased to present its report and the audited financial statements of the Group for the year ended 31 December 2015.
PRINCIPAL ACTIVITIESThe Group’s principal businesses include integrated finance (wealth) and industrial operations. The integrated finance (wealth) business includes the four major segments: insurance, investment, wealth management and internet finance while the industrial operations include five key segments: health, happiness, steel, property development and sales, and resources.
BUSINESS REVIEW OF THE GROUP IN 2015A fair view of the business of the Group in 2015 and a discussion and analysis of the Group’s performance during the year and the material factors underlying its results and financial position are provided in the sections headed “Business Review” and “Financial Review” under Management Discussion and Analysis in this annual report respectively. Description of the major risks and uncertainties faced by the Group can be found throughout this annual report, particularly in the Directors’ Report on page 86. Particulars of important events affecting the Group that have occurred since the end of the financial year 2015, if any, can also be found in the above mentioned sections and the Notes to the Financial Statements. The outlook of the Group’s business is discussed throughout this annual report including the section headed “Letter to Shareholders”.
RESULTS AND DIVIDENDThe Group’s profit for the year ended 31 December 2015 and the state of affairs of the Group at that date are set out in the financial statements and the accompanying notes on pages 102 to 247.
The Board has recommended the payment of a final dividend of HKD0.17 per Share for the year ended 31 December 2015 to the shareholders of the Company whose names appear on the register of members of the Company on 10 June 2016. Subject to approval by the shareholders of the Company at the annual general meeting of the Company to be held on 1 June 2016 (the “AGM”), the proposed final dividend is expected to be paid on or around 18 July 2016 to the shareholders of the Company.
CLOSURE OF REGISTER OF MEMBERSThe register of members of the Company will be closed from Friday, 27 May 2016 to Wednesday, 1 June 2016, both days inclusive, during which period no transfer of shares will be effected. In order to be eligible to attend and vote at the AGM, all share transfer documents accompanied by the relevant share certificates and other relevant documents, if any, must be lodged with Computershare Hong Kong Investor Services Limited, the share registrar of the Company (the “Share Registrar”), at Shops 1712-1716, 17th Floor, Hopewell Centre, 183 Queen’s Road East, Wanchai, Hong Kong (the “Registrar Address”), for registration no later than 4:30 p.m. on Thursday, 26 May 2016.
The register of members of the Company will also be closed from Tuesday, 7 June 2016 to Friday, 10 June 2016, both days inclusive, during which period no transfer of shares will be effected. In order to qualify for the final dividend to be proposed at the AGM, all share transfer documents accompanied by the relevant share certificates and other relevant documents, if any, must be lodged with the Share Registrar at the Registrar Address for registration no later than 4:30 p.m. on Monday, 6 June 2016.
SUMMARY FINANCIAL INFORMATIONA summary of the financial information for the last five financial years, as extracted from the audited financial statements and restated/reclassified as appropriate, is set out in the section headed “Five-Year Statistics” in this annual report.

DIRECTORS’ REPORT
FOSUN INTERNATIONAL LIMITED Annual Report 2015 73
PROPERTY, PLANT AND EQUIPMENT AND INVESTMENT PROPERTIESDetails of movements in the property, plant and equipment, and investment properties of the Company and the Group during the Reporting Period are set out in notes 13 and 14 to financial statements, respectively.
ISSUED SHARESDetails of movements in the Company’s share during the Reporting Period are set out in note 51 to financial statements.
SUBSIDIARIESThe names of the principal subsidiaries, their principal places of operation, their countries of incorporation and particulars of their issued share capital are set out in note 4 to financial statements.
BORROWINGSParticulars of borrowings of the Group are set out in note 37 to financial statements.
PURCHASE, REDEMPTION OR SALE OF LISTED SECURITIES OF THE COMPANYNeither the Company nor any of its subsidiaries purchased, sold or redeemed any Shares during the Reporting Period.
CONVERTIBLE BONDSOn 22 November 2013, the guaranteed convertible bonds due 2018 in an aggregate principal amount of HKD3,875,000,000, bearing interest at the rate of 1.50% per annum were issued by Logo Star Limited, an indirect wholly-owned subsidiary of the Company, and guaranteed by the Company (“Convertible Bonds”). The Convertible Bonds may be convertible into a maximum of 387,500,000 Shares at the initial conversion price of HKD10.00 per share (subject to adjustment) at any time after the 41st day after 22 November 2013 up to the close of business on the 7th day prior to 22 November 2018 or if such Convertible Bonds shall have been called for redemption by Logo Star Limited before 22 November 2018, then up to the close of business on a date no later than seven business days prior to the date fixed for redemption thereof or if notice requiring redemption has been given by the holder of such Convertible Bonds, then up to the close of business on the day prior to the giving of such notice (“Conversion”).
The issue of the Convertible Bonds provided strong capital support for the development of the Company’s key businesses, enhanced the Company’s market presence and competitiveness, and is expected to strengthen the Company’s capital base effectively after the full conversion of the Convertible Bonds.
The net proceeds from issue of Convertible Bonds, after deduction of commission and expenses, amounted to approximately HKD3,830 million, which has been used for working capital, re-financing and investment.
During the Reporting Period, Convertible Bonds with principal amount of HKD3,506,000,000 was exercised, 350,600,000 Shares were converted at the conversion price of HKD10.00 per share. The remaining Convertible Bonds with principal amount of HKD369,000,000 have not yet been exercised.

DIRECTORS’ REPORT
FOSUN INTERNATIONAL LIMITED Annual Report 201574
SHARE AWARD SCHEMEThe Share Award Scheme was adopted by the Company on 25 March 2015 (the “Share Award Scheme”).
The purposes of the Share Award Scheme are (i) to align the interests of the eligible persons with those of the Group through ownership of Shares, dividends and other distributions paid on Shares and/or the increase in value of the Shares; and (ii) to encourage and retain eligible persons to make contributions to the long-term growth and profits of the Group.
On 26 March 2015, the Board resolved to award an aggregate of 4,620,000 Award Shares (the “Award Shares”) to 71 selected participants under the Share Award Scheme, of which, (i) 2,430,000 Award Shares would be awarded to 52 selected participants by way of issue and allotment of new Shares pursuant to the general mandate; and (ii) 2,190,000 connected Award Shares would be awarded to 19 connected selected participants by way of issue and allotment of new Shares pursuant to the specific mandate. Subject to the satisfaction of the vesting criteria and conditions of the Share Award Scheme, the Award Shares shall be transferred to the selected participants upon expiry of the respective vesting period. As at the end of the Reporting Period, the Award Shares had already been fully issued.
PLACING AND SUBSCRIPTION OF SHARESOn 12 May 2015, the Company entered into a placing and subscription agreement with Fosun Holdings, Morgan Stanley & Co. International plc, UBS AG, Hong Kong Branch, Goldman Sachs (Asia) L.L.C., Citigroup Global Markets Limited, CMB International Capital Limited, Fosun Hani Securities and CLSA Limited (the “Placing Agents”) (the “Agreement”).
Each of the Placing Agents has agreed to act as a placing agent to procure purchasers for (or failing which, to purchase itself, other than with respect to Fosun Hani Securities) the 465,000,000 Shares held by Fosun Holdings at the price of HKD20.00 per placing share pursuant to the Agreement. The Company has also conditionally agreed to allot and issue and Fosun Holdings has also conditionally agreed to subscribe for 465,000,000 new Shares at the price of HKD20.0 per subscription share (the “Subscription Shares”) pursuant to the Agreement. On 12 May 2015, the closing price per Share was HKD20.45 per Share as stated in the Stock Exchange’s daily quotations sheet on such date.
On 20 May 2015, the Company allotted and issued 465,000,000 Subscription Shares to Fosun Holdings pursuant to the Agreement. The Company benefited from the subscription of 465,000,000 Subscription Shares by Fosun Holdings (the “Top-up Subscription”). The Top-up Subscription enlarged the capital base of the Company and enabled the Company to further expand its business and operations. The Top-up Subscription also increased the liquidity of the Shares after the participation of more institutional investors in the Company.
The aggregate gross proceeds and net proceeds from the Top-up Subscription were approximately HKD9,300 million and HKD9,243 million, respectively. As at 31 December 2015, the Company has utilized the net proceeds from the Top-up Subscription (1) approximately HKD4,262 million for repayment of loans and early redemption of USD300,000,000 7.5% senior notes due 2016; (2) approximately HKD4,788 million for investment (including mergers and acquisitions in the insurance industry); and (3) approximately HKD193 million for general operating capital.
RIGHTS ISSUEOn 10 September 2015, the Company proposed to raise proceeds by way of the rights issue of not less than 867,182,273 rights shares and not more than 871,315,073 rights shares on the basis of 56 rights shares for every 500 Shares held by each qualifying shareholder on the record date at the subscription price of HKD13.42 per rights share payable in full on acceptance.
After the completion of the Rights Issue, on 28 October 2015, the number of total issued Shares of Company was enlarged from 7,742,698,871 to 8,609,881,144.

DIRECTORS’ REPORT
FOSUN INTERNATIONAL LIMITED Annual Report 2015 75
The shareholding structure of the Company immediately before and after completion of the Rights Issue was as follows:
Immediately before completion of the Rights Issue
Immediately after completion of the Rights Issue
Shareholder No. of Shares Approximate % No. of Shares Approximate % Fosun Holdings 5,526,271,109 71.37 6,145,213,473 71.37Directors and their close associates (other than Fosun Holdings) 26,674,960 0.34 26,674,960 0.31Public 2,189,752,802 28.29 2,437,992,711 28.32 Total 7,742,698,871 100.00 8,609,881,144 100.00
The net proceeds from the Rights Issue, after deduction of commission and expenses, amounted to approximately HKD11,598 million. As at 31 December 2015, the Company has utilized the net proceeds from the Rights Issue (1) approximately HKD6,725 million for investment (including mergers and acquisitions in the banking and insurance industry); (2) approximately HKD2,441 million for repayment of loans; (3) approximately HKD389 million for general operating capital purpose; and (4) remaining approximately HKD2,043 million will be used for future general corporate purposes of the Company, including mergers and acquisitions in the banking and insurance industry.
SHARE OPTION SCHEMEThe Company adopted its share option scheme on 19 June 2007 (the “Share Option Scheme”). The major terms of the Share Option Scheme are as follows:
1) The purpose of the Share Option Scheme is to provide incentive and/or reward to eligible persons for their contribution to, and continuing efforts to promote the interests of the Group.
2) The participants of the Share Option Scheme are any Director (including independent non-executive Director), employee (whether full- time or part-time), consultant or advisor who in the sole discretion of the Board has contributed or will contribute to the Group.
3) The overall limit on the number of Shares which may be issued upon exercise of all outstanding options granted and yet to be exercised under the Share Option Scheme and any other schemes must not exceed 30% (or other percentage as stipulated in the Listing Rules) of the Shares in issue from time to time. Subject to the aforesaid limit, the total number of Shares available for issue under options which may be granted under the Share Option Scheme and any other schemes must not, in aggregate, exceed 643,750,000 Shares, being 10% of the issued Shares of the Company, the date of listing of the Shares, unless separate shareholders’ approval has been obtained. The total of 643,750,000 Shares available for issue under the Share Option Scheme representing approximately 7.48% of the issued Shares as at the date of this annual report.
4) The maximum entitlement of each participant under the Share Option Scheme is 1% of the issued Shares of the Company unless such grant has been duly approved by resolution of the shareholders of the Company in general meeting.
5) The exercise period of any option granted under the Share Option Scheme must not be more than 10 years commencing on the date of grant.
6) The acceptance amount for the option is determined by the Board from time to time.
7) The exercise price determined by the Board shall be at least the highest of (i) the closing price of the Shares as stated in the Hong Kong Stock Exchange’s daily quotations sheet on the date of grant, which must be a business day; (ii) the average of the closing price of the Shares as stated in the Hong Kong Stock Exchange’s daily quotations sheet for the five business days immediately preceding the date of grant; and (iii) the nominal value of a share.
8) Subject to earlier termination by the Company in a general meeting or by the Board, the Share Option Scheme shall be valid and effective for a period to be determined and notified by the Board to the grantee during which the option may be exercised and in any event shall not be more than 10 years commencing on the date on which the offer in relation to such option is deemed to have been accepted in accordance with the terms of the Share Option Scheme and expiring on the last day of the ten-year-period.

DIRECTORS’ REPORT
FOSUN INTERNATIONAL LIMITED Annual Report 201576
During the Reporting Period, no share option has been granted by the Company.
On 8 January 2016, the Board announced that, subject to the acceptance of the relevant Grantees (as defined below), the Company has decided to grant 111,000,000 share options to subscribe for an aggregate of 111,000,000 Shares to its first 18 global core management staff (the “Grantees”) under the Share Option Scheme. Among the 111,000,000 share options, the Company has granted an aggregate of 40,000,000 share options to the Directors (namely, the grant of 10,000,000 share options to each of Mr. Ding Guoqi, Mr. Qin Xuetang, Mr. Chen Qiyu and Mr. Xu Xiaoliang).
SISRAM MEDICAL PLANThe shareholders of the Company and Fosun Pharma approved the adoption of the Sisram Medical Plan on 28 May 2015 and 29 June 2015 respectively (the relevant details of the Sisram Medical Plan under the following paragraphs are set out in the circular of the Company dated 24 April 2015 (“Circular”), unless otherwise defined, the capitialized terms set out herein shall have the same meaning as set out in the Circular). The purpose of Sisram Medical Plan is to enhance the management participation in Alam Lasers, which is important that they would be offered an opportunity to obtain ownership interest in Sisram Medical and to enjoy the results of Sisram Medical attained through their efforts and contributions. The persons eligible for participation in the Sisram Medical Plan shall include any Sisram Employees and/or Non-Sisram Employees of Sisram Medical or any of its Associates, and the basis for their eligibility shall be determined by the Sisram Board based on such Sisram Participant’s contribution or potential contribution to the development and growth of Sisram Medical.
The total number of Sisram Shares which may be issued upon exercise of all options to be granted under the Sisram Medical Plan is 106,500 Sisram Shares, representing approximately 14.49% of the issued share capital at the date of the 2015 Annual Report. Subject to adjustment from time to time pursuant to the terms of the Sisram Medical Plan, a maximum of 100,000 Sisram Shares, representing approximately 13.61% of Sisram Medical’s issue share capital as at the date of the 2015 Annual Report, shall be available for issuance under the Sisram Medical Plan.
The maximum number of Sisram Shares issued and to be issued upon the exercise of the Awards granted under the Sisram Medical Plan and any other share option schemes of Sisram Medical to the participation in the Sisram Medical Plan (including both exercised and outstanding Awards), in any twelve-month period up to the date of grant shall not exceed 1% of the number of Sisram Shares in issue as at the date of grant unless (i) the issue of a circular by Fosun Pharma and Fosun International containing such particulars as may be required by the Hong Kong Listing Rules from time to time is dispatched to their respective shareholders; (ii) the shareholders of Fosun Pharma and Fosun International approve the grant of the Awards in excess of the 1% limit referred to in the Sisram Medical Plan; and (iii) the relevant Sisram Participant and its associates shall abstain from voting.
Unless determined otherwise in the relevant Award Agreement, with respect to any, some or all Sisram Options, each Sisram Option shall vest and become exercisable over a four-year period from its Date of Grant, such that one-sixteenth of such Sisram Shares shall vest at the end of each three-month period, on each anniversary of the Date of Grant, commencing on the first anniversary, provided that the Sisram Participant remains continuously employed by or in the service of Sisram Medical or its Affiliate during the relevant year.
During the Reporting Period, no Sisram Option has been granted under the Sisram Medical Plan. The Sisram Medical Plan shall terminate at the end of ten years from its day of adoption, unless terminated earlier in accordance with the terms of the Sisram Medical Plan. The Purchase Price of each Sisram Share subject to a Sisram Option shall be determined by the Sisram Board or the Committee at its sole and absolute discretion in accordance with Applicable Law, and shall not be less than the Fair Market Value of Sisram Shares on the date of grant. If such authority is delegated by the Sisram Board to the Committee in compliance with the then effective Applicable Law, it shall be subject to any guidelines as may be determined by the Sisram Board from time to time. No consideration is payable to Sisram Medical upon acceptance of the Sisram Option in accordance with the terms of the Sisram Medical Plan.
RESERVES AND DISTRIBUTABLE RESERVESDetails of movements in the reserves of the Group during the Reporting Period are set out in the Consolidated Statement of Changes in Equity on pages 107 to 108 of this annual report and details of movements in the reserves of the Company during the Reporting Period are set out in note 52 to financial statements.
On 31 December 2015, the Company’s reserves available for distribution, calculated in accordance with the provisions of Part 6 of the Hong Kong Companies Ordinance (Cap. 622), amounted to RMB1,666,787,000, of which RMB1,226,242,000 has been proposed as a final dividend for the year.

DIRECTORS’ REPORT
FOSUN INTERNATIONAL LIMITED Annual Report 2015 77
MAJOR CUSTOMERS AND SUPPLIERSDuring the Reporting Period, the Group’s five largest suppliers contributed less than 30% of the total purchases and the Group’s five largest customers contributed less than 30% of the total sales.
During the Reporting Period, none of the Directors or any of their close associates or any shareholders (which to the knowledge of the Directors own more than 5% of the Company’s issued shares) had any beneficial interests in the Group’s five largest customers or suppliers.
DIRECTORSThe Directors during the Reporting Period were:
Executive DirectorsMr. Guo Guangchang (Chairman)Mr. Liang Xinjun (Vice Chairman and Chief Executive Officer)Mr. Wang Qunbin (President)Mr. Ding GuoqiMr. Qin XuetangMr. Chen Qiyu (appointed on 10 July 2015)Mr. Xu Xiaoliang (appointed on 10 July 2015)
Independent Non-executive DirectorsMr. Zhang ShengmanMr. Zhang HuaqiaoMr. David T. ZhangMr. Yang Chao
The former executive Director, Mr. Wu Ping resigned on 10 July 2015.
The former non-executive Director, Mr. Fan Wei resigned on 10 July 2015.
According to Articles 106 and 107 of the Articles of Association, Mr. Guo Guangchang, Mr. Qin Xuetang and Mr. Zhang Shengman shall retire by rotation at the AGM. All of the above three retiring Directors, being eligible, will offer themselves for re-election at the same meeting.
Pursuant to A.4.3 of the CG Code, it is, inter alia, stated that if an independent non-executive director serves more than 9 years, his further appointment should be subject to a separate resolution to be approved by the shareholders. As at the date of this report, one of the retiring Directors, Mr. Zhang Shengman, has served the Company as an independent non-executive Director for more than nine years since 1 December 2006. Accordingly, a separate resolution will be put forward at the AGM for re-electing Mr. Zhang as an independent non-executive Director.
The Board appointed Mr. Chen Qiyu and Mr. Xu Xiaoliang as the executive Directors in July 2015 and the appointment came into effect on 10 July 2015. According to article 111 of the Articles of Association, Mr. Chen Qiyu and Mr. Xu Xiaoliang shall retire at the AGM and shall be eligible for re-election.
The Company has received annual confirmation of independence from all independent non-executive Directors, and as at the date of this report considers all of them to be independent.
DIRECTORS OF SUBSIDIARIESAs at 31 December 2015, the name of all the directors who serve the subsidiaries of the Company or act as the sole director of subsidiaries of the Company are published on our Company’s website.
DIRECTORS’ AND SENIOR MANAGEMENT’S BIOGRAPHIESBiographical details of the Directors and the senior management of the Group are set out on pages 66 to 71 of this annual report.

DIRECTORS’ REPORT
FOSUN INTERNATIONAL LIMITED Annual Report 201578
DIRECTORS’ LIABILITY INSURANCEThe Company has arranged the directors and officers liability insurance in respect of legal action against the directors, the insured clause and scope of coverage of year 2015/2016 have been reviewed and renewed.
DIRECTORS’ SERVICE CONTRACTSMr. Chen Qiyu and Mr. Xu Xiaoliang were appointed as executive Directors on 10 July 2015 and have entered into service contracts with the Company for a term of 3 years from the date of their appointment. Mr. Yang Chao was appointed as independent non-executive Director on 23 December 2014 and has entered into service contract with the Company for a term of 3 years from the date of his appointment. Other Directors have entered into service contracts with the Company for a term of 3 years from 23 June 2014.
None of the Directors has entered into any service contract with the Company which is not determinable by the Company within one year without payment of compensation, other than statutory compensation.
DIRECTORS AND SENIOR MANAGEMENT REMUNERATIONThe Remuneration Committee of the Company considers and recommends to the Board the remuneration and other benefits paid by the Company to the Directors. The remuneration of all Directors is subject to regular monitoring by the Remuneration Committee to ensure that the levels of their remuneration and compensation are appropriate. References to the remuneration standards of the industry as well as the business development of the Company are made to ensure the level of remuneration should be sufficient to attract and retain the Directors, and the Company should avoid paying more than necessary for this purpose.
Details of the Directors and senior management remuneration are set out in note 9 to financial statements.
CHANGES IN DIRECTORS’ INFORMATIONPursuant to Rule 13.51B of the Listing Rules, the changes in the information of the Directors subsequent to the date of 2015 interim report are set out below:
(1) CHANGES IN THE MAJOR POSITIONS HELD WITHIN THE GROUP
Name of Director Date of changes Original position Current position Chen Qiyu 10 July 2015 vice president of Fosun High Technology director and vice president of Fosun
High TechnologyXu Xiaoliang 10 July 2015 vice president of Fosun High Technology director and vice president of Fosun
High TechnologyDing Guoqi 3 November 2015 director, senior vice president and chief
financial officer of Fosun High Technologydirector and senior vice president of Fosun High Technology
Qin Xuetang 10 July 2015 director and senior vice president of Fosun High Technology
consultant of Fosun High Technology
(2) CHANGES IN OTHER DIRECTORSHIPS HELD IN PUBLIC COMPANIES THE SECURITIES OF WHICH ARE LISTED ON ANY SECURITIES MARKET IN HONG KONG OR OVERSEAS AND OTHER MAJOR APPOINTMENTS
Name of Director Date of changes Original position Current position Chen Qiyu 1 September 2015 — director of Beijing Sanyuan
Foods Co., Ltd. (Stock Code: 600429.SH)
25 September 2015 — director of Maxigen Biotech Inc.Yang Chao 1 January 2016 independent non-executive director of
SRE Group Limited (Stock Code: 1207.HK)—

DIRECTORS’ REPORT
FOSUN INTERNATIONAL LIMITED Annual Report 2015 79
DIRECTORS’ INTERESTS IN CONTRACTSNo Director had a material interest, either directly or indirectly, in any contract of significance to the business of the Group to which the Company, its holding company, or any of its subsidiaries or fellow subsidiaries was a party during the Reporting Period.
DIRECTORS’ INTERESTS IN COMPETING BUSINESSAs at 31 December 2015, none of the Directors nor their respective associates had an interest in a business which competes or is likely to compete, either directly or indirectly, with the business of the Group pursuant to the Listing Rules.
INTERESTS AND SHORT POSITIONS OF DIRECTORS AND CHIEF EXECUTIVE IN SHARES, UNDERLYING SHARES AND DEBENTURESAs at 31 December 2015, the interests or short positions of the Directors or chief executive of the Company in the shares, underlying shares or debentures of the Company or any associated corporations (within the meaning of Part XV of the SFO) as recorded in the register required to be kept under section 352 of the SFO or as otherwise notified to the Company and the Hong Kong Stock Exchange pursuant to the Model Code were as follows:
(1) Long positions in the Shares, underlying shares and debentures of the Company
ApproximateType of percentage of
Name of Director/chief executive Class of Shares Number of Shares interests Shares in issue Guo Guangchang Ordinary 6,145,213,473(1) Corporate 71.37%Ding Guoqi Ordinary 14,259,320 Individual 0.17%Qin Xuetang Ordinary 4,472,640 Individual 0.05%Chen Qiyu Ordinary 4,023,000 Individual 0.05%Xu Xiaoliang Ordinary 190,000 Individual 0.00%Zhang Shengman Ordinary 160,000 Individual 0.00%Zhang Huaqiao Ordinary 10,000 Individual 0.00%David T. Zhang Ordinary 10,000 Individual 0.00%
(2) Long positions in the shares, underlying shares and debentures of the Company’s associated corporations (within the meaning of Part XV of the SFO)
Name of Director/chief executive
Name of associated corporation Class of shares Number of shares Type of interests
Approximate percentage of
shares in issue Guo Guangchang Fosun Holdings Ordinary 1 Corporate 100.00%
Fosun International Holdings Ordinary 32,225 Individual 64.45%Fosun Pharma A Shares (2) 114,075 Individual 0.01%
920,641,314 Corporate 48.18%Liang Xinjun Fosun International Holdings Ordinary 12,220 Individual 24.44%Wang Qunbin Fosun International Holdings Ordinary 5,555 Individual 11.11%
Fosun Pharma A Shares (2) 114,075 Individual 0.01%Qin Xuetang Fosun Pharma A Shares (2) 114,075 Individual 0.01%Chen Qiyu Fosun Pharma A Shares (2) 114,075 Individual 0.01%
Notes:
(1) Pursuant to Division 7 of Part XV of the SFO, 6,145,213,473 Shares held by Mr. Guo Guangchang are deemed corporate interests held through Fosun Holdings and Fosun International Holdings.
(2) A Shares mean the equity securities listed on the SSE.

DIRECTORS’ REPORT
FOSUN INTERNATIONAL LIMITED Annual Report 201580
INTERESTS AND SHORT POSITIONS OF SUBSTANTIAL SHAREHOLDERS IN SHARES AND UNDERLYING SHARESAs at 31 December 2015, so far as was known to the Directors, the persons or entities, other than a Director or chief executive of the Company, who had an interest or a short position in the Shares or the underlying shares of the Company which would fall to be disclosed to the Company under the provisions of Divisions 2 and 3 of Part XV of the SFO or which were recorded in the register required to be kept by the Company under section 336 of the SFO were as follows:
Name of the substantial shareholder
Number of Shares
directly or indirectly held
Approximate percentage of
Shares in issue Fosun Holdings 6,145,213,473(2) 71.37%Fosun International Holdings (1) 6,145,213,473(2) (3) 71.37%
Notes:
(1) Fosun International Holdings is owned as to 64.45%, 24.44% and 11.11% by Messrs. Guo Guangchang, Liang Xinjun and Wang Qunbin, respectively.
(2) Fosun International Holdings is the beneficial owner of all the issued shares in Fosun Holdings and, therefore, Fosun International Holdings is deemed, or taken to be interested in the Shares owned by Fosun Holdings for the purpose of the SFO.
(3) Mr. Guo Guangchang is the sole director of Fosun Holdings and Fosun International Holdings. Mr. Guo, by virtue of his ownership of shares in Fosun International Holdings as to 64.45%, is deemed or taken to be interested in the Shares owned by Fosun Holdings for the purpose of the SFO.
Save as disclosed above, so far as was known to the Directors, as at 31 December 2015, the Company has not been notified by any persons (other than a Director or chief executive of the Company) who had an interest or a short position in the Shares or the underlying shares of the Company which would fall to be disclosed to the Company under the provisions of Divisions 2 and 3 of Part XV of the SFO or which were recorded in the register required to be kept by the Company under Section 336 of the SFO.
CONTROLLING SHAREHOLDERS’ INTERESTS IN CONTRACTS OF SIGNIFICANCENo contracts of significance were entered into between the Company or any of its subsidiaries and any controlling shareholders or any of its subsidiaries during the Reporting Period.
SUFFICIENCY OF PUBLIC FLOATBased on the information that is publicly available to the Company and within the knowledge of the Directors as at the date of this annual report, the Company has maintained the prescribed public float under the Listing Rules during the Reporting Period.

DIRECTORS’ REPORT
FOSUN INTERNATIONAL LIMITED Annual Report 2015 81
CONNECTED TRANSACTIONSFor the year ended 31 December 2015, the Company entered into the following connected transactions:
1. On 25 March 2015, the Board adopted the Share Award Scheme with immediate effect. The Board has, on 26 March 2015, resolved to award an aggregate of 4,620,000 Award Shares to 71 selected participants under the Share Award Scheme (the “2015 Award”), of which 2,190,000 connected Award Shares would be awarded to 19 connected selected participants (the “Connected Selected Participants”) by way of issue and allotment of new Shares pursuant to a specific mandate. The Board considers that the award of the Award Shares to the selected participants, including the Connected Selected Participants, under the 2015 Award provides incentives to such selected participants and will allow the Group to attract, retain and motivate talents for the continual operation and development of the Group. As the Connected Selected Participants are Directors and directors of significant subsidiaries of the Company, the Connected Selected Participants are therefore connected persons of the Company. Hence, the issue and allotment of 2,190,000 connected Award Shares to the Connected Selected Participants under the Share Award Scheme constituted a connected transaction of the Company and was subject to the independent shareholders’ approval other than the Connected Selected Participants and their respective associates under Chapter 14A of the Listing Rules at the annual general meeting of the Company held on 28 May 2015. Further details about the Share Award Scheme are set out in the section headed “Share Award Scheme” under the Directors’ Report in this annual report, announcement of the Company dated 26 March 2015 and circular of the Company dated 24 April 2015.
2. On 17 September 2015, as the relevant approval by the China Banking Regulatory Commission Shanghai Bureau has been obtained, Fosun Pharma, Fosun High Technology, Nanjing Iron & Steel United Co., Ltd., Yuyuan and Fosun Finance Company entered into the capital increase agreement (the “New Capital Increase Agreement”) pursuant to which the parties shall make capital contribution involving a total amount of approximately RMB1,440 million, in the amount of RMB327.60 million, RMB892.80 million, RMB129.60 million and RMB90 million, respectively, to Fosun Finance Company. Upon completion of the transaction contemplated under the New Capital Increase Agreement, the registered capital of Fosun Finance Company will be increased from RMB300 million to RMB1,500 million. The Board considers that the entering into of the New Capital Increase Agreement and the increase of capital contribution to Fosun Finance Company will enhance the development of Fosun Finance Company and allow Fosun Finance Company to further expand its business, and the transaction with Fosun Finance Company can help optimize the Group’s financial management and improve its capital efficiency, reduce financing costs and financing risks. As Yuyuan is a connected person of the Company at the subsidiary level by virtue of it being a substantial shareholder of a significant subsidiary of the Company, Yuyuan is therefore a connected person of the Company. Hence, the transaction contemplated under the New Capital Increase Agreement constituted a connected transaction of the Company. As one of the applicable percentage ratios for the capital contribution by the Company and its subsidiaries under the New Capital Increase Agreement was more than 1% but less than 5%, such capital contribution was subject to the reporting, announcement and annual review requirements but exempted from the independent shareholders’ approval requirement under Chapter 14A of the Listing Rules. Further details are set out in the joint announcement of the Company and Fosun Pharma dated 17 September 2015.
DISCLOSEABLE TRANSACTIONSFor the year ended 31 December 2015, the Company entered into the following discloseable transactions:
1. On 12 February 2015, Autorité des marchés financiers (“AMF”) declared that Club Med Invest (formerly known as Gaillon Invest II, a wholly-owned subsidiary of Club Med Holding (formerly known as Holding Gaillon II) which is an indirect subsidiary of the Company) is in a position to hold in concert 33,400,691 shares representing 92.81% of the share capital and at least 91.57% of the voting rights of Club Med and 1,384,601 bonds issued by Club Med convertible and/or exchangeable into new or existing shares of Club Med (the “OCEANEs”) representing 98.64% of the outstanding OCEANEs issued by Club Med consequently to the Improved Offer (as defined in the announcement of the Company dated 19 December 2014) launched by Club Med Invest and that such Improved Offer is successful. On 5 March 2015 (Paris time), the re-opening of the Improved Offer following a timetable set by AMF has expired, and AMF has declared on 10 March 2015 (Paris time) that 1,054,155 shares and 4,782 OCEANEs of Club Med have been tendered during the re-opening period. As a result, Club Med Invest is in a position to hold in concert 36,478,795 shares representing 98.29% of the share capital and at least 96.40% of the voting rights of Club Med, and 4,782 OCEANEs representing 25% of the outstanding OCEANEs issued by Club Med. As a consequence, Club Med Invest holds more than 95% of the share capital and voting rights of Club Med and intends to implement a squeeze-out procedure pursuant to the AMF general regulations. Further details are set out in the announcements of the Company dated 12 September 2014, 1 December 2014, 19 December 2014, 12 February 2015 and 11 March 2015.

DIRECTORS’ REPORT
FOSUN INTERNATIONAL LIMITED Annual Report 201582
2. On 12 February 2015 (U.S. time), Mettlesome Investments Limited (an indirect wholly-owned subsidiary of the Company), as the purchaser, has completed the acquisition of 20% of the total outstanding ordinary shares of Ironshore on a fully diluted basis. On 1 May 2015 (U.S. time), the Company, Mettlesome Investments (Cayman) III Limited (an indirect wholly-owned subsidiary of the Company), as the purchaser, Mettlesome Investment 2 (an indirect wholly-owned subsidiary of the Company), as the merger sub (the “Merger Sub”) and IS Equityholder Rep, LLC, as the equityholder representative entered into the merger agreement with Ironshore (the “Merger Agreement”), pursuant to which the Company has agreed to acquire all of the interests in Ironshore that the Company does not already own. On 20 November 2015 (U.S. time), the Company has completed the acquisition of all of the interests in Ironshore by way of merger pursuant to the Merger Agreement. As such, the Merger Sub has been merged with and into Ironshore with Ironshore continuing as the surviving company and Ironshore becomes an indirect wholly-owned subsidiary of the Company. Further details are set out in the announcements of the Company dated 18 August 2014, 12 February 2015, 3 May 2015 and 23 November 2015.
3. On 23 March 2015, each of Fidelidade and Billion Infinity, each being an indirect non wholly-owned subsidiary of the Company, entered into the Fidelidade Share Purchase Agreement and the Billion Infinity Share Purchase Agreement (collectively, the “SPAs”), respectively, pursuant to which (i) Fidelidade agreed to purchase and the Fidelidade Sellers (as defined in the announcement of the Company dated 23 March 2015) agreed to sell to Fidelidade 8,879,157 ordinary shares of BHF KB represented by restricted depositary shares (the “Fidelidade Subject Shares”) at a price of EUR4.9 per share for a consideration of EUR43,507,869.3 and (ii) Billion Infinity agreed to purchase and the Billion Infinity Sellers (as defined in the announcement of the Company dated 23 March 2015) agreed to sell to Billion Infinity 3,191,099 ordinary shares of BHF KB represented by restricted depositary shares at a price of EUR4.9 per share for a consideration of EUR15,636,385.1 (the “Acquisition”). The total consideration for the Acquisition is EUR59,144,254.4 and the completion of the Acquisition is conditional upon the satisfaction (or waiver) of the conditions precedent respectively under the SPAs on or before 20 October 2015 (the “Original Long Stop Date”). Since more time is required to satisfy the conditions precedent under the SPAs in respect of the necessary approvals and consents from all relevant banking regulatory authorities, an amendment agreement to the Fidelidade Share Purchase Agreement (the “Fidelidade Amendment Agreement”) and an amended and restated agreement in respect of the Billion Infinity Share Purchase Agreement (the “Amended and Restated Billion Infinity SPA”) were executed respectively by the original parties to the Fidelidade Share Purchase Agreement and the Billion Infinity Share Purchase Agreement on 20 October 2015 pursuant to which the parties thereunder mutually agreed to extend the Original Long Stop Date. The parties under the Fidelidade Share Purchase Agreement will not sell the Fidelidade Subject Shares (or the restricted depositary shares representing the Fidelidade Subject Shares) to the market or third parties (as identified by Fidelidade) for a price and other terms reasonably acceptable to Fidelidade following the expiry of the Original Long Stop Date for the time being. Instead, pursuant to the Fidelidade Amendment Agreement, the Original Long Stop Date under the Fidelidade Share Purchase Agreement shall be initially extended for two months to 20 December 2015 (“Fidelidade Long Stop Date”). In addition, Fidelidade has the option to further extend the Fidelidade Long Stop Date twice, each time with a written notice to Timothy C. Collins (on behalf of the Fidelidade Sellers) for an extension of another five months. Pursuant to the Amended and Restated Billion Infinity SPA, the Original Long Stop Date under the Billion Infinity Share Purchase Agreement shall be extended for twelve months to 20 October 2016. On 19 January 2016, the proposed acquisition of equity interest in BHF KB by Billion Infinity and Fidelidade was completed. Billion Infinity and Fidelidade each holds 26,276,577 shares and 11,562,403 shares in BHF KB respectively, representing approximately 19.87% and 8.74% of the total issued share capital of BHF KB. The Company therefore indirectly holds 37,838,980 shares in BHF KB, representing approximately 28.61% of the total issued share capital of BHF KB. Further details are set out in the announcements of the Company dated 23 March 2015, 21 October 2015 and 26 January 2016.
4. On 16 April 2015, the board of directors of Fosun Pharma proposed to issue a total of up to 246,808,510 of its new A shares at the subscription price of RMB23.50 per new A share to China Life Insurance Company Limited, China Merchants Wealth Asset Management Co., Ltd., Taikang Asset Management Co., Ltd., China Fund Management Co., Ltd., China Universal Asset Management Company Limited, Anhui Railway Construction Investment Fund Co., Ltd., Beijing Zhongrong Dingxin Investment Management Co., Ltd. and Elion Resources Holding Co. Ltd., all of which are independent third parties (the “Subscribers”) (the “Proposed Non-Public Issuance”) and entered into the subscription agreement between Fosun Pharma and each of the Subscribers in respect of the Proposed Non-Public Issuance (the “Subscription Agreement”). The maximum amount of gross proceeds to be raised from the Proposed Non-Public Issuance will amount to RMB5,799,999,985. The Subscription Agreements entered into by Fosun Pharma in respect of the Proposed Non-Public Issuance are subject to satisfaction of the conditions precedent as set out in the relevant announcement. On the basis that the gross proceeds raised under the Proposed Non-Public Issuance will not be more than RMB5,799,999,985 and the number of new A shares to be issued by Fosun Pharma will not be more than 246,808,510 shares, the equity interest in Fosun Pharma held by the Company (through Fosun High Technology) will be diluted up to 35.99% from 39.83% of the total issued share capital of Fosun Pharma. As the Company expects to continue to have control over Fosun Pharma, Fosun Pharma will continue to be accounted for as a subsidiary of the

DIRECTORS’ REPORT
FOSUN INTERNATIONAL LIMITED Annual Report 2015 83
Company in accordance with the prevailing accounting standards under the Hong Kong Financial Reporting Standards (“HKFRS”) and its operating results will continue to be consolidated in the financial statements of the Company upon completion of the Proposed Non-Public Issuance. Further details are set out in the announcement of the Company dated 17 April 2015. For further amendments in relation to the transaction, please refer to the announcements of Fosun Pharma on the SSE time to time.
5. On 5 July 2015 (Germany time), Fosun Industrial Holdings Limited (a direct wholly-owned subsidiary of the Company) entered into a non-public takeover offer (cash offer) pursuant to which Fosun Industrial Holdings Limited has offered to acquire all of the registered no-par value ordinary shares of H&A (the “Target Shares”) (the “Offer”), which has been accepted by a number of shareholders which hold more than 80% of the registered no-par value ordinary shares in H&A as of 7 July 2015 (Germany time). Subject to how many of the other H&A shareholders accept the Offer, the maximum amount of the purchase price for the Target Shares (if all of the H&A shareholders accept the Offer) shall be EUR210,000,000. The acquisition of the Target Shares pursuant to the Offer is subject to customary closing conditions, including receipt of certain regulatory approvals in Germany, Luxembourg, Switzerland and Liechtenstein. Further details are set out in the announcement of the Company dated 7 July 2015.
6. On 7 July 2015 (US time), all conditions precedent set out in the agreement and plan of merger dated 30 December 2014 (U.S. time) entered by and among the Miracle Nova II (US), LLC (the “Merger Parent”), an indirect wholly-owned subsidiary of the Company, Miracle Nova III (US), Inc., a wholly-owned subsidiary of the Merger Parent, and MIG in relation to the acquisition of MIG by way of merger (the “Acquisition”) have been satisfied, and the Acquisition has been completed on 7 July 2015 (U.S. time). In connection with the Acquisition, each issued and outstanding share of common stock, par value USD0.01 per share of MIG will be delisted and cease trading on the New York Stock Exchange as of the close of trading on 7 July 2015 (U.S. time). After the completion, MIG becomes a wholly-owned subsidiary of the Company. Further details are set out in the announcements of the Company dated 31 December 2014 and 8 July 2015.
7. On 24 July 2015, Billion Eastgate (Luxembourg) S.à r.l. (“Billion Eastgate” or “Offeror”, an indirect wholly-owned subsidiary of the Company), submitted an offer notice to the Belgian Financial Services and Markets Authority (“FSMA”) under the Takeovers Decree in Belgium in relation to its proposed voluntary and conditional public takeover offer in cash for all of the outstanding shares (including treasury shares) with Coupon number 1 issued by BHF KB (the “Target Shares”), at an offer price of EUR5.1 per Target Share (the “Original Bid”) but not held by the Offeror and its affiliates or otherwise economically transferred to the Offerror or its affiliates. On 27 November 2015 (as corrected on 2 December 2015), Oddo et Cie (“Oddo”, a company incorporated under the laws of France, which is an existing shareholder of BHF KB) also announced a bid in cash over all shares not yet held or ultimately controlled by Oddo issued by BHF KB, offering an acquisition price of EUR5.75 per share of BHF KB (the “Oddo’s Offer”). The Company has decided to withdraw the Original Bid and, on 18 December 2015 (Brussels time), Billion Eastgate submitted to the FSMA a written notice to withdraw the Original Bid. On 26 January 2016, the Company contemplated to dispose of its entire holding of 37,838,980 shares in BHF KB through the acceptance of Oddo’s Offer by Fidelidade and Billion Infinity, at the price of EUR5.75 per share of BHF KB (the “Oddo Transaction”). The Oddo Transaction was completed on 23 February 2016, as a result of which the Company no longer holds, either directly or indirectly, any share in BHF KB. Further details are set out in the announcements of the Company dated 24 July 2015, 20 December 2015, 26 January 2016 and 23 February 2016.
8. On 23 September 2015, Zhejiang Fosun Commerce Development Limited (“Zhejiang Fosun”, an indirect wholly-owned subsidiary of the Company) and Shanghai Haizhimen Property Investment Management Co., Ltd. (“Haizhimen”) entered into the equity transfer agreement, pursuant to which, Haizhimen agreed to sell and transfer and Zhejiang Fosun agreed to purchase and receive the 100% equity interest held by Haizhimen in Shanghai Zendai Bund International Finance Services Centre Real Estate Company Limited (“Shanghai Bund Real Estate”) at a consideration of RMB8,493,000,000 (the “Acquisition”). Upon the completion of the Acquisition, the Shanghai Bund Real Estate will become a wholly-owned subsidiary of Zhejiang Fosun and an indirect wholly-owned subsidiary of the Company. Further details are set out in the announcements of the Company dated 27 April 2010, 28 June 2010, 2 November 2011 and 23 September 2015.

DIRECTORS’ REPORT
FOSUN INTERNATIONAL LIMITED Annual Report 201584
MAJOR TRANSACTIONFor the year ended 31 December 2015, the Company entered into the following major transactions:
1. On 21 June 2015 (Israel time), PI Emerald II (UK) Limited (“PI Emerald II”) (an indirect wholly-owned subsidiary of the Company) and Delek Group Ltd. entered into the share purchase agreement, pursuant to which PI Emerald II has agreed to acquire 130,623,262 ordinary shares of Phoenix Holdings, representing 52.31% of the issued and outstanding share capital of Phoenix Holdings. Subject to certain agreed adjustments, the purchase price for the 130,623,262 ordinary shares of Phoenix Holdings issued at a par value of NIS1 per share shall be NIS1,763,204,090 (approximately RMB2,854,451,101), together with interest accrued on such amount at 4.75% per annum for the period from 30 September 2014 to the closing date. As a result, the maximum amount of consideration payable is expected to be not more than approximately NIS1,868,066,426 (approximately RMB3,024,212,737). On 16 February 2016, PI Emerald II and Delek Group Ltd. have agreed to terminate immediately the share purchase agreement. Further details are set out in the announcements of the Company dated 21 June 2015, 22 October 2015 and 16 February 2016, and the circular of the Company dated 31 December 2015.
2. On 31 December 2015, Fosun Industrial Development (the shareholder of Nanjing Nangang), executed a proxy (the “Proxy”) to appoint Nanjing Iron & Steel Group as its proxy in respect of all the shares held by Fosun Industrial Development in Nanjing Nangang (the “Delegation”). Nanjing Nangang is a 60% indirectly owned subsidiary of the Company (30% owned by Fosun High Technology, 20% owned by Shanghai Fosun Industrial Investment Co., Ltd. (a wholly-owned subsidiary of Fosun High Technology), 10% owned by Fosun Industrial Development). Upon the execution of the Proxy, the Company will be deemed to be indirectly interested in 50% of the voting rights while Nanjing Iron & Steel Group will be deemed to be interested in 50% of the voting rights of Nanjing Nangang. As such, Nanjing Nangang will cease to be accounted for as a subsidiary of the Company in accordance with the prevailing accounting standards under the HKFRS and its operating results will no longer be consolidated in the financial statements of the Company. As prior to the grant of Proxy, Nanjing Nangang is a subsidiary of the Company and Nanjing Iron & Steel Group is a substantial shareholder of Nanjing Nangang, Nanjing Iron & Steel Group is a connected person of the Company and the Delegation also constitutes a connected transaction of the Company under Chapter 14A of the Listing Rules. The Directors believe that the grant of the Proxy to Nanjing Iron & Steel Group at nil consideration is expected to achieve a win-win situation to both the Group and Nanjing Iron & Steel Group whereby, among other things, the Group’s management can focus on its core business. The Company will account for its interest in Nanjing Nangang as an interest in a joint venture. Further details are set out in the announcement of the Company dated 31 December 2015.
NON-COMPETITION UNDERTAKINGAs disclosed in the prospectus of the Company, the independent non-executive Directors will review all the matters, if any, relating to the enforcement of the deed of non-competition undertaking dated 26 June 2007 (the “Deed of Non-competition Undertaking”). During the Reporting Period, the independent non-executive Directors have reviewed matters relating to the enforcement of the Deed of Non-competition Undertaking. Fosun International Holdings, Fosun Holdings, Mr. Guo Guangchang, Mr. Liang Xinjun, Mr. Wang Qunbin and Mr. Fan Wei* (the “Controlling Shareholders”) have provided the Company with an annual declaration of compliance with the provisions of the Deed of Non-competition Undertaking.
During the Reporting Period, the Controlling Shareholders provided the Company with all information necessary for the enforcement of the Company’s rights under the Deed of Non-competition Undertaking, all information reasonably requested by the Company from time to time relating to Excluded Businesses (as defined in the Deed of Non-competition Undertaking) and such other business opportunities or activities related to any business of the Group as the Company reasonably believed were available to the Controlling Shareholders or that the Controlling Shareholders may be planning to participate in, as well as access to appropriate staff members of the Controlling Shareholders to discuss and obtain such information, in order to enable the Company to consider whether to exercise any of its rights under the Deed of Non-competition Undertaking.
*Mr. Fan Wei ceased as Controlling Shareholder with effect from 4 September 2015.

DIRECTORS’ REPORT
FOSUN INTERNATIONAL LIMITED Annual Report 2015 85
RELATED PARTY TRANSACTIONSRelated party transactions entered by the Group during the Reporting Period are disclosed in note 59 to financial statements.
EVENTS AFTER THE REPORTING PERIODDetails of significant events after the Reporting Period of the Group are set out in note 64 to financial statements and the section headed “Recent Development” under Management Discussion and Analysis in this annual report.
ENVIRONMENT POLICY AND THE PERFORMANCEThe Company actively performs social responsibility, protects and cares for the environment, makes good use and cherishes resources, adopts more environment-friendly design and technology, enhances the sense of environmental protection among employees, cooperative partners and customers, and strives to minimize the impact of the Company’s businesses on the environment.
The Company published the “Fosun Group’s Safety, Quality and Environmental Policy” in 2012, and made undertakings to the society that the policy will be fully implemented within the Group, including various invested enterprises and offices. And the EHSQ performance of various enterprises will be enhanced through supervision by the Group and self-management by the enterprises. Details are set out in the section “CORPORATE SOCIAL RESPONSIBILITY”.
RELATIONSHIP WITH ITS EMPLOYEES, CUSTOMERS, SUPPLIERS AND INVESTORSThe Company actively manages its relationship with employees, customers, suppliers, investors, the general public in communities where it operates and other stakeholders, since the actions of such persons are able to influence the performance and value of the Company.
The Company adopts a variety of ways to communicate with its employees, such as Fosun Morning Assembly (once a week), Fosun Luncheon Session (non-regular), the employees’ survey on dedication/satisfaction, and their performance review and feedback from management heads in different tiers. These communication channels allow the Company to understand its employees and at the same time to deliver the Company’s strategies and culture to our employees, through which the latest information of the country, industries and enterprises is also shared with our employees, thus a diverse platform for learning and development is provided. Our employees are also encouraged to attend charitable activities for upholding Fosun’s value and brand.
The Company actively manages its relationship with investors. Subject to the compliance requirement, the Investor Relations Department actively conveys the Company’s information to the market to ensure high degree of transparency and smooth communication. In addition to the daily communication with the analysts and investors, we also hold results press conference, roadshow and reverse roadshow, investors’ teleconference, etc.
COMPLIANCE WITH LAWS AND REGULATIONSThough the Company is incorporated in Hong Kong, its business activities and investments cover various jurisdictions in addition to Hong Kong including but not limited to mainland China, the United States of America and Europe. During the Reporting Period, the Company had complied with all material laws and regulations of jurisdictions aforesaid that have an impact on the Company.

DIRECTORS’ REPORT
FOSUN INTERNATIONAL LIMITED Annual Report 201586
MAJOR RISKS AND UNCERTAINTIESThe Group has always taken a prudent attitude in the course of business to minimize risk exposure and prevent losses through a scientific decision making procedure, a strict monitoring system and a management mechanism for global core management staff. Nevertheless, the Group fully recognizes that it still faces risks and uncertainties during its operations, for instance:
1. Industry RisksDuring the course of integrating global industry resources, certain risks exist in determining the industry development trend.
2. Operating RisksFollowing the completion of mergers and acquisitions, the Group faces risks in integrated management such as operation and management, cultural fusion and employee identification.
3. Financial RisksSince the Group operates on a global scale and is active in investment, merger and acquisition activities, the financial position of the Group may be adversely affected if political or economic instability arises or the financial environment deteriorates in the regions in which the investments are located, including foreign exchange risk, credit risk, funding liquidity risk and rating downgrade risk.
4. Legal and Regulatory RisksWhile establishing a global presence, the Group is also faced with the requirements of complying with the laws and regulatory rules of different jurisdictions. Therefore, the laws and regulatory rules of the places in which the investment operations are located and changes and updates of these laws and rules from time to time bring challenges to the Group in the prevention of legal compliance risks.
FUTURE DEVELOPMENT OF THE GROUPFuture development of the Group is set out in the “Letter to Shareholders” in this annual report.
AUDITORSThe financial statements of the Group were audited by Ernst & Young. Ernst & Young will retire and a resolution for their reappointment as auditors of the Company will be proposed at the forthcoming annual general meeting of the Company.
On Behalf of the Board
Guo GuangchangChairman
Shanghai, the PRC30 March 2016

FOSUN INTERNATIONAL LIMITED Annual Report 2015 87
CORPORATE SOCIAL RESPONSIBILITY
MESSAGE FROM MANAGEMENTIn 2015, Fosun upheld its strategy of “Combining China’s Growth Momentum with Global Resources” and its value-investing philosophy, as well as persistently adhered to its “insurance + investment” twin-driver model with a view to becoming a world-class investment group underpinned by “Insurance-oriented Integrated Financial Capability” & “Global Industrial Integration Capability Taking Roots in China”. Meanwhile, Fosun always sticks to the moral principles, stringent requirements and discipline in both investment and internal management. As a responsible global finance enterprise and a global citizen, Fosun promotes philanthropy in the world, serving the people and shouldering social responsibilities.
In 2015, Fosun Foundation received 24 donations worth nearly RMB48 million from various sectors of the community and donated about RMB45 million to nearly 50 charitable projects. Fosun Foundation continued to promote cultural exchanges between China and Western countries, academic exchanges between higher education institutions, basic education and youth development, traditional arts, healthcare and medical development and community care, etc. From small acts of charity to contribution to humanity’s welfare, culture and education, we are making efforts to take the responsibility as a global citizen.
Looking forward to 2016, Fosun will continue to leverage its existing advantages and internal resources, including its wisdom, vitality and its capability to adapt to changes, integration and evolution in order to create better philanthropy projects, thus constantly creating value for our customers, staff, partners and the whole society. As for operations, Fosun will firmly uphold the value of being a transparent enterprise through constant risk control and compliance with regulatory requirements. In various countries and regions where we operate, Fosun will fully integrate itself into local communities and protect local cultures. It will dedicate itself to breaking down walls, building bridges and promoting philanthropy projects focusing on “education + culture” all over the world, with a view to becoming a bridge for global cultural exchanges.

CORPORATE SOCIAL RESPONSIBILITY
FOSUN INTERNATIONAL LIMITED Annual Report 201588
FOSUN AND ITS INVESTEES PAID TAXES OF RMB14.43 BILLION IN THE PRC IN 2015In 2015, the total tax payment by the Group and its investees nationwide amounted to RMB14.43 billion, of which the total tax payment contributed by its operations in Shanghai in 2015 was RMB2,800 million. Through paying tax according to relevant laws and regulations in various regions of the country, the Group has made practical contribution to the development of these regions.
ACTIVE PARTICIPATION IN THE DISCUSSION ABOUT PUBLIC POLICIES TO PERFORM CORPORATE SOCIAL RESPONSIBILITYIn March 2015, Mr. Guo Guangchang, Chairman of the Group and a member of the 12th National Committee of the Chinese People’s Political Consultative Conference, joined the Shanghai delegation in participating in the Chinese People’s Political Consultative Conference. During the session, Mr. Guo Guangchang actively put forward opinions on a number of topics, including overseas expansion of the mainland Chinese enterprises and the advancement of healthcare and environmental undertakings, and proposed strategies for them.
During the conference, Mr. Guo Guangchang submitted seven proposals to the conference, which are as follows:
1. Proposal for facilitating the integration of Chinese enterprises into the global economy
2. Proposal for the advancement of workers’ compensation insurance in China
3. Proposal for facilitating the sound development of the domestic environmental protection industry
4. Proposal for regulating the purchase of medicine and the settlement of medical fees in respect of health insurance through the internet
5. Proposal for encouraging retail pharmacies to participate in the basic healthcare service system
6. Proposal for encouraging the exploration of new investment and financing models for film and television
7. Proposal for reducing or abolishing tariffs on natural rubber imports
ESTABLISHMENT OF SAFETY AND ENVIRONMENTAL PROTECTION CULTUREThe Group actively fulfills its social responsibility, protects and cares for the environment, makes good use of and values resources, adopts more environmentally friendly designs and technology, enhances the sense of environmental protection among its employees, business partners and customers, and strives to minimize the impact of its businesses on the environment.
The Group published the “Fosun Group’s Safety, Quality and Environmental Policy” in 2012, and committed to society that it would implement the policy fully in the companies under the Group, including various invested enterprises and offices. The Environmental Health Safety and Quality (the “EHSQ”) performance of its various enterprises was enhanced through the Group’s direct supervision or on their own initiative.
“Self-improvement, Teamwork, Performance and Contribution to Society” constitutes the cultural values of the Group. We have always regarded occupational health, production safety, environmental protection and quality control as the important elements of corporate social responsibility, and they permeate the Company’s strategy for sustainable development. Through the implementation of a systematic, scientific and regulated EHSQ management system, we try to establish an enterprise which has businesses safe in nature and is environmentally-friendly, resource-saving and quality-and-benefits-oriented. Such an enterprise will work with all sections of society to build a healthy natural and business ecosystems.
As an investment group, Fosun will ensure its consistent compliance with the EHSQ requirements throughout the entire process of all its investments and operations, from EHSQ due diligence before investment in projects, EHSQ supervision after investments to EHSQ gate-keeping when we exit the investments.

CORPORATE SOCIAL RESPONSIBILITY
FOSUN INTERNATIONAL LIMITED Annual Report 2015 89
1. Overview of the Group’s EHSQ regulation and control The Group established an EHSQ Supervision Department at the headquarters in 2012, and fully coordinated the supervision of its
production safety, environmental protection and product quality. Initiated at the Group level, the move has led to gradual improvement of all the key segments’ EHSQ organizational structure over the years. Express instructions in writing have been issued to require officers responsible for EHSQ management system to be directly accountable to their respective chief operating managers and report their work to them so as to ensure the progress and implementation of the relevant work of EHSQ. The Group’s supervision is based on incident reporting and accountability, facilitated through a well-established system and assessment. This arrangement has induced the enterprises under Fosun to proactively enhance the EHSQ management standards comprehensively and effectively.
Statistics about reported incidents for four years (2012 to 2015) since the promulgation and implementation of the “Material Safety, Quality and Environmental Incidents Reporting System” in 2012 were as follows:
The total number of reported incidents decreased consistently, from 11 in 2012 to 3 in 2015.
Major accidents at the Group, including personal injuries, occupational ailments, environment pollution, fire accidents and product recall due to quality issues, are defined and specified differently from those defined at the national level of the PRC. The Group adopts standards which are more stringent than the PRC’s national standards. For example, within the Group, personal injury accidents in which one person suffered from serious injuries (including employees from contractors) or any fire accidents and natural disasters that resulted in certain losses that are required to be reported for insurance claims, are listed in the category of major accidents of the Group that need to be reported to and to be included in the statistics compiled at the Group’s headquarters. Investigations into the accidents will be carried out and rectification measures will be implemented, while other incidents (such as accidents that lead to loss of time at work, including minor injuries) are tallied and investigated by the relevant companies under the Group, and the Group will carry out statistical analysis and recommend the corresponding rectification measures.

CORPORATE SOCIAL RESPONSIBILITY
FOSUN INTERNATIONAL LIMITED Annual Report 201590
2. Establishment of the Group’s EHS system and upgrading EHS management standards in enterprises In 2013, the Group launched the Safety/Health/Environment (EHS) management system manual and review system. This system is
based on the foundation of OHSAS18001, ISO14001 and national safety production standards, including 5 major parts, namely systemic management elements, environment, safety, occupational hygiene, firefighting and loss prevention. According to the assessment score in each item, the EHS management standard and site management of the enterprises under the Group are classified into 5 score levels (0-1.5,1.6-2.5,2.6-3.5,3.6-4.5,4.6-5) to be quantified for review and comparison. Enterprises with relatively low scores (less than 1.5) will be classified as “red light” enterprises and brought under close supervision. The Group’s headquarters appointed internal and external EHS management experts in 2014 and 2015 to conduct the EHS audit at 20 enterprises controlled by the Group according to the scoring system of the Group’s EHS management system, covering the key segments of pharmaceuticals, steel, mining and property.
Through audit scores of the EHS system, enterprises are able to know timely whether they have shown signs of improvement or regression in the EHS management in vertical and how they compare with the others regarding their EHS management standing within the Group in horizon. They are thus able to identify leading enterprises within the Group and then learn from the latter so as to improve in the future. The overall audit scores for EHS systems of the enterprises under the Group in 2015 were higher than those in 2014, showing a remarkable improvement and that a positive competition mechanism has been formed within the system. By linking the audit scores with the appraisal of leaders at various levels, much progress has been achieved in EHS work. One noteworthy point is that hospitals under the Group have also actively commenced the building of EHS systems which have received general recognition and become the pioneer of establishing EHS systems in the medical service industry.
3. Fully support enterprises in moves to commence work on production safety and environmental protection The Group actively supports its investees in their moves to improve and upgrade production safety and environmental protection and
ensure investees’ focus in the two areas.
On the aspect of environmental protection, since the beginning of 2015, the PRC’s new environmental protection law which imposes the most stringent standards so far became effective, and the entire steel industry has then raised the emission standards. The Group strongly supported its subsidiaries in their measures to control pollution and commencement of clean production. Specifically, Nanjing Nangang, invested a substantial amount in reforms for environmental protection even when it was still in difficult times. The move earned the steel mill first-class performance in terms of a number of indicators of environmental protection by the domestic standards. It received recognition and commendation from environmental protection authorities for its environmental endeavors at such significant events as the Nanjing International Marathon and the National Memorial Day as well as its daily environmental protection work.
On the aspect of safety, Fosun’s EHSQ Supervision Department conducted supervision and inspection on the investees regularly to ensure sufficient personnel and funds were duly deployed by the investees, and guided the enterprises to carry out safety measures by adapting and repairing old and obsolete equipment. For example, protective guards were installed on the turning and moving parts of old and obsolete equipment in Nanjing Nangang, and the company invested approximately RMB30 million in 2015 to carry out rectification works against potential safety hazards and to prevent accidents effectively. The Group has formulated guidance and set procedures for safe operations such as the “procedure for turning off energy sources of equipment for overhaul and displaying signs of such operation”. The measure is for highly dangerous operations such as overhaul, and training has been provided. The investees has applied such guidance and procedures and has achieved remarkable results in risk control.
COMMITMENT TO EMPLOYEESAs an investment-oriented Group, Fosun regards its employees as its most valuable capital. Fosun has been aiming to become the best employer and the best platform for employees to realize their value. We fully protect the interests of employees, improve the employee incentive scheme, and provide employees with humanistic care and services. We are always concerned with the personal development of our staff, emphasize the importance of cultivating outstanding talents with an international perspective, provide professional and systematic training and career development planning and platform so as to allow both the Company and our employees to develop together.

CORPORATE SOCIAL RESPONSIBILITY
FOSUN INTERNATIONAL LIMITED Annual Report 2015 91
EMPLOYEE CARING AND SERVICESFosun persists in improving and innovating, and strengthening the establishment of a comprehensive and diversified benefit system in addition to creating a sound enterprise atmosphere and promoting a sense of belonging among the employees. Fosun cares for not only its employees but also their families. These are consistent with the value of “Self-improvement, Teamwork, Performance and Contribution to Society” which has been upheld by Fosun.
Employee CaringFosun established different schemes for various employee groups. We enhanced caring for expatriate employees and their families and created caring models for junior and senior employees. We also adopted incentive and benefit schemes tailored for our core employees, outstanding employees and young employees with high potential. In 2015, based on the results of the employee dedication survey and according to the actual situation of the Group, we improved our annual leave system, revised the domestic and overseas business travel standards, and made appropriate adjustments and improvements to employee benefits in different aspects, such as physical examination, birthday care, team building, travel insurance and health insurance according to the different needs of various employees. We take full advantage of the Group’s own insurance, finance, consumer, health and other resources so that employees can share all types of internal products, services and related resources at lower costs and more conveniently.
Fosun also cares about the physical and mental health of female employees and provides special care to them. The Group expresses its appreciation for the female employees’ work on Women’s Day every year on March 8. We also regularly organize lectures on women’s health and prevention of occupational diseases.
We have been striving to provide diverse forms of care for employees and their families (including all-round care for the growth of the “Children of Fosun Employees” and enrich the family life of our employees). We organize various activities every year and invite employees and their families to participate, hoping to help our employees and their families enjoy happy lives.
Employee ServicesWe use the internet and various new channels to enrich employee services and have introduced our personnel service hotline mobile application “A La Ding”(阿拉釘). We have innovated methods of benefit distribution and internal communication, such as announcing or introducing employee benefits through our own mobile application, displaying various remuneration benefits and human resources policies through scroll display and online banners on the home page of our Group’s intranet. We distribute employee benefits through our self-developed application “Fosun Pay”(掌星寶). We also use “Fosun Pay” to organize virtual fairs, allow users to online recharge and pay for meals.
Fosun has established a full-time employee service staff who assist the employees in applying for various certificates, such as employment permits/residence permits for expatriate employees, permits for introduction of high caliber employees from other provinces or cities/residence certificates for employees from other cities, college graduates settlement and collective residence affiliation (集體戶口掛靠) so as to reduce time and efforts spent by employees on applying for these certificates, which effectively supported the introduction of excellent talents.
We actively promote the use of English in our internal systems, processes, rules and regulations so as to drive the Group’s internationalization and meet the demands of our diverse employees. We also studied and formulated exclusive welfare policies and systems according to the laws, regulations and market practices in different countries and regions. Meanwhile, we also introduced induction courses and the “Partner” (小伙伴) program tailored for our overseas staff to help expatriate workers to quickly understand and integrate into our corporate culture.

CORPORATE SOCIAL RESPONSIBILITY
FOSUN INTERNATIONAL LIMITED Annual Report 201592
EMPLOYEE TRAINING AND DEVELOPMENTThe Group believes that talents form the core competitiveness for an enterprise, and as such, it has always been valuing the development of both the Group and its staff as one of the most important responsibilities of the Group. It provides the employees with more opportunities for occupational development and better working conditions through sustained efforts. With continuous growth and structural improvement, we have promoted the integration and cooperation among team members in the creation of value and formed groups of elite culture. These measures allow both the Company and its staff to build a brilliant future together.
– Cultural PromotionEmployees in t raining wi l l be al lowed to have a uni f ied understanding of the Group’s corporate culture and values.
Meanwhile, we also work with external consulting companies and universities or colleges in the integration of our internal and external training materials and resources, in an attempt to promote our corporate brand. In addition, the Company has developed a unified mechanism regarding the promotion, guidance, communication and coordination of talents. It effectively bridges the gap between the diverse talents of different cultural backgrounds, realizing harmonious relationships among the members of Fosun’s big family.
– Strategy Interpretation The Group, under its development strategy and focusing on solving practical issues, assists the staff in understanding the key strategies
of the Group by sharing cases of innovation and best practices with them so they could better implement our strategy extensively and in a well-coordinated manner.
– Overseas Talents Training The Group accelerates its globalization by promoting the
exchanges of talents between domestic and overseas enterprises and realizing cross-cultural management. It facilitates cultural integration and strategic collaboration, and aims at setting common objectives; it also provides more worldwide cross-regional training in skills and acquisition of knowledge.
– Career Development In accordance with the development strategy and the human
resources planning requirements of the Group and taking into account the characteristics of its own development, we established a 4-tier, pyramid-shaped talent training system, namely “Leadership Development Program”, “Management Excellence Program”, “Young Leaders Program” and “Fo-Star Program”. We provide different development paths at each level that match different development goals so as to assist employees in evolving from investment analysts to investment general managers. We have thus designed different learning paths and training courses that suit employees with various capabilities and varying degrees of competence, helping them to grow and develop rapidly.

CORPORATE SOCIAL RESPONSIBILITY
FOSUN INTERNATIONAL LIMITED Annual Report 2015 93
TRAINING THROUGH CASE STUDIES– Investment Case Review The think tank of Fosun system has a wealth of typical cases
from work for study and exceptional cases of outstanding performance of high-calibre employees who share their work experience with others. It focuses on three targets: firstly, to improve the staff’s investment and management capability by conducting internal training and sharing experience with the investment teams; secondly, to gradually develop tools or methods that Fosun should have possessed in investment by generalizing from the rich experience related to many cases of investments; thirdly, to progressively refine the learning-and-growth model of our core investment members, including the managing directors and executive directors, through a range of case studies.
– Professional Talent Training Establishing various lines of professional and specialized training, focusing on investment, insurance, finance, risk control, human
resources and multifunctional line; and encouraging “learn from practice” with the aim of honing the employees’ business acumen and enhancing their adaptability.
– Skills Enhancement Training Establishing Fosun’s lecture hall to help employees enhance basic knowledge and skills, improving efficiency and effectiveness at work,
enabling them to efficiently carry out work as professional managers of business whose work are up to standard.
– Mobile Learning Platform Offering interesting training courses in the form of “micro-lectures” to employees through mobile phones. More than 30 on-line courses
were continuously launched in 2015 so as to allow employees to enjoy a much greater degree of flexibility and have fun when attending tailored training programs which take the form of games.
– Luncheon Session The Group held 33 lunch-time sharing sessions in 2015 according to its nine major strategies to share its corporate strategies, hot topics
on investment and best practices. More than 2,300 employees attended the sessions.
– Fosun Ambassador Program We conducted two Fosun Ambassador Programs in 2015 to facilitate the
integration of Fosun’s investment teams and the domestic and overseas investees and deepen overseas investees’ understanding of Fosun’s culture, investment strategy and investment management. More than 20 middle and senior management members from overseas investees and different regions working in different areas participated in the intensive learning program for two weeks.
– Fo-Star Program Fo-Star Program is the “1+1” two-year talent fostering program that tracks
the fresh graduates who were selectively recruited by the Group from prestigious universities around the world. It is an important way to cultivate future investment experts and future enterprise leaders for the Group and is the foundation and initial plan of Fosun’s talent-echelon-pyramid. Its specific plan can be classified into induction into Fosun’s corporate culture, professional training, training in investment skills and training through job rotation and overseas assignments. The program is part of Fosun’s measures to develop itself into an enterprise well-adapted to its globalized operations.

CORPORATE SOCIAL RESPONSIBILITY
FOSUN INTERNATIONAL LIMITED Annual Report 201594
FULFILLING OUR COMMITMENTS TO SOCIETYFosun Foundation was officially established in September 2012, which also marked the 20th anniversary of Fosun. Upholding Fosun’s cultural philosophy of “Self-improvement, Teamwork, Performance and Contribution to Society”, Fosun Foundation has been integrating resources of all member companies of the Group and all sections of the community since its establishment to get access to different platforms and create valuable philanthropic activities.
Inheriting culture, supporting education, encouraging entrepreneurship, promoting messages of health and providing disaster relief as well as helping the poor are the objectives of Fosun Foundation. Fosun also established a special art foundation in 2015 and gradually developed its all-embracing, internet-enabled philanthropic network. During the year of 2015, Fosun Foundation donated about RMB45 million to nearly 50 charitable projects and also successfully went abroad to cooperate with world-renowned institutions in carrying out fruitful work.
1. From symphonies to Yi Taichi -- Sino-German Cultural Exchange Program
On 14 October 2015 (Germany time), “Building Bridges from Symphonies to Yi Taichi - - the Inaugural Ceremony of Sino-German Cultural Exchange Program” was hosted by the Fosun Foundation and German Philharmonic Council and co-organized by Shanghai Symphony Council, China Entrepreneur Club, Sino-German Economic Commission in Berlin, Germany.
During the event, famous contemporary German musician Mr. Justus Frantz shared the concept of “music union” with Fosun and decided to take the bilateral cooperation as an opportunity to make a contribution to the promotion of arts and cultural exchanges between China and Germany. As the first step of the program, Fosun Foundation signed a memorandum of cooperation with Justus Frantz Foundation to establish a long-term partnership and to jointly promote the cultural exchanges between China and Germany.
2. Fosun’s Arts Center joined hands with Lincoln Center for the Performing Arts to create a new cultural landmark
On 18 September 2015, as the sole top-tier partner of Lincoln Center for the Performing Arts, the Group supported the holding of the first global exchange event of Lincoln Center for the Performing Arts. Fosun Foundation has formally signed a strategic partnership agreement with the Lincoln Center for the Performing Arts. The newly established Fosun’s Arts Center will join hands with Lincoln Center to continuously promote Sino-American cultural exchanges and international cooperation in the areas of arts and education.
As a cultural and artistic highlight in BFC’s cluster of buildings invested by Fosun, Fosun’s Arts Center is bound to be a major international cultural venue, striving to transform the functional cluster of buildings for 100 years in the Bund of Shanghai into cultural and artistic platforms. Upon its completion, it will become the crown jewel in the Bund’s financial cluster. The addition of Lincoln Center for the Performing Arts to Fosun’s partnerships for cultural exchanges means that Shanghai’s residents can expect to enjoy a feast of international culture and arts to be showcased in Fosun’s Arts Center and thus enrich their cultural life.

CORPORATE SOCIAL RESPONSIBILITY
FOSUN INTERNATIONAL LIMITED Annual Report 2015 95
3. The Second Pramerica Fosun Spirit of Community Awards Pramerica Fosun Spirit of Community Awards is jointly organized by Fosun Foundation and Prudential Financial, Inc. in the United
States. The Award derives from Pramerica Spirit of Community Awards and is the largest award given to the youth and entirely based on voluntary community volunteer services in the United States, which was co-founded by Prudential Financial, Inc. and the National Association of Secondary School Principals in 1995. Over 18 years, the project has expanded into an international network, encouraging the youth worldwide to help others, serve the community and contribute to society by participating in voluntary activities.
On 19 March 2015, the 2015 Award Ceremony of Pramerica Fosun Spirit of Community Awards was grandly held in Shanghai, during which 15 students from junior high schools and high schools were elected to be the most outstanding volunteers in Shanghai and were awarded with “celebrity volunteers” and silver medals. Among them, Li Jiahao from Shanghai High School and Xu Chao from Shanghai Xinzhuang Middle School were conferred the title of “Charity Ambassadors”, and they represented our country to participate in the global award ceremony held in Washington in May 2015, where excellent middle school students from around the world gathered.
海俱 樂部
4. The 2015 Youth Innovation Competition on Global Governance (“YICGG”) The 2015 Youth Innovation Competition on Global Governance
jointly organized by the Group, Fudan University, The China Corporate United pavilion of Milan Expo, Shanghai Overseas Chinese Foundation was successfully held during Milan Expo.
YICGG originated in 2007. It is the world’s first international innovation competition in the field of “global governance” independently established by Chinese college students and has developed a greater international influence in the relevant field, a wider cooperation network and more organizational experience. The project is open to all youth around the world. It is a competition of proposal design and creativity on global governance, a channel for youth from different countries to think deeply and discuss global issues as well as a platform which can encourage and inspire the youth to devote themselves to the global governance.
As one of the hosts, Fosun, over a long period of time, has been paying a good deal of attention to educational undertakings and continuously fostering entrepreneurship and employment for the youth. Fosun hopes that YICGG could turn out to be an ideal place for fostering the growth of the world’s future leaders or to be a youth think tank reserve for the operation of future corporate brands by inculcating a sense of innovative global governance into the youth.

CORPORATE SOCIAL RESPONSIBILITY
FOSUN INTERNATIONAL LIMITED Annual Report 201596
5. Fosun iLab and Innovative Entrepreneurship Competition in Portugal Following its investment in local corporations in Portugal, Fosun respects its investees’ cultural norms and customs and values the local
staff and managerial culture, and as such, it cooperated with Fidelidade, Fudan University and Lisbon School of Business in organizing a charity event that promotes exchanges between MBA students from China and Portugal. During the implementation of the 2015 Fudan-Lisbon MBA Project, Fosun, Fudan and NOVA University, one of the best universities in Portugal jointly launched the Fosun iLab commercial consultancy project that facilitated cultural and educational exchanges between China and Portugal. Fosun set a topic on healthcare, one of the hottest currently, guiding students from China and Portugal to conduct a thorough investigation into and a study on the successful commercial model and operational and managerial innovation of medical companies under Fosun. This encouraged MBA students from these two universities to think out of the box when they are devising diverse solutions for the development and innovation of the healthcare industry.
Protechting Innovative Entrepreneurship Competition is another charity event about fostering young talents. It was launched by Fosun in Portugal after Fosun iLab, the Sino-Portugal MBA exchange project. The Protechting project, which is conducted by Fosun through collaboration with Beta-i, a renowned innovative workshop based in Europe, focuses on seeking out talented young people and encourages entrepreneurship among them. It also assists the participants in refining their innovative ideas and provides guidance on project incubation, trains them in the skills of conducting roadshows and attracting investment from venture capital funds.
6. RESPECT TEACHERS, FOCUS ON TEACHING AND ASSIST IN FOSTERING TALENTS Fosun has been interested in education since its establishment, and has been constantly helping many students to become talents.
Concerning youth education: In September 2015, the award ceremony of the 14th Fosun “Respect Teacher Award” was held in Jiulong Model Secondary School. In the past 14 years, Fosun Foundation donated RMB500,000 every year to Jiulong Model Secondary School since its establishment of Fosun Respect Teacher Award development fund in 2001 for awarding outstanding teachers in Jiulong. RMB7 million was donated as of today and awarded to more than 850 teachers in total.
Sponsoring university students to become talents: Fosun has attached importance to and supported education in China. In recent years, Fosun Pharma has set up scholarships and teaching awards with five universities, including Fudan University, Shenyang Pharmaceutical University and China Pharmaceutical University, for constantly driving development of education and helping awarded teachers and students to make great strides in the scientific research area. It also played an important role in encouraging the staff of youth education to devote themselves to their career and to help university students and postgraduate students, in particular, cultivate their overall strength and innovation capability. This serves to foster talents in universities.

CORPORATE SOCIAL RESPONSIBILITY
FOSUN INTERNATIONAL LIMITED Annual Report 2015 97
The Group not only cares for students in Shanghai but also actively supports educational undertakings in other provinces and cities. On 15 August 2007, the Hainan Province Fosun Guangcai Educational Incentive Fund Donation Ceremony was held in Haikou. Fosun established Hainan Province Fosun Guangcai Educational Incentive Fund with a total amount of RMB10 million, and has been providing a standard living subsidy of not less than RMB1,800 per person per year to 400 outstanding, impoverished high school students from five senior high schools in Hainan Province each year through the China Guangcai Foundation for 10 consecutive years starting from 2007. This was the first large-scale donation for subsidizing senior high school students, and it was welcomed by Hainan Provincial Government. The establishment of this incentive fund has not only satisfied needs of impoverished students and enabled them to continue their studies but also has rekindled the hope for a brighter future among the students’ families.
7. Red Red Go Healthy Run With A Deep Affinity With Community
By virtue of Forte community, Fosun Foundation and Forte collaborated in organizing healthy run charity events in six cities, including Chengdu, Shanghai, Beijing, Tianjin, Wuhan and Hangzhou, calling on participants to run for love and to show energy and passion when running freely. Runners who had completed the race were granted charity funds of RMB100, which could be donated to charity projects for such purposes as environmental protection and provision of financial aids to students in impoverished areas so as to help others within their power when they joined the run.
8. Conducting Charity Events With One Heart and Beautifying Our Children With One Mind In 2015, Fosun Foundation and Forte jointly launched the “Conducting Charity Events With One Heart and Beautifying Our Children With
One Mind” project specially for children living in Forte community. By organizing social experience and practice events concerning the concepts of respecting life, protecting environment and learning to share, as well as charity dreams supporting funds for little volunteers, this project aims to lead and foster children’s awareness of love, to help children experience the fineness of love, to help them learn to live with love and to enhance their ability and inner quality in a loving environment. At the end of the event, this project also aims to foster children’s awareness of charity by asking each team of little volunteers to work together to prepare and complete a charity reporting plan.

CORPORATE SOCIAL RESPONSIBILITY
FOSUN INTERNATIONAL LIMITED Annual Report 201598
AWARDS RECEIVED BY THE GROUP AND DIRECTORS IN 2015January The Company won the honors of “Top 100 Enterprises with Comprehensive Strengths in 2014” and “Enterprise with
Significant Advancement Award” in the “Top 100 Hong Kong Listed Companies” jointly organized by Finet and QQ.com.
On 12 January, Hurun Research Institute released the “Midas Rich List” for the first time. Among the 87 listed “Midas”, Mr. Guo Guangchang, Chairman of the Group, ranked first, and Mr. Liang Xinjun, Vice Chairman and CEO of the Group, won the fifth place in the Midas Rich List.
At the 2015 “The Capital Awarding Ceremony” held by Chinese Venture in Beijing on 21 January, the “2014 Chinese Venture PE List” was announced. Fosun capital won three awards, namely the “2014 Best All Asset Management Firm in China”, the “2014 Top 10 PE Firms in China” and the “2014 Best Investment Case in China”. Meanwhile, Forte carried off the award of “2014 Best Real Estate Fund Management Firm in China”, and Fosun Kinzon scooped the award of “2014 Promising Equity Investment Firm”.
February Mr. Liang Xinjun, Vice Chairman and CEO of the Company, won the “2014 Achievement Awards — Capital Markets Person of the Year” organized by FinanceAsia.
April The Company won the “Award of the Best M&A Enterprise in the Insurance Industry of the Greater China Region in 2014” organized by the Institutional Investor magazine.
Mr. Ding Guoqi, Executive Director and Senior Vice President of the Company, won the honor of the “Best CFO in Asia” in the 2015 Asian Excellence Awards organized by the journal of Corporate Governance Asia. Meanwhile, the Company carried off the “Best Investor Relations Award” in the same event.
May The Company ranked 536th on the latest List of Global 2000 Leading Companies in 2015 published by the Forbes magazine in the United States.
July On the list of Top 500 Companies in China in 2015 announced by the Fortune magazine, the Company ranked 96th with RMB61.738 billion in operating revenue and RMB6.854 billion in profit.
August On the list of “50 Most Influential Individuals of the Portuguese Economy in 2015” by the Portuguese mainstream media Jornal de Negócios, Mr. Guo Guangchang, Chairman of the Company, was ranked 30th on the list for “following the investment model of Berkshire Hathaway Inc. of Warren Buffett and the strategic thinking concerning the consumer demand in China”.
November Mr. Guo Guangchang, Chairman of the Company, won the honor of “Figure of the Year 2015 in Portugal” awarded by Portuguese-Chinese Chamber of Commerce & Industry for the contributions that he and the Group under his leadership made to the economic development of Portugal and to the local community and the youths’ development in the country as they fulfilled the corporate social responsibility.
Mr. Liang Xinjun, Vice Chairman and CEO of the Company, was granted the honors of “China’s Best Industrial Investor TOP10”, “China’s Best Internet Industry Investor TOP10” and “China’s Best Modern Agricultural Industry Investor TOP10” in 2015 China VC/PE Industry List as well as “China’s TOP5 Best PE Investor (60s) by Chinese LPs” in 2015 China VC/PE Innovation List issued by China Venture.
December Mr. Liang Xinjun, Vice Chairman and CEO of the Company, was appointed as a Chinese Representative Designate of Asia-Pacific Economic Cooperation (APEC) Business Advisory Council (ABAC).
Mr. Guo Guangchang, Chairman of the Company, was recognized as the “2015 Most Influential Corporate Leaders in China” at the “2015 China Entrepreneur Summit and China Entrepreneur 30th Annual Awarding Ceremony”.

CORPORATE SOCIAL RESPONSIBILITY
FOSUN INTERNATIONAL LIMITED Annual Report 2015 99
HUMAN RESOURCES
As at 31 December 2015, the Group had a total of approximately 55,800 employees.
In 2015, the Human Resources division of Fosun fully implemented the Group’s globalization strategy, active support was provided for the implementation of projects to safeguard organization and personnel, significant efforts were dedicated to build a sound and comprehensive management mechanism for network-linked organizations, appraisals were carried out through tracking on performance development and the management on personnel selection, education and retention was strengthened for continuous improvement. The training and development of a comprehensive team of excellent talents were improved through the implementation of the “Fo-Star Program”. Team cohesion, cooperation and value creation were enhanced through continuous improvement of the incentive system to build entrepreneurial units under the “Big Group – Small Organization” model.
As an engine for personnel development, Fosun Management Institute closely followed the strategic requirements of the Group and aimed at resolving practical problems, resources were consolidated by utilizing advantages to realize the value of platform. Through sharing innovations and best practices, instantaneous learning in business was improved while the learning costs were lowered. Integration for overseas enterprises were accelerated to facilitate the merging of business and culture to build a globalized family. Team building within the Group was facilitated through measures such as continuous improvement in mobile learning and realization of cloud learning and management.
For organization development and performance management, appraisals were carried out through tracking on performance development and the management on personnel selection, education and retention was strengthened for continuous implementation. Understanding on personnel development trends was acquired through surveys and researches on personnel to achieve best matching. Through the “Organization Red Yellow Green Light” assessment system and monthly personnel meetings, instant tracking on organization building in investment departments and core enterprises was performed with feedback and support provided. The personnel structure of the Group was optimized continuously to maintain corporate vitality.
In respect of employees’ remuneration incentives and operations, to complement the building of the Group’s organization management mechanism, performance appraisal standards and the relevant incentive systems were established. The Group’s corporate values and growth incentive schemes were enhanced. Restrictive share award scheme was implemented for Directors and the Group’s business and functional department heads, backbone employees, outstanding young talents and senior management of the Group’s core affiliated enterprises who have delivered excellent performance. Continuous improvements were made to the “multi-level, entire-coverage” incentive system to cater for the development needs of globalization of Fosun. According to the development needs of the Group’s overseas business, assistance was provided to the relevant entities for establishing, researching and formulating a personnel management system that complied with international requirements and reflected the cultural characteristics of Fosun, and setting the relevant process and standards. The brand new EHR system went online to consolidate system resources for building a unified platform for human resource services.

FOSUN INTERNATIONAL LIMITED Annual Report 2015100
INDEPENDENT AUDITORS’ REPORT
To the members of Fosun International Limited(Incorporated in Hong Kong with limited liability)
We have audited the consolidated financial statements of Fosun International Limited (the “Company”) and its subsidiaries set out on pages 102 to 247, which comprise the consolidated statement of financial position as at 31 December 2015, and the consolidated statement of profit or loss, the consolidated statement of comprehensive income, the consolidated statement of changes in equity and the consolidated statement of cash flows for the year then ended, and a summary of significant accounting policies and other explanatory information.
DIRECTORS’ RESPONSIBILITY FOR THE CONSOLIDATED FINANCIAL STATEMENTSThe directors of the Company are responsible for the preparation of consolidated financial statements that give a true and fair view in accordance with Hong Kong Financial Reporting Standards issued by the Hong Kong Institute of Certified Public Accountants and the Hong Kong Companies Ordinance, and for such internal control as the directors determine is necessary to enable the preparation of consolidated financial statements that are free from material misstatement, whether due to fraud or error.
AUDITORS’ RESPONSIBILITYOur responsibility is to express an opinion on these consolidated financial statements based on our audit. Our report is made solely to you, as a body, in accordance with section 405 of the Hong Kong Companies Ordinance, and for no other purpose. We do not assume responsibility towards or accept liability to any other person for the contents of this report.
We conducted our audit in accordance with Hong Kong Standards on Auditing issued by the Hong Kong Institute of Certified Public Accountants. Those standards require that we comply with ethical requirements and plan and perform the audit to obtain reasonable assurance about whether the consolidated financial statements are free from material misstatement.
An audit involves performing procedures to obtain audit evidence about the amounts and disclosures in the consolidated financial statements. The procedures selected depend on the auditors’ judgement, including the assessment of the risks of material misstatement of the consolidated financial statements, whether due to fraud or error. In making those risk assessments, the auditors consider internal control relevant to the entity’s preparation of consolidated financial statements that give a true and fair view in order to design audit procedures that are appropriate in the circumstances, but not for the purpose of expressing an opinion on the effectiveness of the entity’s internal control. An audit also includes evaluating the appropriateness of accounting policies used and the reasonableness of accounting estimates made by the directors, as well as evaluating the overall presentation of the consolidated financial statements.
We believe that the audit evidence we have obtained is sufficient and appropriate to provide a basis for our audit opinion.

FOSUN INTERNATIONAL LIMITED Annual Report 2015 101
INDEPENDENT AUDITORS’ REPORT
OPINIONIn our opinion, the consolidated financial statements give a true and fair view of the financial position of the Company and its subsidiaries as at 31 December 2015, and of their financial performance and cash flows for the year then ended in accordance with Hong Kong Financial Reporting Standards and have been properly prepared in compliance with the Hong Kong Companies Ordinance.
Ernst & YoungCertified Public Accountants
Hong Kong30 March 2016

FOSUN INTERNATIONAL LIMITED Annual Report 2015102
CONSOLIDATED STATEMENT OF PROFIT OR LOSSYear ended 31 December 2015
2015 2014Notes RMB’000 RMB’000
REVENUE 6 78,796,889 61,738,449Cost of sales (61,135,274) (47,122,683) Gross profit 17,661,615 14,615,766
Other income and gains 6 25,864,006 13,789,378Selling and distribution expenses (5,187,210) (3,271,268)Administrative expenses (11,260,050) (8,078,137)Other expenses (9,312,810) (3,264,172)Finance costs 7 (4,724,031) (3,884,565)Share of profits and losses of: Joint ventures 1,066,950 1,127,179 Associates 2,074,079 1,671,110 PROFIT BEFORE TAX 8 16,182,549 12,705,291
Tax 10 (5,229,122) (3,119,231) PROFIT FOR THE YEAR 10,953,427 9,586,060 Attributable to: Owners of the parent 8,038,282 6,853,944 Non-controlling interests 2,915,145 2,732,116
10,953,427 9,586,060 EARNINGS PER SHARE ATTRIBUTABLE TO ORDINARY EQUITY HOLDERS OF THE PARENT Basic – For profit for the year (RMB) 12 1.06 1.02 Diluted – For profit for the year (RMB) 12 1.05 0.99

FOSUN INTERNATIONAL LIMITED Annual Report 2015 103
CONSOLIDATED STATEMENT OF COMPREHENSIVE INCOMEYear ended 31 December 2015
2015 2014Note RMB’000 RMB’000
PROFIT FOR THE YEAR 10,953,427 9,586,060 OTHER COMPREHENSIVE INCOME
Other comprehensive income to be reclassified to profit or loss in subsequent years:Available-for-sale investments: Changes in fair value 3,005,509 2,235,085 Reclassification adjustments for gains included in the consolidated statement of profit or loss - gain on disposal (4,868,248) (1,883,168) - impairment loss (99,412) — Income tax effect 27 754,531 10,592
(1,207,620) 362,509
Change in other life insurance contract liabilities due to potential gains on financial assets 472,029 292,530 Income tax effect 44,087 12,091
516,116 304,621
Share of other comprehensive (loss)/income of associates (164,525) 158,954
Exchange differences on translation of foreign operations (118,603) (1,107,465) Net other comprehensive loss to be reclassified to profit or loss in subsequent years (974,632) (281,381) Net other comprehensive income not to be reclassified to profit or loss in subsequent years — — OTHER COMPREHENSIVE LOSS FOR THE YEAR, NET OF TAX (974,632) (281,381) TOTAL COMPREHENSIVE INCOME FOR THE YEAR 9,978,795 9,304,679 Attributable to: Owners of the parent 7,618,960 6,806,853 Non-controlling interests 2,359,835 2,497,826
9,978,795 9,304,679

FOSUN INTERNATIONAL LIMITED Annual Report 2015104
CONSOLIDATED STATEMENT OF FINANCIAL POSITION31 December 2015
2015 2014Notes RMB’000 RMB’000
NON-CURRENT ASSETSProperty, plant and equipment 13 17,176,435 36,037,896Investment properties 14 40,898,689 16,883,890Prepaid land lease payments 15 2,143,888 2,921,393Exploration and evaluation assets 16 197,500 156,846Mining rights 17 564,507 784,882Oil and gas assets 18 970,236 1,512,206Intangible assets 19 9,189,950 2,226,693Goodwill 20 10,713,380 6,842,031Investments in joint ventures 21 11,809,125 7,589,150Investments in associates 22 31,209,652 26,976,404Available-for-sale investments 23 97,134,211 60,849,499Properties under development 24 17,035,471 13,671,828Loans receivable 25 553,789 1,296,977Prepayments, deposits and other receivables 26 3,854,693 3,862,611Deferred tax assets 27 5,002,561 4,372,070Inventories 28 323,708 87,722Policyholder account assets in respect of unit-linked contracts 29 3,594,381 3,769,975Insurance and reinsurance debtors 30 128,787 68,099Reinsurers’ share of insurance contract provisions 31 9,620,463 481,360Term deposits 32 465,135 147,815 Total non-current assets 262,586,561 190,539,347 CURRENT ASSETSCash and bank 32 46,601,795 40,190,807Investments at fair value through profit or loss 33 10,716,167 14,867,194Derivative financial instruments 15,921 —Trade and notes receivables 34 4,368,550 6,371,003Prepayments, deposits and other receivables 26 10,338,976 7,619,585Inventories 28 2,347,989 6,252,883Completed properties for sale 10,898,015 7,626,912Properties under development 24 18,846,968 23,429,966Loans receivable 25 1,735,066 843,086Due from related companies 35 3,707,641 5,249,357Available-for-sale investments 23 20,998,463 16,388,314Policyholder account assets in respect of unit-linked contracts 29 471,535 1,535,931Insurance and reinsurance debtors 30 8,146,186 2,063,919Reinsurers’ share of insurance contract provisions 31 3,452,133 624,909
142,645,405 133,063,866
Non-current assets/assets of a disposal group classified as held for sale 36 103,245 1,229,570 Total current assets 142,748,650 134,293,436

FOSUN INTERNATIONAL LIMITED Annual Report 2015 105
CONSOLIDATED STATEMENT OF FINANCIAL POSITION31 December 2015
2015 2014Notes RMB’000 RMB’000
CURRENT LIABILITIESInterest-bearing bank and other borrowings 37 48,788,443 46,389,197Loans from related companies 39 193,000 193,000Trade and notes payables 40 10,436,233 19,590,569Accrued liabilities and other payables 41 24,220,044 23,289,484Tax payable 3,787,469 3,210,555Finance lease payables 42 46,161 119,110Deposits from customers 43 1,300,688 1,696,120Due to the holding company 35 979,101 673,617Due to related companies 35 2,944,692 3,118,393Derivative financial instruments 204,015 65,670Unearned premium provisions 44 12,881,979 2,860,227Provision for outstanding claims 45 14,461,347 6,534,777Provision for unexpired risks 432,410 438,465Financial liabilities for unit-linked contracts 46 251,577 1,104,752Investment contract liabilities 46 4,940,511 8,929,945Other life insurance contract liabilities 47 1,359,147 1,561,511Insurance and reinsurance creditors 48 3,740,375 1,453,267
130,967,192 121,228,659Liabilities directly associated with the assets classified as held for sale 36 — 589,118 Total current liabilities 130,967,192 121,817,777 NET CURRENT ASSETS 11,781,458 12,475,659 TOTAL ASSETS LESS CURRENT LIABILITIES 274,368,019 203,015,006 NON-CURRENT LIABILITIESInterest-bearing bank and other borrowings 37 65,859,536 46,766,499 Convertible bonds 38 268,983 2,485,546Finance lease payables 42 120,334 148,117Deferred income 49 1,019,108 311,683Other long term payables 50 4,086,385 3,944,791Deferred tax liabilities 27 8,800,411 6,577,690Provision for outstanding claims 45 32,548,001 7,622,616Financial liabilities for unit-linked contracts 46 3,814,339 4,201,132Investment contract liabilities 46 48,204,699 43,042,687Other life insurance contract liabilities 47 11,374,815 12,229,753Insurance and reinsurance creditors 48 117,333 — Total non-current liabilities 176,213,944 127,330,514 Net assets 98,154,075 75,684,492

FOSUN INTERNATIONAL LIMITED Annual Report 2015106
CONSOLIDATED STATEMENT OF FINANCIAL POSITION31 December 2015
2015 2014Notes RMB’000 RMB’000
EQUITYEquity attributable to owners of the parentShare capital 2.2 36,046,143 16,281,011Equity component of convertible bonds 68,674 721,171Other reserves 2.2 39,137,692 32,406,241
75,252,509 49,408,423
Non-controlling interests 22,901,566 26,276,069 Total equity 98,154,075 75,684,492
Guo Guangchang Ding GuoqiDirector Director

FOSUN INTERNATIONAL LIMITED Annual Report 2015 107
CONSOLIDATED STATEMENT OF CHANGES IN EQUITYYear ended 31 December 2015
Attributable to owners of the parent Available-
for-saleStatutory investment Capital Exchange Non-
Issued Other surplus revaluation redemption Other Convertible Retained fluctuation controlling Totalcapital deficits reserve reserve reserve reserve bonds earnings reserve Total interests equity
RMB’000 RMB’000 RMB’000 RMB’000 RMB’000 RMB’000 RMB’000 RMB’000 RMB’000 RMB’000 RMB’000 RMB’000(note 51) (note 52(a)) (note 52(b))
At 1 January 2015 16,281,011 (443,540) 3,229,375 1,259,885 — 1,171,059 721,171 28,614,104 (1,424,642) 49,408,423 26,276,069 75,684,492
Profit for the year — — — — — — — 8,038,282 — 8,038,282 2,915,145 10,953,427Other comprehensive income for the year:Changes in fair value of available-for-sale investments, net of tax — — — 2,177,304 — — — — — 2,177,304 548,565 2,725,869Reclassification adjustments for gains included in the consolidated statement of profit or loss – gain on disposal, net of tax — — — (2,883,113) — — — — — (2,883,113) (980,769) (3,863,882) – impairment loss, net of tax — — — (59,166) — — — — — (59,166) (10,441) (69,607)Share of other comprehensive loss of associates — — — (59,485) — — — — (3,894) (63,379) (101,146) (164,525)Change in other life insurance contract liabilities due to potential gains on financial assets, net of tax — — — — — 436,495 — — — 436,495 79,621 516,116Exchange differences on translation of foreign operations — — — — — — — — (27,463) (27,463) (91,140) (118,603) Total comprehensive (loss)/income for the year — — — (824,460) — 436,495 — 8,038,282 (31,357) 7,618,960 2,359,835 9,978,795
Acquisition of subsidiaries (note 54(a)) — — — — — — — — — — 318,627 318,627Capital contribution from non-controlling shareholders of subsidiaries — — — — — — — — — — 1,244,076 1,244,076Rights issue of new shares 9,537,094 — — — — — — — — 9,537,094 — 9,537,094Placing of new shares 7,288,395 — — — — — — — — 7,288,395 — 7,288,395Share issue expenses (20,061) — — — — — — — — (20,061) — (20,061)Dividends paid to non-controlling shareholders of subsidiaries — — — — — — — — — — (743,052) (743,052)Final 2014 dividend declared — — — — — — — (1,035,103) — (1,035,103) — (1,035,103)Transfer from retained profits — — 1,412,012 — — — — (1,412,012) — — — —Share of other reserve of associates — — — — — 12,395 — — — 12,395 (33,338) (20,943)Disposal of subsidiaries (note 54(b)) — — — — — — — — — — (5,620,224) (5,620,224)Deemed disposal of partial interests in subsidiaries without losing control — — — — — 86,318 — — — 86,318 (86,318) —Fair value adjustment on the stock redemption option granted to non-controlling shareholders of a subsidiary — — — — — (971) — — — (971) (3,435) (4,406)Equity-settled share-based payments (note 55) — — — — — 25,676 — — — 25,676 5,809 31,485Deemed acquisition of additional interests in a subsidiary — — — — — (7,364) — — — (7,364) 7,364 —Acquisition of additional interests in subsidiaries — — — — — (144,896) — 176,436 — 31,540 (823,847) (792,307)Conversion of convertible bonds to ordinary shares (note 38) 2,959,704 — — — — — (652,497) — — 2,307,207 — 2,307,207 At 31 December 2015 36,046,143 (443,540)* 4,641,387* 435,425* — 1,578,712* 68,674 34,381,707* (1,455,999)* 75,252,509 22,901,566 98,154,075
* These reserve accounts comprise the consolidated other reserves of RMB39,137,692,000 (2014: RMB32,406,241,000) in the consolidated statement of financial position.

FOSUN INTERNATIONAL LIMITED Annual Report 2015108
CONSOLIDATED STATEMENT OF CHANGES IN EQUITYYear ended 31 December 2015
Attributable to owners of the parent Available-
for-saleStatutory investment Capital Exchange Non-
Issued Share Other surplus revaluation redemption Other Convertible Retained fluctuation controlling Totalcapital premium deficits reserve reserve reserve reserve bonds earnings reserve Total interests equity
RMB’000 RMB’000 RMB’000 RMB’000 RMB’000 RMB’000 RMB’000 RMB’000 RMB’000 RMB’000 RMB’000 RMB’000 RMB’000(note 51) (note 52(a)) (note 52(b))
At 1 January 2014 621,497 11,793,716 (443,540) 3,079,315 713,716 1,465 1,001,959 721,171 22,726,619 (587,685) 39,628,233 21,671,596 61,299,829
Profit for the year — — — — — — — — 6,853,944 — 6,853,944 2,732,116 9,586,060Other comprehensive income for the year:Changes in fair value of available-for-sale investments, net of tax — — — — 1,237,640 — — — — — 1,237,640 461,800 1,699,440Reclassification adjustments for gains included in the consolidated statement of profit or loss – gain on disposal, net of tax — — — — (850,770) — — — — — (850,770) (486,161) (1,336,931)Share of other comprehensive income/(loss) of associates — — — — 159,299 — — — — 4,996 164,295 (5,341) 158,954Change in other life insurance contract liabilities due to potential gains on financial assets, net of tax — — — — — — 243,697 — — — 243,697 60,924 304,621Exchange differences on translation of foreign operations — — — — — — — — — (841,953) (841,953) (265,512) (1,107,465) Total comprehensive income/(loss) for the year — — — — 546,169 — 243,697 — 6,853,944 (836,957) 6,806,853 2,497,826 9,304,679
Acquisition of subsidiaries — — — — — — — — — — — 2,529,920 2,529,920Capital contribution from non-controlling shareholders of subsidiaries — — — — — — — — — — — 4,368,698 4,368,698Rights issue of new shares 3,886,511 — — — — — — — — — 3,886,511 — 3,886,511Share issue expenses (14,175) — — — — — — — — — (14,175) — (14,175)Dividends paid to non-controlling shareholders of subsidiaries — — — — — — — — — — — (1,223,348) (1,223,348)Final 2013 dividend declared — — — — — — — — (816,399) — (816,399) — (816,399)Transfer from retained profits — — — 150,060 — — — — (150,060) — — — —Share of other reserve of associates — — — — — — (142,646) — — — (142,646) (203,071) (345,717)Disposal of subsidiaries — — — — — — — — — — — (311,038) (311,038)Deemed disposal of partial interests in subsidiaries without losing control — — — — — — 1,114,729 — — — 1,114,729 (1,114,729) —Fair value adjustment on the loan from a non-controlling shareholder of a subsidiary — — — — — — (738) — — — (738) 738 —Fair value adjustment on the stock redemption option granted to non-controlling shareholders of a subsidiary — — — — — — (2,859) — — — (2,859) (14,698) (17,557)Equity-settled share-based payments — (8,003) — — — — 21,308 — — — 13,305 25,055 38,360Deemed acquisition of additional interests in subsidiaries — — — — — — (10,877) — — — (10,877) 10,877 —Acquisition of additional interests in subsidiaries — — — — — — (1,053,514) — — — (1,053,514) (1,961,757) (3,015,271)Transition to no-par value regime 11,787,178 (11,785,713) — — — (1,465) — — — — — — — At 31 December 2014 16,281,011 — (443,540) 3,229,375 1,259,885 — 1,171,059 721,171 28,614,104* (1,424,642) 49,408,423 26,276,069 75,684,492
* Retained earnings have been adjusted for the proposed final 2014 dividend in accordance with the current year’s presentation, which is described in note 2.4 to the financial statements.

FOSUN INTERNATIONAL LIMITED Annual Report 2015 109
CONSOLIDATED STATEMENT OF CASH FLOWSYear ended 31 December 2015
2015 2014Notes RMB’000 RMB’000
CASH FLOWS FROM OPERATING ACTIVITIES
Profit before tax 16,182,549 12,705,291Adjustments for: Depreciation of items of property, plant and equipment 8 2,746,177 2,088,031 Amortisation of prepaid land lease payments 8 76,107 46,296 Amortisation of intangible assets 8 414,535 131,814 Amortisation of mining rights 8 26,945 43,298 Amortisation of oil and gas assets 8 483,401 — Exploration expensed and written off 86,411 — Provision for impairment of goodwill 8 — 202,500 Provision for impairment of items of property, plant and equipment 8 125,975 5,853 Provision for impairment of intangible assets 8 — 83,995 Provision for impairment of oil and gas assets 8 338,224 158,340 Provision for impairment of mining rights 8 101,523 — Provision for impairment of available-for-sale investments 8 1,823,695 99,783 Provision for impairment of investments in associates 8 49,153 38,134 Provision for impairment of receivables 8 142,892 241,811 Reversal for impairment of insurance and reinsurance debtors 8 (204,104) — Provision for inventories 8 381,595 92,292 Provision for impairment of completed properties for sale 8 401,926 — Provision for impairment of properties under development 8 377,631 — (Gain)/loss on disposal of subsidiaries 6/8 (7,180,957) 15,873 Gain on bargain purchase 6 (847,409) (61,148) Gain on disposal of available-for-sale investments 6 (6,671,444) (3,597,875) Gain on disposal of investments at fair value through profit or loss 6 (434,394) (209,183) Gain on disposal of associates 6 (361,587) (59,081) Loss on disposal of joint ventures 8 73,946 — Gain on disposal of partial investments in associates 6 (2,534,538) (243,302) Gain on deemed disposal of partial investments in associates 6 — (728,288) Gain on disposal of items of property, plant and equipment 6 (1,714) (13,984) Gain on disposal of non-current assets held for sale 6 (130,600) (51,253) Loss/(gain) on fair value adjustment on investments at fair value through profit or loss 8/6 1,912,096 (2,924,322) Gain on fair value gains on investment properties 6 (1,838,511) (916,662) Interest expenses 4,492,741 3,667,360 Interest income 6 (912,697) (606,402) Dividends and interests from investments at fair value through profit or loss 6 (467,971) (323,900) Dividends and interests from available-for-sale investments 6 (2,683,723) (1,858,347) Share of profits and losses of associates (2,074,079) (1,671,110) Share of profits and losses of joint ventures (1,066,950) (1,127,179) Subtotal carried forward 2,826,844 5,228,635

FOSUN INTERNATIONAL LIMITED Annual Report 2015110
CONSOLIDATED STATEMENT OF CASH FLOWSYear ended 31 December 2015
2015 2014RMB’000 RMB’000
CASH FLOWS FROM OPERATING ACTIVITIES (continued)
Subtotal brought forward 2,826,844 5,228,635
CASH INFLOW BEFORE WORKING CAPITAL CHANGES 2,826,844 5,228,635 Increase in properties under development (11,392,141) (14,437,602)Decrease in completed properties held for sale 12,533,841 8,852,251Increase in trade and notes receivables (1,133,356) (1,112,574)Increase in prepayments, deposits and other receivables (3,051,248) (1,106,129)Decrease in inventories 895,080 61,739Increase in insurance and reinsurance debtors (1,553,931) (400,136)(Increase)/decrease in reinsurers’ share of insurance contract provisions (948,323) 593,063Decrease/(increase) in amounts due from related companies 1,485,096 (1,965,903)(Decrease)/increase in trade and notes payables (332,511) 4,743,676Decrease in accrued liabilities and other payables (2,799,643) (2,043,360)Increase in deferred income 561,934 77,819Increase in other long term payables 237,275 1,209,805Decrease in amounts due to the holding company (313,490) (1,131,826)(Decrease)/increase in amounts due to related companies (835,757) 581,149(Decrease)/increase in deposit from customers (395,432) 59,381(Increase)/decrease in restricted presale proceeds from properties (367,010) 8,010Decrease/(increase) in required reserve deposits 188,383 (53,374)Increase in unearned premium provisions 282,159 193,137Increase in provision for outstanding claims 949,793 187,178Increase/(decrease) in insurance and reinsurance creditors 533,398 (449)(Decrease)/increase in provision for unexpired risks (6,055) 85,813Increase/(decrease) in other life insurance contract liabilities 93,823 (84,727)Increase in investment contract liabilities 3,588,333 6,490,818 CASH GENERATED FROM OPERATIONS 1,047,062 6,036,394
Tax paid (4,467,307) (1,960,024) NET CASH FLOWS (USED IN) GENERATED FROM OPERATING ACTIVITIES (3,420,245) 4,076,370

FOSUN INTERNATIONAL LIMITED Annual Report 2015 111
CONSOLIDATED STATEMENT OF CASH FLOWSYear ended 31 December 2015
2015 2014Notes RMB’000 RMB’000
CASH FLOWS FROM INVESTING ACTIVITIES
Purchase of items of property, plant and equipment (2,965,343) (4,645,610)Increase of prepaid land lease payments (412,939) (83,454)Increase of investment properties (4,034,045) (245,991)Purchase of intangible assets (518,358) (134,036)Purchase of mining rights — (33,544)Purchase of exploration and evaluation assets (135,325) (22,272)Purchase of oil and gas assets (342,417) —Purchase of available-for-sale investments (41,570,491) (22,945,480)Purchase of investments at fair value through profit or loss (5,709,420) (3,489,535)Proceeds from disposal of investments at fair value through profit or loss 6,171,394 5,349,477Proceeds from disposal of available-for-sale investments 39,726,532 30,181,968Proceeds from disposal of items of property, plant and equipment 183,137 214,232Proceeds from disposal of prepaid land lease payments 108,254 —Proceeds from disposal of intangible assets 175,182 28,518Proceeds from disposal of subsidiaries 54(b) 6,114,148 (1,717,729)Proceeds from disposal of associates and disposal of partial interests in associates 5,625,147 550,038Proceeds from disposal of joint ventures 11,272 —Proceeds from disposal of non-current assets held for sale 338,495 —Acquisition of subsidiaries 54(a) (6,114,148) (17,165,586)Acquisition of associates (7,115,114) (4,219,889)Acquisition of joint ventures (918,579) (251,772)Dividends and interests received from available-for-sale investments 2,779,969 1,858,347Dividends and interests received from investments at fair value through profit or loss 461,568 285,776Dividends received from associates 863,159 573,757Dividends received from joint ventures — 10,000Shareholder loans repaid 2,686,208 1,153,856Decrease in pledged bank balances and time deposits with original maturity of more than three months 2,525,353 1,113,224Decrease in restricted cash in escrow account for an investment — 425,961Prepayments for proposed acquisitions of long term asset (1,751,643) (2,743,264)Collection of the prepayment for proposed acquisition of investments or other long term assets 1,331,370 —Proceeds received from consideration adjustments of a subsidiary acquisition — 67,785Interest received 844,599 508,424 NET CASH FLOWS USED IN INVESTING ACTIVITIES (20,512,722) (15,376,799)

FOSUN INTERNATIONAL LIMITED Annual Report 2015112
CONSOLIDATED STATEMENT OF CASH FLOWSYear ended 31 December 2015
2015 2014Notes RMB’000 RMB’000
CASH FLOWS FROM FINANCING ACTIVITIES
Capital element of finance lease rental payments (100,732) (70,076)Capital contribution from non-controlling shareholders of subsidiaries 955,076 4,368,698New bank and other borrowings 97,744,310 69,412,404Repayment of bank and other borrowings (70,984,816) (42,389,766)Dividends paid to non-controlling shareholders of subsidiaries (743,052) (1,223,348)Acquisition of additional interests in subsidiaries (883,201) (2,601,632)Dividends paid to shareholders (501,667) (2,155,820)Rights issue of new shares (net of share issue expenses) 9,537,094 3,872,336Placing of shares 7,268,334 —Interest paid (5,828,772) (4,523,085) NET CASH FLOWS FROM FINANCING ACTIVITIES 36,462,574 24,689,711 NET INCREASE IN CASH AND CASH EQUIVALENTS 12,529,607 13,389,282Cash and cash equivalents at beginning of year 25,890,353 12,501,071 CASH AND CASH EQUIVALENTS AT END OF YEAR 38,419,960 25,890,353 ANALYSIS OF BALANCES OF CASH AND CASH EQUIVALENTS:
CASH AND CASH EQUIVALENTS AS STATED IN THE CONSOLIDATED STATEMENT OF FINANCIAL POSITION 32 38,419,960 25,667,140
Cash and bank attributable to assets of a disposal group classified as held for sale — 223,213 CASH AND CASH EQUIVALENTS AS STATED IN THE CONSOLIDATED STATEMENT OF CASH FLOWS 38,419,960 25,890,353

FOSUN INTERNATIONAL LIMITED Annual Report 2015 113
NOTES TO FINANCIAL STATEMENTSYear ended 31 December 2015
1. CORPORATE AND GROUP INFORMATIONFosun International Limited (the “Company”) was incorporated as a company with limited liability in Hong Kong on 24 December 2004 under the Hong Kong Companies Ordinance.
The registered office of the Company is located at Room 808, ICBC Tower, 3 Garden Road, Central, Hong Kong.
The principal businesses of the Company and its subsidiaries (collectively referred to as the “Group”) include integrated finance (wealth) and industrial operations. The integrated finance (wealth) business includes the four major segments: insurance, investment, wealth management and internet finance while the industrial operations include five key segments: health, happiness, steel, property development and sales, and resources.
The holding company and the ultimate holding company of the Company are Fosun Holdings Limited and Fosun International Holdings Ltd. which are incorporated in Hong Kong and the British Virgin Islands, respectively. The ultimate controlling shareholder is Mr. Guo Guangchang.
The shares of the Company have been listed on the Main Board of the Stock Exchange of Hong Kong Limited (the “Hong Kong Stock Exchange”) since 16 July 2007.
2.1 BASIS OF PRESENTATIONThese financial statements have been prepared in accordance with Hong Kong Financial Reporting Standards (“HKFRSs”) (which include all Hong Kong Financial Reporting Standards, Hong Kong Accounting Standards (“HKASs”) and Interpretations) issued by the Hong Kong Institute of Certified Public Accountants (“HKICPA”), accounting principles generally accepted in Hong Kong and the Hong Kong Companies Ordinance. They have been prepared under the historical cost convention, except for investment properties, derivative financial instruments and certain investments which have been measured at fair value. Non-current assets/assets of a disposal group classified as held for sale are stated at the lower of their carrying amounts and fair values less costs to sell as further explained in note 2.4. These financial statements are presented in Renminbi (“RMB”) and all values are rounded to the nearest thousand except when otherwise indicated.
Basis of consolidationThe consolidated financial statements include the financial statements of the Company and its subsidiaries for the year ended 31 December 2015. A subsidiary is an entity (including a structured entity), directly or indirectly, controlled by the Company. Control is achieved when the Group is exposed, or has rights, to variable returns from its involvement with the investee and has the ability to affect those returns through its power over the investee (i.e., existing rights that give the Group the current ability to direct the relevant activities of the investee).
When the Company has, directly or indirectly, less than a majority of the voting or similar rights of an investee, the Group considers all relevant facts and circumstances in assessing whether it has power over an investee, including:
(a) the contractual arrangement with the other vote holders of the investee;
(b) rights arising from other contractual arrangements; and
(c) the Group’s voting rights and potential voting rights.
The financial statements of the subsidiaries are prepared for the same reporting period as the Company, using consistent accounting policies. The results of subsidiaries are consolidated from the date on which the Group obtains control, and continue to be consolidated until the date that such control ceases.

FOSUN INTERNATIONAL LIMITED Annual Report 2015114
NOTES TO FINANCIAL STATEMENTSYear ended 31 December 2015
2.1 BASIS OF PRESENTATION (Continued)
Basis of consolidation (Continued)
Profit or loss and each component of other comprehensive income are attributed to the owners of the parent of the Group and to the non-controlling interests, even if this results in the non-controlling interests having a deficit balance. All intra-group assets and liabilities, equity, income, expenses and cash flows relating to transactions between members of the Group are eliminated in full on consolidation.
The Group reassesses whether or not it controls an investee if facts and circumstances indicate that there are changes to one or more of the three elements of control described in the accounting policy for subsidiaries below. A change in the ownership interest of a subsidiary, without a loss of control, is accounted for as an equity transaction.
If the Group loses control over a subsidiary, it derecognises (i) the assets (including goodwill) and liabilities of the subsidiary, (ii) the carrying amount of any non-controlling interest and (iii) the cumulative translation differences recorded in equity; and recognises (i) the fair value of the consideration received, (ii) the fair value of any investment retained and (iii) any resulting surplus or deficit in profit or loss. The Group’s share of components previously recognised in other comprehensive income is reclassified to profit or loss or retained profits, as appropriate, on the same basis as would be required if the Group had directly disposed of the related assets or liabilities.
2.2 CHANGES IN ACCOUNTING POLICIES AND DISCLOSURESThe Group has adopted the following revised standards for the first time for the current year’s financial statements.
Amendments to HKAS 19 Defined Benefit Plans: Employee ContributionsAnnual Improvements to HKFRSs 2010-2012 CycleAnnual Improvements to HKFRSs 2011-2013 Cycle
The nature and the impact of each amendment is described below:
(a) Amendments to HKAS 19 apply to contributions from employees or third parties to defined benefit plans. The amendments simplify the accounting for contributions that are independent of the number of years of employee service, for example, employee contributions that are calculated according to a fixed percentage of salary. If the amount of the contributions is independent of the number of years of service, an entity is permitted to recognise such contributions as a reduction of service cost in the period in which the related service is rendered. The amendments have had no significant impact on the Group.
(b) The Annual Improvements to HKFRSs 2010-2012 Cycle issued in January 2014 sets out amendments to a number of HKFRSs. Details of the amendments that are effective for the current year are as follows:
‧ HKFRS 8 Operating Segments: Clarifies that an entity must disclose the judgements made by management in applying the aggregation criteria in HKFRS 8, including a brief description of operating segments that have been aggregated and the economic characteristics used to assess whether the segments are similar. The amendments also clarify that a reconciliation of segment assets to total assets is only required to be disclosed if the reconciliation is reported to the chief operating decision maker. The amendments have had no impact on the Group.
‧ HKAS 16 Property, Plant and Equipment and HKAS 38 Intangible Assets: Clarifies the treatment of gross carrying amount and accumulated depreciation or amortisation of revalued items of property, plant and equipment and intangible assets. The amendments have had no impact on the Group as the Group does not apply the revaluation model for the measurement of these assets.
‧ HKAS 24 Related Party Disclosures : Clarifies that a management entity (i.e., an entity that provides key management personnel services) is a related party subject to related party disclosure requirements. In addition, an entity that uses a management entity is required to disclose the expenses incurred for management services. The amendment has had no impact on the Group as the Group does not receive any management services from other entities.

FOSUN INTERNATIONAL LIMITED Annual Report 2015 115
NOTES TO FINANCIAL STATEMENTSYear ended 31 December 2015
2.2 CHANGES IN ACCOUNTING POLICIES AND DISCLOSURES (Continued)
(c) The Annual Improvements to HKFRSs 2011-2013 Cycle issued in January 2014 sets out amendments to a number of HKFRSs. Details of the amendments that are effective for the current year are as follows:
‧ HKFRS 3 Business Combinations: Clarifies that joint arrangements but not joint ventures are outside the scope of HKFRS 3 and the scope exception applies only to the accounting in the financial statements of the joint arrangement itself. The amendment is applied prospectively. The amendment has had no impact on the Group as the Company is not a joint arrangement and the Group did not form any joint arrangement during the year.
‧ HKFRS 13 Fair Value Measurement: Clarifies that the portfolio exception in HKFRS 13 can be applied not only to financial assets and financial liabilities, but also to other contracts within the scope of HKFRS 9 or HKAS 39 as applicable. The amendment is applied prospectively from the beginning of the annual period in which HKFRS 13 was initially applied. The amendment has had no impact on the Group as the Group does not apply the portfolio exception in HKFRS 13.
‧ HKAS 40 Investment Property : Clarifies that HKFRS 3, instead of the description of ancillary services in HKAS 40 which differentiates between investment property and owner-occupied property, is used to determine if the transaction is a purchase of an asset or a business combination. The amendment is applied prospectively for acquisitions of investment properties. The amendment has had no impact on the Group, as the Group continued to use HKFRS 3 to determine if the transaction is a business combination or a purchase of an asset.
In addition, the requirements of Part 9 “Accounts and Audit” of the Hong Kong Companies Ordinance (Cap. 622) came into effect for the first time during the current financial year. The main impact to the financial statements is on the presentation and disclosure of certain information in the financial statements.
2.3 ISSUED BUT NOT YET EFFECTIVE HONG KONG FINANCIAL REPORTING STANDARDSThe Group has not applied the following new and revised HKFRSs that have been issued but are not yet effective, in these financial statements.
HKFRS 9 Financial Instruments2
Amendments to HKFRS 10 and HKAS 28 (2011) Sale or Contribution of Assets between an Investor and its Associate or Joint Venture4
Amendments to HKFRS 10, HKFRS 12 and HKAS 28 (2011) Investment Entities: Applying the Consolidation Exception1
Amendments to HKFRS 11 Accounting for Acquisitions of Interests in Joint Operations1
HKFRS 14 Regulatory Deferral Accounts3
HKFRS 15 Revenue from Contracts with Customers2
Amendments to HKAS 1 Disclosure Initiative1
Amendments to HKAS 16 and HKAS 38 Clarification of Acceptable Methods of Depreciation and Amortisation1
Amendments to HKAS 16 and HKAS 41 Agriculture: Bearer Plants1
Amendments to HKAS 27 (2011) Equity Method in Separate Financial Statements1
Annual Improvements 2012-2014 Cycle Amendments to a number of HKFRSs1
1 Effective for annual periods beginning on or after 1 January 20162 Effective for annual periods beginning on or after 1 January 20183 Effective for an entity that first adopts HKFRSs for its annual financial statements beginning on or after 1 January 2016 and therefore is not applicable
to the Group4 No mandatory effective date yet determined but is available for adoption

FOSUN INTERNATIONAL LIMITED Annual Report 2015116
NOTES TO FINANCIAL STATEMENTSYear ended 31 December 2015
2.3 ISSUED BUT NOT YET EFFECTIVE HONG KONG FINANCIAL REPORTING STANDARDS (Continued)
Further information about those HKFRSs that are expected to be applicable to the Group is as follows:
In September 2014, the HKICPA issued the final version of HKFRS 9, bringing together all phases of the financial instruments project to replace HKAS 39 and all previous versions of HKFRS 9. The standard introduces new requirements for classification and measurement, impairment and hedge accounting. The Group expects to adopt HKFRS 9 from 1 January 2018. The Group is currently assessing the impact of the standard.
The amendments to HKFRS 10 and HKAS 28 (2011) address an inconsistency between the requirements in HKFRS 10 and in HKAS 28 (2011) in dealing with the sale or contribution of assets between an investor and its associate or joint venture. The amendments require a full recognition of a gain or loss when the sale or contribution of assets between an investor and its associate or joint venture constitutes a business. For a transaction involving assets that do not constitute a business, a gain or loss resulting from the transaction is recognised in the investor’s profit or loss only to the extent of the unrelated investor’s interest in that associate or joint venture. The amendments are to be applied prospectively. The Group is currently assessing the impact of the amendments and the adoption date has not been determined.
The amendments to HKFRS 11 require that an acquirer of an interest in a joint operation in which the activity of the joint operation constitutes a business must apply the relevant principles for business combinations in HKFRS 3. The amendments also clarify that a previously held interest in a joint operation is not remeasured on the acquisition of an additional interest in the same joint operation while joint control is retained. In addition, a scope exclusion has been added to HKFRS 11 to specify that the amendments do not apply when the parties sharing joint control, including the reporting entity, are under common control of the same ultimate controlling party. The amendments apply to both the acquisition of the initial interest in a joint operation and the acquisition of any additional interests in the same joint operation. The amendments are not expected to have any significant impact on the financial position or performance of the Group upon adoption on 1 January 2016.
HKFRS 15 establishes a new five-step model to account for revenue arising from contracts with customers. Under HKFRS 15, revenue is recognised at an amount that reflects the consideration to which an entity expects to be entitled in exchange for transferring goods or services to a customer. The principles in HKFRS 15 provide a more structured approach for measuring and recognising revenue. The standard also introduces extensive qualitative and quantitative disclosure requirements, including disaggregation of total revenue, information about performance obligations, changes in contract asset and liability account balances between periods and key judgements and estimates. The standard will supersede all current revenue recognition requirements under HKFRSs. In September 2015, the HKICPA issued an amendment to HKFRS 15 regarding a one-year deferral of the mandatory effective date of HKFRS 15 to 1 January 2018. The Group expects to adopt HKFRS 15 on 1 January 2018 and is currently assessing the impact of HKFRS 15 upon adoption.
Amendments to HKAS 1 include narrow-focus improvements in respect of the presentation and disclosure in financial statements. The amendments clarify:
(i) the materiality requirements in HKAS 1;
(ii) that specific line items in the statement of profit or loss and the statement of financial position may be disaggregated;
(iii) that entities have flexibility as to the order in which they present the notes to financial statements; and
(iv) that the share of other comprehensive income of associates and joint ventures accounted for using the equity method must be presented in aggregate as a single line item, and classified between those items that will or will not be subsequently reclassified to profit or loss.
Furthermore, the amendments clarify the requirements that apply when additional subtotals are presented in the statement of financial position and the statement of profit or loss. The Group expects to adopt the amendments from 1 January 2016. The amendments are not expected to have any significant impact on the Group’s financial statements.

FOSUN INTERNATIONAL LIMITED Annual Report 2015 117
NOTES TO FINANCIAL STATEMENTSYear ended 31 December 2015
2.3 ISSUED BUT NOT YET EFFECTIVE HONG KONG FINANCIAL REPORTING STANDARDS (Continued)
Amendments to HKAS 16 and HKAS 38 clarify the principle in HKAS 16 and HKAS 38 that revenue reflects a pattern of economic benefits that are generated from operating business (of which the asset is part) rather than the economic benefits that are consumed through the use of the asset. As a result, a revenue-based method cannot be used to depreciate property, plant and equipment and may only be used in very limited circumstances to amortise intangible assets. The amendments are to be applied prospectively. The amendments are not expected to have any impact on the financial position or performance of the Group upon adoption on 1 January 2016 as the Group has not used a revenue-based method for the calculation of depreciation of its non-current assets.
2.4 SUMMARY OF SIGNIFICANT ACCOUNTING POLICIESInvestments in associates and joint venturesAn associate is an entity in which the Group has a long term interest of generally not less than 20% of the equity voting rights and over which it is in a position to exercise significant influence. Significant influence is the power to participate in the financial and operating policy decisions of the investee, but is not control or joint control over those policies.
A joint venture is a type of joint arrangement whereby the parties that have joint control of the arrangement have rights to the net assets of the joint venture. Joint control is the contractually agreed sharing of control of an arrangement, which exists only when decisions about the relevant activities require the unanimous consent of the parties sharing control.
The Group’s investments in associates and joint ventures are stated in the consolidated statement of financial position at the Group’s share of net assets under the equity method of accounting, less any impairment losses. Adjustments are made to bring into line any dissimilar accounting policies that may exist.
The Group’s share of the post-acquisition results and other comprehensive income of associates and joint ventures is included in the consolidated statement of profit or loss and consolidated other comprehensive income, respectively. In addition, when there has been a change recognised directly in the equity of the associate or joint venture, the Group recognises its share of any changes, when applicable, in the consolidated statement of changes in equity. Unrealised gains and losses resulting from transactions between the Group and its associates or joint ventures are eliminated to the extent of the Group’s investments in the associates or joint ventures, except where unrealised losses provide evidence of an impairment of the assets transferred. Goodwill arising from the acquisition of associates or joint ventures is included as part of the Group’s investments in associates or joint ventures.
If an investment in an associate becomes an investment in a joint venture or vice versa, the retained interest is not remeasured. Instead, the investment continues to be accounted for under the equity method. In all other cases, upon loss of significant influence over the associate or joint control over the joint venture, the Group measures and recognises any retained investment at its fair value. Any difference between the carrying amount of the associate or joint venture upon loss of significant influence or joint control and the fair value of the retained investment and proceeds from disposal is recognised in profit or loss.
When an investment in an associate or a joint venture is classified as held for sale, it is accounted for in accordance with HKFRS 5 Non-current Assets Held for Sale and Discontinued Operations.

FOSUN INTERNATIONAL LIMITED Annual Report 2015118
NOTES TO FINANCIAL STATEMENTSYear ended 31 December 2015
2.4 SUMMARY OF SIGNIFICANT ACCOUNTING POLICIES (Continued)
Interests in joint operationsA joint operation is a joint arrangement whereby the parties that have joint control of the arrangement have rights to the assets, and obligations for the liabilities, relating to the arrangement. (Include the definition of joint control if not defined elsewhere in other accounting policy notes) Joint control is the contractually agreed sharing of control of an arrangement, which exists only when decisions about the relevant activities require the unanimous consent of the parties sharing control.
The Group recognises in relation to its interest in a joint operation:
‧ its assets, including its share of any assets held jointly;
‧ its liabilities, including its share of any liabilities incurred jointly;
‧ its revenue from the sale of its share of the output arising from the joint operation;
‧ its share of the revenue from the sale of the output by the joint operation; and
‧ its expenses, including its share of any expenses incurred jointly.
The assets, liabilities, revenues and expenses relating to the Group’s interest in a joint operation are accounted for in accordance with the HKFRSs applicable to the particular assets, liabilities, revenues and expenses.
Business combinations and goodwillBusiness combinations are accounted for using the acquisition method. The consideration transferred is measured at the acquisition date fair value which is the sum of the acquisition date fair values of assets transferred by the Group, liabilities assumed by the Group to the former owners of the acquiree and the equity interests issued by the Group in exchange for control of the acquiree. For each business combination, the Group elects whether to measure the non-controlling interests in the acquiree that are present ownership interests and entitle their holders to a proportionate share of net assets in the event of liquidation at fair value or at the proportionate share of the acquiree’s identifiable net assets. All other components of non-controlling interests are measured at fair value. Acquisition-related costs are expensed as incurred.
When the Group acquires a business, it assesses the financial assets and liabilities assumed for appropriate classification and designation in accordance with the contractual terms, economic circumstances and pertinent conditions as at the acquisition date. This includes the separation of embedded derivatives in host contracts of the acquiree.
If the business combination is achieved in stages, the previously held equity interest is remeasured at its acquisition date fair value and any resulting gain or loss is recognised in profit or loss.
Any contingent consideration to be transferred by the acquirer is recognised at fair value at the acquisition date. Contingent consideration classified as an asset or liability is measured at fair value with changes in fair value recognised in profit or loss. Contingent consideration that is classified as equity is not remeasured and subsequent settlement is accounted for within equity.
Goodwill is initially measured at cost, being the excess of the aggregate of the consideration transferred, the amount recognised for non-controlling interests and any fair value of the Group’s previously held equity interests in the acquiree over the identifiable net assets acquired and liabilities assumed. If the sum of this consideration and other items is lower than the fair value of the net assets acquired, the difference is, after reassessment, recognised in profit or loss as a gain on bargain purchase.
After initial recognition, goodwill is measured at cost less any accumulated impairment losses. Goodwill is tested for impairment annually or more frequently if events or changes in circumstances indicate that the carrying value may be impaired. The Group performs its annual impairment test of goodwill as at 31 December. For the purpose of impairment testing, goodwill acquired in a business combination is, from the acquisition date, allocated to each of the Group’s cash-generating units, or groups of cash-generating units, that are expected to benefit from the synergies of the combination, irrespective of whether other assets or liabilities of the Group are assigned to those units or groups of units.

FOSUN INTERNATIONAL LIMITED Annual Report 2015 119
NOTES TO FINANCIAL STATEMENTSYear ended 31 December 2015
2.4 SUMMARY OF SIGNIFICANT ACCOUNTING POLICIES (Continued)
Business combinations and goodwill (Continued)
Impairment is determined by assessing the recoverable amount of the cash-generating unit (group of cash-generating units), to which the goodwill relates. Where the recoverable amount of the cash-generating unit (group of cash-generating units) is less than the carrying amount, an impairment loss is recognised. An impairment loss recognised for goodwill is not reversed in a subsequent period.
Where goodwill has been allocated to a cash-generating unit (or group of cash-generating units) and part of the operation within that unit is disposed of, the goodwill associated with the operation disposed of is included in the carrying amount of the operation when determining the gain or loss on the disposal. Goodwill disposed of in these circumstances is measured based on the relative value of the operation disposed of and the portion of the cash-generating unit retained.
Fair value measurementThe Group measures its investment properties, derivative financial instruments and equity investments at fair value at the end of each reporting period. Fair value is the price that would be received to sell an asset or paid to transfer a liability in an orderly transaction between market participants at the measurement date. The fair value measurement is based on the presumption that the transaction to sell the asset or transfer the liability takes place either in the principal market for the asset or liability, or in the absence of a principal market, in the most advantageous market for the asset or liability. The principal or the most advantageous market must be accessible by the Group. The fair value of an asset or a liability is measured using the assumptions that market participants would use when pricing the asset or liability, assuming that market participants act in their economic best interest.
A fair value measurement of a non-financial asset takes into account a market participant’s ability to generate economic benefits by using the asset in its highest and best use or by selling it to another market participant that would use the asset in its highest and best use.
The Group uses valuation techniques that are appropriate in the circumstances and for which sufficient data are available to measure fair value, maximising the use of relevant observable inputs and minimising the use of unobservable inputs.
All assets and liabilities for which fair value is measured or disclosed in the financial statements are categorised within the fair value hierarchy, described as follows, based on the lowest level input that is significant to the fair value measurement as a whole:
Level 1 – based on quoted prices (unadjusted) in active markets for identical assets or liabilities
Level 2 – based on valuation techniques for which the lowest level input that is significant to the fair value measurement is observable, either directly or indirectly
Level 3 – based on valuation techniques for which the lowest level input that is significant to the fair value measurement is unobservable
For assets and liabilities that are recognised in the financial statements on a recurring basis, the Group determines whether transfers have occurred between levels in the hierarchy by reassessing categorisation (based on the lowest level input that is significant to the fair value measurement as a whole) at the end of each reporting period.

FOSUN INTERNATIONAL LIMITED Annual Report 2015120
NOTES TO FINANCIAL STATEMENTSYear ended 31 December 2015
2.4 SUMMARY OF SIGNIFICANT ACCOUNTING POLICIES (Continued)
Impairment of non-financial assetsWhere an indication of impairment exists, or when annual impairment testing for an asset is required (other than inventories, properties under development, completed properties for sale, financial assets, deferred tax assets, investment properties and non-current asset/assets of a disposal group classified as held for sale), the asset’s recoverable amount is estimated. An asset’s recoverable amount is the higher of the asset’s or cash-generating unit’s value in use and its fair value less costs of disposal, and is determined for an individual asset, unless the asset does not generate cash inflows that are largely independent of those from other assets or groups of assets, in which case the recoverable amount is determined for the cash-generating unit to which the asset belongs.
An impairment loss is recognised only if the carrying amount of an asset exceeds its recoverable amount. In assessing value in use, the estimated future cash flows are discounted to their present value using a pre-tax discount rate that reflects current market assessments of the time value of money and the risks specific to the asset. An impairment loss is charged to the consolidated statement of profit or loss in the period in which it arises in those expense categories consistent with the function of the impaired asset.
An assessment is made at the end of each reporting period as to whether there is an indication that previously recognised impairment losses may no longer exist or may have decreased. If such an indication exists, the recoverable amount is estimated. A previously recognised impairment loss of an asset other than goodwill is reversed only if there has been a change in the estimates used to determine the recoverable amount of that asset, but not to an amount higher than the carrying amount that would have been determined (net of any depreciation/amortisation) had no impairment loss been recognised for the asset in prior years. A reversal of such an impairment loss is credited to the consolidated statement of profit or loss in the period in which it arises.
Related partiesA party is considered to be related to the Group if:
(a) the party is a person or a close member of that person’s family and that person
(i) has control or joint control over the Group;
(ii) has significant influence over the Group; or
(iii) is a member of the key management personnel of the Group or of a parent of the Group;
or
(b) the party is an entity where any of the following conditions applies:
(i) the entity and the Group are members of the same group;
(ii) one entity is an associate or joint venture of the other entity (or of a parent, subsidiary or fellow subsidiary of the other entity);
(iii) the entity and the Group are joint ventures of the same third party;
(iv) one entity is a joint venture of a third entity and the other entity is an associate of the third entity;
(v) the entity is a post-employment benefit plan for the benefit of employees of either the Group or an entity related to the Group;
(vi) the entity is controlled or jointly controlled by a person identified in (a);
(vii) a person identified in (a) (i) has significant influence over the entity or is a member of the key management personnel of the entity (or of a parent of the entity); and
(viii) the entity, or any member of a group of which it is a part, provides key management personnel services to the Group or to the parent of the Group.

FOSUN INTERNATIONAL LIMITED Annual Report 2015 121
NOTES TO FINANCIAL STATEMENTSYear ended 31 December 2015
2.4 SUMMARY OF SIGNIFICANT ACCOUNTING POLICIES (Continued)
Property, plant and equipment and depreciationProperty, plant and equipment, other than construction in progress, are stated at cost less accumulated depreciation and any impairment losses. When an item of property, plant and equipment is classified as held for sale or when it is part of a disposal group classified as held for sale, it is not depreciated and is accounted for in accordance with HKFRS 5, as further explained in the accounting policy for “Non-current assets and disposal groups held for sale”. The cost of an item of property, plant and equipment comprises its purchase price and any directly attributable costs of bringing the asset to its working condition and location for its intended use.
Expenditure incurred after items of property, plant and equipment have been put into operation, such as repairs and maintenance, is normally charged to the consolidated statement of profit or loss in the period in which it is incurred. In situations where the recognition criteria are satisfied, the expenditure for a major inspection is capitalised in the carrying amount of the asset as a replacement. Where significant parts of property, plant and equipment are required to be replaced at intervals, the Group recognises such parts as individual assets with specific useful lives and depreciates them accordingly.
Depreciation is calculated on the straight-line basis to write off the cost of each item of property, plant and equipment to its residual value over its estimated useful life. The estimated useful lives of property, plant and equipment are as follows:
Buildings 5 to 50 yearsPlant and machinery 4 to 16 yearsOffice equipment 2 to 15 yearsMotor vehicles 4 to 12 yearsLeasehold improvements The shorter of the lease terms and their useful livesFreehold land Not depreciated
Depreciation of mining infrastructure included in property, plant and equipment is calculated using the units of production basis to write off the cost of the asset proportionately to the extraction of the proven and probable mineral reserves.
Where parts of an item of property, plant and equipment have different useful lives, the cost of that item is allocated on a reasonable basis among the parts and each part is depreciated separately. Residual values, useful lives and the depreciation method are reviewed, and adjusted if appropriate, at least at each financial year end.
An item of property, plant and equipment including any significant part initially recognised is derecognised upon disposal or when no future economic benefits are expected from its use or disposal. Any gain or loss on disposal or retirement recognised in the consolidated statement of profit or loss in the year the asset is derecognised is the difference between the net sales proceeds and the carrying amount of the relevant asset.
Construction in progress represents buildings, plant and machinery under construction or installation and testing, which is stated at cost less any impairment losses, and is not depreciated. Cost comprises the direct costs of construction or installation and testing and capitalised borrowing costs on related borrowed funds during the period of construction. Construction in progress is reclassified to the appropriate category of property, plant and equipment when completed and ready for use.

FOSUN INTERNATIONAL LIMITED Annual Report 2015122
NOTES TO FINANCIAL STATEMENTSYear ended 31 December 2015
2.4 SUMMARY OF SIGNIFICANT ACCOUNTING POLICIES (Continued)
Investment propertiesInvestment properties are interests in land and buildings held to earn rental income and/or for capital appreciation, rather than for use in the production or supply of goods or services or for administrative purposes; or for sale in the ordinary course of business. Such properties are measured initially at cost, including transaction costs. Subsequent to initial recognition, investment properties are stated at fair value, which reflects market conditions at the end of the reporting period.
Gains or losses arising from changes in the fair values of investment properties are included in the consolidated statement of profit or loss in the year in which they arise.
Any gains or losses on the retirement or disposal of an investment property are recognised in the consolidated statement of profit or loss in the year of the retirement or disposal.
For a transfer from investment properties to owner-occupied properties or properties under development, the deemed cost of a property for subsequent accounting is its fair value at the date of change in use. For a transfer from properties under development to investment properties, any difference between the fair value of the property at that date and its previous carrying amount is recognised in the consolidated statement of profit or loss.
Non-current assets and disposal groups held for saleNon-current assets and disposal groups are classified as held for sale if their carrying amounts will be recovered principally through a sales transaction rather than through continuing use. For this to be the case, the asset or disposal group must be available for immediate sale in its present condition subject only to terms that are usual and customary for the sale of such assets or disposal groups and its sale must be highly probable. All assets and liabilities of a subsidiary classified as a disposal group are reclassified as held for sale regardless of whether the Group retains a non-controlling interest in its former subsidiary after the sale.
Non-current assets and disposal groups (other than investment properties, deferred tax assets and financial assets) classified as held for sale are measured at the lower of their carrying amounts and fair values less costs to sell. Property, plant and equipment and intangible assets classified as held for sale are not depreciated or amortised.
Intangible assets (other than goodwill)Intangible assets acquired separately are measured on initial recognition at cost. The cost of intangible assets acquired in a business combination is the fair value at the date of acquisition. The useful lives of intangible assets are assessed to be either finite or indefinite. Intangible assets with finite lives are subsequently amortised over the useful economic life and assessed for impairment whenever there is an indication that the intangible asset may be impaired. The amortisation period and the amortisation method for an intangible asset with a finite useful life are reviewed at least at each financial year end.
Intangible assets with indefinite useful lives are tested for impairment annually either individually or at the cash-generating unit level. Such intangible assets are not amortised. The useful lives of an intangible asset with an indefinite life is reviewed annually to determine whether the indefinite life assessment continues to be supportable. If not, the change in the useful life assessment from indefinite to finite is accounted for on a prospective basis.
TrademarksTrademarks with finite useful lives are stated at cost less any impairment losses and are amortised on the straight-line basis over the respective estimated useful lives of not exceeding 25 years. Trademarks with indefinite useful lives are tested for impairment annually either individually or at the cash-generating unit level. Such intangible assets are not amortised. The useful lives of trademarks are reviewed annually to determine whether the indefinite life assessment continues to be supportable. If not, the change in the useful life assessment from indefinite to finite is accounted for on a prospective basis.

FOSUN INTERNATIONAL LIMITED Annual Report 2015 123
NOTES TO FINANCIAL STATEMENTSYear ended 31 December 2015
2.4 SUMMARY OF SIGNIFICANT ACCOUNTING POLICIES (Continued)
Intangible assets (other than goodwill) (Continued)
Medicine licencesMedicine licences with indefinite useful lives are tested for impairment annually either individually or at the cash-generating unit level. Such intangible assets are not amortised. The useful lives of medicine licences are reviewed annually to determine whether the indefinite life assessment continues to be supportable. If not, the change in the useful life assessment from indefinite to finite is accounted for on a prospective basis.
Patents and technical know-howPurchased patents and technical know-how are stated at cost less any impairment losses and are amortised on the straight-line basis over the respective estimated useful lives not exceeding 20 years.
Business networkBusiness network is stated at cost less any impairment losses and is amortised on the straight-line basis over its estimated useful life of not exceeding 15 years.
Research and development costsAll research costs are charged to the consolidated statement of profit or loss as incurred.
Expenditure incurred on projects to develop new products is capitalised and deferred only when the Group can demonstrate the technical feasibility of completing the intangible asset so that it will be available for use or sale, its intention to complete and its ability to use or sell the asset, how the asset will generate future economic benefits, the availability of resources to complete the project and the ability to measure reliably the expenditure during the development. Product development expenditure which does not meet these criteria is expensed when incurred.
Deferred development costs are stated at cost less any impairment losses and are amortised using the straight-line basis over the commercial lives of the underlying products not exceeding five to seven years, commencing from the date when the products are put into commercial production.
Customer relationshipCustomer relationship is stated at cost less any impairment losses and is amortised on the straight-line basis over its estimated useful life of not exceeding 22 years.
Exploration and evaluation assetsFor mining rightsExploration and evaluation assets are stated at cost less impairment losses. Exploration and evaluation assets include topographical and geological surveys, exploratory drilling, sampling and trenching and activities in relation to commercial and technical feasibility studies, and expenditure incurred to secure further mineralisation in existing ore bodies and to expand the capacity of a mine. Expenditure incurred prior to accruing legal rights to explore an area is written off as incurred. When it can be reasonably ascertained that a mining property is capable of commercial production, exploration and evaluation costs are transferred to mining rights and are amortised on the units of production (“UOP”) method based on the proven and probable mineral reserves. If any project is abandoned during the evaluation stage, the total expenditure thereon will be written off.

FOSUN INTERNATIONAL LIMITED Annual Report 2015124
NOTES TO FINANCIAL STATEMENTSYear ended 31 December 2015
2.4 SUMMARY OF SIGNIFICANT ACCOUNTING POLICIES (Continued)
Exploration and evaluation assets (Continued)
For oil and gas assetsExploration and evaluation expenditure in respect of each area of interest is accounted for using the successful efforts method of accounting. An area of interest refers to an individual geological area which is considered to constitute a favourable environment for the presence of an oil or gas field, usually represented by an individual oil or gas field.
The successful efforts method requires all exploration and evaluation expenditure in relation to an area of interest to be expensed in the period it is incurred, except the costs of successful wells, the costs of acquiring interests in new exploration assets and pre-development costs where the rights to the tenure of the area of interest are current and the expenditure either:
– is expected to be recovered through sale or successful development and exploitation of the area of interest; or
– relates to an exploration discovery for which at balance date a reasonable assessment of the existence or otherwise of economically recoverable reserves is not yet completed, or additional appraisal work is underway or planned.
Pending assessment of the results of a well, the costs are initially capitalised then expensed or remain capitalised, depending on a review of the results in accordance with successful efforts accounting criteria. When an oil or gas field has been approved for development, the accumulated exploration and evaluation costs are transferred to oil and gas assets.
Mining rightsMining rights are stated at cost less accumulated amortisation and any impairment losses. Mining rights include the cost of acquiring mining licences, exploration and evaluation costs transferred from exploration rights and assets upon determination that an exploration property is capable of commercial production, and the cost of acquiring interests in the mining reserves of existing mining properties. The mining rights are amortised over the estimated useful lives of the mines, in accordance with the production plans of the entities concerned and the proven and probable reserves of the mines using the UOP method. Mining rights are written off to the consolidated statement of profit or loss if the mining property is abandoned.
Oil and gas assetsDevelopment expenditure is stated at cost less accumulated depletion and any impairment in value. Where commercial production in an area of interest has commenced, the associated costs together with any forecast future capital expenditure necessary to develop proved and probable reserves are amortised over the estimated economic life of the field, on a unit-of-production basis. Costs are amortised only once production begins. Changes in factors such as estimates of proved and probable reserves that affect unit-of-production calculations do not give rise to prior year financial period adjustments and are dealt with on a prospective basis.
LeasesLeases that transfer substantially all the rewards and risks of ownership of assets to the Group, other than legal title, are accounted for as finance leases. At the inception of a finance lease, the cost of the leased asset is capitalised at the present value of the minimum lease payments and recorded together with the obligation, excluding the interest element, to reflect the purchase and financing. Assets held under capitalised finance leases, including prepaid land lease payments under finance leases, are included in property, plant and equipment and depreciated over the shorter of the lease terms and the estimated useful lives of the assets. The finance costs of such leases are charged to the consolidated statement of profit or loss so as to provide a constant periodic rate of charge over the lease terms.
Assets acquired through hire purchase contracts of a financing nature are accounted for as finance leases, but are depreciated over their estimated useful lives.

FOSUN INTERNATIONAL LIMITED Annual Report 2015 125
NOTES TO FINANCIAL STATEMENTSYear ended 31 December 2015
2.4 SUMMARY OF SIGNIFICANT ACCOUNTING POLICIES (Continued)
Leases (Continued)
Leases where substantially all the rewards and risks of ownership of assets remain with the lessor are accounted for as operating leases. Where the Group is the lessor, assets leased by the Group under operating leases are included in non-current assets, and rentals receivable under operating leases are credited to the consolidated statement of profit or loss on the straight-line basis over the lease terms. Where the Group is the lessee, rentals payable under operating leases net of any incentives received from the lessor are charged to the consolidated statement of profit or loss on the straight-line basis over the lease terms.
Prepaid land lease payments under operating leases are initially stated at cost and subsequently recognised on the straight-line basis over the lease terms.
Investments and other financial assetsInitial recognition and measurementFinancial assets are classified, at initial recognition, as financial assets at fair value through profit or loss, loans and receivables and available-for-sale financial investments, as appropriate. When financial assets are recognised initially, they are measured at fair value, plus transaction costs that are attributable to the acquisition of the financial assets, except in the case of financial assets recorded at fair value through profit or loss.
All regular way purchases and sales of financial assets are recognised on the trade date, that is, the date that the Group commits to purchase or sell the asset. Regular way purchases or sales are purchases or sales of financial assets that require delivery of assets within the period generally established by regulation or convention in the marketplace.
Subsequent measurementThe subsequent measurement of financial assets depends on their classification as follows:
Financial assets at fair value through profit or lossFinancial assets at fair value through profit or loss include financial assets held for trading and financial assets designated upon initial recognition as at fair value through profit or loss. Financial assets are classified as held for trading if they are acquired for the purpose of sale in the near term. Derivatives, including separated embedded derivatives, are also classified as held for trading unless they are designated as effective hedging instruments as defined by HKAS 39.
Financial assets at fair value through profit or loss are carried in the consolidated statement of financial position at fair value with positive net changes in fair value presented as other income and gains and negative net changes in fair value presented as other expenses in the consolidated statement of profit or loss. These net fair value changes do not include any dividends or interest earned on these financial assets, which are recognised in accordance with the policies set out for “Revenue recognition” below.
Financial assets designated upon initial recognition as at fair value through profit or loss are designated at the date of initial recognition and only if the criteria in HKAS 39 are satisfied.
Loans and receivablesLoans and receivables are non-derivative financial assets with fixed or determinable payments that are not quoted in an active market. After initial measurement, such assets are subsequently measured at amortised cost using the effective interest rate method less any allowance for impairment. Amortised cost is calculated by taking into account any discount or premium on acquisition and includes fees or costs that are an integral part of the effective interest rate. The effective interest rate amortisation is included in other income and gains in the consolidated statement of profit or loss. The loss arising from impairment is recognised in the consolidated statement of profit or loss in finance costs for loans and in other expenses for receivables.

FOSUN INTERNATIONAL LIMITED Annual Report 2015126
NOTES TO FINANCIAL STATEMENTSYear ended 31 December 2015
2.4 SUMMARY OF SIGNIFICANT ACCOUNTING POLICIES (Continued)
Investments and other financial assets (Continued)
Available-for-sale financial investmentsAvailable-for-sale financial investments are non-derivative financial assets in listed and unlisted equity and debt investments. Equity investments classified as available for sale are those which are neither classified as held for trading nor designated as at fair value through profit or loss. Debt securities in this category are those which are intended to be held for an indefinite period of time and which may be sold in response to needs for liquidity or in response to changes in market conditions.
After initial recognition, available-for-sale financial investments are subsequently measured at fair value, with unrealised gains or losses recognised as other comprehensive income in the available-for-sale investment revaluation reserve until the investment is derecognised, at which time the cumulative gain or loss is recognised in the consolidated statement of profit or loss in other income, or until the investment is determined to be impaired, when the cumulative gain or loss is reclassified from the available-for-sale investment revaluation reserve to the consolidated statement of profit or loss in other gains or losses. Interest and dividends earned whilst holding the available-for-sale financial investments are reported as interest income and dividend income, respectively and are recognised in the consolidated statement of profit or loss as other income in accordance with the policies set out for “Revenue recognition” below.
When the fair value of unlisted equity investments cannot be reliably measured because (a) the variability in the range of reasonable fair value estimates is significant for that investment or (b) the probabilities of the various estimates within the range cannot be reasonably assessed and used in estimating fair value, such investments are stated at cost less any impairment losses.
The Group evaluates whether the ability and intention to sell its available-for-sale financial assets in the near term are still appropriate. When, in rare circumstances, the Group is unable to trade these financial assets due to inactive markets, the Group may elect to reclassify these financial assets if management has the ability and intention to hold the assets for the foreseeable future or until maturity.
For a financial asset reclassified from the available-for-sale category, the fair value carrying amount at the date of reclassification becomes its new amortised cost and any previous gain or loss on that asset that has been recognised in equity is amortised to profit or loss over the remaining life of the investment using the effective interest rate. Any difference between the new amortised cost and the maturity amount is also amortised over the remaining life of the asset using the effective interest rate. If the asset is subsequently determined to be impaired, then the amount recorded in equity is reclassified to the consolidated statement of profit or loss.
Derecognition of financial assetsA financial asset (or, where applicable, a part of a financial asset or part of a group of similar financial assets) is primarily derecognised (i.e., removed from the Group’s consolidated statement of financial position) when:
• the rights to receive cash flows from the asset have expired; or
• the Group has transferred its rights to receive cash flows from the asset or has assumed an obligation to pay the received cash flows in full without material delay to a third party under a “pass-through” arrangement; and either (a) the Group has transferred substantially all the risks and rewards of the asset, or (b) the Group has neither transferred nor retained substantially all the risks and rewards of the asset, but has transferred control of the asset.
When the Group has transferred its rights to receive cash flows from an asset or has entered into a pass-through arrangement, it evaluates if and to what extent it has retained the risk and rewards of ownership of the asset. When it has neither transferred nor retained substantially all the risks and rewards of the asset nor transferred control of the asset, the Group continues to recognise the transferred asset to the extent of the Group’s continuing involvement. In that case, the Group also recognises an associated liability. The transferred asset and the associated liability are measured on a basis that reflects the rights and obligations that the Group has retained.
Continuing involvement that takes the form of a guarantee over the transferred asset is measured at the lower of the original carrying amount of the asset and the maximum amount of consideration that the Group could be required to repay.

FOSUN INTERNATIONAL LIMITED Annual Report 2015 127
NOTES TO FINANCIAL STATEMENTSYear ended 31 December 2015
2.4 SUMMARY OF SIGNIFICANT ACCOUNTING POLICIES (Continued)
Impairment of financial assetsThe Group assesses at the end of each reporting period whether there is objective evidence that a financial asset or a group of financial assets is impaired. An impairment exists if one or more events that occurred after the initial recognition of the asset have an impact on the estimated future cash flows of the financial asset or the group of financial assets that can be reliably estimated. Evidence of impairment may include indications that a debtor or a group of debtors is experiencing significant financial difficulty, default or delinquency in interest or principal payments, the probability that they will enter bankruptcy or other financial reorganisation and observable data indicating that there is a measurable decrease in the estimated future cash flows, such as changes in arrears or economic conditions that correlate with defaults.
Financial assets carried at amortised costFor financial assets carried at amortised cost, the Group first assesses whether impairment exists individually for financial assets that are individually significant, or collectively for financial assets that are not individually significant. If the Group determines that no objective evidence of impairment exists for an individually assessed financial asset, whether significant or not, it includes the asset in a group of financial assets with similar credit risk characteristics and collectively assesses them for impairment. Assets that are individually assessed for impairment and for which an impairment loss is, or continues to be, recognised are not included in a collective assessment of impairment.
The amount of any impairment loss identified is measured as the difference between the asset’s carrying amount and the present value of estimated future cash flows (excluding future credit losses that have not yet been incurred). The present value of the estimated future cash flows is discounted at the financial asset’s original effective interest rate (i.e., the effective interest rate computed at initial recognition).
The carrying amount of the asset is reduced through the use of an allowance account and the loss is recognised in the consolidated statement of profit or loss. Interest income continues to be accrued on the reduced carrying amount using the rate of interest used to discount the future cash flows for the purpose of measuring the impairment loss. Loans and receivables together with any associated allowance are written off when there is no realistic prospect of future recovery and all collateral has been realised or has been transferred to the Group.
If, in a subsequent period, the amount of the estimated impairment loss increases or decreases because of an event occurring after the impairment was recognised, the previously recognised impairment loss is increased or reduced by adjusting the allowance account. If a write-off is later recovered, the recovery is credited to other expenses in the consolidated statement of profit or loss.
Assets carried at costIf there is objective evidence that an impairment loss has been incurred on an unquoted equity instrument that is not carried at fair value because its fair value cannot be reliably measured, the amount of the loss is measured as the difference between the asset’s carrying amount and the present value of estimated future cash flows discounted at the current market rate of return for a similar financial asset. Impairment losses on these assets are not reversed.

FOSUN INTERNATIONAL LIMITED Annual Report 2015128
NOTES TO FINANCIAL STATEMENTSYear ended 31 December 2015
2.4 SUMMARY OF SIGNIFICANT ACCOUNTING POLICIES (Continued)
Impairment of financial assets (Continued)
Available-for-sale financial investmentsFor available-for-sale financial investments, the Group assesses at the end of each reporting period whether there is objective evidence that an investment or a group of investments is impaired.
If an available-for-sale investment is impaired, an amount comprising the difference between its cost (net of any principal payment and amortisation) and its current fair value, less any impairment loss previously recognised in the consolidated statement of profit or loss, is removed from other comprehensive income and recognised in the consolidated statement of profit or loss.
In the case of equity investments classified as available for sale, objective evidence would include a significant or prolonged decline in the fair value of an investment below its cost. “Significant” is evaluated against the original cost of the investment and “prolonged” against the period in which the fair value has been below its original cost. Where there is evidence of impairment, the cumulative loss – measured as the difference between the acquisition cost and the current fair value, less any impairment loss on that investment previously recognised in the consolidated statement of profit or loss – is removed from other comprehensive income and recognised in the consolidated statement of profit or loss. Impairment losses on equity instruments classified as available for sale are not reversed through the consolidated statement of profit or loss. Increases in their fair value after impairment are recognised directly in other comprehensive income.
The determination of what is “significant” or “prolonged” requires judgement. In making this judgement, the Group evaluates, among other factors, the duration or extent to which the fair value of an investment is less than its cost.
In the case of debt instruments classified as available for sale, impairment is assessed based on the same criteria as financial assets carried at amortised cost. However, the amount recorded for impairment is the cumulative loss measured as the difference between the amortised cost and the current fair value, less any impairment loss on that investment previously recognised in the statement of profit or loss. Future interest income continues to be accrued based on the reduced carrying amount of the asset and is accrued using the rate of interest used to discount the future cash flows for the purpose of measuring the impairment loss. The interest income is recorded as part of finance income. Impairment losses on debt instruments are reversed through the statement of profit or loss if the subsequent increase in fair value of the instruments can be objectively related to an event occurring after the impairment loss was recognised in the statement of profit or loss.
Financial liabilitiesInitial recognition and measurementFinancial liabilities are classified, at initial recognition, as financial liabilities at fair value through profit or loss, or loans and borrowings, as appropriate.
All financial liabilities are recognised initially at fair value and, in the case of loans and borrowings, net of directly attributable transaction costs.
The Group’s financial liabilities include trade and notes payables, accrued liabilities and other payables, due to the holding company, due to related companies, loans from related companies, finance lease payables, other long term payables, convertible bonds and interest-bearing bank and other borrowings.
Subsequent measurementThe subsequent measurement of financial liabilities depends on their classification as follows:

FOSUN INTERNATIONAL LIMITED Annual Report 2015 129
NOTES TO FINANCIAL STATEMENTSYear ended 31 December 2015
2.4 SUMMARY OF SIGNIFICANT ACCOUNTING POLICIES (Continued)
Financial liabilities (Continued)
Financial liabilities at fair value through profit or lossFinancial liabilities at fair value through profit or loss include financial liabilities held for trading and financial liabilities designated upon initial recognition as at fair value through profit or loss.
Financial liabilities are classified as held for trading if they are acquired for the purpose of repurchasing in the near term. This category includes derivative financial instruments entered into by the Group that are not designated as hedging instruments in hedge relationships as defined by HKAS 39. Separated embedded derivatives are also classified as held for trading unless they are designated as effective hedging instruments. Gains or losses on liabilities held for trading are recognised in the consolidated statement of profit or loss. The net fair value gain or loss recognised in the consolidated statement of profit or loss does not include any interest charged on these financial liabilities.
Financial liabilities designated upon initial recognition at fair value through profit or loss are designated at the date of initial recognition and only if the criteria in HKAS 39 are satisfied.
Loans and borrowingsAfter initial recognition, interest-bearing loans and borrowings are subsequently measured at amortised cost, using the effective interest rate method unless the effect of discounting would be immaterial, in which case they are stated at cost. Gains and losses are recognised in the consolidated statement of profit or loss when the liabilities are derecognised as well as through the effective interest rate amortisation process.
Amortised cost is calculated by taking into account any discount or premium on acquisition and fees or costs that are an integral part of the effective interest rate. The effective interest rate amortisation is included in finance costs in the consolidated statement of profit or loss.
Financial guarantee contractsFinancial guarantee contracts issued by the Group are those contracts that require a payment to be made to reimburse the holder for a loss it incurs because the specified debtor fails to make a payment when due in accordance with the terms of a debt instrument. A financial guarantee contract is recognised initially as a liability at its fair value, adjusted for transaction costs that are directly attributable to the issuance of the guarantee. Subsequent to initial recognition, the Group measures the financial guarantee contract at the higher of: (i) the amount of the best estimate of the expenditure required to settle the present obligation at the end of the reporting period; and (ii) the amount initially recognised less, when appropriate, cumulative amortisation.
Convertible bondsThe component of convertible bonds that exhibits characteristics of a liability is recognised as a liability in the statement of financial position, net of transaction costs. On issuance of convertible bonds, the fair value of the liability component is determined using a market rate for an equivalent non-convertible bond; and this amount is carried as a long term liability on the amortised cost basis until extinguished on conversion or redemption. The remainder of the proceeds is allocated to the conversion option that is recognised and included in shareholders’ equity, net of transaction costs. The carrying amount of the conversion option is not remeasured in subsequent years. Transaction costs are apportioned between the liability and equity components of the convertible bonds based on the allocation of proceeds to the liability and equity components when the instruments are first recognised.
Derecognition of financial liabilitiesA financial liability is derecognised when the obligation under the liability is discharged or cancelled, or expires.
When an existing financial liability is replaced by another from the same lender on substantially different terms, or the terms of an existing liability are substantially modified, such an exchange or modification is treated as a derecognition of the original liability and a recognition of a new liability, and the difference between the respective carrying amounts is recognised in the consolidated statement of profit or loss.

FOSUN INTERNATIONAL LIMITED Annual Report 2015130
NOTES TO FINANCIAL STATEMENTSYear ended 31 December 2015
2.4 SUMMARY OF SIGNIFICANT ACCOUNTING POLICIES (Continued)
Offsetting of financial instrumentsFinancial assets and financial liabilities are offset and the net amount is reported in the statement of financial position if there is a currently enforceable legal right to offset the recognised amounts and there is an intention to settle on a net basis, or to realise the assets and settle the liabilities simultaneously.
Derivative financial instrumentsInitial recognition and subsequent measurementThe Group uses derivative financial instruments, such as forward currency contracts and commodity derivative contracts, to hedge its foreign currency risk and commodity price risk, respectively. These derivative financial instruments are initially recognised at fair value on the date on which a derivative contract is entered into and are subsequently remeasured at fair value. Derivatives are carried as assets when the fair value is positive and as liabilities when the fair value is negative.
Any gains or losses arising from changes in fair value of derivatives are taken directly to the consolidated statement of profit or loss.
None of the Group’s derivative financial instruments is qualified for hedge accounting.
InventoriesInventories are stated at the lower of cost and net realisable value. Cost is determined on the weighted average basis and, in the case of work in progress and finished goods, comprises direct materials, direct labour and an appropriate proportion of overheads. Net realisable value is based on estimated selling prices less any estimated costs to be incurred to completion and disposal.
Properties under developmentProperties under development are stated at cost which includes all development expenditures, including land costs, interest charges and other costs directly attributable to such properties.
Properties under development are classified as current assets unless the construction period of the relevant property development project is expected to complete beyond the normal operating cycle.
Properties under development are valued at the lower of cost and net realisable value at the end of the reporting period and any excess of cost over the net realisable value of an individual item of properties under development is accounted for as a provision. Net realisable value is based on estimated selling prices in the ordinary course of business as determined by management with reference to the prevailing market conditions, less further costs expected to be incurred to completion and selling and marketing costs.
Completed properties for saleCompleted properties for sale are recognised in the consolidated statement of financial position at the lower of cost and net realisable value. Net realisable value is estimated by the directors based on the prevailing market conditions. Cost is determined by an apportionment of the total costs of land and buildings attributable to the unsold properties. Any excess of cost over the net realisable value of an individual item of completed properties for sale is accounted for as a provision.
Cash and cash equivalentsFor the purpose of the consolidated statement of cash flows, cash and cash equivalents comprise cash on hand and demand deposits, and short-term highly liquid investments that are readily convertible into known amounts of cash, are subject to an insignificant risk of changes in value, and have a short maturity of generally within three months when acquired, less bank overdrafts which are repayable on demand and form an integral part of the Group’s cash management.
For the purpose of the consolidated statement of financial position, cash and bank comprise cash on hand and at banks, including term deposits, which are not restricted as to use.

FOSUN INTERNATIONAL LIMITED Annual Report 2015 131
NOTES TO FINANCIAL STATEMENTSYear ended 31 December 2015
2.4 SUMMARY OF SIGNIFICANT ACCOUNTING POLICIES (Continued)
ProvisionsA provision is recognised when a present obligation (legal or constructive) has arisen as a result of a past event and it is probable that a future outflow of resources will be required to settle the obligation, provided that a reliable estimate can be made of the amount of the obligation.
When the effect of discounting is material, the amount recognised for a provision is the present value at the end of the reporting period of the future expenditures expected to be required to settle the obligation. The increase in the discounted present value amount arising from the passage of time is included in finance costs in the consolidated statement of profit or loss.
Provisions for product warranties granted by the Group on certain products are recognised based on sales volume and past experience of the level of repairs and returns, discounted to their present values as appropriate.
A contingent liability recognised in a business combination is initially measured at its fair value. Subsequently, it is measured at the higher of (i) the amount that would be recognised in accordance with the general guidance for provisions above; and (ii) the amount initially recognised less, when appropriate, cumulative amortisation recognised in accordance with the guidance for revenue recognition.
Income taxIncome tax comprises current and deferred tax. Income tax relating to items recognised outside profit or loss is recognised outside profit or loss, either in other comprehensive income or directly in equity.
Current tax assets and liabilities are measured at the amount expected to be recovered from or paid to the taxation authorities, based on tax rates (and tax laws) that have been enacted or substantively enacted by the end of the reporting period, taking into consideration interpretations and practices prevailing in the countries in which the Group operates.
Deferred tax is provided, using the liability method, on all temporary differences at the end of the reporting period between the tax bases of assets and liabilities and their carrying amounts for financial reporting purposes.
Deferred tax liabilities are recognised for all taxable temporary differences, except:
• when the deferred tax liabilities arises from the initial recognition of goodwill or an asset or liability in a transaction that is not a business combination and, at the time of the transaction, affects neither the accounting profit nor taxable profit or loss; and
• in respect of taxable temporary differences associated with investments in subsidiaries, associates and joint ventures, when the timing of the reversal of the temporary differences can be controlled and it is probable that the temporary differences will not reverse in the foreseeable future.
Deferred tax assets are recognised for all deductible temporary differences, the carryforward of unused tax credits and any unused tax losses. Deferred tax assets are recognised to the extent that it is probable that taxable profit will be available against which the deductible temporary differences, the carryforward of unused tax credits and unused tax losses can be utilised, except:
• when the deferred tax asset relating to the deductible temporary differences arises from the initial recognition of an asset or liability in a transaction that is not a business combination and, at the time of the transaction, affects neither the accounting profit nor taxable profit or loss; and
• in respect of deductible temporary differences associated with investments in subsidiaries, associates and joint ventures, deferred tax assets are only recognised to the extent that it is probable that the temporary differences will reverse in the foreseeable future and taxable profit will be available against which the temporary differences can be utilised.
The carrying amount of deferred tax assets is reviewed at the end of each reporting period and reduced to the extent that it is no longer probable that sufficient taxable profit will be available to allow all or part of the deferred tax asset to be utilised. Unrecognised deferred tax assets are reassessed at the end of each reporting period and are recognised to the extent that it has become probable that sufficient taxable profit will be available to allow all or part of the deferred tax asset to be recovered.

FOSUN INTERNATIONAL LIMITED Annual Report 2015132
NOTES TO FINANCIAL STATEMENTSYear ended 31 December 2015
2.4 SUMMARY OF SIGNIFICANT ACCOUNTING POLICIES (Continued)
Income tax (Continued)
Deferred tax assets and liabilities are measured at the tax rates that are expected to apply to the period when the asset is realised or the liability is settled, based on tax rates (and tax laws) that have been enacted or substantively enacted by the end of the reporting period.
Deferred tax assets and deferred tax liabilities are offset if a legally enforceable right exists to set off current tax assets against current tax liabilities and the deferred taxes relate to the same taxable entity and the same taxation authority.
Government grantsGovernment grants are recognised at their fair value where there is reasonable assurance that the grant will be received and all attaching conditions will be complied with. When the grant relates to an expense item, it is recognised as income on a systematic basis over the periods that the costs, which it is intended to compensate, are expensed. Where the grant relates to an asset, the fair value is credited to a deferred income account and is released to the consolidated statement of profit or loss over the expected useful life of the relevant asset by equal annual instalments.
Revenue recognitionRevenue is recognised when it is probable that the economic benefits will flow to the Group and when the revenue can be reliably measured. The following specific recognition criteria must also be met before revenue is recognised:
(a) Sale of goodsRevenue from the sale of goods is recognised when the significant risks and rewards of ownership have been transferred to the buyer, provided that the Group maintains neither managerial involvement to the degree usually associated with ownership, nor effective control over the goods sold.
(b) Sale of completed propertiesRevenue from the sale of properties is recognised when the risks and rewards of the properties are transferred to the purchasers, which is when the construction of relevant properties has been completed and the properties have been delivered to the purchasers pursuant to the sale agreement and collectability of related receivables is reasonably assured. Deposits and instalments received on properties sold prior to the date of revenue recognition are included in the consolidated statement of financial position under current liabilities.
(c) Service incomeService income is recognised when the relevant services have been rendered and it is probable that economic benefits will flow to the Group and the relevant income can be measured reliably.
(d) Insurance incomeNon-life insurance contract premiums, life insurance and investment contracts with a discretionay profit sharing component are recognised as income when written in “Net premiums written” in the statement of profit or loss.
Premiums written on non-life insurance contracts recognised as income over the corresponding risk periods, through the use of the unearned premiums provision.
(e) Rental incomeRevenue is recognised on a time proportion basis over the lease terms.
(f) Interest incomeRevenue is recognised on an accrual basis using the effective interest method by applying the rate that exactly discounts the estimated future cash receipts over the expected life of the financial instrument or a shorter period, when appropriate, to the net carrying amount of the financial asset.

FOSUN INTERNATIONAL LIMITED Annual Report 2015 133
NOTES TO FINANCIAL STATEMENTSYear ended 31 December 2015
2.4 SUMMARY OF SIGNIFICANT ACCOUNTING POLICIES (Continued)
Revenue recognition (Continued)
(g) Dividend incomeRevenue is recognised when the shareholders’ right to receive payment has been established.
Share-based paymentsThe Company and certain subsidiaries of the Group operate share incentive schemes and a share option scheme for the purpose of providing incentives and rewards to their employees (including directors). Employees (including directors) receive remuneration in the form of share-based payments, whereby employees (including directors) render services as consideration for equity instruments (“equity-settled transactions”).
The cost of equity-settled transactions with employees is measured by reference to the fair value at the date at which they are granted. The fair value is determined by an external valuer using the Black-Scholes option pricing model, further details of which are given in note 55 to the financial statements.
The cost of equity-settled transactions is recognised in employee benefit expense, together with a corresponding increase in equity, over the period in which the performance and/or service conditions are fulfilled. The cumulative expense recognised for equity-settled transactions at the end of each reporting period until the vesting date reflects the extent to which the vesting period has expired and the Group’s best estimate of the number of equity instruments that will ultimately vest. The charge or credit to the consolidated statement of profit or loss for a period represents the movement in the cumulative expense recognised as at the beginning and end of that period.
Service and non-market performance conditions are not taken into account when determining the grant date fair value of awards, but the likelihood of the conditions being met is assessed as part of the Group’s best estimate of the number of equity instruments that will ultimately vest. Market performance conditions are reflected within the grant date fair value. Any other conditions attached to an award, but without an associated service requirement, are considered to be non-vesting conditions. Non-vesting conditions are reflected in the fair value of an award and lead to an immediate expensing of an award unless there are also service and/or performance conditions.
For awards that do not ultimately vest because non-market performance and/or service conditions have not been met, no expense is recognised. Where awards include a market or non-vesting condition, the transactions are treated as vesting irrespective of whether the market or non-vesting condition is satisfied, provided that all other performance and/or service conditions are satisfied.
Where the terms of an equity-settled award are modified, as a minimum an expense is recognised as if the terms had not been modified, if the original terms of the award are met. In addition, an expense is recognised for any modification that increases the total fair value of the share-based payments, or is otherwise beneficial to the employee as measured at the date of modification.
Employee benefitsThe Group provides the post-employment benefits mainly as follows: (i) defined contribution pension schemes for all employees of the companies in Mainland China; (ii) employee benefits to qualified former employees (“Qualified SOE Employees”) and qualified retirees (“Qualified Retirees”) of former state-owned enterprises in Mainland China; (iii) a pension scheme for all eligible employees of the companies in Hong Kong; (iv) accommodation benefits for all eligible employees of the companies in Mainland China, details of which are set out below; (v) employee benefits to all eligible employees of the subsidiaries in Portugal; and (vi) employee benefits to all eligible employees of the subsidiary in France.
(i) Defined contribution pension schemesThe full-time employees of the companies in Mainland China, other than Qualified SOE Employees and Qualified Retirees of former state-owned enterprises (“Former SOEs”) as set out below, are covered by various government-regulated defined contribution retirement benefit schemes under which the employees are entitled to a monthly pension. The Group contributes a percentage of the employees’ salaries to these retirement benefit schemes on a monthly basis. Under these schemes, the Group has no legal obligation for retirement benefits beyond the contributions made. Contributions to these schemes are expensed as incurred.

FOSUN INTERNATIONAL LIMITED Annual Report 2015134
NOTES TO FINANCIAL STATEMENTSYear ended 31 December 2015
2.4 SUMMARY OF SIGNIFICANT ACCOUNTING POLICIES (Continued)
Employee benefits (Continued)
(ii) Other employee benefits to Qualified SOE Employees and Qualified RetireesThe Group took over Qualified SOE Employees and Qualified Retirees from the Former SOEs upon the Group’s acquisition of the Former SOEs in Mainland China. A liability in respect of the retirement benefits of Qualified SOE Employees and Qualified Retirees was taken over by the Group from the former parent company of the Former SOEs upon taking up Qualified SOE Employees and Qualified Retirees. All the following retirement benefits are covered by the abovementioned liability taken over and the details of the retirement benefits are as follows:
Qualified SOE EmployeesThe Qualified SOE Employees consist of two different categories of employees:
(a) Qualified SOE Employees being made redundant by the Former SOEs before their statutory retirement age prior to the Group’s acquisition of the Former SOEs.
The Former SOEs paid basic salary and social benefit funds on a monthly basis to these Qualified SOE Employees until they reach their statutory retirement age as stipulated by the State Regulations. The Group is required to continue paying such monthly payments to these redundant Qualified SOE Employees until they reach their statutory retirement age as stipulated by the State Regulations; and
(b) Qualified SOE Employees not being made redundant by the Former SOEs before their statutory retirement age prior to the Group’s acquisition of the Former SOEs and entering into new employment contracts with the Group upon acquisition of the Former SOEs by the Group.
The Former SOEs implemented early retirement plans for these Qualified SOE employees. The benefits of the early retirement plans of the Qualified SOE Employees were calculated based on factors including the number of years of qualified service with the Former SOEs, salary amount and other agreed terms for Qualified SOE Employees upon the Group’s acquisition of the Former SOEs. The Group is required to pay these Qualified SOE Employees a redundancy payment if they opt for early retirement or are made redundant by the Group before their statutory retirement age as stipulated by the State Regulations. These Qualified SOE Employees are not entitled to early retirement benefits upon reaching their statutory retirement age.
Qualified RetireesThe Former SOEs also provided post-retirement benefits to their employees who were not covered by various government-regulated defined contribution retirement benefit schemes under which the employees are entitled to a monthly pension. Upon being acquired by the Group, the Former SOEs had certain Qualified Retirees to whom the Former SOEs had an obligation to pay a fixed amount on a monthly basis until their death, where the Group is required to continue paying such monthly payments to these Qualified Retirees. The post-retirement benefits of Qualified Retirees were calculated based on the monthly pension multiplied by an estimated life expectancy of Qualified Retirees.
The Group recognises the liability taken over as a non-current liability at initial recognition, and subsequent payments of the retirement benefits to Qualified SOE Employees and Qualified Retirees are debited against the non-current liability. Payments are made by the Group to Qualified SOE Employees and Qualified Retirees, but the use of the fund is monitored and supervised jointly by the former parent company of the Former SOEs and the union. Except for the payment of the retirement benefits of the Qualified SOE Employees and the Qualified Retirees, the fund cannot be used for any other purpose including the transfer to the Group’s statement of profit or loss or reserve without the joint approval from the former parent company of Former SOEs, the union and the Municipal Labour & Social Security Bureau.

FOSUN INTERNATIONAL LIMITED Annual Report 2015 135
NOTES TO FINANCIAL STATEMENTSYear ended 31 December 2015
2.4 SUMMARY OF SIGNIFICANT ACCOUNTING POLICIES (Continued)
Employee benefits (Continued)
(iii) Pension scheme for all eligible employees of the companies in Hong KongThe Group operates a defined contribution Mandatory Provident Fund retirement benefit scheme (the “MPF Scheme”) under the Mandatory Provident Fund Schemes Ordinance for all employees of the companies in Hong Kong who are eligible to participate in the MPF Scheme. Contributions are made based on a percentage of the employees’ basic salaries and are charged to the consolidated statement of profit or loss as they become payable in accordance with the rules of the MPF Scheme. The assets of the MPF Scheme are held separately from those of the Group in an independently administered fund. The Group’s employer contributions vest fully with the employees when contributed into the MPF Scheme.
(iv) Accommodation benefits for all eligible employees of the companies in Mainland ChinaAccording to the relevant People’s Republic of China (“PRC”) rules and regulations, the PRC companies now comprising the Group and their employees are each required to make contributions which are in proportion to the salaries and wages of the employees to an accommodation fund administered by the government agencies in the PRC. There is no further obligation on the part of the Group except for such contributions to the accommodation fund. Contributions to an accommodation fund administrated by government agency are charged to the consolidated statement of profit or loss as and when they are incurred.
(v) Employee benefits to all eligible employees of the subsidiaries in PortugalAs per the collective labour agreement in force at the time for the insurance activity, the companies in Portugal undertook the commitment to make cash payments to complement the retirement pensions paid by the social security services to the employees hired prior to 22 June 1995, the date when the labour agreement became effective. These payments corresponded to a percentage, which grew with the number of years of employment, applied to the table of salaries in force at the date of retirement.
Following the new labour agreement for the insurance activity, signed at 23 December 2011, the previous defined benefit pension plan was replaced, regarding workers actively employed, effective 1 January 2012, with a plan of defined contributions, with the current value of liabilities for services rendered at 31 December 2011 being transferred to the individual account of each participant. This change has not been applied to pensions due to workers who were retired or pre-retired at 31 December 2011, or to employees who did not sign up to the current collective employment agreement.
In addition, the former Império Bonança also committed itself to providing whole life medical assistance benefits to those in retirement or pre-retirement who had switched to that status between June 1998 and July 2005.
Contributions by the companies in Portugal to the defined contribution plan are made in accordance with the rules set forth in the collective labour agreement, and recorded as an expense in the period they are due as a charge to administrative expenses.
(vi) Employee benefits to all eligible employees of the subsidiary in FranceAll eligible employees of the subsidiary in France receive certain short-term benefits, such as vacation pay, “13th month” bonuses, sick leave, health insurance, unemployment insurance in France, etc.
The post-employment benefit plans of the subsidiary in France are based on legal obligations in each host country and on its subsidiaries’ compensation policies. Long-term benefit plans include both defined contribution and defined benefit plans.
(a) Defined contribution plansUnder defined contribution plans, the subsidiary in France pays contributions to an external fund that is responsible for paying the benefits. The legal or constructive obligation of the subsidiary in France under these plans is limited to the amount that it agrees to contribute to the fund. The main defined contribution plans consist of government-sponsored basic and supplementary pension plans in Europe and defined-contribution pension plans in North America.
Contributions to all of these plans are recognised as an expense for the period in which they are due.

FOSUN INTERNATIONAL LIMITED Annual Report 2015136
NOTES TO FINANCIAL STATEMENTSYear ended 31 December 2015
2.4 SUMMARY OF SIGNIFICANT ACCOUNTING POLICIES (Continued)
Employee benefits (Continued)
(vi) Employee benefits to all eligible employees of the subsidiary in France (Continued)(b) Defined benefit plans
Under defined benefit plans, the subsidiary in France has an obligation to pay benefits to employees either at the end of their employment or during their retirement. The defined benefit plans of the subsidiary in France are unfunded and are covered by provisions recorded in the financial statements.
The main defined benefit plans of the subsidiary in France concern indemnities payable to employees on retirement (France, Greece and Turkey) or when they leave the subsidiary in France (Italy and Japan).
Borrowing costsBorrowing costs directly attributable to the acquisition, construction or production of qualifying assets, i.e., assets that necessarily take a substantial period of time to get ready for their intended use or sale, are capitalised as part of the cost of those assets. The capitalisation of such borrowing costs ceases when the assets are substantially ready for their intended use or sale. Investment income earned on the temporary investment of specific borrowings pending their expenditure on qualifying assets is deducted from the borrowing costs capitalised. All other borrowing costs are expensed in the period in which they are incurred. Borrowing costs consist of interest and other costs that an entity incurs in connection with the borrowing of funds.
DividendsFinal dividends are recognised as a liability when they are approved by the shareholders in a general meeting. In prior years, final dividends proposed by the directors were classified as a separate allocation of retained profits within the equity section of the statement of financial position, until they have been approved by the shareholders in a general meeting. Following the implementation of the Hong Kong Companies Ordinance (Cap. 622), proposed final dividends are disclosed in the notes to the financial statements.
Interim dividends are simultaneously proposed and declared, because the Company’s memorandum and articles of association grant the directors the authority to declare interim dividends. Consequently, interim dividends are recognised immediately as a liability when they are proposed and declared.
Foreign currenciesThe functional currencies of the Company and PRC subsidiaries are Hong Kong dollars (“HKD”) and RMB, respectively. The financial statements are presented in RMB. Foreign currency transactions recorded by the entities in the Group are initially recorded using their respective functional currency rates prevailing at the dates of the transactions. Monetary assets and liabilities denominated in foreign currencies are translated at the functional currency rates of exchange ruling at the end of the reporting period. Differences arising on settlement or translation of monetary items are recognised in the consolidated statement of profit or loss.
Non-monetary items that are measured in terms of historical cost in a foreign currency are translated using the exchange rates at the dates of the initial transactions. Non-monetary items measured at fair value in a foreign currency are translated using the exchange rates at the date when the fair value was measured. The gain or loss arising on translation of a non-monetary item measured at fair value is treated in line with the recognition of the gain or loss on change in fair value of the item (i.e., translation difference on the item whose fair value gain or loss is recognised in other comprehensive income or profit or loss is also recognised in other comprehensive income or profit or loss, respectively).
The functional currencies of the Company and its subsidiaries incorporated outside Mainland China are currencies other than RMB. As at the end of the reporting period, the assets and liabilities of these entities are translated into RMB at the exchange rates prevailing at the end of the reporting period and their statements of profit or loss are translated into RMB at the weighted average exchange rates for the year. The resulting exchange differences are recognised in other comprehensive income and accumulated in the exchange fluctuation reserve. On disposal of a foreign operation, the component of other comprehensive income relating to that particular foreign operation is recognised in the consolidated statement of profit or loss.

FOSUN INTERNATIONAL LIMITED Annual Report 2015 137
NOTES TO FINANCIAL STATEMENTSYear ended 31 December 2015
2.4 SUMMARY OF SIGNIFICANT ACCOUNTING POLICIES (Continued)
Foreign currencies (Continued)
Any goodwill arising on the acquisition of a foreign operation and any fair value adjustments to the carrying amounts of assets and liabilities arising on acquisition are treated as assets and liabilities of the foreign operation and translated at the closing rate.
For the purpose of the consolidated statement of cash flows, the cash flows of overseas subsidiaries are translated into RMB at the exchange rates ruling at the dates of the cash flows. Frequently recurring cash flows of overseas subsidiaries which arise throughout the year are translated into RMB at the weighted average exchange rates for the year.
Insurance and investment contracts(a) Classification of contracts
Transactions associated with insurance contracts written and reinsurance contracts held by the Group are recognised in accordance with HKFRS 4 “Insurance Contracts”. Insurance contracts are those contracts under which the Group has accepted significant insurance risk from the policyholders by agreeing to compensate the policyholders if a specified uncertain future event (the insured event) adversely affects the policyholders. Contracts without a significant insurance risk are considered to be investment contracts.
As provided for in HKFRS 4, investment contracts with a discretionary profit sharing component also continue to be classified as insurance contracts, and other investment contracts are accounted for under HKAS 39.
An insurance or investment contract is considered to include profit sharing with a discretionary component when the respective contractual conditions provide for the allocation of additional benefits to the insured, as a complement to the contract’s guaranteed component part.
The liabilities related to life insurance contracts and investment contracts with discretionary profit sharing component are recorded in the “Other life insurance contract liabilities” account heading. This provision and the respective cost are recognised simultaneously with the income associated with premiums.
Potential capital gains, net of capital losses, resulting from the revaluation of assets allocated to life insurance contracts with profit sharing and which are expected to be paid to policyholders are recognised in the other life insurance contract liabilities (profit sharing provision).
(b) Provision for unearned premiumsThe provision for unearned premiums comprises the value of insurance contract premiums written and allocated to following periods, i.e., the part comprising the period between financial statements close and end of the period to which the premium refers. It is calculated, for each contract in force, by the application of the pro rata temporis method on the respective gross premiums written.
Expenditure incurred with the acquisition of non-life insurance contracts, including brokerage commissions and other expenses allocated to the acquisition, is deferred over the course of the period to which it relates and is recognised as a deduction from the amount of the unearned premium reserves on insurance contracts.

FOSUN INTERNATIONAL LIMITED Annual Report 2015138
NOTES TO FINANCIAL STATEMENTSYear ended 31 December 2015
2.4 SUMMARY OF SIGNIFICANT ACCOUNTING POLICIES (Continued)
Insurance and investment contracts (Continued)
(c) Claims provisionThis provision recognises the estimated amount of indemnities payable on accidents which have already occurred, including claims incurred but not reported (IBNR) and administrative costs on future claims settlements whose management procedure is currently being processed together with IBNR claims. Except for mathematical provisions and whole-life assistance for workman’s compensation, the claims provisions set up by the Group are not discounted.
(d) Mathematical provision for life insuranceThis corresponds to the estimated actuarial value of the insurance company’s commitments, including profit sharing payments already distributed and following the deduction of the actuarial value of future premiums, calculated for each policy in accordance with actuarial methods and their respective technical bases.
In the case of life insurance contracts in which the investment risk is borne by the policyholder, this account heading only includes any additional technical provisions which may be set up to cover mortality risks, administrative or other expenditure (e.g., guaranteed payments on maturity or guaranteed redemption values).
(e) Profit sharing provisionThe profit sharing provision in the other life insurance contract liabilities includes amounts payable to policyholders or contract beneficiaries, in the form of a profit sharing scheme, to be or already attributed, provided that such amounts have not been distributed.
Profit sharing provision to be attributedThis provision includes the balances originated by the net capital gains attributable to the insured and it also reflects the net amount of the subsequent potential capital gains and losses (fair value adjustments) relating to investments allocated to life insurance contracts with a profit sharing component, for the estimated part of the policy holder or contract beneficiary, as long as the balances by portfolio are not negative.
This provision is set up as a charge to profit sharing to be attributed, in the statement of profit or loss, or as a direct charge to the other comprehensive income resulting from adjustments to the fair value of available-for-sale financial assets allocated to life insurance with a profit sharing component, depending on the assets’ classification.
This provision includes the amounts payable to policyholders or contract beneficiaries, in the form of profit sharing, which have still not been distributed but which have been attributed to them.
For most of the products, the provision is calculated on the basis of income generated by the allocated assets, including realised capital gains and losses and the recognition of impairment losses for the period, less the negative balances of past years, in cases in which the said deduction is contractually provided for.
(f) Provision for interest rate commitmentsThe provision for interest rate commitments is set up for all life insurance and life insurance operations with a guaranteed interest rate, whenever the effective yield on investments representing mathematical provisions on certain insurance contracts, is less than the average weighted technical interest rate used to assess the mathematical provisions for such contracts.
(g) Portfolio stabilisation provisionThe portfolio stabilisation provision is set up for annually renewable group insurance contracts, guaranteeing death risk as their principal cover, and it is designed to provide for the heightened risk inherent to the progression of the average age of the insured group, whenever the tariff is based on a single rate, which, owing to contractual commitments is to be maintained over a certain period.

FOSUN INTERNATIONAL LIMITED Annual Report 2015 139
NOTES TO FINANCIAL STATEMENTSYear ended 31 December 2015
2.4 SUMMARY OF SIGNIFICANT ACCOUNTING POLICIES (Continued)
Insurance and investment contracts (Continued)
(h) Provision for unexpired risksThis provision is calculated for all non-life insurance and is intended to respond to situations in which premiums to be allocated to subsequent years regarding contracts in force at the date of the financial statements are not sufficient to pay for the indemnities and the expenses to be allocated to the respective technical lines of business. This provision is calculated on the basis of the ratios for claims, operating costs, ceding and income, in accordance with that which is defined by the Portuguese Insurance Regulator.
(i) Technical provisions for outwards reinsuranceThese provisions are assessed by applying the above described criteria for direct insurance, based on ceding percentages, in addition to other clauses existing in the treaties in force.
(j) Liabilities to subscribers of unit-linked productsLiabilities associated with unit-linked investment contracts issued by the Group in which the risk is borne by the policyholder, are recognised at fair value, assessed on the basis of the fair value of investment portfolio assets allocated to each of the products, less the corresponding management costs and recognised in “financial liabilities for unit-linked contracts”.
Investment portfolios allocated to unit-linked products comprise financial assets, including fixed-income securities, variable-income securities, derivative instruments and deposits in credit institutions, which are recognised at fair value and whose corresponding unrealised capital gains and losses are recognised in the statement of profit or loss for the year.
(k) Liabilities to subscribers of other investment contractsLiabilities to subscribers of other regulated products, classified as investment contracts under HKFRS 4, which do not include a discretionary profit sharing component, are valued in accordance with the requirements of HKAS 39 and recognised in “Investment contract liabilities”.
(l) Impairment of debtor balances related with insurance and reinsurance contractsAt each financial statement date, the Group assesses the existence of evidence of impairment on assets originated by insurance or reinsurance contracts, namely accounts receivable from policyholders, agents, inwards and outwards reinsurers, and technical provisions for outwards reinsurance.
If impairment losses are identified, the financial statements value of the respective assets is reduced as a charge to the statement of profit or loss for the year.
(m) Liability adequacy testIn accordance with HKFRS 4, at the financial statements date, the Group performs liability adequacy tests relating to contracts in force. These tests include estimates of the present value of future cash flows under its insurance contracts, including claims handling costs and cash flows resulting from embedded options and guarantees.
If that assessment shows that the carrying amount of the insurance liabilities recognised in the financial statements, net of related intangible assets is inadequate in light of the estimated future cash flows, the entire insufficiency shall be recognised in profit or loss.

FOSUN INTERNATIONAL LIMITED Annual Report 2015140
NOTES TO FINANCIAL STATEMENTSYear ended 31 December 2015
3. SIGNIFICANT ACCOUNTING JUDGEMENTS AND ESTIMATESThe preparation of the Group’s financial statements requires management to make judgements, estimates and assumptions that affect the reported amounts of revenues, expenses, assets and liabilities, and their accompanying disclosures, and the disclosure of contingent liabilities. Uncertainty about these assumptions and estimates could result in outcomes that could require a material adjustment to the carrying amounts of the assets or liabilities affected in the future.
JudgementsIn the process of applying the Group’s accounting policies, management has made the following judgements, apart from those involving estimations, which have the most significant effect on the amounts recognised in the financial statements:
(i) Operating lease commitments – Group as lessorThe Group has entered into commercial property leases on its investment property portfolio. The Group has determined, based on an evaluation of the terms and conditions of the arrangements, that it retains all the significant risks and rewards of ownership of these properties which are leased out on operating leases.
(ii) Classification between investment properties and owner-occupied propertiesThe Group determines whether a property qualifies as an investment property, and has developed criteria in making that judgment. Investment property is a property held to earn rentals or for capital appreciation or both. Therefore, the Group considers whether a property generates cash flows largely independently of the other assets held by the Group. Some properties comprise a portion that is held to earn rentals or for capital appreciation and another portion that is held for use in the production or supply of goods or services or for administrative purposes. If these portions could be sold separately or leased out separately under a finance lease, the Group accounts for the portions separately. If the portions could not be sold separately, the property is an investment property only if an insignificant portion is held for use in the production or supply of goods or services or for administrative purposes. Judgement is made on an individual property basis to determine whether ancillary services are so significant that a property does not qualify as an investment property.
(iii) Consolidation of entities in which the Group holds less than a majority of voting rightsThe Group considers that it controls Shanghai Fosun Pharmaceutical (Group) Co., Ltd. (“Fosun Pharma”) even though it owns less than 50% of the voting rights. This is because the Group is the single largest shareholder of Fosun Pharma with a 39.78% equity interest as at 31 December 2015. The remaining 60.22% of the equity shares in Fosun Pharma are widely held by many other shareholders. The Group controls the board of directors of Fosun Pharma, and holds relatively larger voting rights than other dispersed public shareholders. Since the date of Fosun Pharma’s domestic shares being listed on the Shanghai Stock Exchange, there has been no history of the other shareholders collaborating to exercise their votes collectively or to outvote the Group.
(iv) Deferred tax liabilitiesDeferred tax liabilities are recognised for withholding corporate income taxes relating to the unremitted earnings of the Group’s subsidiaries established in Mainland China that are subject to withholding taxes. Significant management judgement is required to determine the amount of deferred tax liabilities, based upon the likely distribution level of such earnings from these subsidiaries in the foreseeable future. The amount of deferred tax liabilities addition arising from the withholding tax associated with the investments in subsidiaries in Mainland China for the year ended 31 December 2015 was RMB178,779,000 (31 December 2014: RMB112,749,000). Further details are contained in note 27 to the financial statements.

FOSUN INTERNATIONAL LIMITED Annual Report 2015 141
NOTES TO FINANCIAL STATEMENTSYear ended 31 December 2015
3. SIGNIFICANT ACCOUNTING JUDGEMENTS AND ESTIMATES (Continued)
Estimation uncertaintyThe key assumptions concerning the future and other key sources of estimation uncertainty at the end of the reporting period, that have a significant risk of causing a material adjustment to the carrying amounts of assets and liabilities within the next financial year are described below:
(i) Impairment of goodwillThe Group determines whether goodwill is impaired at least on an annual basis. This requires an estimation of the value in use of the cash-generating units to which the goodwill is allocated. Estimating the value in use requires the Group to make an estimate of the expected future cash flows from the cash-generating units and also to choose a suitable discount rate in order to calculate the present value of those cash flows. The carrying amount of goodwill at 31 December 2015 was RMB10,713,380,000 (31 December 2014: RMB6,842,031,000). Further details are given in note 20 to the financial statements.
(ii) Impairment of non-financial assets (other than goodwill)The Group assesses whether there are any indicators of impairment for all non-financial assets at the end of each reporting period. Indefinite life intangible assets are tested for impairment annually and at other times when such an indicator exists. Other non-financial assets are tested for impairment when there are indicators that the carrying amounts may not be recoverable. An impairment exists when the carrying value of an asset or a cash-generating unit exceeds its recoverable amount, which is the higher of its fair value less costs of disposal and its value in use. The calculation of the fair value less costs of disposal is based on available data from binding sales transactions in an arm’s length transaction of similar assets or observable market prices less incremental costs for disposing of the asset. When value in use calculations are undertaken, management must estimate the expected future cash flows from the asset or cash-generating unit and choose a suitable discount rate in order to calculate the present value of those cash flows. For the year ended 31 December 2015, impairment losses in the amount of RMB614,875,000 (2014: RMB286,322,000) have been recognised as set out in note 8 to the financial statements.
(iii) Impairment of available-for-sale investmentsThe Group classifies certain investments as available-for-sale investments and recognises changes in fair value in other comprehensive income. When the fair value declines, management makes judgement about the decline in value to determine whether there is an impairment that should be recognised in the consolidated statement of profit or loss. For the year ended 31 December 2015, impairment losses in the amount of RMB1,823,695,000 (2014: RMB99,783,000) have been recognised for available-for-sale investments as set out in note 8 to the financial statements. As at 31 December 2015, the carrying amount of available-for-sale investments was RMB118,132,674,000 (31 December 2014: RMB77,237,813,000).

FOSUN INTERNATIONAL LIMITED Annual Report 2015142
NOTES TO FINANCIAL STATEMENTSYear ended 31 December 2015
3. SIGNIFICANT ACCOUNTING JUDGEMENTS AND ESTIMATES (Continued)
Estimation uncertainty (Continued)
(iv) Estimation of fair value of investment propertiesAs described in note 14 to the financial statements, investment properties were revalued on 31 December 2015 on an open market value and existing use basis by independent professional valuers. Such valuations were based on certain assumptions, which are subject to uncertainty and might materially differ from the actual results. In making the judgement, the Group considers information from current prices in an active market for similar properties and uses assumptions that are mainly based on market conditions existing at the end of the reporting period.
In the absence of current prices in an active market for similar properties, the Group considers information from a variety of sources, including:
(a) current prices in an active market for properties of a different nature, condition or location, adjusted to reflect those differences;
(b) recent prices of similar properties on less active markets, with adjustments to reflect any changes in economic conditions since the date of the transactions that occurred at those prices; and
(c) discounted cash flow projections based on reliable estimates of future cash flows, supported by the terms of any existing lease and other contracts and (when possible) by external evidence such as current market rents for similar properties in the same location and condition, and using discount rates that reflect current market assessments of the uncertainty in the amount and timing of the cash flows.
The carrying amount of investment properties at 31 December 2015 was RMB40,898,689,000 (31 December 2014: RMB16,883,890,000). Further details, including the key assumptions used for fair value measurement are given in note 14 to the financial statements.
(v) Fair value of financial instruments determined using valuation techniquesFair value of financial instruments, in the absence of an active market, is estimated by using appropriate valuation techniques. Such valuations were based on certain assumptions about credit risk, volatility and liquidity risks, etc., associated with the instruments, which are subject to uncertainty and might materially differ from the actual results. Further details are included in note 62 to the financial statements.
(vi) Provision for bad debts of trade and notes receivables and prepayments, deposits and other receivablesThe Group reviews the recoverability and ageing of trade and notes receivables and prepayments, deposits and other receivables and provides impairment losses if the balances are not fully recoverable. The assessments involve estimation of the recoverability of these balances. Any change in key assumptions of estimations would affect the carrying amount of the trade and notes receivables and prepayments, deposits and other receivables, and provision expenses in the period in which such estimate has been changed.
(vii) Estimation of rehabilitation cost provisionFor mining rightsProvisions for the Group’s obligations for land rehabilitation are based on estimates of required expenditure at the mines in accordance with PRC rules and regulations. The Group estimates its liabilities for final rehabilitation and mine closure based upon detailed calculations of the amount and timing of the future cash expenditure to perform the required work. Spending estimates are escalated for inflation, then discounted at a discount rate that reflects current market assessments of the time value of money and the risks specific to the liability such that the amount of provision reflects the present value of the expenditure expected to be required to settle the obligation.
Estimates used in the provision for rehabilitation cost are subjective in nature and involve uncertainties and therefore cannot be determined with precision. Changes in assumptions could significantly affect these estimates.
For oil and gas assetsThe Group estimates the future removal costs of on and offshore oil and gas platforms, production facilities, wells and pipelines at the time of installation of the assets. In most instances, removal of assets occurs many years into the future. This requires judgemental assumptions regarding removal data, future environmental legislation, the extent of reclamation activities required, the engineering methodology for estimating costs, future removal technologies in determining the removal cost, and asset specific discount rates to determine the present value of these cash flows.

FOSUN INTERNATIONAL LIMITED Annual Report 2015 143
NOTES TO FINANCIAL STATEMENTSYear ended 31 December 2015
3. SIGNIFICANT ACCOUNTING JUDGEMENTS AND ESTIMATES (Continued)
Estimation uncertainty (Continued)
(viii) Useful lives of property, plant and equipmentThe Group determines the estimated useful lives and related depreciation charges for its property, plant and equipment. This estimate is based on the historical experience of the actual useful lives of property, plant and equipment of similar nature and functions. It could change significantly as a result of technical innovations, or competitor actions in response to severe industry cycles. Management will increase the depreciation charge where useful lives are less than previously estimated lives, or it will write off or write down technically obsolete or non-strategic assets that have been abandoned or sold.
(ix) Useful lives of intangible assets (other than goodwill)The Group determines the estimated useful lives for its intangible assets. This estimate is based on the historical experience of the actual useful lives of intangible assets of similar nature and functions. It could change significantly as a result of technical innovations, or competitor actions in response to severe industry cycles. Management will increase the amortisation charge where useful lives are less than previously estimated lives, or it will write off or write down technically obsolete or non-strategic assets that have been abandoned or sold.
(x) Deferred tax assetsDeferred tax assets are recognised for deductible temporary differences and carryforward of unused tax credits and unused tax losses to the extent that it is probable that taxable profit will be available against which the deductible temporary differences and the carryforward of unused tax credits and unused tax losses can be utilised. Significant management judgement is required to determine the amount of deferred tax assets that can be recognised, based upon the likely timing and level of future taxable profits together with future tax planning strategies. The carrying value of deferred tax assets relating to recognised tax losses at 31 December 2015 was RMB872,975,000 (31 December 2014: RMB1,562,209,000). The amount of unrecognised tax losses and deductible temporary differences as at 31 December 2015 was RMB11,305,062,000 (31 December 2014: RMB8,978,885,000). Further details are contained in note 27 to the financial statements.
(xi) Net realisable value of inventories, properties under development and completed properties for saleNet realisable value of inventories, properties under development and completed properties for sale is the estimated selling price in the ordinary course of business, less estimated cost to be incurred to completion and disposal. These estimates are based on the current market condition and the historical experience of selling products of similar nature. It could change significantly as a result of changes in customer taste or competitor actions in response to severe consumer product industry cycles. Management reassesses these estimates at the end of each reporting period.
(xii) Contingent consideration for acquisition of subsidiariesThe Group estimated the fair value of contingent consideration for acquisition of subsidiaries by using the expected cash flows, to be discounted to the acquisition date at an appropriately chosen discount rate. Significant management judgement is required to determine the expected cash flows and discount rate. Management reassesses these estimates at the end of each reporting period.
(xiii) Assessment of insurance and reinsurance contracts liabilitiesThe Group’s insurance and reinsurance contracts liabilities are assessed on the basis of the methodologies and assumptions described in note 2.4. These liabilities reflect a quantified estimate of the impact of future events on the accounts of the Group’s insurance companies, based on actuarial assumptions, claims history and other methods accepted in the sector. Owing to the nature of insurance activity, the assessment of claims provisions and other insurance and reinsurance contracts liabilities is highly subjective and the real amounts payable in the future may differ significantly from the estimates. Management reassesses these estimates at the end of each reporting period.

FOSUN INTERNATIONAL LIMITED Annual Report 2015144
NOTES TO FINANCIAL STATEMENTSYear ended 31 December 2015
4. PARTICULARS OF THE PRINCIPAL COMPANIES COMPRISING THE GROUP, ASSOCIATES AND JOINT VENTURESParticulars of the principal subsidiaries comprising the Group, associates and joint ventures of the Group at 31 December 2015 are set out below:
Nominal value Attributable equityinterest of the CompanyPlace of incorporation/ of registered/
registration and paid-up capitalName of company place of business RMB’000 Direct Indirect Effective Principal activities Subsidiaries
上海復星高科技(集團)有限公司 PRC/ 4,800,000 100.0% — 100.0% Investment holding (Shanghai Fosun High Mainland China Technology (Group) Co., Ltd.)
上海復星產業投資有限公司 PRC/ 600,000 — 100.0% 100.0% Investment holding (Shanghai Fosun Industrial Investment Co., Ltd.) Mainland China
復星金融控股有限公司 Hong Kong HKD 100.0% — 100.0% Investment holding (Fosun Financial Holdings Limited) 18,598,275,000
復星地產控股有限公司 Hong Kong HKD1 100.0% — 100.0% Investment holding (Fosun Property Holdings Limited)
Health segment
上海復星醫藥(集團)股份有限公司 * PRC/ 2,314,075 — 39.8% 39.8% Investment holding (Shanghai Fosun Pharmaceutical Mainland China (Group) Co., Ltd.)
上海復星醫藥產業發展有限公司 PRC/ 2,253,308 — 100.0% 39.8% Investment holding (Shanghai Fosun Pharmaceutical Mainland China Industrial Development Co., Ltd.)
錦州奧鴻藥業有限責任公司 PRC/ 107,875 — 93.0% 37.0% Manufacture and (Jinzhou Aohong Pharmaceutical Co., Ltd.) Mainland China sale of pharmaceutical products
江蘇萬邦生化醫藥股份有限公司 PRC/ 440,455 — 95.2% 37.9% Manufacture and (Jiangsu Wanbang Biopharmaceutical Co., Ltd.) Mainland China sale of pharmaceutical products
湖北新生源生物工程股份有限公司 PRC/ 51,120 — 51.0% 20.3% Manufacture and (Shine Star (Hubei) Biological Mainland China sale of pharmaceutical products Engineering Co., Ltd.)
重慶藥友製藥有限責任公司 PRC/ 196,540 — 51.0% 20.3% Manufacture and (Chongqing Yao Pharmaceutical Co., Ltd.) Mainland China sale of pharmaceutical products
桂林南藥股份有限公司 PRC/ 285,030 — 95.4% 38.0% Manufacture and (Guilin South Pharma Co., Ltd.) Mainland China sale of pharmaceutical products
復星實業(香港)有限公司 Hong Kong USD — 100.0% 39.8% Investment holding (Fosun Industrial Co., Limited) 173,820,000
湖南洞庭藥業股份有限公司 PRC/ 110,064 — 77.8% 31.0% Manufacture and (Hunan Dongting Pharmaceutical Co., Ltd.) Mainland China sale of pharmaceutical products
上海復星平耀投資管理有限公司 PRC/ 10,000 — 100.0% 39.8% Manufacture and (Shanghai Fosun Pingyao Mainland China sale of pharmaceutical products Investment Management Co., Ltd.)
佛山市禪城區中心醫院有限公司 PRC/ 50,000 — 60.0% 23.9% Provision of medical services (Foshan City Chancheng District Mainland China Central Hospital Co., Ltd.)

FOSUN INTERNATIONAL LIMITED Annual Report 2015 145
NOTES TO FINANCIAL STATEMENTSYear ended 31 December 2015
4. PARTICULARS OF THE PRINCIPAL COMPANIES COMPRISING THE GROUP, ASSOCIATES AND JOINT VENTURES (Continued)
Particulars of the principal subsidiaries comprising the Group, associates and joint ventures of the Group at 31 December 2015 are set out below: (Continued)
Nominal value Attributable equityinterest of the CompanyPlace of incorporation/ of registered/
registration and paid-up capitalName of company place of business RMB’000 Direct Indirect Effective Principal activities Subsidiaries (Continued)Property development and sales segment
復地(集團)股份有限公司 PRC/ 505,861 0.07% 99.08% 99.15% Property development (Shanghai Forte Land Co., Ltd.) Mainland China
上海復地投資管理有限公司 PRC/ 80,000 — 100.0% 99.1% Investment holding (Shanghai Forte Investment Mainland China Management Co., Ltd.)
武漢中北房地產開發有限公司 PRC/ 933,000 — 70.0% 69.3% Property development (Wuhan Zhongbei Property Mainland China Development Co., Ltd.)
長春兆基房地產開發有限公司 PRC/ 50,000 — 100.0% 99.1% Property development (Changchun Zhaoji Real Estate Mainland China Development Co., Ltd.)
上海櫻花置業有限公司 PRC/ USD — 100.0% 99.1% Property development (Shanghai Yinghua Real Estate Co., Ltd.) Mainland China 111,500,000
山西復地得一房地產開發有限公司 PRC/ 100,000 — 80.0% 79.3% Property development (Shanxi Forte Deyi Real Estate Co., Ltd.) Mainland China
長沙復地房地產開發有限公司 PRC/ 500,000 — 100.0% 99.1% Property development (Changsha Forte Real Estate Co., Ltd.) Mainland China
上海精盛房地產開發有限公司 PRC/ 10,000 — 80.0% 79.3% Property development (Shanghai Jingsheng Real Estate Co., Ltd.) Mainland China
天津申港置業發展有限公司 PRC/ 30,000 — 70.0% 69.4% Property development (Tianjin Shengang Real Estate Co., Ltd.) Mainland China
南京復地東郡置業有限公司 PRC/ 650,000 — 100.0% 99.1% Property development (Nanjing Forte Dongjun Real Estate Co., Ltd.) Mainland China
無錫地久置業有限公司 PRC/ USD — 80.0% 79.3% Property development (Wuxi Dijiu Real Estate Co., Ltd.) Mainland China 149,600,000
杭州金成品屋置業有限公司 PRC/ 100,000 — 60.0% 59.5% Property development (Hangzhou Jincheng Pinwu Real Estate Co., Ltd.) Mainland China
上海證大外灘國際金融服務中心置業有限公司 PRC/ 7,000,000 — 100% 100% Property development (Shanghai Zendai Bund International Finance Mainland China Services Centre Real Estate Company Limited)
Resources segment
海南礦業股份有限公司 PRC/ 1,866,670 — 54.0% 54.0% Mining and ore processing (Hainan Mining Co., Ltd.) Mainland China
Roc Oil Company Limited Australia USD734,150,000 — 100% 100% Oil and gas exploration

FOSUN INTERNATIONAL LIMITED Annual Report 2015146
NOTES TO FINANCIAL STATEMENTSYear ended 31 December 2015
4. PARTICULARS OF THE PRINCIPAL COMPANIES COMPRISING THE GROUP, ASSOCIATES AND JOINT VENTURES (Continued)
Particulars of the principal subsidiaries comprising the Group, associates and joint ventures of the Group at 31 December 2015 are set out below: (Continued)
Nominal value Attributable equityinterest of the CompanyPlace of incorporation/ of registered/
registration and paid-up capitalName of company place of business RMB’000 Direct Indirect Effective Principal activities Subsidiaries (Continued)Happiness segment
Club Méditerranée S.A. France Euro — 100% 85.6% Tourism149,000,000
Asset management segment
上海復星創富投資管理有限公司 PRC/ 111,000 — 100.0% 100.0% Capital investment and (Fosun Capital Investment & Management Mainland China management Co., Ltd.)
IDERA Capital Management Ltd. Japan JPY — 98.0% 98.0% Capital investment and100,000,000 management
Insurance segment
鼎睿再保險有限公司 Hong Kong USD — 85.1% 85.1% Reinsurance (Peak Reinsurance Company Limited) 550,000,000
Fidelidade – Companhia de Portugal Euro — 85.0% 85.0% Underwriting of life Seguros, S.A. 381,150,000 and non-life insurance
Meadowbrook Insurance Group, Inc. United States USD — 100% 100% Underwriting of non-life insuranceof America 343,353,000
Ironshore Inc. Cayman Islands/United USD — 100% 100% Underwriting of non-life insuranceStates of America 1,433,201,000
Associates
國藥產業投資有限公司 PRC/ 100,000 — 49.0% 19.5% Distribution of (Sinopharm Industrial Investment Co., Ltd.) Mainland China pharmaceutical products
上海豫園旅遊商城股份有限公司 PRC/ 1,437,322 — 26.45% 26.45% Retail (Shanghai Yuyuan Tourist Mart Co., Ltd.) Mainland China
天津建龍鋼鐵實業有限公司 PRC/ 2,000,000 — 25.7% 25.7% Manufacture and sale of (Tianjin Jianlong Iron & Steel Mainland China iron and steel products Industrial Co., Ltd.)
上海證大房地產有限公司@ Bermuda/ HKD — 14.1% 14.0% Property investment (Shanghai Zendai Property Limited) Mainland China 297,587,000 and management
上海地杰置業有限公司 PRC/ 20,000 — 40.0% 39.6% Property investment (Shanghai Dijie Real Estate Limited) Mainland China and management
永安財產保險股份有限公司@ PRC/ 2,663,200 — 19.9% 19.9% Property insurance (Yong’an Property Insurance Company Limited) Mainland China
七喜控股股份有限公司@ PRC/ 4,116,000 — 8.09% 8.09% Development and operation in (Hedy Holding Co., Ltd) Mainland China digital media business

FOSUN INTERNATIONAL LIMITED Annual Report 2015 147
NOTES TO FINANCIAL STATEMENTSYear ended 31 December 2015
4. PARTICULARS OF THE PRINCIPAL COMPANIES COMPRISING THE GROUP, ASSOCIATES AND JOINT VENTURES (Continued)
Particulars of the principal subsidiaries comprising the Group, associates and joint ventures of the Group at 31 December 2015 are set out below: (Continued)
Nominal value Attributable equityinterest of the CompanyPlace of incorporation/ of registered/
registration and paid-up capitalName of company place of business RMB’000 Direct Indirect Effective Principal activities Joint ventures
南京南鋼鋼鐵聯合有限公司# PRC/ 3,000,000 — 60.0% 60.0% Manufacture and sale of (Nanjing Nangang Iron & Steel United Co., Ltd.) Mainland China iron and steel products
無錫復地房地產開發有限公司 PRC/ 195,000 — 50.0% 49.6% Property development (Wuxi Forte Real Estate Development Co., Ltd.) Mainland China
陝西省建秦房地產開發有限公司 PRC/ 130,000 — 50.0% 49.6% Property development (Shaanxi Jianqin Real Estate Mainland China Development Co., Ltd.)
The English names of the above subsidiaries, associates and joint ventures are directly translated from their Chinese names.
The above table lists the subsidiaries, associates and joint ventures of the Group which, in the opinion of the directors of the Company, principally affected the results of the Group for the year ended 31 December 2015 or formed a substantial portion of the net assets of the Group. To give details of other subsidiaries, associates and joint ventures would, in the opinion of the directors of the Company, result in particulars of excessive length.
Notes:
* Fosun Pharma continues to be accounted for as a subsidiary because the Group continues to be the single major shareholder of Fosun Pharma and holds relatively larger voting rights than other dispersed public shareholders, despite the fact that the Group’s equity interest in this company was 39.78% as at 31 December 2015.
@ The Group’s investments in these associates are accounted for under the equity method of accounting because the Group has significant influence over these entities by way of representation on the board of directors and participation in the policy-making process, despite the fact that the Group’s direct or indirect equity interests in these associates were lower than 20% for the year ended 31 December 2015.
# Due to the delegation of 10% voting rights in Nanjing Nangang Iron & Steel United Co., Ltd. (“Nanjing Nangang”) by the Group to Nanjing Iron & Steel (Group) Co., Ltd. as at 31 December 2015, the Group lost control of Nanjing Nangang and Nanjing Nangang was accounted for as a joint venture of the Group. Details are set out in note 54(b) to the consolidated financial statements.

FOSUN INTERNATIONAL LIMITED Annual Report 2015148
NOTES TO FINANCIAL STATEMENTSYear ended 31 December 2015
5. OPERATING SEGMENT INFORMATIONFor management purposes, the Group is organised into business units based on their products and services and has nine reportable operating segments as follows:
(i) Insurance segment engages in the operation of and investment in the insurance business;
(ii) Investment segment comprises, principally, the investments in strategic investments, private equity investments, venture capital investments and capital contribution to the Group’s asset management business as a limited partner (PE/VC/LP investment) and secondary market investments;
(iii) Wealth management segment engages in the asset management business and the operation of and investment in banking and other financial business; and
(iv) Internet finance segment comprises the operation of financial industry using internet cloud computing technology.
Insurance segment, investment segment, wealth management segment and internet finance segment listed above all belong to one integrated finance (wealth) sector of the Group.
(v) Health segment engages in the research and development, manufacturing, sale and trading of pharmaceutical and medical products and providing healthcare services;
(vi) Happiness segment comprises principally the operation and investments in the wholesale and retail of gold and jewellery, tourism and entertainment industries;
(vii) Steel segment engages in the manufacturing, sale and trading of iron and steel products;
(viii) Property development and sales segment engages in the development and sale of properties; and
(ix) Resources segment engages in the mining and ore processing of various metals and the oil and gas exploration.
Health segment, happiness segment, steel segment, property development and sales segment and resources segment listed above all belong to one industrial operations sector of the Group.
Management monitors the results of the Group’s operating segments separately for the purpose of making decisions about resource allocation and performance assessment. In the year ended 31 December 2015, as the management changes the structure of the Group’s internal organisation to match its business development strategy in a manner that causes to change the Group’s composition of its reportable segments, some entities within the Group were re-structured to reflect such change.
Segment performance is evaluated based on reportable segment profit or loss, which is a measure of adjusted profit or loss after tax. The adjusted profit or loss after tax is measured consistently with the Group’s profit or loss after tax except that head office and corporate expenses are excluded from such measurement.
Inter-segment sales and transfers are transacted with reference to the fair selling prices used for sales made to third parties at the then prevailing market prices.

FOSUN INTERNATIONAL LIMITED Annual Report 2015 149
NOTES TO FINANCIAL STATEMENTSYear ended 31 December 2015
5. OPERATING SEGMENT INFORMATION (Continued)
Year ended 31 December 2015
Integrated Finance (Wealth) Industrial Operations
Insurance InvestmentWealth
managementInternetfinance Health Happiness Steel
Propertydevelopment
and sales Resources Eliminations TotalRMB’000 RMB’000 RMB’000 RMB’000 RMB’000 RMB’000 RMB’000 RMB’000 RMB’000 RMB’000 RMB’000
Segment revenue:Sales to external customers 14,667,408* 399,969 392,782 604 15,416,454 7,441,623 21,986,032 16,868,011 1,624,006 — 78,796,889Inter-segment sales — 42,494 112,559 — 198,421 — — 25,695 3,587 (382,756) —Other income and gains 4,825,257 12,245,751 391,938 133,765 1,983,010 365,266 318,474 1,342,935 221,858 (28,639) 21,799,615 Total 19,492,665 12,688,214 897,279 134,369 17,597,885 7,806,889 22,304,506 18,236,641 1,849,451 (411,395) 100,596,504 Segment results 1,347,074 9,994,198 460,717 131,253 3,616,638 145,263 (1,263,913) 3,942,813 (34,084) 167,246 18,507,205Interest and dividend income 2,976,387 457,227 252,338 — 120,146 23,790 424,993 142,295 47,483 (380,268) 4,064,391Impairment losses recognised in the statement of profit or loss, net (1,564,001) (189,468) (258) — (93,005) (13,296) (478,247) (799,124) (401,111) — (3,538,510)Unallocated expenses (1,267,535)Finance costs (97,958) (2,708,502) (32,819) — (553,753) (39,364) (899,740) (656,869) (57,112) 322,086 (4,724,031)Share of profits and losses of– Joint ventures (51,302) (8,099) 22,513 — (19,631) (491) (9,799) 1,133,759 — — 1,066,950– Associates 263,170 184,155 (536) (25,298) 1,312,695 119,363 (327,046) 552,258 (53) (4,629) 2,074,079 Profit/(loss) before tax 2,873,370 7,729,511 701,955 105,955 4,383,090 235,265 (2,553,752) 4,315,132 (444,877) 104,435 16,182,549Tax (435,776) (3,006,996) (33,218) (113) (713,141) (102,180) 277,263 (1,168,135) (16,978) (29,848) (5,229,122) Profit/(loss) for the year 2,437,594 4,722,515 668,737 105,842 3,669,949 133,085 (2,276,489) 3,146,997 (461,855) 74,587 10,953,427 Segment and total assets 180,597,569 37,835,623 15,185,792 2,221,309 48,037,523 19,506,981 9,244,781 95,593,845 8,370,234 (11,258,446) 405,335,211 Segment and total liabilities 144,341,458 80,982,265 5,540,528 190 19,946,850 8,265,235 — 63,602,215 1,929,061 (17,426,666) 307,181,136 Other segment information:Depreciation and amortisation 334,367 66,301 2,529 — 854,811 255,147 1,594,031 28,895 611,084 — 3,747,165Impairment losses recognised in the statement of profit or loss 1,768,105 189,468 258 — 93,005 13,296 478,247 799,124 401,111 — 3,742,614Impairment losses reversed in the statement of profit or loss (204,104) — — — — — — — — — (204,104)Research and development costs — — — — 622,707 — 137,049 — — — 759,756Fair value gains on fair value adjustments of investment properties (249,188) (1,258,029) (210,564) — — — — (120,730) — — (1,838,511)Fair value (gains)/loss on investments at fair value through profit or loss (257,339) 2,015,259 — — 2,218 — 151,958 — — — 1,912,096Investments in joint ventures 790,973 76,106 469,698 — 223,380 7,159 7,226,883 3,082,994 — (68,068) 11,809,125Investments in associates 1,392,746 2,282,623 209,063 1,307,126 17,135,168 3,142,618 2,017,898 3,656,698 429,096 (363,384) 31,209,652Capital expenditure** 2,895,088 356,527 780,247 — 1,617,645 752,253 1,017,085 421,226 735,271 — 8,575,342

FOSUN INTERNATIONAL LIMITED Annual Report 2015150
NOTES TO FINANCIAL STATEMENTSYear ended 31 December 2015
5. OPERATING SEGMENT INFORMATION (Continued)
Year ended 31 December 2014
Integrated Finance (Wealth) Industrial Operations
Insurance InvestmentWealth
management Internet finance Health Happiness Steel
Propertydevelopment
and sales Resources Eliminations TotalRMB’000 RMB’000 RMB’000 RMB’000 RMB’000 RMB’000 RMB’000 RMB’000 RMB’000 RMB’000 RMB’000
Segment revenue:Sales to external customers 7,867,640* 670,003 362,195 — 11,938,243 — 27,272,049 12,111,918 1,516,401 — 61,738,449Inter-segment sales — 30,493 85,925 — — — — 37,244 72,795 (226,457) —Other income and gains 2,355,453 4,075,228 37,305 — 2,885,512 224,346 434,262 1,003,206 53,576 (68,159) 11,000,729 Total 10,223,093 4,775,724 485,425 — 14,823,755 224,346 27,706,311 13,152,368 1,642,772 (294,616) 72,739,178 Segment results 288,611 4,164,473 130,590 — 3,215,714 198,946 1,332,466 3,097,338 478,673 40,918 12,947,729Interest and dividend income 1,870,474 476,101 213,632 — 120,828 — 280,796 81,309 5,044 (259,535) 2,788,649Impairment losses recognised in the statement of profit or loss, net (242,660) — (18,369) — (335,969) — (162,806) — (162,904) — (922,708)Unallocated expenses (1,022,103)Finance costs (41,449) (1,973,843) (14,836) — (432,496) (20,752) (1,001,505) (494,265) (50,553) 145,134 (3,884,565)Share of profits and losses of– Joint ventures (57,790) (10,850) 4,737 — (20,731) — 7,684 1,204,129 — — 1,127,179– Associates 128,215 118,872 — (2,650) 929,148 295,279 89,660 112,586 — — 1,671,110 Profit/(loss) before tax 1,945,401 2,774,753 315,754 (2,650) 3,476,494 473,473 546,295 4,001,097 270,260 (73,483) 12,705,291Tax (551,954) (605,794) (50,814) — (538,434) — (104,546) (1,304,393) 29,293 7,411 (3,119,231) Profit/(loss) for the year 1,393,447 2,168,959 264,940 (2,650) 2,938,060 473,473 441,749 2,696,704 299,553 (66,072) 9,586,060 Segment and total assets 106,902,819 37,472,155 9,635,506 1,076,205 43,286,153 7,042,831 43,533,306 78,901,628 9,354,796 (12,372,616) 324,832,783 Segment and total liabilities 94,430,174 60,817,865 4,653,392 — 18,824,599 1,686,515 31,811,156 55,844,568 2,262,524 (21,182,502) 249,148,291 Other segment information:Depreciation and amortisation 77,622 35,536 1,472 — 613,960 10,119 1,411,396 29,554 129,780 — 2,309,439Impairment losses recognised in the statement of profit or loss 242,660 — 18,369 — 335,969 — 162,806 — 162,904 — 922,708Research and development costs — — — — 511,841 — 155,434 — — — 667,275Fair value gains on fair value adjustments of investment properties (33,886) (28,134) — — — — — (854,642) — — (916,662)Fair value (gains)/loss on investments at fair value through profit or loss (161,193) (2,552,954) — — 10,702 (219,232) (1,645) — — — (2,924,322)Investments in joint ventures 113,848 36,092 160,234 — 122,880 — 115,982 7,138,092 — (97,978) 7,589,150Investments in associates 1,852,816 3,213,996 52,642 216,205 11,739,451 3,352,433 2,535,547 3,583,279 430,035 — 26,976,404Capital expenditure** 374,290 279,412 561 — 1,457,607 162,974 2,878,652 16,191 378,228 — 5,547,915
* The sales to external customers of the insurance segment are further analysed in note 6.
** Capital expenditure consists of additions to property, plant and equipment, prepaid land lease payments, exploration and evaluation assets, mining rights, intangible assets, investment properties and oil and gas assets.

FOSUN INTERNATIONAL LIMITED Annual Report 2015 151
NOTES TO FINANCIAL STATEMENTSYear ended 31 December 2015
5. OPERATING SEGMENT INFORMATION (Continued)
Geographical information(a) Revenue from external customers
2015 2014RMB’000 RMB’000
Mainland China 51,833,431 51,606,349Portugal 10,796,266 6,069,378Other countries and regions 16,167,192 4,062,722
78,796,889 61,738,449
The revenue information above is based on the locations of the customers.
(b) Non-current assets
2015 2014RMB’000 RMB’000
Mainland China 99,767,075 90,417,228Hong Kong 2,433,251 3,197,364Portugal 14,622,408 13,419,564Other countries and regions 29,264,500 12,667,211
146,087,234 119,701,367
The non-current asset information above is based on the locations of the assets and excludes financial instruments, deferred tax assets and rights arising under insurance contracts.
Information about a major customerNo revenue amounting to 10% or more of the Group’s revenue was derived from sales to a single customer for the years ended 31 December 2015 and 2014.

FOSUN INTERNATIONAL LIMITED Annual Report 2015152
NOTES TO FINANCIAL STATEMENTSYear ended 31 December 2015
6. REVENUE, OTHER INCOME AND GAINSRevenue represents the net invoiced value of goods or properties sold after allowances for returns, trade discounts and various types of government surcharges, where applicable during the year. In addition, it includes the net earned premiums from insurance business, the value of services rendered and rental receivables from investment properties during the year.
An analysis of revenue, other income and gains is as follows:
2015 2014RMB’000 RMB’000
Revenue
Insurance revenue: Gross premiums written 17,846,826 8,832,514 Less: Premiums ceded to reinsurers and retrocessionaires (2,612,559) (710,430) Net premiums written 15,234,267 8,122,084 Change in unearned premium provisions, net of reinsurance (566,859) (254,444) Net earned premiums 14,667,408 7,867,640 Sale of goods: Pharmaceuticals and medical products 11,016,596 10,558,871 Properties 16,854,217 12,075,864 Iron and steel products 22,067,060 27,376,542 Ore products 873,403 1,602,138 Oil and gas 814,074 — Others 196,496 —
51,821,846 51,613,415 Rendering of services: Tourism 7,441,623 — Healthcare 4,309,700 1,425,073 Property agency 353,768 382,249 Property management 320,916 174,044 Leasing from investment properties 611,477 837,862 Asset management 403,401 360,199 Others 154,204 101,952
13,595,089 3,281,379 Subtotal 80,084,343 62,762,434Less: Government surcharges (1,287,454) (1,023,985)
78,796,889 61,738,449

FOSUN INTERNATIONAL LIMITED Annual Report 2015 153
NOTES TO FINANCIAL STATEMENTSYear ended 31 December 2015
6. REVENUE, OTHER INCOME AND GAINS (Continued)
2015 2014RMB’000 RMB’000
Other income
Interest income 912,697 606,402Dividends and interestsfrom available-for-sale investments 2,683,723 1,858,347Dividends and interests from investments at fair value through profit or loss 467,971 323,900Rental income 357,117 43,753Sale of scrap materials 84,369 2,603Government grants 314,163 269,181Consultancy and other service income 237,471 37,366Exchange gains, net — 412,034Insurance commissions 432,569 1,053,461Others 168,668 377,233
5,658,748 4,984,280 Gains
Gain on disposal of subsidiaries (note 54(b)) 7,180,957 —Gain on bargain purchase (note 54(a)) 847,409 61,148Gain on disposal of associates 361,587 59,081Gain on disposal of partial interests in associates 2,534,538 243,302Gain on deemed disposal of partial investments in associates — 728,288Gain on disposal of available-for-sale investments 6,671,444 3,597,875Gain on disposal of investments at fair value through profit or loss* 434,394 209,183Gain on disposal of non-current assets held for sale 130,600 51,253Gain on disposal of items of property, plant and equipment 1,714 13,984Gain on fair value adjustment of investment properties (note 14) 1,838,511 916,662Gain on fair value adjustment of investments at fair value through profit or loss — 2,924,322Gain on reversal of impairment of insurance and reinsurance debtors (note 30) 204,104 —
20,205,258 8,805,098 Other income and gains 25,864,006 13,789,378 Total revenue, other income and gains 104,660,895 75,527,827
* During the year ended 31 December 2015, gain on disposal of investments at fair value through profit or loss did not included the gain on fair value adjustment of above investments recognised in consolidated profit and loss statement in prior years amounted to RMB1,027,752,000 (2014: RMB719,952,000).

FOSUN INTERNATIONAL LIMITED Annual Report 2015154
NOTES TO FINANCIAL STATEMENTSYear ended 31 December 2015
7. FINANCE COSTSAn analysis of finance costs is as follows:
2015 2014RMB’000 RMB’000
Interest on bank and other borrowings (including convertible bonds) 5,662,882 4,861,443Incremental interest on other long term payables (note 50) 10,219 12,681
5,673,101 4,874,124Less: Interest capitalised, in respect of bank and other borrowings (notes 13 and 24) (1,313,812) (1,424,737) Interest expenses, net 4,359,289 3,449,387Interest on discounted bills 122,074 167,152Interest on finance leases 11,378 50,821Bank charges and other financial costs 231,290 217,205 Total finance costs 4,724,031 3,884,565
8. PROFIT BEFORE TAXThe Group’s profit before tax is arrived at after charging/(crediting):
2015 2014RMB’000 RMB’000
Cost of sales 61,135,274 47,122,683Staff costs (including directors’ and senior management’s remuneration as set out in note 9):Wages and salaries 8,780,491 4,944,963Accommodation benefits: Defined contribution fund 205,740 189,401Retirement costs: Defined contribution fund 671,761 453,649Equity-settled share-based payments (note 55) 98,185 38,360 Total staff costs 9,756,177 5,626,373

FOSUN INTERNATIONAL LIMITED Annual Report 2015 155
NOTES TO FINANCIAL STATEMENTSYear ended 31 December 2015
8. PROFIT BEFORE TAX (Continued)
The Group’s profit before tax is arrived at after charging/(crediting): (continued)
2015 2014RMB’000 RMB’000
Research and development costs 759,756 667,275Auditors’ remuneration 10,700 9,800Depreciation of items of property, plant and equipment (note 13) 2,746,177 2,088,031Amortisation of prepaid land lease payments (note 15) 76,107 46,296Amortisation of mining rights (note 17) 26,945 43,298Amortisation of intangible assets (note 19) 414,535 131,814Amortisation of oil and gas assets (note 18) 483,401 —Provision for impairment of receivables 142,892 241,811Reversal of impairment of insurance and reinsurance debtors (204,104) —Provision for inventories 381,595 92,292Provision for impairment of goodwill (note 20) — 202,500Provision for impairment of items of property, plant and equipment (note 13) 125,975 5,853Provision for impairment of investments in associates 49,153 38,134Provision for impairment of available-for-sale investments 1,823,695 99,783Provision for impairment of intangible assets (note 19) — 83,995Provision for impairment of mining rights (note 17) 101,523 —Provision for impairment of oil and gas assets (note 18) 338,224 158,340Provision for impairment of properties under development (note 24) 377,631 —Provision for impairment of completed properties for sale 401,926 —Operating lease rentals 1,076,657 211,109Exchange loss/(gain), net 80,980 (412,034)Loss on fair value adjustment of investments at fair value through profit or loss 1,912,096 —Loss on the settlement of derivative financial instruments 121,678 53,438Loss on disposal of subsidiaries — 15,873Loss on disposal of joint ventures 73,946 —
* At 31 December 2015, the Group had no forfeited contributions available to reduce its contributions to the pension schemes in the future years (2014: Nil).

FOSUN INTERNATIONAL LIMITED Annual Report 2015156
NOTES TO FINANCIAL STATEMENTSYear ended 31 December 2015
9. DIRECTORS’ AND SENIOR MANAGEMENT’S REMUNERATION(a) Directors’ remuneration
Directors’ remuneration for the year, disclosed pursuant to the Listing Rules, section 383(1) (a), (b), (c) and (f) of the Hong Kong Companies Ordinance and Part 2 of the Companies (Disclosure of Information about Benefits of Directors) Regulation, is as follows:
2015 2014RMB’000 RMB’000
Salaries, allowances and benefits in kind 28,028 29,101Performance related bonus* 33,601 18,818Equity-settled share award scheme expense 7,536 —Pension scheme contributions 378 343
69,543 48,262
* The executive directors of the Company are entitled to performance related bonus which is determined based on internal appraisal of various performance indicators.
During the year, certain directors were granted share award, in respect of their services to the Group, under the share award scheme of the Company, further details of which are set out in note 55 to the financial statements. The fair value of such award, which has been recognised in the consolidated statement of profit or loss over the vesting period, was determined as at the date of grant and the amount included in the financial statements for the current year is included in the above directors’ remuneration disclosures.
There were no emoluments paid by the Group to the directors as an inducement to join the Group, or upon joining the Group, or as compensation for loss of office during the year.
(i) Independent non-executive directorsThe remuneration of independent non-executive directors during the year were as follows:
2015 2014RMB’000 RMB’000
Zhang Shengman 499 436Andrew Y. Yan (resigned on 26 September 2014) — 320Zhang Huaqiao 499 436David T. Zhang 499 436Yang Chao 443 —
1,940 1,628
There were no other remuneration payable to the independent non-executive directors during the year (2014: Nil).

FOSUN INTERNATIONAL LIMITED Annual Report 2015 157
NOTES TO FINANCIAL STATEMENTSYear ended 31 December 2015
9. DIRECTORS’ AND SENIOR MANAGEMENT’S REMUNERATION (Continued)
(a) Directors’ remuneration (Continued)
(ii) Executive directors and a non-executive director
Equity-Salaries, settled
allowances Performance Pension share award Totaland benefits related scheme scheme remune-
Fees in kind bonus contributions expense rationRMB’000 RMB’000 RMB’000 RMB’000 RMB’000 RMB’000
Year ended 31 December 2015
Executive directors:
Guo Guangchang — 4,627 5,584 55 — 10,266 Liang Xinjun* — 4,427 5,170 55 — 9,652 Wang Qunbin — 4,427 5,332 55 — 9,814 Ding Guoqi — 3,627 4,099 55 1,743 9,524 Qin Xuetang — 3,527 3,808 55 1,631 9,021 Wu Ping (resigned as executive director on 10 July 2015) — 1,713 2,807 27 1,519 6,066 Chen Qiyu (appointed as executive director on 10 July 2015) — 1,651 4,991 21 1,406 8,069 Xu Xiaoliang (appointed as executive director on 10 July 2015) — 1,304 1,810 28 1,069 4,211
— 25,303 33,601 351 7,368 66,623Non-executive director:
Fan Wei (resigned as non-executive director on 10 July 2015) — 953 — 27 — 980
— 26,256 33,601 378 7,368 67,603

FOSUN INTERNATIONAL LIMITED Annual Report 2015158
NOTES TO FINANCIAL STATEMENTSYear ended 31 December 2015
9. DIRECTORS’ AND SENIOR MANAGEMENT’S REMUNERATION (Continued)
(a) Directors’ remuneration (Continued)
(ii) Executive directors and a non-executive director (Continued)
Equity-Salaries, settled
allowances Performance Pension share award Totaland benefits related scheme scheme remune-
Fees in kind bonus contributions expense rationRMB’000 RMB’000 RMB’000 RMB’000 RMB’000 RMB’000
Year ended 31 December 2014
Executive directors:
Guo Guangchang — 4,225 3,699 49 — 7,973 Liang Xinjun — 4,225 3,569 49 — 7,843 Wang Qunbin — 4,225 3,569 49 — 7,843 Ding Guoqi — 3,595 2,747 49 — 6,391 Qin Xuetang — 3,595 2,617 49 — 6,261 Wu Ping — 3,595 2,617 49 — 6,261
— 23,460 18,818 294 — 42,572Non-executive director:
Fan Wei — 4,013 — 49 — 4,062
— 27,473 18,818 343 — 46,634
* Chief executive officer of the Company.
There was no arrangement under which a director waived or agreed to waive any remuneration during the year.

FOSUN INTERNATIONAL LIMITED Annual Report 2015 159
NOTES TO FINANCIAL STATEMENTSYear ended 31 December 2015
9. DIRECTORS’ AND SENIOR MANAGEMENT’S REMUNERATION (Continued)
(b) Five highest paid employeesThe five highest paid employees during the year included four directors and one senior management (2014: five directors), details of whose remuneration are set out in note 9(a) above. Details of the remuneration for the year of the remaining one (2014: nil) highest paid employee who is neither a director nor chief executive of the Company are as follows:
2015 2014RMB’000 RMB’000
Salaries, allowances and benefits in kind 2,587 —Performance related bonuses 9,884 —Equity-settled share award scheme expense 791 —Pension scheme contributions 55 —
13,317 —
During the year, share award was granted to a non-director highest paid employee in respect of his services to the Group, further details of which are included in the disclosures in note 55 to the financial statements. The fair value of such award, which has been recognised in the statement of profit or loss over the vesting period, was determined as at the date of grant and the amount included in the financial statements for the current year is included in the above non-director highest paid employee’s remuneration disclosures.
There were no emoluments paid by the Group to, or receivable from the Group by, the five highest paid individuals as an inducement to join the Group, or upon joining the Group, or as compensation for loss of office during the year.
(c) Senior management’s remunerationThe number of senior management whose remuneration fell within the following bands is as follows:
Number ofemployees
2015 Nil to RMB1,000,000 5RMB1,000,001 to RMB2,000,000 —RMB2,000,001 to RMB4,000,000 2RMB4,000,001 to RMB6,000,000 1RMB6,000,001 to RMB8,000,000 7RMB8,000,001 to RMB10,000,000 2RMB10,000,001 to RMB12,000,000 1RMB12,000,001 to RMB14,000,000 1
19

FOSUN INTERNATIONAL LIMITED Annual Report 2015160
NOTES TO FINANCIAL STATEMENTSYear ended 31 December 2015
10. TAXHong Kong profits tax has been provided at the rate of 16.5% (2014: 16.5%) on the estimated assessable profits arising in Hong Kong during the year. Taxes on profits assessable elsewhere have been calculated at the rates of tax prevailing in the jurisdictions in which the Group operates.
The provision for current income tax of Alma Lasers Ltd. (“Alma Lasers”), a subsidiary of Fosun Pharma incorporated in Israel, is based on a preferential rate of 16% (2014: 16%).
The provision for income tax of Fidelidade - Companhia de Seguros, S.A., Multicare - Seguros de Saúde, S.A. and Fidelidade Assistência - Companhia de Seguros, S.A., subsidiaries incorporated in Portugal acquired by the Group in 2014, is based on a rate of 29.5% (2014: 31.5%).
The provision for income tax of Ironshore Inc. (“Ironshore”) and its subsidiaries incorporated in the United States acquired by the Group in 2015, is based on a rate of 35%.
The provision for income tax of Meadowbrook Insurance Group, Inc. (“MIG”) and its subsidiaries incorporated in the United States acquired by the Group in 2015, is based on a rate of 35%.
The provision for income tax of Holding Gaillon II and its subsidiaries incorporated in France acquired by the Group in 2015, is based on a rate of 38%.
The provision for Mainland China current income tax was based on a statutory rate of 25% (2014: 25%) of the assessable profit of the Group as determined in accordance with the Enterprise Income Tax Law of the People’s Republic of China which was approved and became effective on 1 January 2008, except for certain subsidiaries of the Group in Mainland China, which were taxed at preferential rates of 0% to 20%.
The major components of tax expenses for the years ended 31 December 2015 and 2014 are as follows:
2015 2014RMB’000 RMB’000
Current – Portugal, Hong Kong and others 1,818,039 465,440Current – Mainland China – Income tax in Mainland China for the year 2,776,949 1,182,341 – LAT in Mainland China for the year 771,557 631,757Deferred (137,423) 839,693 Tax expenses for the year 5,229,122 3,119,231

FOSUN INTERNATIONAL LIMITED Annual Report 2015 161
NOTES TO FINANCIAL STATEMENTSYear ended 31 December 2015
10. TAX (Continued)
A reconciliation between the tax expenses and profit before tax excluding share of profits and losses of associates and joint ventures at the applicable statutory rates for the jurisdictions in which the Company and its subsidiaries are domiciled is as follows:
Portugal,Hong Kong Mainlandand others China Total
RMB’000 RMB’000 RMB’000 2015
Profit before tax excluding share of profits and losses of associates and joint ventures 2,728,981 10,312,539 13,041,520 Tax at the applicable tax rate 845,601 2,578,135 3,423,736Different tax rates for specific entities 82,536 (246,237) (163,701)Tax effect of: Income not subject to tax (490,648) (273,405) (764,053) Tax impact on the outside basis difference recognised in current year 466,707 233,825 700,532 Expenses not deductible for tax 512,836 88,371 601,207 Tax losses and temporary differences not recognised 300,584 723,662 1,024,246 Tax losses utilised (30,559) (230,593) (261,152) Effect of withholding tax at 5% on the distributable profits of the Group’s PRC subsidiaries (note 27) — 178,779 178,779 Over provision in prior years (12,867) (10,524) (23,391) Tax incentives on eligible expenditures (13,117) (21,310) (34,427) Subtotal 1,661,073 3,020,703 4,681,776 Provision for LAT for the year — 299,483 299,483Deferred tax effect of provision for LAT (note 27) — (74,871) (74,871)Prepaid LAT for the year — 472,074 472,074Tax effect of prepaid LAT — (118,019) (118,019)Decrease in deferred LAT in deferred tax liability (note 27) — (31,321) (31,321) Tax expenses 1,661,073 3,568,049 5,229,122

FOSUN INTERNATIONAL LIMITED Annual Report 2015162
NOTES TO FINANCIAL STATEMENTSYear ended 31 December 2015
10. TAX (Continued)
Portugal,Hong Kong Mainlandand others China Total
RMB’000 RMB’000 RMB’000 2014
Profit before tax excluding share of profits and losses of associates and joint ventures 3,863,491 6,043,511 9,907,002 Tax at the applicable tax rate 926,207 1,510,878 2,437,085Lower tax rates for specific entities (16,808) (130,481) (147,289)Tax effect of: Income not subject to tax (290,418) (56,159) (346,577) Expenses not deductible for tax 181,375 50,907 232,282 Tax losses not recognised 99,074 460,144 559,218 Tax losses utilised (5,858) (4,454) (10,312) Temporary differences utilised — (103,303) (103,303) Effect of withholding tax at 5% on the distributable profits of the Group’s PRC subsidiaries (note 27) — 112,749 112,749 Over provision in prior years (9,179) (24,445) (33,624) Tax incentives on eligible expenditures (779) (32,292) (33,071) Subtotal 883,614 1,783,544 2,667,158 Provision for LAT for the year — 114,460 114,460Deferred tax effect of provision for LAT (note 27) — (28,615) (28,615)Prepaid LAT for the year — 517,297 517,297Tax effect of prepaid LAT — (129,324) (129,324)Deferred LAT in deferred tax liability (note 27) — (21,815) (21,815)Decrease in deferred tax effect of deferred LAT in deferred tax liability — 70 70 Tax expenses 883,614 2,235,617 3,119,231

FOSUN INTERNATIONAL LIMITED Annual Report 2015 163
NOTES TO FINANCIAL STATEMENTSYear ended 31 December 2015
10. TAX (Continued)
According to the tax notices issued by the relevant local tax authorities, the Group commenced to pay land appreciation tax (“LAT”) at rates ranging from 0.5% to 5% on proceeds from the sale and pre-sale of properties from 2004. Prior to 2007, except for the mentioned amount paid to the local tax authorities, no further provision for LAT had been made. The Directors considered that the relevant tax authorities would be unlikely to impose additional LAT levies other than the amount already paid based on the relevant percentages of the proceeds from the sale and pre-sale of the Group’s properties.
During the year, the prepaid LAT of the Group amounted to RMB472,074,000 (2014: RMB517,297,000).
In addition, based on the latest understanding of the LAT regulations from the State Administration of Taxation, the Group made an additional LAT provision in the amount of RMB521,780,000 (2014: RMB209,643,000) in respect of the sales of properties in the year in accordance with the requirements set forth in the relevant PRC tax laws and regulations. During the year, unpaid LAT provision in the amount of RMB222,297,000 (2014: RMB95,183,000) was reversed to the consolidated statement of profit or loss upon the completion of the liquidation and clearance with the local tax authorities by certain subsidiaries of the Group. The net accrual of LAT provision for the year is RMB299,483,000 (2014: net reversal of RMB114,460,000).
11. DIVIDENDS2015 2014
RMB’000 RMB’000 Proposed final – HKD0.17 (2014: HKD0.17) per ordinary share 1,226,242 928,359
The proposed final dividend of HKD0.17 per ordinary share for the year ended 31 December 2014 was declared and approved by the shareholders at the annual general meeting of the Company on 28 May 2015.
On 30 March 2016, the board of directors of the Company resolved to propose a final dividend for the year ended 31 December 2015 of HKD0.17 per ordinary share, subject to the approval by the shareholders at the forthcoming annual general meeting of the Company.
12. EARNINGS PER SHARE ATTRIBUTABLE TO ORDINARY EQUITY HOLDERS OF THE PARENTThe calculation of the basic earnings per share amount is based on the profit for the year attributable to ordinary equity holders of the parent and the weighted average number of ordinary shares of 7,580,400,646 (2014: 6,727,614,266) in issue during the year.
The calculation of the diluted earnings per share amount is based on the profit for the year attributable to ordinary equity holders of the parent, adjusted to reflect the cash dividends distributed to the share award scheme and the interest on the convertible bonds. The weighted average number of ordinary shares used in the calculation is the number of ordinary shares in issue during the year, as used in the basic earnings per share calculation, and the weighted average number of ordinary shares assumed to have been issued at no consideration on the deemed exercise or conversion of all dilutive potential ordinary shares into ordinary shares.

FOSUN INTERNATIONAL LIMITED Annual Report 2015164
NOTES TO FINANCIAL STATEMENTSYear ended 31 December 2015
12. EARNINGS PER SHARE ATTRIBUTABLE TO ORDINARY EQUITY HOLDERS OF THE PARENT (Continued)
The calculations of basic and diluted earnings per share are based on:
Year ended 31 December
2015 2014RMB’000 RMB’000
EarningsProfit attributable to ordinary equity holders of the parent, used in the basic earnings per share calculation 8,038,282 6,853,944Less: cash dividends distributed to share award scheme (613) — Adjusted profit attributable to ordinary equity holders of the parent, used in the basic earnings per share calculation 8,037,669 6,853,944
Interest on convertible bonds 89,457 207,618Cash dividends distributed to share award scheme 613 — Profit attributable to ordinary equity holders of the parent, used in the diluted earnings per share calculation 8,127,739 7,061,562
Number of shares
2015 2014 SharesWeighted average number of ordinary shares in issue during the year used in the basic earnings per share calculation 7,580,400,646 6,727,614,266
Effect of dilution – weighted average number of ordinary shares: – Share award scheme 3,070,986 — – Convertible bonds 171,925,754 387,500,000 Weighted average number of ordinary shares used in the calculation of diluted earnings per share 7,755,397,386 7,115,114,266 Basic earnings per share (RMB) 1.06 1.02 Diluted earnings per share (RMB) 1.05 0.99

FOSUN INTERNATIONAL LIMITED Annual Report 2015 165
NOTES TO FINANCIAL STATEMENTSYear ended 31 December 2015
13. PROPERTY, PLANT AND EQUIPMENTPlant and Office Motor Leasehold Mining Construction
Buildings machinery equipment vehicles improvements infrastructure in progress TotalRMB’000 RMB’000 RMB’000 RMB’000 RMB’000 RMB’000 RMB’000 RMB’000
Cost: At 1 January 2014 11,572,046 19,183,186 650,037 454,912 36,095 653,360 10,878,638 43,428,274 Additions 544,275 171,205 178,497 56,687 33,786 3,157 4,041,011 5,028,618 Transferred from construction in progress 3,198,167 7,281,654 153,102 69,330 — 637 (10,702,890) — Acquisition of subsidiaries 2,858,718 132,074 388,467 981 — — 15,466 3,395,706 Disposal of subsidiaries (122,866) (25,218) (5,504) (2,859) (4,307) — — (160,754) Disposals (54,019) (74,234) (52,738) (21,691) (4,393) — (73,822) (280,897) Included in assets of a disposal group classified as held for sale (11,670) (10,713) (32,678) (6,915) (10,479) — (994) (73,449) Exchange realignment (125,406) — (13,829) — — — — (139,235) At 31 December 2014 and 1 January 2015 17,859,245 26,657,954 1,265,354 550,445 50,702 657,154 4,157,409 51,198,263 Additions 295,436 239,976 197,938 12,247 25,166 35,015 2,326,480 3,132,258 Transferred from construction in progress 988,619 1,583,760 9,890 8,940 — 21,329 (2,612,538) — Transfer to investment properties (note 14) (90,095) — (14) — — — — (90,109) Acquisition of subsidiaries (note 54(a)) 4,301,460 331,894 418,981 2,219 48,842 — 187,869 5,291,265 Disposal of subsidiaries (11,285,766) (24,151,720) (395,101) (287,622) — (713,498) (931,594) (37,765,301) Disposals (130,992) (241,471) (308,974) (14,087) (31,237) — (28,999) (755,760) Exchange realignment (141,374) 9,801 (14,921) — 675 — (103,391) (249,210) At 31 December 2015 11,796,533 4,430,194 1,173,153 272,142 94,148 — 2,995,236 (20,761,406)

FOSUN INTERNATIONAL LIMITED Annual Report 2015166
NOTES TO FINANCIAL STATEMENTSYear ended 31 December 2015
13. PROPERTY, PLANT AND EQUIPMENT (Continued)
Plant and Office Motor Leasehold Mining ConstructionBuildings machinery equipment vehicles improvements infrastructure in progress TotalRMB’000 RMB’000 RMB’000 RMB’000 RMB’000 RMB’000 RMB’000 RMB’000
Accumulated depreciation: At 1 January 2014 3,206,826 8,908,604 358,991 280,006 21,472 188,294 — 12,964,193 Charge for the year 454,462 1,425,286 145,563 33,789 6,303 22,628 — 2,088,031 Disposal of subsidiaries (13,004) (14,180) (2,508) (1,573) (2,213) — — (33,478) Disposals (15,535) (32,898) (8,366) (16,593) (4,301) — — (77,693) Exchange realignment — — 595 — — — — 595 Included in assets of a disposal group classified as held for sale (2,734) (7,293) (13,176) (3,442) — — — (26,645) At 31 December 2014 and 1 January 2015 3,630,015 10,279,519 481,099 292,187 21,261 210,922 — 14,915,003 Charge for the year (note 8) 755,469 1,596,417 312,880 47,894 11,973 21,544 — 2,746,177 Transfer to investment properties (note 14) (4,284) — — — — — — (4,284) Disposal of subsidiaries (2,976,701) (10,054,316) (299,977) (165,266) — (232,466) — (13,728,726) Disposals (103,249) (147,067) (256,812) (12,032) (4,679) — — (523,839) Exchange realignment (82,101) (15,349) (37,229) — 178 — — (134,501) At 31 December 2015 1,219,149 1,659,204 199,961 162,783 28,733 — — 3,269,830 Impairment loss: At 1 January 2014 67,287 180,115 289 568 — — 75 248,334
Charge for the year 2,967 2,614 272 — — — — 5,853 Disposal of subsidiaries — (5,867) — — — — — (5,867) Disposals (1,508) (1,441) — (7) — — — (2,956) At 31 December 2014 and 1 January 2015 68,746 175,421 561 561 — — 75 245,364 Charge for the year (note 8) 45,475 9,065 53 156 1,175 — 70,051 125,975 Transfer to investment properties (note 14) (6,082) — — — — — — (6,082) Disposals (11,201) (39,083) — (214) — — — (50,498) Exchange realignment 977 (364) — — — — (231) 382 At 31 December 2015 97,915 145,039 614 503 1,175 — 69,895 315,141 Net book value: At 31 December 2015 10,479,469 2,625,951 972,578 108,856 64,240 — 2,925,341 17,176,435 At 31 December 2014 14,160,484 16,203,014 783,694 257,697 29,441 446,232 4,157,334 36,037,896

FOSUN INTERNATIONAL LIMITED Annual Report 2015 167
NOTES TO FINANCIAL STATEMENTSYear ended 31 December 2015
13. PROPERTY, PLANT AND EQUIPMENT (Continued)
(1) The net book values of property, plant and equipment pledged as security for interest-bearing bank loans granted to the Group are as follows (note 37):
2015 2014RMB’000 RMB’000
Buildings 368,023 166,764Plant and machinery — 786,843Mining infrastructure — 491,490
368,023 1,445,097
(2) Capitalised interest expenses included in construction in progress of the Group are as follows (note 7):
2015 2014RMB’000 RMB’000
Interest expenses capitalised 82,665 142,027
(3) As at 31 December 2015, the Group was in the process of applying for property certificates of plant and office buildings with a net book value of approximately RMB512,293,000 (2014: RMB2,773,743,000).
(4) The net carrying amount of the Group’s property, plant and equipment held under finance leases included in the total amount of plant and machinery at 31 December 2015 was RMB41,265,000 (2014: RMB114,113,000).
14. INVESTMENT PROPERTIES2015 2014
RMB’000 RMB’000 Cost:Carrying amount at 1 January 16,883,890 9,896,252Additions 4,034,045 245,991Acquisition of subsidiaries (note 54(a)) 17,684,506 5,830,453Transfer from properties under development — 974,734Transfer from properties held for sale — 355,782Transfer from property, plant and equipment (note 13) 79,743 —Gain on fair value adjustments (note 6) 1,838,511 916,662Disposal of subsidiaries — (776,000)Disposal (35,920) —Exchange realignment 413,914 (559,984) Carrying amount at 31 December 40,898,689 16,883,890

FOSUN INTERNATIONAL LIMITED Annual Report 2015168
NOTES TO FINANCIAL STATEMENTSYear ended 31 December 2015
14. INVESTMENT PROPERTIES (Continued)
The Group’s investment properties consist of commercial properties, which are located in Beijing, Shanghai, Hangzhou, Chengdu, Tianjin and Chongqing of Mainland China, New York City of the United States of America, Tokyo of Japan and other cities in Europe and Australia. The directors of the Company have determined that the investment properties are commercial assets based on the nature, characteristics and risks of these properties.
The Group’s investment properties were valued on 31 December 2015 by several independent professionally qualified valuers. Selection criteria of the valuer include market knowledge, reputation, independence and whether professional standards are maintained. The management of the Company has discussions with the valuer on the valuation assumptions and valuation results twice a year when the valuation is performed for interim and annual financial reporting.
The Group’s investment properties, Triton Square, Shibuya World East Building and FLEG Harajuku, in Tokyo, Japan were acquired by an indirectly owned subsidiary of the Company, at considerations of JPY10,288,000,000 (equivalent to RMB554,266,000) in December 2015, JPY2,721,490,000 (equivalent to RMB140,217,000) in April 2015 and JPY545,918,000 (equivalent to RMB28,127,000) in April 2015, respectively, from independent third parties. The directors of the Company are of the opinion that the fair value of the Triton Square, Shibuya World East Building and FLEG Harajuku equalled to the purchase considerations as Triton Square, Shibuya World East Building and FLEG Harajuku were acquired from independent third parties in an open market and there was no significant change in the commercial property market in Tokyo, Japan between the acquisition date and 31 December 2015.
The Group’s investment properties, Broggi Palace, Piazza Cordusio in Milan, Italy and 73 Miller Street properties in Sydney, Australia, were acquired by an indirectly owned subsidiary of the Company, at considerations of EUR321,564,000 (equivalent to RMB2,156,987,000) in July 2015 and EUR74,579,000 (equivalent to RMB497,054,000) in March 2015, respectively, from independent third parties. The directors of the Company are of the opinion that the fair value equalled to the purchase consideration as Broggi Palace and 73 Miller Street properties were acquired from independent third parties in an open market and there was no significant change in the commercial property market in Milan, Italy and in Sydney, Australia between the acquisition date and 31 December 2015.
The investment properties are leased to third parties under operating leases, further summary details of which are included in note 56 to the financial statements.
At 31 December 2015, the Group’s certain investment properties with a net carrying amount of approximately RMB19,227,824,000 (2014: RMB5,433,000,000) were pledged to secure bank loans, as set out in note 37 to the financial statements.
Fair value hierarchyThe following table illustrates the fair value measurement hierarchy of the Group’s investment properties:
Fair value measurementas at 31 December 2015 using
Quoted prices Significant Significantin active observable unobservablemarkets inputs inputs(Level 1) (Level 2) (Level 3) Total
Recurring fair value measurement for: RMB’000 RMB’000 RMB’000 RMB’000 Commercial properties — — 40,898,689 40,898,689
Fair value measurementas at 31 December 2014 using
Quoted prices Significant Significantin active observable unobservablemarkets inputs inputs(Level 1) (Level 2) (Level 3) Total
Recurring fair value measurement for: RMB’000 RMB’000 RMB’000 RMB’000 Commercial properties — — 16,883,890 16,883,890

FOSUN INTERNATIONAL LIMITED Annual Report 2015 169
NOTES TO FINANCIAL STATEMENTSYear ended 31 December 2015
14. INVESTMENT PROPERTIES (Continued)
Fair value hierarchy (Continued)
During the year, there were no transfers of fair value measurements between Level 1 and Level 2 and no transfers into or out of Level 3 (2014:Nil).
Below is a summary of the valuation techniques used and the key inputs to the valuation of investment properties:
Valuation Significant 2015 Range/ 2014 Range/techniques unobservable inputs weighted average weighted average
28 Liberty Direct comparison Terminal capitalisation
approach and rate (Year 10) 5.0% 5.3%discounted Discount rate 7.5% 7.8%cash flow approach Market rent:
– modified gross (Year 1) (Square foot/year) USD39.67 to USD 65.92 USD45 to USD70General vacancy/credit 6.0% 6.0% loss rate (stabilised-Year 4) (stabilized-Year 6)
Tokyo Front Direct comparison Terminal capitalisation rate 4.4% — Terrace approach and Discount rate 4.0% —
discounted Market rent (per tsubo) JPY18,000 —cash flow approach Occupancy rate 96.0% —
Shanghai Zendai Direct comparison Discount rate 6.4% — Bund International approach and Market rent: — Finance Services discounted - office (Rmb/sq.m./day) 11.78 — Centre Real Estate cash flow approach Retail-1F (Rmb/sq.m./day) 21.72 — Company Limited CPS (Rmb/unit/month) 1,500 — (“BFC”) Level adjustments 30% to 100% —
Fosun International Direct comparison Term yield 5.5% to 6.5% 5.5% to 6.5% Center in Beijing approach and direct Market rent:
capitalisation - per sq.m. and per month RMB240 to RMB300 RMB238 to RMB277approach - per slot of parking
space/month RMB1,100 RMB1,100Level adjustments 40% to 50% 30% to 60%Market yield 6.0% to 7.0% 6.0% to 7.0%Reversionary period From 1 January 2016 to From 1 January 2015 to
30 August 2054 30 August 2054

FOSUN INTERNATIONAL LIMITED Annual Report 2015170
NOTES TO FINANCIAL STATEMENTSYear ended 31 December 2015
14. INVESTMENT PROPERTIES (Continued)
Fair value hierarchy (Continued)
Valuation Significant 2015 Range/ 2014 Range/techniques unobservable inputs weighted average weighted average
Chengdu Forte Direct comparison Term yield 5.5% 5.5% International approach and direct Market rent:
capitalisation - per s.q.m. and per month RMB50 to RMB238 RMB53 to RMB231approach Level adjustments 40% to 70% 30% to 60%
Market yield 6.0% 6.0%Reversionary period From 1 January 2016 to From 1 January 2015 to
2 July 2048 2 July 2048
Other commercial Direct comparison Term yield 4.0% to 7.0% 3.0% to 6.5% properties approach and direct Market rent:
capitalisation - per s.q.m. and per month RMB48 to RMB400 RMB45 to RMB225approach - per slot of parking
space/month RMB300 to RMB400 RMB301 to RMB395Level adjustments 20% to 70% 30% to 70%Market yield 3.0% to 7.5% 3.5% to 7.5%Reversionary period From 1 January 2016 to From 1 January 2015 to
13 May 2073 13 May 2073
Direct comparison approach is a method of valuation based on comparing the property of the Group to be assessed directly with other comparable properties which have been recently changed hands or leased. These premises are generally located in the surrounding areas or in another market which is comparable to the property of the Group. However, because of the heterogeneous nature of real estate properties, appropriate adjustments are usually required to allow for any qualitative and quantitative difference that may affect the price/rent likely to be achieved by the property under consideration.
The direct capitalisation approach (term and reversion method, in particular) is a method by capitalising the rental from existing tenancies and the reversionary income potential at an appropriate market yield for the remaining term of the land use rights of the property of the Group. Capitalisation rate is derived from the relationship between the market rent and the market capital value of other similar properties in the locality.
Under the discounted cash flow method, fair value is estimated using assumptions regarding the benefits and liabilities of ownership over the asset’s life including an exit or terminal value. This method involves the projection of a series of cash flows on a property interest. A market-derived discount rate is applied to the projected cash flow in order to establish the present value of the income stream associated with the asset. The exit yield is normally separately determined and differs from the discount rate.
The duration of the cash flows and the specific timing of inflows and outflows are determined by events such as rent reviews, lease renewal and related reletting, redevelopment or refurbishment. The appropriate duration is driven by market behaviour that is a characteristic of the class of property. The periodic cash flow is estimated as gross income less vacancy, non-recoverable expenses, collection losses, lease incentives, maintenance costs, agent and commission costs and other operating and management expenses. The series of periodic net operating income, along with an estimate of the terminal value anticipated at the end of the projection period, is then discounted.
A significant increase/(decrease) in the estimated market rent would result in a significant increase/(decrease) in the fair value of the investment properties. A significant increase/(decrease) in the term yield and market yield in isolation would result in a significant decrease/(increase) in the fair value of the investment properties.

FOSUN INTERNATIONAL LIMITED Annual Report 2015 171
NOTES TO FINANCIAL STATEMENTSYear ended 31 December 2015
15. PREPAID LAND LEASE PAYMENTS2015 2014
RMB’000 RMB’000 Cost: At 1 January 3,174,186 2,200,794 Additions 412,939 83,454 Acquisition of subsidiaries (note 54(a)) 11,594 51,258 Transfer from properties under development — 839,262 Included in assets of a disposal group classified as held for sale — (582) Disposal of subsidiaries (1,143,359) — Disposals (119,124) — At 31 December 2,336,236 3,174,186 Accumulated amortisation: At 1 January 252,793 206,819 Amortisation for the year (note 8) 76,107 46,296 Included in assets of a disposal group classified as held for sale — (322) Disposal of subsidiaries (125,682) — Disposals (10,870) — At 31 December 192,348 252,793 Net book value: At 31 December 2,143,888 2,921,393 At 1 January 2,921,393 1,993,975 Net book value pledged as security for bank loans (note 37) 1,022,849 587,199
As at 31 December 2015, the Group has no leasehold land in the process of applying for the land use certificates (2014: RMB49,066,000).

FOSUN INTERNATIONAL LIMITED Annual Report 2015172
NOTES TO FINANCIAL STATEMENTSYear ended 31 December 2015
16. EXPLORATION AND EVALUATION ASSETS2015 2014
RMB’000 RMB’000 At 1 January 156,846 5,189Additions 135,325 22,272Acquisition of subsidiaries — 129,385Transfer to oil and gas assets (note 18) (15,885) —Exploration assets expensed and written off (86,411) —Exchange realignment 7,625 — At 31 December 197,500 156,846
17. MINING RIGHTS2015 2014
RMB’000 RMB’000 Cost: At 1 January 1,541,829 1,508,285 Additions — 33,544 Disposal of subsidiaries (note 54(b)) (165,117) — At 31 December 1,376,712 1,541,829 Accumulated amortisation: At 1 January 570,385 527,087 Amortisation for the year (note 8) 26,945 43,298 Disposal of subsidiaries (note 54(b)) (73,210) — At 31 December 524,120 570,385 Impairment loss: At 1 January 186,562 186,562 Charge for the year (note 8) 101,523 — At 31 December 288,085 186,562 Net book value: At 31 December 564,507 784,882 At 1 January 784,882 794,636

FOSUN INTERNATIONAL LIMITED Annual Report 2015 173
NOTES TO FINANCIAL STATEMENTSYear ended 31 December 2015
18. OIL AND GAS ASSETS2015 2014
RMB’000 RMB’000 Cost: At 1 January 1,670,546 — Additions 342,417 — Acquisition of subsidiaries — 1,670,546 Transferred from exploration and evaluation assets (note 16) 15,885 — Disposal of subsidiaries (note 54(b)) (169,976) — Exchange realignment 102,253 — At 31 December 1,961,125 1,670,546 Accumulated amortisation: At 1 January — — Amortisation for the year (note 8) 483,401 — Disposal of subsidiaries (note 54(b)) (11,187) — Exchange realignment 8,368 — At 31 December 480,582 — Impairment loss: At 1 January 158,340 — Charge for the year (note 8) 338,224 158,340 Exchange realignment 13,743 — At 31 December 510,307 158,340 Net book value: At 31 December 970,236 1,512,206 At 1 January 1,512,206 —

FOSUN INTERNATIONAL LIMITED Annual Report 2015174
NOTES TO FINANCIAL STATEMENTSYear ended 31 December 2015
19. INTANGIBLE ASSETSBusiness
networkand Patent and
Medicine customer technicallicences Trademarks relationship know-how Others TotalRMB’000 RMB’000 RMB’000 RMB’000 RMB’000 RMB’000
Cost: At 1 January 2014 321,000 266,894 520,598 817,503 98,081 2,024,076 Additions — 1,188 — 82,025 50,823 134,036 Acquisition of subsidiaries 174,000 39,000 36,000 126,518 189,951 565,469 Included in assets of a disposal group classified as held for sale — (75,000) — — (870) (75,870) Exchange realignment — (795) — — (22,614) (23,409) Disposals — — — (15,947) (19,558) (35,505) At 31 December 2014 and 1 January 2015 495,000 231,287 556,598 1,010,099 295,813 2,588,797 Additions 88,283 2,178 — 288,828 139,069 518,358 Acquisition of subsidiaries (note 54(a)) — 2,465,102 1,898,386 — 2,490,761 6,854,249 Disposal of subsidiaries — — — — (42) (42) Exchange realignment — 90,954 47,678 90 42,400 181,122 Disposals — (718) — (161,094) (14,727) (176,539) At 31 December 2015 583,283 2,788,803 2,502,662 1,137,923 2,953,274 9,965,945 Accumulated amortisation: At 1 January 2014 — 564 36,578 101,608 13,176 151,926 Provided during the year — — 18,267 58,090 55,457 131,814 Exchange realignment — — — — 262 262 Disposals — — — (338) (6,649) (6,987) At 31 December 2014 and 1 January 2015 — 564 54,845 159,360 62,246 277,015 Reclassification — — 26,730 (26,730) — — Provided during the year (note 8) 1,962 12,915 64,155 66,821 268,682 414,535 Disposal of subsidiaries — — — — (36) (36) Exchange realignment — 105 653 51 (60) 749 Disposals — (421) — — (936) (1,357) At 31 December 2015 1,962 13,163 146,383 199,502 329,896 690,906 Impairment loss: At 1 January 2014 — — — 622 472 1,094 Charge for the year 64,000 — — 19,520 475 83,995 At 31 December 2014, 1 January 2015 and 31 December 2015 64,000 — — 20,142 947 85,089 Net book value: At 31 December 2015 517,321 2,775,640 2,356,279 918,279 2,622,431 9,189,950 At 31 December 2014 431,000 230,723 501,753 830,597 232,620 2,226,693

FOSUN INTERNATIONAL LIMITED Annual Report 2015 175
NOTES TO FINANCIAL STATEMENTSYear ended 31 December 2015
20. GOODWILL2015 2014
RMB’000 RMB’000 Cost: At 1 January 7,287,339 3,293,136 Acquisition of subsidiaries (note 54(a)) 3,890,794 4,255,243 Disposal of subsidiaries (6,259) — Included in assets of a disposal group classified as held for sale — (13,893) Adjustment during the measurement period — (67,581) Others (13,186) (179,566) At 31 December 11,158,688 7,287,339 Accumulated impairment: At 1 January (445,308) (242,808) Charge for the year (note 8) — (202,500) At 31 December (445,308) (445,308) Net book value: At 31 December 10,713,380 6,842,031
Impairment testing of goodwillGoodwill acquired through business combinations is primarily allocated to the following reportable cash-generating units (“CGUs”) for impairment testing:
– Happiness– Health– Property development and sales– Investment– Insurance– Resources
The carrying amounts of goodwill are as follows:
Propertydevelopment
Happiness Health and sales Investment Insurance Resources TotalRMB’000 RMB’000 RMB’000 RMB’000 RMB’000 RMB’000 RMB’000
2015 1,918,053 3,471,856 70,526 33,909 5,049,599 169,437 10,713,380 2014 — 3,255,042 70,526 33,801 3,322,999 159,663 6,842,031

FOSUN INTERNATIONAL LIMITED Annual Report 2015176
NOTES TO FINANCIAL STATEMENTSYear ended 31 December 2015
20. GOODWILL (Continued)
Impairment testing of goodwill (Continued)
The recoverable amount of each CGU is determined based on a value-in-use calculation. The calculation uses cash flow projections based on financial budgets approved by management covering a five-year period. The discount rates applied to the cash flow projections range from 7.2% to 15% (2014: 9.5% to 17%). Cash flows beyond the five-year period are extrapolated using the estimated growth rate of 2% to 3%.
Assumptions were used in the value-in-use calculation of the CGUs for 31 December 2015 and 2014. The following describes each key assumption on which management has based its cash flow projections to undertake impairment testing of goodwill:
Budgeted gross margins - Management determined budgeted gross margin based on past performance and its expectations for the development of the market.
Discount rates - The discount rates used are before tax and reflect specific risks relating to the respective industries.
Raw materials price inflation - The basis used to determine the value assigned to raw materials price inflation is the forecast price indices during the budget year.
21. INVESTMENTS IN JOINT VENTURES2015 2014
RMB’000 RMB’000 Share of net assets 11,550,962 4,430,550Loans to joint ventures 258,163 3,158,600
11,809,125 7,589,150
Loans to joint ventures of RMB258,613,000 are unsecured, interest-free and have no fixed terms of repayment. In the opinion of the directors, these loans are considered as part of the Group’s net investments in joint ventures.
The Group’s amounts due from joint ventures and amounts due to joint ventures are disclosed in note 35 to the financial statements.
As at 31 December 2014, the Group held a 50% equity interest in Shanghai Haizhimen Property Investment and Management Co., Ltd. (“Haizhimen”). The major assets of Haizhimen is the 100% interests in BFC. Haizhimen was considered a material joint venture of the Group as at 31 December 2014. In September 2015, the Group acquired the 100% equity interests in BFC from Haizhimen and BFC was accounted for as a subsidiary of the Group. As at 31 December 2015, there was no material joint venture within the Group.
The following table illustrates the aggregate financial information of the Group’s joint ventures that are not individually material:
2015 2014RMB’000 RMB’000
Share of the joint ventures’ profit for the year 1,066,950 66,739Share of the joint ventures’ total comprehensive income 1,066,950 66,739Aggregate carrying amount of the Group’s investments in the joint ventures 11,809,125 3,136,461

FOSUN INTERNATIONAL LIMITED Annual Report 2015 177
NOTES TO FINANCIAL STATEMENTSYear ended 31 December 2015
22. INVESTMENTS IN ASSOCIATES2015 2014
RMB’000 RMB’000 Share of net assets 28,050,676 24,640,468Goodwill on acquisition 3,358,107 2,511,914
31,408,783 27,152,382Provision for impairment (199,131) (175,978)
31,209,652 26,976,404 Net book value pledged as security for bank loans (note 37) 52,292 —
Particulars of the Group’s material associates of the Group are set out in note 4 to the financial statements.
The Group’s amounts due from associates and amounts due to associates are disclosed in note 35 to the financial statements.
Sinopharm Industrial Investment Co., Ltd. (“Sinopharm”), which is considered a material associate of the Group, is accounted for using the equity method.
The following table illustrates the summarised financial information of Sinopharm adjusted for any differences in accounting policies and reconciled to the carrying amount in the consolidated financial statements:
2015 2014RMB’000 RMB’000
Current assets 116,694,552 110,497,256Non-current assets 21,625,639 18,405,163Current liabilities (94,773,697) (86,112,925)Non-current liabilities (2,414,391) (5,874,166) Net assets 41,132,103 36,915,328 Net assets attributable to the Group 17,552,385 16,033,447

FOSUN INTERNATIONAL LIMITED Annual Report 2015178
NOTES TO FINANCIAL STATEMENTSYear ended 31 December 2015
22. INVESTMENTS IN ASSOCIATES (Continued)
The following table illustrates the summarised financial information of Sinopharm adjusted for any differences in accounting policies and reconciled to the carrying amount in the consolidated financial statements: (continued)
2015 2014RMB’000 RMB’000
Reconciliation to the Group’s interest in the associate: Proportion of the Group’s ownership 49% 49% Group’s share of net assets of the associate, excluding goodwill 8,600,668 7,856,389 Goodwill on acquisition (less accumulative impairment) — — Carrying amount of the investment 8,600,668 7,856,389 Revenues 227,069,433 200,313,355 Profit for the year 5,701,556 4,554,592 Other comprehensive income 34,565 10,980 Total comprehensive income for the year 5,736,121 4,565,572 Dividend received 245,000 147,000
The following table illustrates the aggregate financial information of the Group’s associates that are not individually material:
2015 2014RMB’000 RMB’000
Share of the associates’ profit for the year 1,027,448 815,172Share of the associates’ other comprehensive (loss)/income (170,710) 158,109Share of the associates’ total comprehensive income 856,738 973,281Aggregate carrying amount of the Group’s investments in the associates 22,608,984 19,120,015
23. AVAILABLE-FOR-SALE INVESTMENTS2015 2014
RMB’000 RMB’000 Listed equity investments, at fair value 22,406,786 13,230,302Listed debt investments, at fair value 79,396,944 51,473,616 Listed investments, at fair value 101,803,730 64,703,918 Unlisted equity investments, at cost 12,124,351 9,494,888Unlisted debt investments, at cost 235,950 —Unlisted equity investments, at fair value 2,575,278 2,484,296Unlisted debt investments, at fair value 1,393,365 554,711 Unlisted investments 16,328,944 12,533,895 Total 118,132,674 77,237,813 Portion classified as current assets (20,998,463) (16,388,314) Non-current portion 97,134,211 60,849,499

FOSUN INTERNATIONAL LIMITED Annual Report 2015 179
NOTES TO FINANCIAL STATEMENTSYear ended 31 December 2015
23. AVAILABLE-FOR-SALE INVESTMENTS (Continued)
During the year, the gross gain in respect of the Group’s available-for-sale investments recognised in other comprehensive income amounted to RMB3,005,509,000 (2014: RMB2,235,085,000), of which RMB4,868,248,000 (2014: RMB1,883,168,000) was recycled from other comprehensive income to the consolidated statement of profit or loss for the year on the date of disposal.
There was a significant decline in the market value of certain listed equity investments during the year. The directors consider that such a decline indicates that the listed equity investments have been impaired and an impairment loss of RMB1,117,060,000 (2014: RMB40,427,000), which included a reclassification from other comprehensive income of RMB112,968,000 (2014: Nil), has been recognised in the consolidated statement of profit or loss for the year. The impairment loss on the listed debt investments as at 31 December 2015 amounted to RMB554,892,000 (2014: Nil), which included a reclassification from other comprehensive loss of RMB13,555,000, has been recognised in the statement of profit or loss for the year. The impairment losses on the unlisted equity investments and unlisted debt investments as at 31 December 2015 amounted to RMB117,225,000 (2014: RMB59,335,000) and RMB34,518,000 (2014: RMB21,000) respectively, which have been recognised in the consolidated statement of profit or loss for the year.
At 31 December 2015, the Group’s available-for-sale investment with a carrying amount of RMB909,356,000 (2014: RMB802,922,000) was pledged to secure bank loans, as set out in note 37 to the financial statements.
Certain unlisted equity and debt investments are stated at cost less any accumulated impairment losses because the range of reasonable fair value estimates is so significant that the directors are of the opinion that their fair value cannot be measured reliably. The Group does not intend to dispose of them in the near future.
24. PROPERTIES UNDER DEVELOPMENT2015 2014
RMB’000 RMB’000 Land cost 28,193,253 28,412,805Construction costs 6,322,869 6,410,667Capitalised finance costs 1,743,948 2,278,322
36,260,070 37,101,794Less: Provision for impairment of properties under development (note 8) (377,631) — Portion classified as current assets (18,846,968) (23,429,966)
17,035,471 13,671,828
The properties pledged to banks to secure bank loans and other borrowings are as follows:
2015 2014RMB’000 RMB’000
Net book value pledged (note 37) 20,976,098 12,847,293 Additions to properties under development include:
Interest expense capitalised in respect of bank and other borrowings (note 7) 1,231,147 1,282,710
The Group’s properties under development are all situated in Mainland China and Hong Kong.

FOSUN INTERNATIONAL LIMITED Annual Report 2015180
NOTES TO FINANCIAL STATEMENTSYear ended 31 December 2015
25. LOANS RECEIVABLE2015 2014
Notes RMB’000 RMB’000 Loans receivable 2,288,855 2,140,063Portion classified as current (1) (1,735,066) (843,086) Non-current portion (2) 553,789 1,296,977
(1) As at 31 December 2015, the current portion of loans receivable comprises:
– an entrusted bank loan of RMB917,909,000 provided to a third party, which is guaranteed, bears interest at a fixed interest rate of 5.00% per annum and is repayable on demand;
– an entrusted bank loan of RMB324,680,000 provided to a third party, which is unsecured, bears interest at a fixed interest rate of 3.32% per annum and is repayable in January 2016;
– an entrusted bank loan of RMB264,700,000 provided to Yantai Xingyi Properties Co., Ltd., a joint venture, which is unsecured, bears interest at a fixed interest rate of 9.48% per annum and is repayable in September 2016;
– an entrusted bank loan of RMB116,884,000 provided to a third party, which is unsecured, bears interest at a fixed interest rate of 4.50% per annum and is repayable in December 2016;
– an entrusted bank loan of RMB68,293,000 provided to a third party, which is unsecured, bears interest at a fixed interest rate of 12.00% per annum and is repayable in June 2016;
– an entrusted bank loan of RMB32,600,000 provided to a third party, which is unsecured, bears interest at a fixed interest rate of 15.00% per annum and is repayable in May 2016; and
– an entrusted bank loan of RMB10,000,000 provided to a third party, which is unsecured, bears interest at a fixed interest rate of 6.00% per annum and is repayable in January 2016.
(2) As at 31 December 2015, the non-current portion of loans receivable comprises:
– a shareholders’ loan of RMB202,281,000 provided to an associate, SAS Val Thorens Le Cairn, which is unsecured, bears interest at a fixed interest rate of 6.00% per annum and has no fixed terms of repayment;
– an entrusted bank loan of RMB118,146,000 provided to a third party, which is unsecured, bears interest at a fixed interest rate of 12.00% per annum and is repayable in 2018;
– an entrusted bank loan of RMB103,300,000 provided to Yantai Xingyi Properties Co., Ltd., a joint venture, which is unsecured, bears interest at a fixed interest rate of 9.48% per annum and is repayable in 2018;
– an entrusted bank loan of RMB60,000,000 provided to a third party, which is unsecured, bears interest at a fixed interest rate of 1.00% per annum and has no fixed terms of repayment;
– an entrusted bank loan of RMB40,000,000 provided to a third party, which is unsecured, interest-free and has no fixed terms of repayment; and
– a shareholders’ loan of RMB30,062,000 provided to a third party, which is unsecured, bears interest at a fixed interest rate of 6.00% per annum and is repayable in 2025.

FOSUN INTERNATIONAL LIMITED Annual Report 2015 181
NOTES TO FINANCIAL STATEMENTSYear ended 31 December 2015
26. PREPAYMENTS, DEPOSITS AND OTHER RECEIVABLES2015 2014
RMB’000 RMB’000 Prepayments consist of: Prepayments for purchase of raw materials of steel — 92,972 Prepayments for purchase of pharmaceutical materials 161,642 135,932 Prepayments for purchase of construction materials 605,697 63,046 Prepayments for purchase of equipment and others 241,551 579,031 Prepaid expenses 1,056,314 —
Deposits 1,184,172 1,165,633
Other receivables consist of: Funding provided to third parties 2,973,488 2,447,996 Tax recoverable 748,418 866,831 Deferred cost of acquisition of insurance customers — 173,135 Others 3,950,235 2,901,000
Prepayments for the proposed acquisitions of equity interests 660,772 1,676,626Prepayments for the acquisition of the land 2,611,380 1,379,994
14,193,669 11,482,196 Portion classified as current assets 10,338,976 7,619,585 Non-current portion 3,854,693 3,862,611

FOSUN INTERNATIONAL LIMITED Annual Report 2015182
NOTES TO FINANCIAL STATEMENTSYear ended 31 December 2015
27. DEFERRED TAXMovements in deferred tax assets and liabilities are as follows:
Deferred tax assets
LossesFair value
adjustments available
for offsettingarising from
available- Additionalagainst futuretaxable profits
Accruals andprovisions
for-saleinvestment
Repairs andmaintenance
LATprovisions Others Total
RMB’000 RMB’000 RMB’000 RMB’000 RMB’000 RMB’000 RMB’000 Gross deferred tax assets at 1 January 2014 1,504,016 367,852 — 7,657 383,410 382,377 2,645,312Acquisition of subsidiaries 30,699 892,373 110,129 — 24,427 632,336 1,689,964Disposal of subsidiaries — (23) — — (28,297) (5,207) (33,527)Deferred tax charged to reserve during the year — — (84,715) — — — (84,715)Deferred tax credited to the consolidated statement of profit or loss during the year 28,303 231,374 — 274 28,615 114,814 403,380Exchange realignment (809) (167,685) (13,569) — — (66,281) (248,344) Gross deferred tax assets at 31 December 2014 and 1 January 2015 1,562,209 1,323,891 11,845 7,931 408,155 1,058,039 4,372,070
Acquisition of subsidiaries (note 54(a)) 276,402 766,799 — — — 298,530 1,341,731Disposal of subsidiaries (note 54(b)) (1,526,544) (159,881) — — — (244,195) (1,930,620)Deferred tax credited to reserve during the year — — 489,077 — — — 489,077Deferred tax credited/(charged) to the consolidated statement of profit or loss during the year 531,833 364,376 — (5,053) 74,871 104,257 1,070,284Exchange realignment 29,075 5,156 (573) — — (18,812) 14,846 Gross deferred tax assets at 31 December 2015 872,975 2,300,341 500,349 2,878 483,026 1,197,819 5,357,388

FOSUN INTERNATIONAL LIMITED Annual Report 2015 183
NOTES TO FINANCIAL STATEMENTSYear ended 31 December 2015
27. DEFERRED TAX (Continued)
Deferred tax liabilitiesFair value
adjustmentsarising from Fair value
Fair value equity adjustmentsadjustments investments arising from Revaluationarising from at fair value available- of Deemed
acquisition of through profit for-sale investment disposal of Deferred Withholdingsubsidiaries or loss investments properties associates LAT taxes Others Total
RMB’000 RMB’000 RMB’000 RMB’000 RMB’000 RMB’000 RMB’000 RMB’000 RMB’000 Gross deferred tax liabilities at 1 January 2014 999,985 183,584 341,567 429,696 1,028,137 153,212 317,869 314,265 3,768,315
Deferred tax charged/(credited) to the consolidated statement of profit or loss during the year (80,208) 465,653 (177,538) 310,418 129,539 (21,815) 112,749 326,737 1,065,535Deferred tax charged to reserve during the year — — 82,231 — — — — — 82,231Acquisition of subsidiaries 323,439 — 1,190,760 122,768 — 97,709 — 344,917 2,079,593Exchange realignment — (1,608) (155,140) (92,758) — — — (25,462) (274,968)Included in assets of a disposal group classified as held for sale (18,852) — — — — — — — (18,852)Disposal of subsidiaries (99,840) — — (11,250) — (3,079) — (9,995) (124,164) Gross deferred tax liabilities at 31 December 2014 and 1 January 2015 1,124,524 647,629 1,281,880 758,874 1,157,676 226,027 430,618 950,462 6,577,690Deferred tax charged/(credited) to the consolidated statement of profit or loss during the year (224,224) (515,754) — 572,778 — (31,321) 178,779 952,603 932,861Deferred tax credited to reserve during the year — — (265,454) — — — — — (265,454)Acquisition of subsidiaries (note 54(a)) 2,350,192 — — 9,066 — 23,839 — 426,968 2,810,065Exchange realignment 32,562 15,123 (41,342) 16,710 — — — 16,517 39,570Disposal of subsidiaries (18,809) 8,770 — — — — — (929,455) (939,494) Gross deferred tax liabilities at 31 December 2015 3,264,245 155,768 975,084 1,357,428 1,157,676 218,545 609,397 1,417,095 9,155,238

FOSUN INTERNATIONAL LIMITED Annual Report 2015184
NOTES TO FINANCIAL STATEMENTSYear ended 31 December 2015
27. DEFERRED TAX (Continued)
Deferred tax liabilities (Continued)
For presentation purposes, certain deferred tax assets and liabilities amounted to RMB354,827,000 have been offset in the statement of financial position. After offsetting, the following is an analysis of the deferred tax balances of the Group for financial reporting purposes:
2015RMB’000
Net deferred tax assets recognised in the consolidated statement of financial position 5,002,561Net deferred tax liabilities recognised in the consolidated statement of financial position 8,800,411
As at 31 December 2015, the deferred tax assets were recognised for certain entities within the Group which suffered accumulated losses as at the end of 2015. The directors are of the opinion that these entities could generate sufficient future taxable profits to utilise the deferred tax assets recognised as at 31 December 2015.
Deferred tax assets have not been recognised in respect of the following items as they have arisen in subsidiaries that have been loss-making for some time and it is not considered probable that taxable profits will be available against which the following items can be utilised:
2015 2014RMB’000 RMB’000
Tax losses 11,002,530 8,852,682Deductible temporary differences 302,532 126,203
11,305,062 8,978,885
Pursuant to the PRC Corporate Income Tax Law, a 10% withholding corporate income tax is levied on dividends declared to foreign investors from the foreign investment enterprises established in Mainland China. The requirement became effective from 1 January 2008 and applies to earnings after 31 December 2007. A lower withholding corporate income tax rate may be applied if there is a tax treaty between Mainland China and the jurisdiction of the foreign investors. For the Group, the applicable withholding rate is 5%. The Group is therefore liable for withholding taxes on dividends distributed by those subsidiaries, joint ventures and associates established in Mainland China in respect of earnings generated from 1 January 2008.
There are no income tax consequences attaching to the payment of dividends by the company to its shareholders.
28. INVENTORIES2015 2014
RMB’000 RMB’000 Raw materials 1,040,552 2,228,307Work in progress 338,520 1,383,902Finished goods 1,159,553 2,300,210Spare parts and consumables 245,065 576,388
2,783,690 6,488,807Less: Provision for inventories (111,993) (148,202)
2,671,697 6,340,605
Portion classified as non-current assets (323,708) (87,722)
2,347,989 6,252,883

FOSUN INTERNATIONAL LIMITED Annual Report 2015 185
NOTES TO FINANCIAL STATEMENTSYear ended 31 December 2015
29. POLICYHOLDER ACCOUNT ASSETS IN RESPECT OF UNIT-LINKED CONTRACTS2015 2014
RMB’000 RMB’000 Financial assets designated as at fair value through profit or loss: Debt instruments 3,310,257 4,531,247 Equity instruments 31,833 33,973 Investment funds 133,234 127,877Term deposits 424,379 419,894Sight deposits 182,791 206,980Others (16,578) (14,065)
4,065,916 5,305,906
Portion classified as current assets (471,535) (1,535,931) Non-current portion 3,594,381 3,769,975
The above assets are held for policyholders of unit-linked products.
30. INSURANCE AND REINSURANCE DEBTORS2015 2014
RMB’000 RMB’000 Amounts due from insurance customers and suppliers 8,570,354 2,533,734Less: Provision for impairment (295,381) (401,716)
8,274,973 2,132,018
Portion classified as current assets (8,146,186) (2,063,919) Non-current portion 128,787 68,099
The following is an ageing analysis of the amounts due from insurance customers:
2015 2014RMB’000 RMB’000
Neither past due nor impaired 6,482,245 1,077,831Past due but not impaired 1,782,709 1,054,187Past due and impaired 305,400 401,716
8,570,354 2,533,734

FOSUN INTERNATIONAL LIMITED Annual Report 2015186
NOTES TO FINANCIAL STATEMENTSYear ended 31 December 2015
30. INSURANCE AND REINSURANCE DEBTORS (Continued)
Amounts due from insurance customers that were past due but not impaired relate to a number of independent policyholders and reinsurers that have a good track record with the Group. Based on past experience, management believes that no impairment provision is necessary in respect of these balances as there has not been a significant change in credit quality and the balances are still considered fully recoverable. The Group does not hold any collateral over these balances.
The amount of impaired debts is RMB295,381,000 (31 December 2014: RMB401,716,000). Various actions have been taken to recover the debts, but these debts have not been recovered and hence impairment is provided.
Movements in the allowance for impaired debts:
2015 2014RMB’000 RMB’000
At 1 January 401,716 —Acquisition of subsidiaries 56,709 398,931Amount written off as uncollectible (26,129) —(Reversal of)/provision for impairment losses (204,104) 55,569Exchange realignment 67,189 (52,784) At 31 December 295,381 401,716
31. REINSURERS’ SHARE OF INSURANCE CONTRACT PROVISIONSThe reinsurers’ share of insurance contract provisions represents the reinsurers’ share of life insurance contract liabilities, unearned premium provisions and provision for outstanding claims arising from the life insurance, property and casualty insurance and reinsurance businesses.
2015 2014RMB’000 RMB’000
Life insurance contract liabilities 88,259 80,033Unearned premium provisions 2,819,412 228,784Provision for outstanding claims 10,164,925 797,452
13,072,596 1,106,269
Portion classified as current assets (3,452,133) (624,909) Non-current portion 9,620,463 481,360

FOSUN INTERNATIONAL LIMITED Annual Report 2015 187
NOTES TO FINANCIAL STATEMENTSYear ended 31 December 2015
32. CASH AND BANK AND TERM DEPOSITS2015 2014
Notes RMB’000 RMB’000 Cash on hand 83,641 63,675Cash at banks, unrestricted 38,336,319 25,603,465 Cash and cash equivalents 38,419,960 25,667,140Pledged bank balances (1) 2,515,049 4,317,944Time deposits with original maturity of more than three months (2) 5,116,283 9,516,527Restricted pre-sale proceeds (3) 874,423 507,413Required reserve deposits (4) 141,215 329,598
47,066,930 40,338,622 Portion classified as current assets (46,601,795) (40,190,807) Non-current portion – term deposits 465,135 147,815
Notes:
It mainly comprises the following:
2015 2014RMB’000 RMB’000
(1) Pledged bank balances to secure notes payable 554,639 3,438,172 Pledged bank balances to secure bank loans (note 37) 577,432 46,721 Bank balances as various deposits 1,310,355 335,503 (2) Term deposits with original maturity of more than three months pledged to secure bank loans (note 37) — 3,486
(3) In accordance with relevant documents issued by the PRC State-Owned Land and Resource Bureau, certain property development companies of the Group are required to place in designated bank accounts certain amounts of pre-sale proceeds of properties as guarantee deposits for the construction of related properties. The deposits can only be used for purchases of construction materials and payments of construction fees for the relevant property projects when approval from the PRC State-Owned Land and Resource Bureau is obtained.
(4) Required reserve deposits amounting to RMB141,215,000 (2014: RMB329,598,000) are placed by Shanghai Fosun High Technology Group Finance Co., Ltd. (“Finance Company”), an indirect subsidiary of the Company, with the People’s Bank of China (“PBOC”). The reserve deposits with the PBOC are not available for use in the Group’s daily operations.
In the preparation of the consolidated statement of cash flows, pledged bank balances, time deposits with original maturity of more than three months, restricted pre-sale proceeds from properties and required reserve deposits have been excluded from cash and cash equivalents.
Cash at banks earns interest at floating rates based on daily bank deposit rates. Short- term time deposits are made for varying periods of between one day and three months depending on the immediate cash requirements of the Group, and earn interest at the respective short-term time deposit rates. The bank balances and pledged deposits are deposited with creditworthy banks with no recent history of default.

FOSUN INTERNATIONAL LIMITED Annual Report 2015188
NOTES TO FINANCIAL STATEMENTSYear ended 31 December 2015
33. INVESTMENTS AT FAIR VALUE THROUGH PROFIT OR LOSS2015 2014
RMB’000 RMB’000 Listed investment, at fair value Equity investment 6,961,737 12,885,559 Debt investment 2,786,496 1,599,894
9,748,233 14,485,453Unlisted investments, at fair value 967,934 381,741
10,716,167 14,867,194
At 31 December 2015, the Group’s investments at fair value through profit or loss with a carrying amount of RMB2,105,531,000 (2014: RMB2,922,103,000) were pledged to secure bank loans, as set out in note 37 to the financial statements.
34. TRADE AND NOTES RECEIVABLES2015 2014
RMB’000 RMB’000 Trade receivables 3,739,276 3,610,965Notes receivable 629,274 2,760,038
4,368,550 6,371,003
An aged analysis of the trade receivables as at the end of the reporting period, based on the invoice date, is as follows:
2015 2014RMB’000 RMB’000
Outstanding balances with ages: Within 90 days 2,725,729 2,794,853 91 to 180 days 676,826 517,066 181 to 365 days 382,548 288,425 1 to 2 years 86,792 87,219 2 to 3 years 17,078 10,537 Over 3 years 31,856 23,498
3,920,829 3,721,598
Less: Provision for impairment of trade receivables (181,553) (110,633)
3,739,276 3,610,965

FOSUN INTERNATIONAL LIMITED Annual Report 2015 189
NOTES TO FINANCIAL STATEMENTSYear ended 31 December 2015
34. TRADE AND NOTES RECEIVABLES (Continued)
The movements in the provision for impairment of trade receivables are as follows:
2015 2014RMB’000 RMB’000
At 1 January 110,633 76,135Amount written off as uncollectible (37,279) (12,155)Disposal of subsidiaries (40,869) —Provision for impairment losses 149,068 46,653 At 31 December 181,553 110,633
The aged analysis of the trade receivables that are not considered to be impaired is as follows:
2015 2014RMB’000 RMB’000
Neither past due nor impaired 975,860 777,151Within 90 days past due 1,028,834 515,14191 to 180 days past due 378,663 123,867Over 180 days past due 287,174 83,036
2,670,531 1,499,195
Receivables that were neither past due nor impaired relate to a large number of diversified customers for whom there was no recent history of default.
Receivables that were past due but not impaired relate to a number of independent customers that have a good track record with the Group. Based on past experience, the directors of the Company are of the opinion that no provision for impairment is necessary in respect of these balances as there has not been a significant change in credit quality and the balances are still considered fully recoverable.
At 31 December 2015, the Group’s trade and notes receivables with a carrying amount of approximately RMB219,768,000 (2014: RMB1,155,019,000) were pledged to secure bank loans, as set out in note 37 to the financial statements.
Trade and notes receivables of the Group mainly arose from the resources segment, health segment, and property development and sales segment. Credit terms granted to the major customers of these segments are as follows:
Credit terms Resources segment 0 to 360 daysHealth segment 90 to 180 daysProperty development and sales segment 30 to 360 days

FOSUN INTERNATIONAL LIMITED Annual Report 2015190
NOTES TO FINANCIAL STATEMENTSYear ended 31 December 2015
35. BALANCES WITH SHAREHOLDERS, SUBSIDIARIES AND RELATED COMPANIES2015 2014
Notes RMB’000 RMB’000 Due from related companies: Associates (i) 2,433,581 2,273,745 Joint ventures (ii) 1,270,811 2,972,551 Other related companies (iii) 3,249 3,061
3,707,641 5,249,357
Notes:
(i) As at 31 December 2015, the balances due from associates included the amount of RMB2,208,795,000 (2014: RMB2,052,131,000), which were non-trade in nature, unsecured, interest-free and repayable on demand. The remaining balances due from associates are trade in nature, interest-free and repayable on demand.
(ii) As at 31 December 2015, the balances due from joint ventures included the amount of RMB1,270,811,000 (2014: RMB2,972,102,000), which were non-trade in nature, unsecured, interest-free and repayable on demand. The remaining balances due from joint ventures amounting to nil (2014: RMB449,000) are trade in nature, interest-free and repayable on demand.
(iii) As at 31 December 2015, the balances due from other related companies were non-trade in nature, unsecured, interest-free and repayable on demand.
2015 2014Notes RMB’000 RMB’000
Due to the holding company (iv) 979,101 673,617 Due to related companies: Associates (v) 2,419,051 2,088,139 Non-controlling shareholders of subsidiaries (vi) 218,141 208,200 Joint ventures (vii) 307,500 822,054
2,944,692 3,118,393
Notes:
(iv) The balances due to the holding company were dividends payable to the holding company.
(v) As at 31 December 2015, the balances due to associates included the amount of RMB2,378,106,000 (2014: RMB2,017,007,000), which were non-trade in nature, unsecured, interest-free and repayable on demand. The remaining balances due to associates are trade in nature, interest-free and repayable on demand.
(vi) As at 31 December 2015, the balances due to non-controlling shareholders of subsidiaries comprised of:
– an amount of RMB176,403,000, all among the current portion being the payables for purchase of low grade ore products from Hainan Iron and Steel Co., Ltd., which is interest-free.
– The remaining balances of RMB41,738,000 are non-trade in nature, interest-free and repayable on demand.
(vii) As at 31 December 2015, the balances due to joint ventures included the amount of RMB294,990,000 (2014: RMB822,054,000), which were non-trade in nature, unsecured, interest-free and repayable on demand. The remaining balances due to joint ventures are trade in nature, interest-free and repayable on demand.

FOSUN INTERNATIONAL LIMITED Annual Report 2015 191
NOTES TO FINANCIAL STATEMENTSYear ended 31 December 2015
36. NON-CURRENT ASSET/ASSETS OF A DISPOSAL GROUP CLASSIFIED AS HELD FOR SALE
2015 2014Notes RMB’000 RMB’000
Carrying amount of available-for-sale investments before classification as held for sale (i) 44,298 239,229Carrying amount of property, plant and equipment before classification as held for sale (ii) 58,947 —Carrying amount of the assets of a disposal group (iii) — 990,341 Carrying amount after impairment 103,245 1,229,570 Liabilities directly associated with the assets classified as held for sale (iii) — 589,118
Notes:
(i) As at 31 December 2015, the non-current assets held for sale represented the Group’s available-for-sale investments in Shenzhen Inveno Technology Co., Ltd. (“INVENO”), Beijing Quant Group Information Technology Co., Ltd. (“Quant Group”) and Shanghai T-rex Information Technology Co., Ltd. (“T-REX”) amounting to RMB16,500,000, RMB7,798,000, and RMB20,000,000 respectively.
On 27 July 2015, the Group through its subsidiary, Yadong Beichen Investment Management Co., Ltd. (“Yadong Beichen”), entered into a share transfer agreement with the original shareholder of Yadong Xingchen Investment Management Co., Ltd. (“Yadong Xingchen”), a third party, for the share transfer of the Group’s equity interest of 7.82% in INVENO, equity interest of 10% in Quant Group and equity interest of 20% in T-REX for cash considerations of RMB43,988,000, RMB7,798,000 and RMB20,000,000, respectively. The share transfer is expected to be completed in 2016.
(ii) The rest of the non-current assets held for sale represents the property, plant and equipment of a village of Club Méditerranée S.A. (“Club Med”), an indirect subsidiary of the Company, the disposal of which is considered highly probable during the year of 2016.
(iii) On 10 December 2014, the Group through its subsidiary, Fosun Pharma entered into certain equity transfer agreements with Sinopharm Holding GuoDa Drug Store Co., Ltd. (“Guoda Drug Store”), pursuant to which, Fosun Pharma agreed to sell and Guoda Drug Store agreed to purchase 53.13% equity interest in Beijing Golden Elephant Pharmacy Medicine Chain Company Limited (“Golden Elephant Pharmacy”), 97% equity interest in Shanghai Fosun Pharmaceutical Company Limited (“Fosun Pharmaceutical”) and 99.76% equity interest in Shanghai For Me Yixing Pharmacy Chain-Store Company Limited (“For Me Pharmacy”) for aggregate considerations of approximately RMB414,356,000. Golden Elephant Pharmacy, Fosun Pharmaceutical and For Me Pharmacy mainly engaged in pharmaceutical distribution and retail business. Fosun Pharma has decided to dispose of these interests for the purpose of optimising the resource allocation of Fosun Pharma and moving forward the transition of business model of retail business of Fosun Pharma. As at 31 December 2014, all the assets and liabilities of Golden Elephant Pharmacy, Fosun Pharmaceutical and For Me Pharmacy were classified as assets of a disposal group held for sale and liabilities directly associated with the assets classified as held for sale in aggregate in the consolidated statement of financial position. And the disposal of these equity interests in Fosun Pharmaceutical, For Me Pharmacy and Golden Elephant Pharmacy was completed in January 2015.

FOSUN INTERNATIONAL LIMITED Annual Report 2015192
NOTES TO FINANCIAL STATEMENTSYear ended 31 December 2015
36. NON-CURRENT ASSET/ASSETS OF A DISPOSAL GROUP CLASSIFIED AS HELD FOR SALE (Continued)
The assets and liabilities of Fosun Pharmaceutical, For Me Pharmacy and Golden Elephant Pharmacy classified as held for sale as at 31 December 2014 are as follows:
2014RMB’000
AssetsInventories 252,915Cash and bank 223,213Trade and notes receivables 179,233Prepayments, deposits and other receivables 176,347Intangible assets 75,870Property, plant and equipment 46,804Due from related companies 19,604Goodwill 13,893Available-for-sale investments 1,230Investments in associates 972Prepaid land lease payment 260 Assets of a disposal group classified as held for sale 990,341 LiabilitiesTrade and notes payables 432,217Accrued liabilities and other payables 123,698Deferred tax liabilities 18,852Due to related companies 13,676Tax payable 675 Liabilities directly associated with the assets classified as held for sale 589,118

FOSUN INTERNATIONAL LIMITED Annual Report 2015 193
NOTES TO FINANCIAL STATEMENTSYear ended 31 December 2015
37. INTEREST-BEARING BANK AND OTHER BORROWINGS2015 2014
Notes RMB’000 RMB’000 Bank loans: (1) Guaranteed 1,493,528 1,774,510 Secured 31,312,177 20,240,487 Unsecured 44,689,840 35,719,497
77,495,545 57,734,494
Corporate bonds and enterprise bonds (2) 6,598,361 9,040,838Private placement note (3) 7,560,499 4,077,554Senior notes (4) 5,873,726 4,012,143Medium-term notes (5) 5,981,017 4,577,850Short-term commercial papers (6) 2,053,979 2,996,451Other borrowings, secured (7) 3,624,268 3,944,760Other borrowings, unsecured (7) 5,460,584 6,771,606 Total 114,647,979 93,155,696 Repayable: Within one year 48,788,443 46,389,197 In the second year 20,016,093 19,488,086 In the third to fifth years, inclusive 37,324,484 22,761,251 Over five years 8,518,959 4,517,162
114,647,979 93,155,696
Portion classified as current liabilities (48,788,443) (46,389,197) Non-current portion 65,859,536 46,766,499

FOSUN INTERNATIONAL LIMITED Annual Report 2015194
NOTES TO FINANCIAL STATEMENTSYear ended 31 December 2015
37. INTEREST-BEARING BANK AND OTHER BORROWINGS (Continued)
Notes:
(1) Certain of the Group’s bank loans are secured by the pledge of certain of the Group’s buildings amounting to RMB363,023,000 (2014: RMB166,764,000), investment properties amounting to RMB19,227,824,000 (2014: RMB5,433,000,000), prepaid land lease payments amounting to RMB1,022,849,000 (2014: RMB587,199,000), properties under development amounting to RMB20,976,098,000 (2014: RMB12,847,293,000), completed properties for sale amounting to RMB5,031,742,000 (2014: RMB4,852,833,000), trade and notes receivables amounting to RMB219,768,000 (2014: RMB1,155,019,000), equity investment at fair value through profit or loss amounting to RMB2,105,531,000 (2014: RMB2,922,103,000), investments in associates amounting to RMB52,292,000 (2014:Nil), investments in available-for-sale entities amounting to RMB909,356,000 (2014: RMB802,922,000) and investments in subsidiaries.
No plant and machinery (2014: RMB786,843,000), mining infrastructure (2014: RMB491,490,000), term deposits with original maturity of more than three months (2014: RMB3,486,000) and investments in a joint venture (2014: RMB533,294,000) were pledged to secure the interest-bearing bank and other borrowings.
Bank balances amounting to RMB577,432,000 (2014: RMB46,721,000) were pledged to secure the interest-bearing bank and other borrowings.
The Group’s interest-bearing bank and other borrowings amounting to RMB1,493,528,000 (2014: RMB1,774,510,000) were guaranteed by Fosun Holding Limited which is the ultimate holding company of the Group.
The bank loans bear interest at rates ranging from 0.57% to 7.48% (2014: 0.52% to 8.50%) per annum.
(2) Corporate bonds and enterprise bonds
On 24 December 2010, Shanghai Fosun High Technology (Group) Co., Ltd. (“Fosun Group”) issued seven-year domestic corporate bonds with a par value of RMB1,100,000,000 and an effective interest rate of 6.17% per annum. The interest is paid annually in arrears and the maturity date is 23 December 2017.
On 25 April 2012, Fosun Pharma issued five-year domestic corporate bonds with a par value of RMB1,500,000,000 and an effective interest rate of 5.74% per annum. The interest is paid annually in arrears and the maturity date is 25 April 2017.
On 20 November 2015, Shanghai Forte Land Co., Ltd. (“Forte”) issued five-year domestic corporate bonds with a par value of RMB4,000,000,000 and an effective interest rate of 4.39% per annum. The interest is paid annually in arrears and the maturity date is 20 November 2020.
On 17 December 2015, Eynsford Tokutei Mokuteki Kaisha, an indirect subsidiary of Fosun Property Holdings Limited, issued five-year corporate bonds with a par value of JPY1,000,000,000 and an interest rate of 3 month Tokyo Interbank Offered Rate plus 5.30% per annum. The interest will be paid quarterly in arrears since April 2016. The principal amount of the corporate bonds will be repaid by instalments and the final maturity date is 17 December 2020.
(3) Private placement note
On 19 June 2013, Fosun Group issued three-year private placement notes with a par value of RMB2,000,000,000 and an effective interest rate of 6.02% per annum. The interest will be paid annually in arrears and the maturity date is 19 June 2016.
On 3 April 2015, Fosun Group issued three-year private placement notes with a par value of RMB1,000,000,000 and the effective interest rate is 5.82% per annum. The interest will be paid annually in arrears and the maturity date is 3 April 2018.
On 31 July 2015, Fosun Group issued one-year private placement notes with a par value of RMB2,500,000,000 and the effective interest rate is 5.07% per annum. The interest is payable at the maturity date which is 31 July 2016.
On 11 August 2015, Fosun Group issued one-year private placement notes with a par value of RMB1,000,000,000 and the effective interest rate is 4.96% per annum. The interest is payable at the maturity date which is 11 August 2016.
On 26 October 2015, Fosun Group issued one-year private placement notes with a par value of RMB1,000,000,000 and the effective interest rate is 3.99% per annum. The interest is payable at the maturity date which is 26 October 2016.

FOSUN INTERNATIONAL LIMITED Annual Report 2015 195
NOTES TO FINANCIAL STATEMENTSYear ended 31 December 2015
37. INTEREST-BEARING BANK AND OTHER BORROWINGS (Continued)
Notes: (Continued)
(4) Senior notes
On 30 January 2013, Sparkle Assets Limited, a direct subsidiary of Fosun Industrial Holdings Limited, issued seven-year senior notes with a par value of USD400,000,000 and an effective interest rate of 7.19% per annum. The interest will be paid semi-annually in arrears.
On 10 May 2010, Ironshore, a subsidiary of Fosun Capital Holdings Limited, issued ten-year senior notes with a par value of USD250,000,000 and an effective interest rate of 8.76% per annum. The interest will be paid semi-annually in arrears.
In 2015, eight-year senior notes with a par value of EUR240,000,000 and an effective interest rate of 3.31% per annum issued by Xingtao Assets Limited, a direct subsidiary of Fosun Industrial Holdings Limited, were purchased by third party investors. The interest will be paid annually in arrears and the maturity date is 9 October 2022.
(5) Medium-term notes
On 31 March 2011, Fosun Pharma issued five-year medium-term notes with a par value of RMB1,600,000,000 and an effective interest rate of 6.26% per annum. The interest is paid annually in arrears and the maturity date is 31 March 2016.
On 24 October 2014, Fosun Group issued three-year medium-term notes with a par value of RMB2,000,000,000 and an effective interest rate of 5.26% per annum. The interest is paid annually in arrears and the maturity date is 24 October 2017.
On 5 March 2015, Fosun Group issued three-year medium-term notes with a par value of RMB2,000,000,000 and an effective interest rate of 5.21% per annum. The interest is paid annually in arrears and the maturity date is 5 March 2018.
On 10 September 2015, Fosun Pharma issued three-year medium-term notes with a par value of RMB400,000,000 and an effective interest rate of 4.05% per annum. The interest is paid annually in arrears and the maturity date is 10 September 2018.
(6) Short-term commercial papers
On 11 May 2015, Fosun Group issued short-term commercial paper with a par value of RMB2,000,000,000 and an effective interest rate of 4.51% per annum. The interest is payable at the maturity date which is 11 May 2016.
(7) Other borrowings
The other borrowings represent borrowings from third parties, which bear interest at rates ranging from 0.65% to 8.7% (2014: 2.55% to 11.0%) per annum.

FOSUN INTERNATIONAL LIMITED Annual Report 2015196
NOTES TO FINANCIAL STATEMENTSYear ended 31 December 2015
38. CONVERTIBLE BONDSThe issuer, an indirect wholly-owned subsidiary of the Company, issued convertible bonds in a principal amount of HKD3,875,000,000 (equivalent to RMB3,068,225,000) on 22 November 2013 guaranteed by the Company and certain of its subsidiaries (the “Convertible Bonds”). The Convertible Bonds are convertible into fully-paid ordinary shares of a par value of HKD0.10 each of the Company. The Convertible Bonds bear interest at the rate of 1.5% per annum payable semi-annually in arrears on 22 May and 22 November in each year. The Convertible Bonds will mature on 22 November 2018 (“Maturity Date”).
The fair value of the liability component was estimated at the issuance date using an equivalent market interest rate for a similar bond without a conversion option. The residual amount is assigned as the equity component and is included in shareholders’ equity.
During the year, certain convertible bonds with a principal amount of HKD3,506,000,000 were converted to 350,600,000 ordinary shares of the Company at the conversion price of HKD10 per share.
The convertible bonds issued during the year have been split into the liability and equity components as follows:
2015 2014RMB’000 RMB’000
Liabilities component at the beginning of year 2,485,546 2,319,675Interest expense 89,457 207,618Interest paid (18,348) (46,055)Conversion into equity (2,307,207) —Exchange realignment 19,535 4,308 Liability component at 31 December 268,983 2,485,546
The effective interest rate of the liability component is 8.93% per annum.
39. LOANS FROM RELATED COMPANIES2015 2014
RMB’000 RMB’000 Loans from– a joint venture 193,000 193,000 Repayable: Within one year 193,000 193,000
The loans from related parties comprise entrusted loans of RMB100,000,000 and RMB93,000,000 provided by Wuxi Forte Real Estate Development Co., Ltd., a joint venture, which are unsecured, bear interest at a rate of 3.25% per annum and are repayable on 10 November 2016 and 7 November 2016, respectively.

FOSUN INTERNATIONAL LIMITED Annual Report 2015 197
NOTES TO FINANCIAL STATEMENTSYear ended 31 December 2015
40. TRADE AND NOTES PAYABLES2015 2014
RMB’000 RMB’000 Trade payables 10,293,759 11,700,971Notes payable 142,474 7,889,598
10,436,233 19,590,569
An aged analysis of the trade payables as at the end of the reporting period is as follows:
2015 2014RMB’000 RMB’000
Outstanding balances with ages: Within 90 days 3,690,592 6,528,179 91 to 180 days 1,821,188 1,010,306 181 to 365 days 2,247,450 1,751,277 1 to 2 years 606,355 728,176 2 to 3 years 703,743 669,800 Over 3 years 1,224,431 1,013,233
10,293,759 11,700,971
Trade and notes payables of the Group mainly arose from the resources segment, health segment and property development and sales segment. The trade and notes payables are non-interest-bearing and the credit terms granted by the Group’s suppliers are as follows:
Credit terms Resources segment 0 to 90 daysHealth segment 0 to 360 daysProperty development and sales segment 180 to 360 days

FOSUN INTERNATIONAL LIMITED Annual Report 2015198
NOTES TO FINANCIAL STATEMENTSYear ended 31 December 2015
41. ACCRUED LIABILITIES AND OTHER PAYABLES2015 2014
RMB’000 RMB’000 Advances from customers 8,968,936 9,065,400Payables related to: Purchases of property, plant and equipment 71,185 2,194,750 Deposits received 748,980 713,234 Payroll 1,838,582 827,542 Business tax 411,647 257,069 Accrued interest expenses 826,125 1,002,118 Value-added tax 84,020 137,188 Accrued utilities 182,206 202,736 Acquisition of subsidiaries 54,722 464,006 Acquisition of additional interests in subsidiaries 13,000 130,000 Current portion of other long term payables (note 50) 63,980 90,554 Funding from third parties for business development 5,558,165 3,939,779 Other accrued expense 2,170,832 1,077,867 Others 3,227,664 3,187,241
24,220,044 23,289,484
42. FINANCE LEASE PAYABLESTotal future minimum lease payments under finance leases and their present values are as follows:
2015 2014RMB’000 RMB’000
Repayable: Within one year 51,012 112,282 In the second year 37,450 39,643 In the third to fifth years, inclusive 93,429 115,302 Total minimum finance lease payments 181,891 267,227
Less: Future finance charges (15,396) —
166,495 267,227
Portion classified as current finance lease payables (46,161) (119,110) Non-current portion 120,334 148,117

FOSUN INTERNATIONAL LIMITED Annual Report 2015 199
NOTES TO FINANCIAL STATEMENTSYear ended 31 December 2015
43. DEPOSITS FROM CUSTOMERS2015 2014
RMB’000 RMB’000 Demand deposits and current accounts 1,300,688 1,696,120
As at 31 December 2015 and 2014, deposits from customers represented deposits placed in Finance Company, a subsidiary of the Group. The deposits from customers carry interest at rates ranging from 0.35% to 2.34% (2014: 0.385% to 3.08%) per annum and will be repaid upon demand of the customers.
Deposits from customers due to related parties are disclosed in note 59 to the financial statements.
44. UNEARNED PREMIUM PROVISIONS31 December 2015 31 December 2014
Reinsurers’ Reinsurers’Gross share Net Gross share Net
Notes RMB’000 RMB’000 RMB’000 RMB’000 RMB’000 RMB’000 Life insurance (i) 16,619 (869) 15,750 11,301 (907) 10,394Non-life insurance (ii) 12,865,360 (2,818,543) 10,046,817 2,848,926 (227,877) 2,621,049
12,881,979 (2,819,412) 10,062,567 2,860,227 (228,784) 2,631,443
Notes:
(i) Analysis of movements in the unearned premium provisions for the life insurance business:
31 December 2015 31 December 2014Reinsurers’ Reinsurers’
Gross share Net Gross share NetRMB’000 RMB’000 RMB’000 RMB’000 RMB’000 RMB’000
At 1 January 11,301 (907) 10,394 — — —Acquisition of subsidiaries — — — 47,722 — 47,722Premiums written during the year 2,530,029 (683,216) 1,846,813 1,563,826 (46,741) 1,517,085Premiums earned during the year (2,524,370) 683,211 (1,841,159) (1,596,502) 45,771 (1,550,731)Exchange realignment (341) 43 (298) (3,745) 63 (3,682) At 31 December 16,619 (869) 15,750 11,301 (907) 10,394
(ii) Analysis of movements in the unearned premium provisions for the non-life insurance business:
31 December 2015 31 December 2014Reinsurers’ Reinsurers’
Gross share Net Gross share NetRMB’000 RMB’000 RMB’000 RMB’000 RMB’000 RMB’000
At 1 January 2,848,926 (227,877) 2,621,049 207,427 — 207,427Acquisition of subsidiaries (note 54(a)) 9,810,566 (2,481,230) 7,329,336 2,662,313 (419,505) 2,242,808Premiums written during the year 15,316,797 (1,929,343) 13,387,454 7,268,688 (663,689) 6,604,999Premiums earned during the year (15,040,297) 1,849,276 (13,191,021) (7,095,542) 812,355 (6,283,187)Exchange realignment (70,632) (29,369) (100,001) (193,960) 42,962 (150,998) At 31 December 12,865,360 (2,818,543) 10,046,817 2,848,926 (227,877) 2,621,049

FOSUN INTERNATIONAL LIMITED Annual Report 2015200
NOTES TO FINANCIAL STATEMENTSYear ended 31 December 2015
45. PROVISION FOR OUTSTANDING CLAIMS31 December 2015 31 December 2014
Reinsurers’ Reinsurers’Gross share Net Gross share Net
Notes RMB’000 RMB’000 RMB’000 RMB’000 RMB’000 RMB’000 Life insurance (i) 1,364,432 (79,182) 1,285,250 923,124 (65,592) 857,532Non-life insurance (ii) 45,644,916 (9,932,876) 35,712,040 13,234,269 (731,860) 12,502,409
47,009,348 (10,012,058) 36,997,290 14,157,393 (797,452) 13,359,941
Portion classified as current liabilities (14,461,347) (6,534,777) Non-current portion 32,548,001 7,622,616
Notes:
(i) Analysis of movements in the provision for outstanding claims for the life insurance business:
31 December 2015 31 December 2014Reinsurers’ Reinsurers’
Gross share Net Gross share NetRMB’000 RMB’000 RMB’000 RMB’000 RMB’000 RMB’000
At 1 January 923,124 (65,592) 857,532 — — —Acquisition of subsidiaries — — — 929,849 (99,561) 830,288Claims paid during the year (1,966,823) 45,679 (1,921,144) (1,738,324) 37,695 (1,700,629)Claims incurred during the year 2,433,740 (61,922) 2,371,818 1,853,705 (14,476) 1,839,229Exchange realignment (25,609) 2,653 (22,956) (122,106) 10,750 (111,356) At 31 December 1,364,432 (79,182) 1,285,250 923,124 (65,592) 857,532
(ii) Analysis of movements in the provision for outstanding claims for the non-life insurance business:
31 December 2015 31 December 2014Reinsurers’ Reinsurers’
Gross share Net Gross share NetRMB’000 RMB’000 RMB’000 RMB’000 RMB’000 RMB’000
At 1 January 13,234,269 (731,860) 12,502,409 318,667 — 318,667Acquisition of subsidiaries (note 54(a)) 31,570,756 (8,458,092) 23,112,664 14,773,355 (1,078,738) 13,694,617Claims paid during the year (10,769,140) 2,899,746 (7,869,394) (4,226,622) 376,100 (3,850,522)Claims incurred during the year 11,252,016 (3,389,286) 7,862,730 4,298,419 (147,179) 4,151,240Exchange realignment 357,015 (253,384) 103,631 (1,929,550) 117,957 (1,811,593) At 31 December 45,644,916 (9,932,876) 35,712,040 13,234,269 (731,860) 12,502,409

FOSUN INTERNATIONAL LIMITED Annual Report 2015 201
NOTES TO FINANCIAL STATEMENTSYear ended 31 December 2015
46. FINANCIAL LIABILITIES FOR UNIT-LINKED CONTRACTS AND INVESTMENT CONTRACT LIABILITIES
2015 2014Notes RMB’000 RMB’000
Financial liabilities for unit-linked contracts (i) 4,065,916 5,305,884Investment contract liabilities (ii) 53,232,403 52,044,306Commissions on the issue of financial products (87,193) (71,674)
57,211,126 57,278,516
Portion classified as current liabilities (5,192,088) (10,034,697) Non-current portion 52,019,038 47,243,819
Notes:
(i) Unit-linked contracts
2015 2014RMB’000 RMB’000
At 1 January 5,305,884 —Acquisition of subsidiaries — 8,653,797Issues 25,552 20,734Redemptions (1,037,437) (2,577,413)Profit or loss 55,299 116,272Other (335) (753)Exchange realignment (283,047) (906,753) At 31 December 4,065,916 5,305,884
(ii) Other investment contract liabilities
2015 2014RMB’000 RMB’000
At 1 January 52,044,306 —Acquisition of subsidiaries — 52,317,559Issues 17,219,813 15,464,341Redemptions (14,908,197) (9,898,477)Profit or loss 1,294,774 1,001,277Other (2,538) (4,649)Exchange realignment (2,415,755) (6,835,745) At 31 December 53,232,403 52,044,306

FOSUN INTERNATIONAL LIMITED Annual Report 2015202
NOTES TO FINANCIAL STATEMENTSYear ended 31 December 2015
47. OTHER LIFE INSURANCE CONTRACT LIABILITIES31 December 2015
Life Non-life TotalRMB’000 RMB’000 RMB’000
Mathematical provision for life insurance 12,026,825 — 12,026,825Provision for profit sharing 487,892 13 487,905Provision for interest rate commitments 39,921 — 39,921Provision for portfolio stabilisation 179,311 — 179,311
12,733,949 13 12,733,962Portion classified as current liabilities (1,359,147) Non-current portion 11,374,815
31 December 2014
Life Non-life TotalRMB’000 RMB’000 RMB’000
Mathematical provision for life insurance 12,738,942 — 12,738,942Provision for profit sharing 813,621 443 814,064Provision for interest rate commitments 55,580 — 55,580Provision for portfolio stabilisation 182,678 — 182,678
13,790,821 443 13,791,264Portion classified as current liabilities (1,561,511) Non-current portion 12,229,753

FOSUN INTERNATIONAL LIMITED Annual Report 2015 203
NOTES TO FINANCIAL STATEMENTSYear ended 31 December 2015
47. OTHER LIFE INSURANCE CONTRACT LIABILITIES (Continued)
31 December 2015
Analysis of movements of other life insurance contract liabilities business:
Mathematical Provisionprovision Provision for Provision
for life for profit interest rate for portfolioinsurance sharing commitments stabilisation TotalRMB’000 RMB’000 RMB’000 RMB’000 RMB’000
At 1 January 12,738,942 813,621 55,580 182,678 13,790,821Liabilities originated in period and interest attributed (170,307) 286,702 (12,621) 5,316 109,090Amount attributable to insured from shareholders’ equity — (472,029) — — (472,029)Change in deferred acquisition costs 71 — — — 71Other movements 2,888 — — — 2,888Income distributed 73,628 (91,424) — — (17,796)Exchange realignment (618,397) (48,978) (3,038) (8,683) (679,096) At 31 December 12,026,825 487,892 39,921 179,311 12,733,949
31 December 2014
Analysis of movements of other life insurance contract liabilities business:
Mathematical Provisionprovision Provision for Provision
for life for profit interest rate for portfolio insurance sharing commitments stabilisation TotalRMB’000 RMB’000 RMB’000 RMB’000 RMB’000
At 1 January — — — — —Acquisition of subsidiaries 14,800,847 1,021,868 68,045 203,174 16,093,934Liabilities originated in period and interest attributed (296,843) 229,973 (4,367) 4,855 (66,382)Amount attributable to insured from shareholders’ equity — (292,530) — — (292,530)Change in deferred acquisition costs (249) — — — (249)Other movements 5,402 — — — 5,402Income distributed 5,918 (29,859) — — (23,941)Exchange realignment (1,776,133) (115,831) (8,098) (25,351) (1,925,413) At 31 December 12,738,942 813,621 55,580 182,678 13,790,821

FOSUN INTERNATIONAL LIMITED Annual Report 2015204
NOTES TO FINANCIAL STATEMENTSYear ended 31 December 2015
48. INSURANCE AND REINSURANCE CREDITORS2015 2014
RMB’000 RMB’000 Amounts due to insurance customers and suppliers 2,116,415 765,224Amounts due to insurance intermediaries 641,087 279,508Deposits retained from reinsurers/retrocessionaires 899,881 282,957Prepaid premiums received 149,694 125,578Other 50,631 —
3,857,708 1,453,267 Portion classified as current liabilities (3,740,375) (1,453,267) Non-current portion 117,333 —
The following is an ageing analysis of the amounts due to insurance customers:
2015 2014RMB’000 RMB’000
Amounts due to insurance customers and suppliers:Within 90 days 3,047,760 995,09591-180 days 272,363 81,030181-365 days 133,211 161,7511-2 years 119,934 55,7512-3 years 32,619 70,097Over 3 years 251,821 89,543
3,857,708 1,453,267
49. DEFERRED INCOMEDeferred income represents government grants received related to assets.
2015 2014RMB’000 RMB’000
Special purpose fund for technology improvement 224,862 311,683Government grants for property development and fixed assets construction 794,246 —
1,019,108 311,683

FOSUN INTERNATIONAL LIMITED Annual Report 2015 205
NOTES TO FINANCIAL STATEMENTSYear ended 31 December 2015
50. OTHER LONG TERM PAYABLES2015 2014
Notes RMB’000 RMB’000 Payables for rehabilitation (i) 128,035 200,378Payables for employee benefits (ii) 553,252 353,241Payables for restructuring provisions 310,732 388,839Payables for the acquisition of subsidiaries — 27,720Payables for acquisition of additional interests in subsidiaries 303,708 291,642Loans from non-controlling shareholders of subsidiaries 2,060,768 1,928,294Others 729,890 754,677
4,086,385 3,944,791
Notes:
(i) The movements of payables for rehabilitation are set out below:
2015 2014RMB’000 RMB’000
At 1 January 200,378 32,919Additions 23,784 3,913Acquisition of subsidiaries — 223,234Disposal of subsidiaries (72,273) —Payment made (1,549) (8,899)Classified as current portion (note 41) (31,434) (50,789)Exchange realignment 9,129 — At 31 December 128,035 200,378
Payables for rehabilitation are in relation to the costs of the Group’s obligations for land reclamation.
(ii) The movements of payables for employee benefits are set out below:
2015 2014RMB’000 RMB’000
At 1 January 353,241 159,439Additions 31,824 35,875Acquisition of subsidiaries 237,661 232,609Interest increment (note 7) 10,219 12,681Payments made (55,885) (26,695)Classified as current portion (note 41) (32,546) (39,765)Exchange realignment 8,738 (20,903) At 31 December 553,252 353,241
Payables for employee benefits are based on estimates of future payments made by management and are discounted at rates in the range of 1% to 7.83% (2014: 6.4% to 10.5%).

FOSUN INTERNATIONAL LIMITED Annual Report 2015206
NOTES TO FINANCIAL STATEMENTSYear ended 31 December 2015
51. SHARE CAPITALShares
2015 2014RMB’000 RMB’000
Issued and fully paid: 8,609,881,144 (2014: 6,922,478,871) ordinary shares 36,046,143 16,281,011
A summary of movements in the Company’s share capital is as follows:
Number Capital of shares Issued Share redemption
in issue capital premium reserve TotalRMB’000 RMB’000 RMB’000 RMB’000
At 1 January 2014 6,421,594,500 621,497 11,785,713 1,465 12,408,675Rights issue of new shares 500,884,371 3,886,511 — — 3,886,511Share issue expenses — (14,175) — — (14,175)Transition to no-par value regime on 3 March 2014 (Note (a)) — 11,787,178 (11,785,713) (1,465) — At 31 December 2014 and 1 January 2015 6,922,478,871 16,281,011 — — 16,281,011Share award scheme (Note (b)) 4,620,000 — — — —Placing of shares (Note (c)) 465,000,000 7,288,395 — — 7,288,395Rights issue of new shares (Note (d)) 867,182,273 9,537,094 — — 9,537,094Share issue expenses — (20,061) — — (20,061)Conversion of convertible bonds to ordinary shares (note 38) 350,600,000 2,959,704 — — 2,959,704 At 31 December 2015 8,609,881,144 36,046,143 — — 36,046,143
Notes:
(a) In accordance with the transitional provisions set out in section 37 of Schedule 11 to the Hong Kong Companies Ordinance (Cap. 622), on 3 March 2014, any amount standing to the credit of the share premium and capital redemption reserve account has become part of the Company’s share capital.
(b) During the year, according to the share award scheme announced by the Company on 26 March 2015, the Company issued and allotted 4,620,000 new shares at nil consideration which were awarded to selected participants and will be vested based on certain vesting conditions.
(c) During the year, the Company completed the placing of 465,000,000 shares at the placing price of HKD20.00 per share.
(d) During the year, the Company issued 867,182,273 rights shares at the subscription price of HKD13.42 per share.

FOSUN INTERNATIONAL LIMITED Annual Report 2015 207
NOTES TO FINANCIAL STATEMENTSYear ended 31 December 2015
52. RESERVESThe amounts of the Group’s reserves and the movements therein for the current and prior years are presented in the consolidated statement of changes in equity of the financial statements.
(a) Other deficitsThe opening balance of other deficits as at 1 January 2009 represented the acquisition of the entire equity interest in Fosun Group pursuant to the reorganisation of the Group prior to the listing of its shares on the Hong Kong Stock Exchange, after netting off the paid-up capital and capital reserve (arising from the bonus share issue of its subsidiaries) of Fosun Group.
(b) Statutory surplus reserve (the “SSR”)In accordance with the Company Law of the PRC and the respective articles of association of the subsidiaries established in Mainland China (the “PRC Subsidiaries”), each PRC Subsidiary is required to allocate 10% of its profit after tax, as determined in accordance with the applicable PRC accounting standards and regulations, to the SSR until this reserve reaches 50% of its registered capital. Subject to certain restrictions set out in the Company Law of the PRC, part of the SSR can be capitalised as paid-up capital, provided that the remaining balance after the capitalisation is not less than 25% of the registered capital.
In accordance with the Company Law of Portugal, a percentage of not less than 10% or 5% of each year’s net profit, depending on whether a company is an insurance or other company, must be transferred to the legal reserve, until it totals the amount of share capital or up to 20% of the capital, respectively. The legal reserve may not be distributed, but only be used to increase share capital or offset accumulated losses.
(c) Distributable reservesFor dividend purposes, the amount which the PRC subsidiaries can legally distribute by way of a dividend is determined by reference to the distributable profits as reflected in their PRC statutory financial statements which are prepared in accordance with the applicable PRC accounting standards and regulations.
In accordance with the Company Law of the PRC, profits after tax of the PRC subsidiaries can be distributed as dividends after the appropriation to the SSR as set out above.

FOSUN INTERNATIONAL LIMITED Annual Report 2015208
NOTES TO FINANCIAL STATEMENTSYear ended 31 December 2015
53. PARTLY-OWNED SUBSIDIARIES WITH MATERIAL NON-CONTROLLING INTERESTSDetails of the Group’s subsidiaries that have material non-controlling interests are set out below:
2015 2014 Percentage of equity interest held by non-controlling interests:
Fosun Pharma 60.22% 60.17%Hainan Mining 46.00% 46.00%Portuguese Insurance Group 15.01% 20.00%
Hainan Mining Co., Ltd. and its subsidiaries are collectively referred to as “Hainan Mining”. Fidelidade - Companhia de Seguros, S.A., Multicare - Seguros de Saúde, S.A. and Fidelidade Assistência - Companhia de Seguros, S.A. are collectively referred to as “Portuguese Insurance Group”.
2015 2014RMB’000 RMB’000
Profit for the year allocated to non-controlling interests:
Fosun Pharma 1,480,238 1,598,768Hainan Mining 1,612 169,620Portuguese Insurance Group 302,164 216,477 Dividends paid to non-controlling interests:
Fosun Pharma 389,345 375,562Hainan Mining 128,800 380,000 Accumulated balances of non-controlling interests at the reporting dates:
Fosun Pharma 11,370,517 10,463,552Hainan Mining 2,048,383 2,175,571Portuguese Insurance Group 1,650,857 2,637,169

FOSUN INTERNATIONAL LIMITED Annual Report 2015 209
NOTES TO FINANCIAL STATEMENTSYear ended 31 December 2015
53. PARTLY-OWNED SUBSIDIARIES WITH MATERIAL NON-CONTROLLING INTERESTS
(Continued)
The following tables illustrate the summarised financial information of the above subsidiaries. The amounts disclosed are before any inter-company eliminations:
PortugueseInsurance
GroupFosun
PharmaHainanMining
2015 RMB’000 RMB’000 RMB’000 Revenue 8,980,914 12,502,163 813,519Total expenses (7,020,441) (9,631,502) (810,014)Profit for the year 1,960,473 2,870,661 3,505Total comprehensive (loss) /income for the year (53,870) 2,677,414 (1,117) Current assets 34,001,618 8,325,378 2,371,954Non-current assets 73,747,974 29,819,462 3,407,853Current liabilities (18,252,989) (10,939,200) (1,254,914)Non-current liabilities (75,030,414) (6,592,878) (206,764) Net cash flows from/(used in) operating activities 135,892 1,621,028 (110,347)Net cash flows from/(used in) investing activities 7,981,238 (1,869,910) (593,653)Net cash flows from/(used in) financing activities 3,964,580 550,715 (61,136)
PortugueseInsurance
GroupFosun
PharmaHainanMining
2014 RMB’000 RMB’000 RMB’000 Revenue 6,690,283 11,938,243 1,589,196Total expenses (5,586,079) (9,568,404) (1,165,146)Profit for the year 1,104,204 2,369,839 424,050Total comprehensive income/(loss)for the year (478,676) 2,302,150 424,050 Current assets 33,786,893 8,664,025 3,398,580Non-current assets 72,216,954 26,615,365 2,712,860Current liabilities (24,428,412) (9,537,320) (1,303,514)Non-current liabilities (70,658,895) (6,695,955) (208,680) Net cash flows from operating activities 4,550,754 1,200,214 482,114Net cash flows used in investing activities (4,321,425) (2,478,337) (433,704)Net cash flows from financing activities 76,858 1,863,070 949,411

FOSUN INTERNATIONAL LIMITED Annual Report 2015210
NOTES TO FINANCIAL STATEMENTSYear ended 31 December 2015
54. ACQUISITION AND DISPOSAL OF SUBSIDIARIES(a) Acquisition of subsidiaries
(i) Acquisition of subsidiaries accounted for as business combinationThe major acquisition of subsidiaries accounted for as business combination is set out as follows:
In February 2015, Gaillon Invest II, an indirectly owned subsidiary of the Company, acquired 100% of the equity interests in Club Med, at a total consideration of EUR916,664,000 (equivalent to RMB6,240,832,000). The acquisition was undertaken to further develop the global happiness business of the Group.
In March 2015, Forte through its wholly-owned subsidiary, Shanghai Forte Investment Management Co., Ltd. (“Forte Investment”), acquired the remaining 50% equity interests in Shanghai Mushen Property Development Co., Ltd., Shanghai Hugang Property Development Co., Ltd., Shanghai Gangrui Property Development Co., Ltd., Shanghai Tengxing Property Development Co., Ltd., Shanghai Shunfu Investment Development Co., Ltd. and Shanghai Fusheng Investment Development Co., Ltd. (collectively referred to as the “Gangling Project”) at a consideration of RMB283,000,000. Before the acquisition, Forte Investment held 50% equity interest in Gangling Project, which were accounted for as investments in joint ventures. The major assets of Gangling Project are properties under development and completed properties for sale located in Shanghai, the PRC.
In July 2015, Miracle Nova II (US), LLC, an indirect wholly-owned subsidiary of the Company completed the acquisition of 100% equity interests in MIG at a consideration of USD438,987,000 (equivalent to RMB2,685,371,000). The acquisition was undertaken to further develop the global insurance business of the Group.
In July 2015, Plata Cross (UK) Limited, an indirect owned subsidiary of the Company completed the acquisition of 100% equity interests in Silver Cross Nurseries Limited at a consideration of GBP54,568,000 (equivalent to RMB526,160,000). The acquisition was undertaken to further develop the health business of the Group.
In July 2015, Forte through its indirect wholly-owned subsidiary Shanghai Yizhong Investment Co., Ltd (“Shanghai Yizhong”) acquired the remaining 50% equity interests in Wuhan Fujiang Real Estate Co., Ltd. (“Wuhan Fujiang”) at a consideration of RMB300,000,000. Before the acquisition, Shanghai Yizhong held 50% equity interest in Wuhan Fujiang which was accounted for as investment in a joint venture. The major assets of Wuhan Fujiang are properties under development in Wuhan, the PRC.
In September 2015, the Company through its indirect wholly-owned subsidiary Zhejiang Fosun Commerce Development Limited acquired 100% equity interests in BFC at a consideration of RMB8,493,000,000. The major assets of BFC are investment properties in Shanghai, the PRC.
In November 2015, the Company through its indirect wholly-owned subsidiary Mettlesome Investment (Cayman) III Limited, acquired the remaining 80% equity interests in Ironshore at a consideration of USD2,029,826,000 (equivalent to RMB12,983,173,000). Before the acquisition, the Company through its indirect wholly-owned subsidiary Mettlesome Investments Limited held 20% equity interest in Ironshore, which was accounted for as investment in an associate. The acquisition was undertaken to further develop the global insurance business of the Group.
The Group has elected to measure the non-controlling interests in all the subsidiaries acquired during the year at the non-controlling interests’ proportionate share of the acquired subsidiaries’ identifiable net assets.

FOSUN INTERNATIONAL LIMITED Annual Report 2015 211
NOTES TO FINANCIAL STATEMENTSYear ended 31 December 2015
54. ACQUISITION AND DISPOSAL OF SUBSIDIARIES (Continued)
(a) Acquisition of subsidiaries (Continued)
(i) Acquisition of subsidiaries accounted for as business combination (Continued)The provisional fair values of the identifiable assets and liabilities of all the subsidiaries acquired during the year were as follows:
2015Fair value
recognisedon acquisition
RMB’000 Property, plant and equipment (note 13) 5,291,265Investment properties (note 14) 17,684,506Prepaid land lease payments (note 15) 11,594Investments in associates 392,992Available-for-sale investments 38,988,314Intangible assets (note 19) 6,854,249Deferred tax assets (note 27) 1,341,731Cash and cash equivalents 5,522,039Investments at fair value through profit or loss 679,366Trade and notes receivables 966,808Prepayments, deposits and other receivables 3,951,293Inventories 273,109Completed properties for sale 755,870Properties under development 3,576,370Policyholder account assets in respect of unit-linked contracts 56,549Insurance and reinsurance debtors 4,384,920Reinsurers’ share of insurance contract provisions 11,018,004 Subtotal carried forward 101,748,979

FOSUN INTERNATIONAL LIMITED Annual Report 2015212
NOTES TO FINANCIAL STATEMENTSYear ended 31 December 2015
54. ACQUISITION AND DISPOSAL OF SUBSIDIARIES (Continued)
(a) Acquisition of subsidiaries (Continued)
(i) Acquisition of subsidiaries accounted for as business combination (Continued)The provisional fair values of the identifiable assets and liabilities of all the subsidiaries acquired during the year were as follows: (Continued)
2015Fair value
recognisedon acquisition
RMB’000 Subtotal brought forward 101,748,979Interest-bearing bank and other borrowings (10,757,834)Trade and notes payables (1,626,767)Accrued liabilities and other payables (8,778,725)Tax payable 1,012Due to related companies (648,435)Unearned premium provisions (note 44) (9,810,566)Insurance and reinsurance creditors (1,871,043)Deferred income (151,101)Deferred tax liabilities (note 27) (2,810,065)Provision for outstanding claims (note 45) (31,570,756) Total identifiable net assets at provisional fair value* 33,724,699Non-controlling interests (318,627) Total net assets acquired 33,406,072Gain on bargain purchase of subsidiaries (note 6) (847,409)Goodwill on acquisition (note 20) 3,890,794
36,449,457 Satisfied by:
Cash consideration paid 30,081,546Investments at fair value through profit or loss 1,384,563Investment in an associate 3,050,987Investment in joint ventures 1,917,545Cash consideration unpaid 14,816
36,449,457
* The assessments of the fair values of the identifiable assets and liabilities of Club Med, MIG and Ironshore are still undergoing and the information of the fair values of the identifiable assets and liabilities is provisional. The finalised information will be disclosed in the consolidated financial statements of the Group for the year ended 31 December 2016.

FOSUN INTERNATIONAL LIMITED Annual Report 2015 213
NOTES TO FINANCIAL STATEMENTSYear ended 31 December 2015
54. ACQUISITION AND DISPOSAL OF SUBSIDIARIES (Continued)
(a) Acquisition of subsidiaries (Continued)
(i) Acquisition of subsidiaries accounted for as business combination (Continued)The fair values of the trade receivables and prepayments, deposits and other receivables as at the dates of acquisition amounted to RMB966,808,000 and RMB3,951,293,000, respectively. The gross contractual amounts of trade receivables and prepayments, deposits and other receivables were RMB966,808,000 and RMB3,951,293,000, respectively.
The Group incurred transaction costs of RMB221,543,000 for these acquisitions. These transaction costs have been expensed and are included in other expenses or administrative expenses in the consolidated statement of profit or loss.
None of the goodwill recognised is expected to be deductible for income tax purposes.
Since the acquisition, the acquired subsidiaries contributed RMB10,541,993,000 to the Group’s revenue and net loss of RMB627,606,000 to the consolidated profit for the year ended 31 December 2015.
Had the combinations taken place at the beginning of the year, the revenue of the Group and the net profit of the Group for the year ended 31 December 2015 would have been RMB91,526,531,000 and RMB11,432,652,000, respectively.
(ii) An analysis of the cash flows in respect of the acquisition of subsidiaries as set out in (i) above are as follows:
RMB’000 Consideration settled by cash (30,081,546)Cash and cash equivalents acquired 5,522,039
(24,559,507)Payment of unpaid cash consideration as at 31 December 2014 (425,328)Net outflow of cash and cash equivalents included in cash flows from investing activities (24,984,835)Transaction costs of the acquisition included in cash flows from operating activities (221,543)
(25,206,378)
(b) Disposal of subsidiariesIn January 2015, the Group completed the disposal transactions of Golden Elephant Pharmacy, Fosun Pharmaceutical and For Me Pharmacy. As at 31 December 2014, the carrying amounts of the assets and liabilities of Golden Elephant Pharmacy, Fosun Pharmaceutical and For Me Pharmacy were classified as held for sale in the consolidated statement of financial position as set out in note 36.
The major disposal during the year is set out as follows:
In August 2015, Shanghai Fosun Pharmaceutical Industrial Development Co., Ltd., a subsidiary of Fosun Pharma, entered into an equity interest transfer agreement with Chen Zhimin, Li Honghong and Wang Wenyu (陳致慜, 李紅紅 and 王文鈺) to dispose 60.68% equity interests in Handan Pharmaceutical Co., Ltd. at a consideration of RMB161,300,000.

FOSUN INTERNATIONAL LIMITED Annual Report 2015214
NOTES TO FINANCIAL STATEMENTSYear ended 31 December 2015
54. ACQUISITION AND DISPOSAL OF SUBSIDIARIES (Continued)
(b) Disposal of subsidiaries (Continued)
On 31 December 2015, Shanghai Fosun Industrial Technology Development Co., Ltd. (“Fosun Industrial Development”), an indirectly wholly-owned subsidiary of the Company, entered into an agreement with Nanjing Iron & Steel (Group) Co., Ltd., one of the shareholders of Nanjing Nangang, pursuant to which, Fosun Industrial Development delegated 10% voting rights in Nanjing Nangang to Nanjing Iron & Steel (Group) Co., Ltd. Upon the date of the delegation, the voting rights of the Company in Nanjing Nangang decreased from 60% to 50% and the Group lost control over Nanjing Nangang, and Nanjing Nangang was accounted for as investment in a joint venture by the Group. The assessments of the fair values of the identifiable assets and liabilities of the joint venture, Nanjing Nangang, are still undergoing. The information of the fair values of the identifiable assets and liabilities is provisional and will be finalised during the year ending 31 December 2016. In addition, during the year of 2015, the Group disposed 1,340,142,123 shares of Nanjing Iron & Steel Shareholding Co., Ltd, a subsidiary of Nanjing Nangang listed on the Shanghai Stock Exchange, at a consideration of RMB7,205,011,000 in cash.
The total net assets disposed of in respect of the disposal of the subsidiaries during the year were as follows:
2015 2014RMB’000 RMB’000
Net assets disposed of: Property, plant and equipment 24,083,379 121,409 Prepaid land lease payments 1,017,937 — Mining rights (note 17) 91,907 — Oil and gas assets (note 18) 158,789 — Intangible assets 75,876 — Goodwill 20,152 — Investments in joint ventures 106,183 — Investments in associates 222,210 — Available-for-sale investments 1,200,299 — Deferred tax assets (note 27) 1,930,620 33,527 Properties under development 90,382 2,629,511 Investment properties (note 14) — 776,000 Cash and bank 5,265,924 1,792,329 Investments at fair value through profit or loss 1,736,154 — Trade and notes receivables 4,138,958 8,202 Prepayments, deposits and other receivables 4,220,147 196,885 Due from related parties 212,361 113,985 Inventories 2,918,257 14,756 Completed properties for sale — 17,585 Interest-bearing bank and other borrowings (15,892,571) (2,201,883) Trade and notes payables (10,880,809) (171,738) Due to related companies (55) (230) Accrued liabilities and other payables (5,702,617) (1,613,311) Tax payable (203,574) (169,889) Finance lease payables (117) — Deferred income (5,610) (293,000) Other long term payables (224,541) (2,490) Deferred tax liabilities (958,346) (124,164) Non-controlling interests (5,620,224) (311,038)
8,001,071 816,446 Fair value of the retained interests in subsidiaries disposed of (7,342,710) (711,974)Net gain/(loss) on disposal of subsidiaries (notes 6 and 8) 7,180,957 (15,873)
7,839,318 88,599

FOSUN INTERNATIONAL LIMITED Annual Report 2015 215
NOTES TO FINANCIAL STATEMENTSYear ended 31 December 2015
54. ACQUISITION AND DISPOSAL OF SUBSIDIARIES (Continued)
(b) Disposal of subsidiaries (Continued)
An analysis of the cash flows in respect of the disposal of subsidiaries is as follows:
2015 2014RMB’000 RMB’000
Satisfied by: Cash 7,826,596 74,600 Other receivables 12,722 13,999
7,839,318 88,599 Cash consideration 7,826,596 74,600Cash and cash equivalents disposed of (1,588,138) (1,792,329)Advance receipt of cash consideration in previous years (124,310) — Net inflow/(outflow) of cash and cash equivalents included in cash flows from investing activities 6,114,148 (1,717,729)

FOSUN INTERNATIONAL LIMITED Annual Report 2015216
NOTES TO FINANCIAL STATEMENTSYear ended 31 December 2015
55. SHARE-BASED PAYMENTS(a) Share award scheme of the Company
The Company adopts a share award scheme (“Share Award Scheme”) for the purpose to align the interests of the eligible persons with those of the Group through ownership of shares, dividends and other distributions paid on shares and the increase in value of the shares; and to encourage and retain eligible persons to make contributions to the long-term growth and profits of the Group.
On 26 March 2015, the Board of Directors of the Company has resolved to award an aggregate of 4,620,000 award shares (“Award Shares”) to 71 Selected Participants under the share award scheme (“Share Award Scheme”), of which (i) 2,430,000 Award Shares will be awarded to 52 selected participants by way of issue and allotment of new shares pursuant to the general mandate (the “General Mandate”); and (ii) 2,190,000 connected Award Shares will be awarded to 19 connected selected participants by way of issue and allotment of new shares pursuant to a specific mandate (the “Specific Mandate”) obtained in the annual general meeting held on 28 May 2015.
Award Shares shall be locked up immediately upon granting. All of the Award Shares granted to participants shall be subject to various lock-up periods ranging from one year to three years, respectively, immediately from the date of grant. Award Shares held by participants shall be unlocked in three tranches in the proportion of 33%, 33% and 34% of the total number of the Award Shares granted upon the expiry of each lock-up period.
The aggregate fair value of the Share Award Scheme granted amounted to approximately HKD60,274,000. The Group has recognised an amount of HKD27,121,000 (equivalent to RMB21,831,000) as expenses for the year ended 31 December 2015.
(b) Restricted A share Incentive Scheme by Fosun PharmaFosun Pharma adopts a share incentive scheme (the “Restricted A Share Incentive Scheme”) for the purpose of further refining the corporate governance structure of Fosun Pharma, facilitating the establishment of the restricted incentive mechanism, fully motivating the directors and key personnel of Fosun Pharma, as well as balancing the interests of the shareholders, Fosun Pharma and the management for the long-term development of Fosun Pharma.
Restricted A Share Incentive Scheme IOn 7 January 2014 (the “Date of Grant”), pursuant to the Restricted A Share Incentive Scheme I, 4,035,000 A shares of Fosun Pharma were granted to 28 eligible participants of the Restricted A Share Incentive Scheme (the “Share Incentive Participants”) at a grant price of RMB6.08 per share. The Share Incentive Participants include executive directors and the members of senior management of Fosun Pharma and core technical and management personnel.
27 out of 28 of the share incentive participants have accepted and subscribed with their own funds under the Restricted A Share Incentive Scheme and a total of 3,935,000 restricted A Shares (“Restricted Shares”) have been issued by Fosun Pharma to the relevant share incentive participants.
The Restricted A Share Incentive Scheme shall be valid for a term of four years, commencing from the Date of Grant of the Restricted Shares and ending on the date on which all the Restricted Shares on 7 January 2014.
Restricted Shares shall be locked up immediately upon granting. All of the Restricted Shares granted to Share Incentive Participants shall be subject to various lock-up periods ranging from one year, two years and three years, respectively, immediately from the Date of Grant. Restricted Shares held by Share Incentive Participants shall be unlocked (or repurchased and cancelled by Fosun Pharma) in three tranches in the proportion of 33%, 33% and 34% of the total number of the Restricted Shares granted upon the expiry of each lock-up period.
The aggregate fair value of the Restricted Shares granted amounted to approximately RMB59,012,000, of which RMB35,087,000 will be charged to profit or loss and the capital reserve as costs of share-based compensation in aggregate from the date of grant to the date on which the unlocking conditions are being fulfilled and the shares may be circulated according to the law, after netting of the total considerations received for the issue of the Restricted Shares amounting to RMB23,925,000. The Group has recognised an amount of RMB7,642,000 as expenses for the year ended 31 December 2015 (2014: RMB21,841,000).

FOSUN INTERNATIONAL LIMITED Annual Report 2015 217
NOTES TO FINANCIAL STATEMENTSYear ended 31 December 2015
55. SHARE-BASED PAYMENTS (Continued)
(b) Restricted A share Incentive Scheme by Fosun Pharma (Continued)
Restricted A Share Incentive Scheme IIOn 19 November 2015 (the “Date of Grant”), pursuant to the Restricted A Share Incentive Scheme II, 2,695,000 A shares of the Fosun Pharma were granted to 45 eligible participants of the Restricted A Share Incentive Scheme II at a grant price of RMB10.54 per share.
Restricted Shares issued pursuant the Restricted A Share Incentive Scheme II shall be locked up immediately upon granting. All of the Restricted Shares granted to Share Incentive Participants shall be subject to various Lock-up Periods ranging from one year, two years and three years, respectively, immediately from the Date of Grant. Restricted Shares held by Share Incentive Participants shall be unlocked (or repurchased and cancelled by Fosun Pharma) in three tranches in the proportion of 33%, 33% and 34% of the total number of the Restricted Shares granted upon the expiry of each lock-up period.
The aggregate fair value of the Restricted Shares granted amounted to approximately RMB68,102,000, of which RMB39,697,000 will be charged to profit or loss and the capital reserve as costs of share-based compensation in aggregate from the date of grant to the date on which the unlocking conditions are being fulfilled and the shares may be circulated according to the law, after netting of the total considerations received for the issue of the Restricted Shares amounting to RMB28,405,000. The Group has recognised an amount of RMB2,012,000 as expenses for the year ended 31 December 2015.
(c) CML share optionCertain employees of Chindex International Inc. (“Chindex”, listed in the NASDAQ market) provide services to Chindex Medical Limited (“CML”), an indirect subsidiary of Fosun Pharma. The service agreement between CML and Chindex provides that the full compensation cost of Chindex employees who provide service to CML will be charged to CML, which will include the cost of share-based compensation on a non-cash basis, if applicable to the employees. In addition, certain former Chindex employees that are now employees of CML participate in Chindex’s equity compensation program and hold options for Chindex’s common shares and Chindex’s restricted shares, and the costs of those share options are expensed as they provide services to CML. As at 29 September 2014, along with the privatisation and delisting of Chindex, all the share options and restricted shares held by relevant Chindex employees and non-employees were cancelled and settled by cash. There are no share option expense incurred for CML share option in 2015.

FOSUN INTERNATIONAL LIMITED Annual Report 2015218
NOTES TO FINANCIAL STATEMENTSYear ended 31 December 2015
56. OPERATING LEASE ARRANGEMENTS As lessor
The Group leases its investment properties, as set out in note 14 to the financial statements, under operating lease arrangements, with negotiated terms ranging from one to ten years.
At the end of the reporting period, the Group had total future minimum lease receivables under non-cancellable operating leases with its tenants falling due as follows:
2015 2014RMB’000 RMB’000
Within one year 403,008 440,823In the second to fifth years, inclusive 975,727 1,579,231Over five years 1,118,716 81,483
2,497,451 2,101,537
As lesseeThe Group leases certain of its office properties, shop lots, land and plant buildings under operating lease arrangements, with negotiated terms ranging from one to nineteen years.
At the end of the reporting period, the Group had total future minimum lease payments under non-cancellable operating leases falling due as follows:
2015 2014RMB’000 RMB’000
Within one year 7,735,987 135,551In the second to fifth years, inclusive 6,541,412 274,359Over five years 4,507,313 549,531
18,784,712 959,441
57. COMMITMENTSIn addition to the operating lease commitments detailed in note 56 above, the Group had the following capital commitments at the end of the reporting period:
2015 2014RMB’000 RMB’000
Contracted, but not provided for: Plant and machinery 1,881,272 1,701,623 Properties under development 13,679,434 16,374,753 Investments 4,446,210 14,285,765
20,006,916 32,362,141

FOSUN INTERNATIONAL LIMITED Annual Report 2015 219
NOTES TO FINANCIAL STATEMENTSYear ended 31 December 2015
57. COMMITMENTS (Continued)
In addition, the Group’s share of the joint ventures’ own capital commitments, which are not included in the above, is as follows:
2015 2014RMB’000 RMB’000
Contracted but not provided for: Buildings 80,185 — Plant and machinery 422,243 — Properties under development 206,628 777,756
709,056 777,756
58. CONTINGENT LIABILITIESThe Group had the following contingent liabilities at the end of the reporting period:
2015 2014Notes RMB’000 RMB’000
Guaranteed bank loans and corporate bonds of: Related parties (note 59) (1) 5,319,000 223,000Qualified buyers’ mortgage loans (2) 2,726,667 2,434,754
8,045,667 2,657,754
(1) The directors consider that the possibility of the default in payments regarding to those bank loans and corporate bonds of related parties is remote taking the operation result and payment history of related parties into consideration and therefore no provision has been made in the financial statements for the contingent liabilities arising from the guarantee provided by the Group to the bank loans and corporate bonds of related parties.
(2) As at 31 December 2015, the Group provided guarantees of approximately RMB2,726,667,000 (31 December 2014: RMB2,434,754,000) in favour of their customers in respect of mortgage loans provided by banks to these customers for their purchases of the Group’s developed properties where the underlying real estate certificates can only be provided to the banks in a time delayed manner due to administrative procedures in the PRC. These guarantees provided by the Group will be released when the customers pledge their real estate certificates as security to the banks for the mortgage loans granted by the banks.
The directors consider that in case of default in payments, the net realisable value of the related properties can cover the outstanding principal together with the accrued interest and penalties and therefore no provision has been made in the financial statements for the guarantees.
(3) Owing to the nature of the insurance business, the insurance segment of the Group is involved in legal proceedings in the ordinary course of its activity, including being the plaintiff or the defendant in litigation and arbitration proceedings. Most of such legal proceedings involve claims concerning insurance policies, which are already provisioned, and some additional losses arising therefrom will be indemnified either by reinsurers or by other recoveries, like salvages. Although the outcomes of such contingencies, lawsuits or other proceedings cannot be determined at present, the Group believes that any resulting liabilities will not have a material adverse effect on its financial position or operating results.

FOSUN INTERNATIONAL LIMITED Annual Report 2015220
NOTES TO FINANCIAL STATEMENTSYear ended 31 December 2015
59. RELATED PARTY TRANSACTIONSIn addition to the transactions and balances detailed elsewhere in these financial statements, the Group had the following material transactions with related parties during the year:
2015 2014Name of related parties Nature of transactions RMB’000 RMB’000 Sales of goodsSinopharm Group Co., Ltd. (Notes 2 & 9) Sales of pharmaceutical products 861,223 710,922
Shangai Banksteel Electronic Commerce Co., Ltd. Sales of steel products 564,902 38,225 (Notes 3 & 9)
Nanjing Iron & Steel Jiahua New Sales of utility 65,508 78,928 Construction Material Co., Ltd. (Notes 7 & 9)
Nanjing Iron & Steel Jiahua New Sales of scrap material 61,759 112,265 Construction Material Co., Ltd. (Notes 7 & 9)
Chindex International, Inc. (Notes 2 & 9) Sales of pharmaceutical products 29,680 13,801
Healthy Harmony Holdings L.P. (Notes 2 & 9) Sales of pharmaceutical products 18,204 —
Nanjing Shengchang Renewable Sales of scrap material 1,997 — Resources Co., Ltd. (Notes 7 & 9)
Shanghai LONZA Fosun Pharmaceutical Sales of pharmaceutical products 1,581 4,291 Science and Technology Development Ltd. (Notes 2 & 9)
Beijing Jinxiang Fosun Pharmaceuticals Sales of pharmaceutical products — 19,446 Joint Stock Co., Ltd. (Notes 2 & 9)
Shanghai Tonghanchuntang Sales of pharmaceutical products — 6,204 Pharmaceutical Co., Ltd. (Notes 2 & 9)
Shanghai Huifeng Forme Pharmacy Sales of pharmaceutical products — 2,978 Co., Ltd. (Notes 2 & 9)
Shanghai Liyi Pharmacy Sales of pharmaceutical products — 1,712 Co., Ltd. (Notes 2 & 9)
Shanghai Yaofang Co., Ltd. (Notes 2 & 9) Sales of pharmaceutical products — 1,136 Total sales of goods 1,604,854 989,908

FOSUN INTERNATIONAL LIMITED Annual Report 2015 221
NOTES TO FINANCIAL STATEMENTSYear ended 31 December 2015
59. RELATED PARTY TRANSACTIONS (Continued)
In addition to the transactions and balances detailed elsewhere in these financial statements, the Group had the following material transactions with related parties during the year: (continued)
2015 2014Name of related parties Nature of transactions RMB’000 RMB’000 Purchases of goodsSinopharm Group Co., Ltd. Purchases of pharmaceutical 97,273 147,494 (Notes 2 & 9) products
Nanjing Shengchang Renewable Purchases of iron ore 33,855 — Resources Co., Ltd. (Notes 7 & 9)
Suzhou Amerigen Pharmaceutical Co., Ltd. Purchases of pharmaceutical 5,660 — (Notes 2 & 9) products
Shanghai Tonghanchuntang Purchases of pharmaceutical — 7,090 Pharmaceutical Co., Ltd. (Notes 2 & 9) products
Beijing Jinxiang Fosun Pharmaceuticals Purchases of pharmaceutical — 6,892 Joint Stock Co., Ltd. (Notes 2 & 9) products
Shanghai Yaofang Co., Ltd. Purchases of pharmaceutical — 409 (Notes 2 & 9) products Total purchases of goods 136,788 161,885 Service incomeShenyang Yuyuan Tourist Mart Consulting services provided to the 30,685 — Property Co., Ltd. (Notes 2 & 10) related company
Zhejiang Dongyang China Woodcarving City Consulting services provided to the 11,937 — Investment and Development Co., Ltd. related company (Notes 2 & 10)
Yantai Xingyi Properties Co., Ltd. Consulting services provided to the 9,795 34,588 (Notes 2 & 10) related company
Wuhu Xingyan Properties Co., Ltd. Consulting services provided to the 5,803 — (Notes 2 & 10) related company
Shanghai Dijie Real Estate Limited Consulting services provided to the 4,409 — (Notes 2 & 10) related company
Fuyang Furun Property Co., Ltd. Consulting services provided to the 2,322 4,632 (Notes 2 & 10) related company
Shanxi Jianqin Real Estate Development Co., Ltd. Consulting services provided to the — 14,999 (Notes 2 & 10) related company Total service income 64,951 54,219

FOSUN INTERNATIONAL LIMITED Annual Report 2015222
NOTES TO FINANCIAL STATEMENTSYear ended 31 December 2015
59. RELATED PARTY TRANSACTIONS (Continued)
In addition to the transactions and balances detailed elsewhere in these financial statements, the Group had the following material transactions with related parties during the year: (continued)
2015 2014Name of related parties Nature of transactions RMB’000 RMB’000 Interest incomeHaizhimen (Notes 6 & 12) Interest income 82,882 195,957
Shanghai Jufeng Property Interest income 35,722 — Development Co., Ltd. (Notes 2 & 12)
Anhui Jinhuangzhuang Mining Interest income 14,081 14,712 Co., Ltd. (Notes 7 & 12)
Yantai Xingyi Properties Co., Ltd. Interest income 8,157 — (Notes 2, 12 & 15)
SAS Val Thorens Le Cairn Interest income 7,939 — (Notes 5, 12 & 15)
Wuhu Xingyan Properties Interest income 3,136 1,830 Co., Ltd. (Notes 2, 12 & 15)
Nanjing Dahua Investment Interest income 2,130 — Development Co., Ltd. (Notes 2 & 12)
Shanxi Jianqin Real Estate Interest income — 77,000 Development Co., Ltd. (Notes 2 & 12)
Zhejiang Dongyang China Woodcarving Interest income — 8,826 City Investment and Development Co., Ltd. (Notes 2 & 12)
Nanjing Iron & Steel (Group) Interest income — 4,023 Co., Ltd. (Notes 7, & 12)
Fuyang Furun Property Interest income — 2,250 Co., Ltd. (Notes 2 & 12) Total interest income 154,047 304,598

FOSUN INTERNATIONAL LIMITED Annual Report 2015 223
NOTES TO FINANCIAL STATEMENTSYear ended 31 December 2015
59. RELATED PARTY TRANSACTIONS (Continued)
In addition to the transactions and balances detailed elsewhere in these financial statements, the Group had the following material transactions with related parties during the year: (continued)
2015 2014Name of related parties Nature of transactions RMB’000 RMB’000 Rental incomeNanjing Xinwu Shipping Co., Ltd. Operating lease in respect of 1,400 1,709 (Notes 7 & 10) office buildings leased to
the related company Interest expenseWuxi Forte Real Estate Development Interest expense 6,383 9,683 Co., Ltd. (Notes 2, 12 & 14) Interest paid for deposits from related partiesShanghai Yuyuan Tourist Mart Interest paid for deposits 8,228 5,575 Co., Ltd. (Notes 2, 8 & 16)
BFC (Notes 6 & 16) Interest paid for deposits 4,713 1,839 Total interest paid for deposits from related parties 12,941 7,414 Other expensesNanjing Xinwu Shipping Co., Transportation fees 152,343 154,247 Ltd. (Notes 7 & 11)
SPFT – Carthago Operating lease in respect of 34,663 — (Notes 5 & 11) the operation of villages
Hainan Haigang Group Co., Ltd. Operating lease in respect of 19,983 17,059 (Notes 4 & 11) land leased from
the related company
Shanghai Foreal Property Property management — 6,451 Management Co., Ltd. services provided by (Notes 2 & 11) the related company
Beijing Jinxiang Fosun Pharmaceuticals Operating lease in respect — 3,993 Joint Stock Co., Ltd. (Notes 2 & 11) of office buildings leased
from the related company Total other expenses 206,989 181,750

FOSUN INTERNATIONAL LIMITED Annual Report 2015224
NOTES TO FINANCIAL STATEMENTSYear ended 31 December 2015
59. RELATED PARTY TRANSACTIONS (Continued)
In addition to the transactions and balances detailed elsewhere in these financial statements, the Group had the following material transactions with related parties during the year: (continued)
2015 2014Name of related parties Nature of transactions RMB’000 RMB’000 Loans from related companiesWuxi Forte Real Estate Development Loans provided by 193,000 193,000 Co., Ltd. (Notes 2, 12 & 14) the related companies Deposits from related companiesShanghai Yuyuan Tourist Mart Deposits from the related company 594,090 599,570 Co., Ltd. (Notes 2, 8 & 16)
Nanjing Iron & Steel United Co., Ltd. Deposits from the related company 200,698 — (Notes 7 & 16)
Shanghai Hongkou Gaungxin Deposits from the related company 173,716 — Microcredit Co., Ltd. (Notes 2 & 16)
Shanghai Xingyao Real Estate Deposits from the related company 43,192 493,330 Development Co., Ltd. (Notes 2 & 16)
Hangzhou Likun Investment Deposits from the related company 13,026 — Development Co., Ltd. (Notes 2 & 16)
Nanjing Iron & Steel Co., Ltd. (Notes 2, 7 & 16) Deposits from the related company 11,754 —
Sichuan Huanglong Forte Real Estate Deposits from the related company 10,271 21,648 Development Co., Ltd. (Notes 2 & 16)
Shanghai Yinping Investment Deposits from the related company 708 7,877 Management Co., Ltd. (Notes 2 & 16)
Zhejiang Dongyang China Woodcarving Deposits from the related company 27 42,022 City Co., Ltd. (Notes 2 & 16)
Fuyang Furun Property Co., Ltd. (Notes 2 & 16) Deposits from the related company 20 15,012
Zhejiang Dongyang China Woodcarving Deposits from the related company 4 150,673 Cultural Exhibition City Co., Ltd. (Notes 2 & 16)
Haizhimen (Notes 6 & 16) Deposits from the related company — 240,230
BFC (Notes 6 & 16) Deposits from the related company — 8,685
Others Deposits from the related company 825 317 Total deposits from related companies 1,048,331 1,579,364
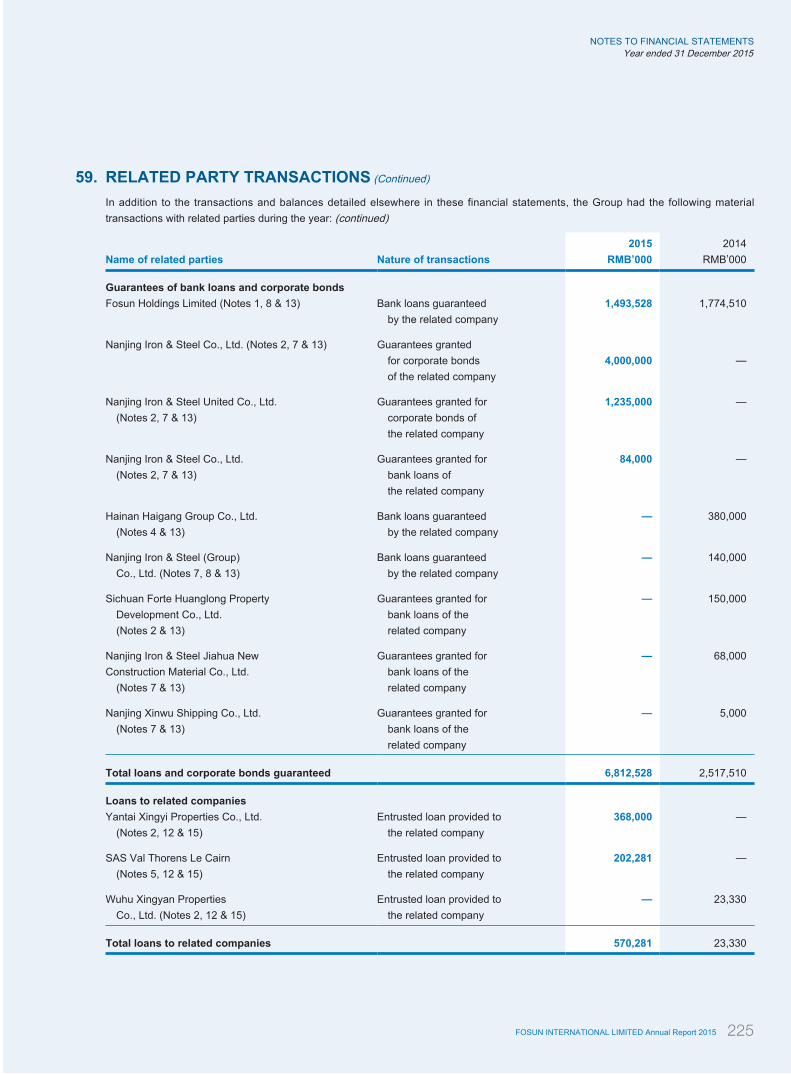
FOSUN INTERNATIONAL LIMITED Annual Report 2015 225
NOTES TO FINANCIAL STATEMENTSYear ended 31 December 2015
59. RELATED PARTY TRANSACTIONS (Continued)
In addition to the transactions and balances detailed elsewhere in these financial statements, the Group had the following material transactions with related parties during the year: (continued)
2015 2014Name of related parties Nature of transactions RMB’000 RMB’000 Guarantees of bank loans and corporate bondsFosun Holdings Limited (Notes 1, 8 & 13) Bank loans guaranteed 1,493,528 1,774,510
by the related company
Nanjing Iron & Steel Co., Ltd. (Notes 2, 7 & 13) Guarantees granted for corporate bonds 4,000,000 — of the related company
Nanjing Iron & Steel United Co., Ltd. Guarantees granted for 1,235,000 — (Notes 2, 7 & 13) corporate bonds of
the related company
Nanjing Iron & Steel Co., Ltd. Guarantees granted for 84,000 — (Notes 2, 7 & 13) bank loans of
the related company
Hainan Haigang Group Co., Ltd. Bank loans guaranteed — 380,000 (Notes 4 & 13) by the related company
Nanjing Iron & Steel (Group) Bank loans guaranteed — 140,000 Co., Ltd. (Notes 7, 8 & 13) by the related company
Sichuan Forte Huanglong Property Guarantees granted for — 150,000 Development Co., Ltd. bank loans of the (Notes 2 & 13) related company
Nanjing Iron & Steel Jiahua New Guarantees granted for — 68,000Construction Material Co., Ltd. bank loans of the (Notes 7 & 13) related company
Nanjing Xinwu Shipping Co., Ltd. Guarantees granted for — 5,000 (Notes 7 & 13) bank loans of the
related company Total loans and corporate bonds guaranteed 6,812,528 2,517,510 Loans to related companiesYantai Xingyi Properties Co., Ltd. Entrusted loan provided to 368,000 — (Notes 2, 12 & 15) the related company
SAS Val Thorens Le Cairn Entrusted loan provided to 202,281 — (Notes 5, 12 & 15) the related company
Wuhu Xingyan Properties Entrusted loan provided to — 23,330 Co., Ltd. (Notes 2, 12 & 15) the related company Total loans to related companies 570,281 23,330

FOSUN INTERNATIONAL LIMITED Annual Report 2015226
NOTES TO FINANCIAL STATEMENTSYear ended 31 December 2015
59. RELATED PARTY TRANSACTIONS (Continued)
Notes:
(1) It is the holding company of the Group.
(2) They are associates and joint ventures of the Group.
(3) It is the entity, which the ultimate controlling shareholder of the Group has significant influence in.
(4) They are non-controlling shareholders of the subsidiaries of the Group.
(5) In February 2015, the Group acquired 100% of the equity interests in Club Med. After the acquisition, Club Med became subsidiary of the Group as set out in note 54(a). SAS Val Thorens Le Cairn and SPFT - Carthago, the associate of Club Med, became associates of the Group since February 2015.
(6) Haizhimen was a joint venture of the Group as at 31 December 2014. In September 2015, the Group acquired 100% equity interests in BFC from Haizhimen as set out in note 54(a) to the financial statements.
(7) On 31 December 2015, the Group delegated its partial voting rights on Nanjing Nangang to Nanjing Iron & Steel (Group) Co., Ltd. Upon the date of the delegation, Nanjing Nangang was accounted for as investment in a joint venture as set out in note 54(b) to the financial statements.
(8) These transactions constitute connected transactions or continuing connected transactions of the Group under Chapter 14A of the Listing Rules. They are exempted from the disclosure requirements under Chapter 14A of the Listing Rules.
(9) The directors consider that the sales and purchases were undertaken on commercial terms similar to those offered to/by unrelated customers/suppliers in the ordinary course of business of the relevant companies.
(10) The directors consider that the income for consulting services and rental were determined based on prices available to third party customers.
(11) The directors consider that the fees for property management services, transportation services and leasing paid to the related companies were determined based on prices available to third party customers of the related companies.
(12) The loans provided by/to the related companies are unsecured, repayable on demand. The directors consider that the applicable interest rates are determined in accordance with the prevailing market borrowing rates.
(13) The bank loans were guaranteed by the related companies free of charge. The guarantees were given by the Group for bank loans of the related companies free of charge.
(14) The entrusted bank loans in the amounts of RMB100,000,000 and RMB93,000,000 are provided by Wuxi Forte Real Estate Development Co., Ltd., in 2015. Both of entrusted loans bear interest at a rate of 3.25% per annum and the maturity date are 10 November 2016 and 7 November 2016, respectively. The balance of the loans from Wuxi Forte Real Estate Development Co., Ltd. was RMB193,000,000 as set out in note 39 to financial statements.
(15) The balance of the entrusted loan provided to Yantai Xingyi Properties Co., Ltd. as at 31 December 2015 was RMB368,000,000 as set out in note 25 to the financial statements.
The balance of the shareholders’ loan provided to SAS Val Thorens Le Cairn as at 31 December 2015 was RMB202,281,000 as set out in note 25 to the financial statements.
The entrusted loan provided to Wuhu Xingyan Properties Co., Ltd. amounting to RMB23,330,000 was collected on 28 September 2015.
(16) Interest paid for deposits from related parties represent the interest paid for deposits placed by related parties in the Finance Company, a subsidiary of the Group. The deposits from related parties carry interests which are determined in accordance with the benchmark deposit interest rate of PBOC and the prevailing market deposit interest rate. The deposits will be repaid upon demand of the related parties.

FOSUN INTERNATIONAL LIMITED Annual Report 2015 227
NOTES TO FINANCIAL STATEMENTSYear ended 31 December 2015
59. RELATED PARTY TRANSACTIONS (Continued)
Notes: (Continued)
(17) Compensation of key management personnel of the Group:
2015 2014RMB’000 RMB’000
Short-term employee benefits 61,629 47,919Equity-settled share award scheme expense 7,536 —Pension scheme contributions 378 343 Total compensation paid to key management personnel 69,543 48,262
60. FINANCIAL INSTRUMENTS BY CATEGORYThe carrying amounts of each of the categories of financial instruments as at the end of the reporting period are as follows:
2015 Financial assets
Financial assets at fair value through profit or lossDesigned Available-
as such for-saleupon initial Held for Loans and financialrecognition trading receivables investments Total
RMB’000 RMB’000 RMB’000 RMB’000 RMB’000 Available-for-sale investments — — — 118,132,674 118,132,674Loans receivable — — 2,288,855 — 2,288,855Cash and bank — — 46,601,795 — 46,601,795Term deposits — — 465,135 — 465,135Investments at fair value through profit or loss 3,490,855 7,225,312 — — 10,716,167Trade and notes receivables — — 4,368,550 — 4,368,550Financial assets included in prepayments, deposits and other receivables (note 26) — — 8,107,895 — 8,107,895Due from related companies — — 3,707,641 — 3,707,641Derivative financial instruments 15,921 — — — 15,921Policyholder account assets in respect of unit-linked contracts 3,475,324 — 590,592 — 4,065,916Insurance and reinsurance debtors — — 8,274,973 — 8,274,973
6,982,100 7,225,312 74,405,436 118,132,674 206,745,522

FOSUN INTERNATIONAL LIMITED Annual Report 2015228
NOTES TO FINANCIAL STATEMENTSYear ended 31 December 2015
60. FINANCIAL INSTRUMENTS BY CATEGORY (Continued)
The carrying amounts of each of the categories of financial instruments as at the end of the reporting period are as follows: (continued)
2015 (Continued)
Financial liabilities
Financial liabilities at fair
value throughprofit or loss
- Designated as Financialsuch upon initial liabilities at
recognition amortised cost TotalRMB’000 RMB’000 RMB’000
Interest-bearing bank and other borrowings — 114,647,979 114,647,979Convertible bonds — 268,983 268,983Loans from related companies — 193,000 193,000Trade and notes payables — 10,436,233 10,436,233Financial liabilities included in accrued liabilities and other payables (note 41) — 12,852,879 12,852,879Due to related companies and the holding company — 3,923,793 3,923,793Deposit from customers — 1,300,688 1,300,688Financial liabilities included in other long term payables (note 50) 64,460* 3,340,638 3,405,098Finance lease payables — 166,495 166,495Derivative financial instruments 204,015 — 204,015Investment contract liabilities — 53,145,210 53,145,210Financial liabilities for unit-linked contracts 3,475,324 590,592 4,065,916Insurance and reinsurance creditors — 3,857,708 3,857,708
3,743,799 204,724,198 208,467,997
* The amount includes the share redemption option granted to non-controlling shareholders of a subsidiary amounting to RMB64,460,000 (2014: RMB60,299,000), of which fair value change is recognised in other reserve due to the nature of the equity transaction with a non-controlling shareholder of a subsidiary of the Group.

FOSUN INTERNATIONAL LIMITED Annual Report 2015 229
NOTES TO FINANCIAL STATEMENTSYear ended 31 December 2015
60. FINANCIAL INSTRUMENTS BY CATEGORY (Continued)
The carrying amounts of each of the categories of financial instruments as at the end of the reporting period are as follows: (continued)
2014 Financial assets
Financial assets at fair value through profit or loss
Designed as Available-such upon for-sale
initial Held for Loans and financialrecognition trading receivables investments Total
RMB’000 RMB’000 RMB’000 RMB’000 RMB’000 Available-for-sale investments — — — 77,237,813 77,237,813Loans receivable — — 2,140,063 — 2,140,063Cash and bank — — 40,190,807 — 40,190,807Term deposits — — 147,815 — 147,815Investments at fair value through profit or loss 1,759,301 13,107,893 — — 14,867,194Trade and notes receivables — — 6,371,003 — 6,371,003Financial assets included in prepayments, deposits and other receivables (note 26) — — 6,514,629 — 6,514,629Due from related companies — — 5,249,357 — 5,249,357Policyholder account assets in respect of unit-linked contracts 4,693,097 — 612,809 — 5,305,906Insurance and reinsurance debtors — — 2,132,018 — 2,132,018
6,452,398 13,107,893 63,358,501 77,237,813 160,156,605

FOSUN INTERNATIONAL LIMITED Annual Report 2015230
NOTES TO FINANCIAL STATEMENTSYear ended 31 December 2015
60. FINANCIAL INSTRUMENTS BY CATEGORY (Continued)
The carrying amounts of each of the categories of financial instruments as at the end of the reporting period are as follows: (continued)
2014 (Continued)
Financial liabilities
Financialliabilities at fair value through
profit or loss- Designated as Financialsuch upon initial liabilities at
recognition amortised cost TotalRMB’000 RMB’000 RMB’000
Interest-bearing bank and other borrowings — 93,155,696 93,155,696Convertible bonds — 2,485,546 2,485,546Loans from related companies — 193,000 193,000Trade and notes payables — 19,590,569 19,590,569Financial liabilities included in accrued liabilities and other payables (note 41) — 12,921,047 12,921,047Due to related companies and the holding company — 3,792,010 3,792,010Deposit from customers — 1,696,120 1,696,120Financial liabilities included in other long term payables (note 50) 88,019 3,303,153 3,391,172Finance lease payables — 267,227 267,227Derivative financial instruments 65,670 — 65,670Investment contract liabilities — 51,972,632 51,972,632Financial liabilities for unit-linked contracts 4,693,097 612,787 5,305,884Insurance and reinsurance creditors — 1,453,267 1,453,267
4,846,786 191,443,054 196,289,840
61. TRANSFERS OF FINANCIAL ASSETSAt 31 December 2015, the Group endorsed certain bills receivable accepted by banks in the PRC (the “Endorsed Bills”) to certain of its suppliers in order to settle the trade payables due to these suppliers with an aggregate carrying amount of RMB1,076,839,000 (2014: RMB3,458,632,000). In addition, the Group discounted certain bills receivable accepted by banks in the PRC (the “Discounted Bills”), to certain banks to finance its operating cash flow with an aggregate carrying amount of RMB228,169,000 (2014: RMB1,000,164,000). The Endorsed Bills and the Discounted Bills had maturity from one to six months at the end of the reporting period. In accordance with the relevant laws and regulations in the PRC and relevant discounting arrangement with certain banks, the holders of the Endorsed Bills and the Discounted Bills have a right of recourse against the Group if the accepting banks default (the “Continuing Involvement”).
In the opinion of the directors, the Group has transferred substantially all risks and rewards relating to the Endorsed Bills and the Discounted Bills. Accordingly, it has derecognised the full carrying amounts of the Endorsed Bills and the Discounted Bills. The maximum exposure to loss from the Group’s Continuing Involvement in the Endorsed Bills and the Discounted Bills and the undiscounted cash flows to repurchase these Endorsed Bills and Discounted Bills are equal to their carrying amounts. In the opinion of the directors of the Company, the fair values of the Group’s Continuing Involvement in the Endorsed Bills and the Discounted Bills are not significant.
During the year, the Group has not recognised any gain or loss on the date of transfer of the Endorsed Bills and the Discounted Bills. No gains or losses were recognised from the Continuing Involvement, both during the year or cumulatively. The endorsement and the discount have been made evenly throughout the year.

FOSUN INTERNATIONAL LIMITED Annual Report 2015 231
NOTES TO FINANCIAL STATEMENTSYear ended 31 December 2015
62. FAIR VALUE AND FAIR VALUE HIERARCHY OF FINANCIAL INSTRUMENTSThe carrying amounts and fair values of the Group’s financial instruments, other than those with carrying amounts that reasonably approximate to fair values, are as follows:
Carrying amounts Fair values
2015 2014 2015 2014RMB’000 RMB’000 RMB’000 RMB’000
Financial assetsAvailable-for-sale investments 105,772,373 67,742,925 105,772,373 67,742,925Loans receivable (non-current portion) 553,789 1,296,977 553,789 1,296,977Investments at fair value through profit or loss 10,716,167 14,867,194 10,716,167 14,867,194Policyholder account assets in respect of unit-linked contracts 3,475,324 4,693,097 3,475,324 4,693,097Derivative financial instruments 15,921 — 15,921 —
120,533,574 88,600,193 120,533,574 88,600,193 Financial liabilitiesInterest-bearing bank and other borrowings 114,647,979 93,155,696 113,651,825 93,020,297Convertible bonds 268,983 2,485,546 371,742 3,503,939Financial liabilities included in other long term payables 3,405,098 3,391,172 3,405,098 3,391,172Financial liabilities for unit-linked contracts 3,475,324 4,693,097 3,475,324 4,693,097Derivative financial instruments 204,015 65,670 204,015 65,670
122,001,399 103,791,181 121,108,004 104,674,175
Management has assessed that the fair values of cash and bank, trade and notes receivables, trade and notes payables, insurance and reinsurance debtors and creditors, financial assets included in prepayments, deposits and other receivables, financial liabilities included in other payables and accruals, the current portion of amounts due from related companies and amounts due to related companies and the holding company approximate to their carrying amounts largely due to the short-term maturities of these instruments.
The Group’s corporate finance team is responsible for determining the policies and procedures for the fair value measurement of financial instruments. The corporate finance team reports directly to the chief financial officer. At each reporting date, the corporate finance team analyses the movements in the values of financial instruments and determines the major inputs applied in the valuation. The valuation is reviewed and approved by the chief financial officer.

FOSUN INTERNATIONAL LIMITED Annual Report 2015232
NOTES TO FINANCIAL STATEMENTSYear ended 31 December 2015
62. FAIR VALUE AND FAIR VALUE HIERARCHY OF FINANCIAL INSTRUMENTS (Continued)
The fair values of the financial assets and liabilities are included at the amount at which the instrument could be exchanged in a current transaction between willing parties, other than in a forced or liquidation sale. The following methods and assumptions were used to estimate the fair values:
The fair values of the non-current portion of financial liabilities included in other long term payables, non-current portion of loans receivable, interest-bearing bank and other borrowings and convertible bonds have been calculated by discounting the expected future cash flows using rates currently available for instruments with similar terms, credit risk and remaining maturities. The Group’s own non-performance risk for the non-current portion of amounts due to related companies, financial liabilities included in other long term payables, loans from related companies, finance lease payables and non-current portion of interest-bearing bank and other borrowings as at 31 December 2015 was assessed to be insignificant. The fair value of the convertible bonds and other listed bonds is based on the quoted market price which represents the fair value for both the liability and equity components of the convertible bonds and the fair values of listed bonds and senior notes are based on quoted market prices.
The Group enters into derivative financial instruments with various counterparties, principally financial institutions with high credit ratings. Derivative financial instruments include commodity derivative contracts and interest rate swaps. As at 31 December 2015, the fair values of commodity derivative contracts were measured using quoted market prices of commodity future contracts while the fair values of interest rate swaps were measured using valuation techniques similar to swap models, using present value calculations. The models incorporate various market observable inputs including the credit quality of counterparties and interest rate curves. The carrying amounts of the commodity derivative contracts and interest rate swaps are the same as their fair values.
The fair values of listed equity investments without a lock-up period are based on quoted market prices. The fair values of listed equity investments with a lock-up period have been estimated based on assumptions that are supported by observable market prices and discount for lack of marketability. The directors believe that the estimated fair values resulting from the valuation technique, which are recorded in the consolidated statement of financial position, and the related changes in fair values, which are recorded in other comprehensive income or profit or loss, are reasonable, and that they were the most appropriate values at the end of the reporting period.
As at 31 December 2015, the fair value has not been disclosed for certain available-for-sale investments in equity instruments that do not have a quoted market price in an active market and is measured at cost less any impairment because their fair value cannot be measured reliably. The reason why the fair value cannot be measured reliably is that the variability in the range of reasonable fair value estimates is significant for that investment or the probabilities of the various estimates within the range cannot be reasonably assessed and used in estimating fair value. The carrying amount of these available-for-sale investments was RMB12,360,301,000 (31 December 2014: RMB9,494,888,000). All of them are unlisted equity investments held by the Group in China, North America, European and other countries, which are intended to be disposed of by the Group after getting listed on the designated stock exchanges in the future.
During the year ended 31 December 2015, the available-for-sale investments whose fair value could not be reliably measured with a carrying amount of RMB1,406,190,000 were derecognised and the relevant gain on disposal amounted to RMB1,239,767,000 was recognized in the consolidated statement of profit or loss.

FOSUN INTERNATIONAL LIMITED Annual Report 2015 233
NOTES TO FINANCIAL STATEMENTSYear ended 31 December 2015
62. FAIR VALUE AND FAIR VALUE HIERARCHY OF FINANCIAL INSTRUMENTS (Continued)
Below is a summary of significant unobservable inputs to the valuation of financial instruments as at 31 December 2015:
Unobservable inputs and sensitivity analysis for Level 3 assetsThe financial assets measured at fair value held by Portuguese Insurance Group which were classified in Level 3 primarily correspond to debt securities and investment funds not quoted in an active market.
The fair value of debt securities, which consist of public and corporate bonds, is determined using broker quotes that cannot be corroborated with observable market transactions. Significant unobservable inputs for these bonds would include proprietary cash flow models and issuer spreads, which are comprised of credit, liquidity, and other security-specific features of the bonds. An increase (decrease) in these issuer spreads would result in a lower (higher) fair value. Due to the unobservable nature of these quotes, we do not assess whether applying reasonably possible alternative assumptions would have an impact on the fair value of the Level 3 bonds.
The fair values of investment funds classified in Level 3 are based on net asset value (NAV) reports provided by the management of such funds. Based on the unobservable nature of these NAV’s, we do not assess whether applying reasonably possible alternative assumptions would have an impact on the fair value of the Level 3 investment funds.
Unobservable inputs and sensitivity analysis for Level 3 liabilitiesSignificant unobservable valuation input for the share redemption option granted to non-controlling shareholders of a subsidiary included in other long-term liabilities of RMB64,460,000 (31 December 2014: RMB60,299,000) is EBITDA (Earnings Before Interest, Taxes, Depreciation and Amortisation) of Alma Lasers in 2015 and cash and bank of Alma Lasers as at 31 December 2015.
Fair value hierarchyThe following tables illustrate the fair value measurement hierarchy of the Group’s financial instruments:
Level 1: Fair values measured based on quoted prices (unadjusted) in active markets for identical assets or liabilities
Level 2: Fair values measured based on valuation techniques for which all inputs which have a significant effect on the recorded fair value are observable, either directly or indirectly
Level 3: Fair values measured based on valuation techniques for which any inputs which have a significant effect on the recorded fair value are not based on observable market data (unobservable inputs)

FOSUN INTERNATIONAL LIMITED Annual Report 2015234
NOTES TO FINANCIAL STATEMENTSYear ended 31 December 2015
62. FAIR VALUE AND FAIR VALUE HIERARCHY OF FINANCIAL INSTRUMENTS (Continued)
Fair value hierarchy (Continued)
Assets measured at fair value:
As at 31 December 2015
Fair value measurement usingQuoted prices Significant Significant
in active observable unobservablemarkets inputs inputsLevel 1 Level 2 Level 3 Total
RMB’000 RMB’000 RMB’000 RMB’000 Available-for-sale investments 45,650,160 47,125,823 12,996,390 105,772,373Investments at fair value through profit or loss 7,150,646 2,879,455 686,066 10,716,167Policyholder account assets in respect of unit-linked contracts 2,922,987 496,085 56,252 3,475,324Derivative financial instruments 15,921 — — 15,921
55,739,714 50,501,363 13,738,708 119,979,785
As at 31 December 2014
Fair value measurement usingQuoted prices Significant Significant
in active observable unobservablemarkets inputs inputsLevel 1 Level 2 Level 3 Total
RMB’000 RMB’000 RMB’000 RMB’000 Available-for-sale investments 11,086,712 50,338,046 6,318,167 67,742,925Investments at fair value through profit or loss 13,074,122 1,766,229 26,843 14,867,194Policyholder account assets in respect of unit-linked contracts 161,480 4,343,983 187,634 4,693,097
24,322,314 56,448,258 6,532,644 87,303,216
During the year, no fair value of the available-for-sale investments in Level 2 was transferred out to Level 1 due to the end of the lock-up period for these equity investments in 2015 (2014: RMB199,248,000).

FOSUN INTERNATIONAL LIMITED Annual Report 2015 235
NOTES TO FINANCIAL STATEMENTSYear ended 31 December 2015
62. FAIR VALUE AND FAIR VALUE HIERARCHY OF FINANCIAL INSTRUMENTS (Continued)
Fair value hierarchy (Continued)
Assets measured at fair value: (Continued)The movements in fair value measurements within Level 3 during the year are as follows:
2015 2014RMB’000 RMB’000
At 1 January 6,532,644 —Total gains recognised in the consolidated statement of profit or loss included in other income 105,386 —Total losses recognised in other comprehensive expenses (16,002) —Addition 3,979,899 6,532,644Disposals (813,472) —Exchange realignment (807,980) —Reclassification 4,758,233 —
13,738,708 6,532,644
Assets for which fair values are disclosed:
As at 31 December 2015
Fair value measurement usingQuoted prices Significant Significant
in active observable unobservablemarkets inputs inputsLevel 1 Level 2 Level 3 Total
RMB’000 RMB’000 RMB’000 RMB’000 Loans receivable (non-current portion) — 553,789 — 553,789
As at 31 December 2014
Fair value measurement usingQuoted prices Significant Significant
in active observable unobservablemarkets inputs inputsLevel 1 Level 2 Level 3 Total
RMB’000 RMB’000 RMB’000 RMB’000 Loans receivable (non-current portion) — 1,296,977 — 1,296,977

FOSUN INTERNATIONAL LIMITED Annual Report 2015236
NOTES TO FINANCIAL STATEMENTSYear ended 31 December 2015
62. FAIR VALUE AND FAIR VALUE HIERARCHY OF FINANCIAL INSTRUMENTS (Continued)
Fair value hierarchy (Continued)
Liabilities measured at fair value:
As at 31 December 2015
Fair value measurement usingQuoted prices Significant Significant
in active observable unobservablemarkets inputs inputsLevel 1 Level 2 Level 3 Total
RMB’000 RMB’000 RMB’000 RMB’000 Financial liabilities included in other long term payables — — 64,460 64,460Financial liabilities for unit-linked contracts 2,922,987 496,085 56,252 3,475,324Derivative financial instruments 106,275 97,740 — 204,015
3,029,262 593,825 120,712 3,743,799
As at 31 December 2014
Fair value measurement usingQuoted prices Significant Significant
in active observable unobservablemarkets inputs inputsLevel 1 Level 2 Level 3 Total
RMB’000 RMB’000 RMB’000 RMB’000 Financial liabilities included in other long term payables — — 88,019 88,019Financial liabilities for unit-linked contracts 161,480 4,343,983 187,634 4,693,097Derivative financial instruments — 65,670 — 65,670
161,480 4,409,653 275,653 4,846,786
The movements in fair value measurements within Level 3 during the year are as follows:
2015 2014RMB’000 RMB’000
At 1 January 275,653 99,804Total losses recognised in the consolidated statement of profit or loss included in other expenses (536) —Addition 11,367 203,569Disposals (118,472) —Exchange realignment (19,580) —Reclassification (27,720) (27,720) At 31 December 120,712 275,653

FOSUN INTERNATIONAL LIMITED Annual Report 2015 237
NOTES TO FINANCIAL STATEMENTSYear ended 31 December 2015
62. FAIR VALUE AND FAIR VALUE HIERARCHY OF FINANCIAL INSTRUMENTS (Continued)
Fair value hierarchy (Continued)
Liabilities for which fair values are disclosed:
As at 31 December 2015
Fair value measurement usingQuoted prices Significant Significant
in active observable unobservablemarkets inputs inputsLevel 1 Level 2 Level 3 Total
RMB’000 RMB’000 RMB’000 RMB’000 Interest-bearing bank and other borrowings 15,686,572 97,965,253 — 113,651,825Convertible bonds 371,742 — — 371,742Financial liabilities included in other long term payables — 3,340,638 — 3,340,638
16,058,314 101,305,891 — 117,364,205
As at 31 December 2014
Fair value measurement usingQuoted prices Significant Significant
in active observable unobservablemarkets inputs inputsLevel 1 Level 2 Level 3 Total
RMB’000 RMB’000 RMB’000 RMB’000 Interest-bearing bank and other borrowings 9,079,979 83,940,318 — 93,020,297Convertible bonds 3,503,939 — — 3,503,939Financial liabilities included in other long term payables — 3,303,153 — 3,303,153
12,583,918 87,243,471 — 99,827,389

FOSUN INTERNATIONAL LIMITED Annual Report 2015238
NOTES TO FINANCIAL STATEMENTSYear ended 31 December 2015
63. FINANCIAL RISK MANAGEMENT OBJECTIVES AND POLICIESThe Group’s principal financial instruments, other than derivatives, comprise bank loans and other borrowings, finance lease payables, due from/to related companies, loans receivable and loans from related companies and cash and short-term deposits. The main purpose of these financial instruments is to raise finance for the Group’s operations. The Group has various other financial assets and liabilities such as trade and notes receivables, trade and notes payables and deposits from customers, which arise directly from its operations.
The main risks arising from the Group’s financial instruments are interest rate risk, foreign currency risk, credit risk, liquidity risk and equity price risk. The board of directors reviews and agrees policies for managing each of these risks and they are summarised below.
Interest rate riskThe Group’s exposure to the risk of changes in market interest rates relates primarily to the Group’s long-term debt obligations with floating interest rates.
The Group’s policy is to manage its interest cost using a mix of fixed and variable rate debts. At 31 December 2015, approximately 37% (2014: 49%) of the Group’s interest-bearing borrowings bore interest at fixed rates.
The following table demonstrates the sensitivity to a reasonably possible change in interest rates, with all other variables held constant, of the Group’s profit before tax (through the impact on floating rate borrowings).
Increase/(decrease) in
Increase/(decrease) in
basis points profit before taxRMB’000
2015 75 (474,608)
(75) 474,608 2014 75 (232,400)
(75) 232,400
Foreign currency riskThe Group has transactional currency exposures. These exposures arise from sales or purchases by operating units and investing and financing activities by investment holding units in currencies other than the units’ functional currencies. The following table demonstrates the sensitivity at the end of the reporting period to a reasonably possible change in United States dollar, Hong Kong dollar and Euro exchange rates, with all other variables held constant, of the Group’s profit before tax due to differences arising on settlement or translation of monetary assets and liabilities and the Group’s equity excluding the impact of retained earnings due to the changes of exchange fluctuation reserve of certain overseas subsidiaries, of which the functional currencies are currencies other than RMB.

FOSUN INTERNATIONAL LIMITED Annual Report 2015 239
NOTES TO FINANCIAL STATEMENTSYear ended 31 December 2015
63. FINANCIAL RISK MANAGEMENT OBJECTIVES AND POLICIES (Continued)
Foreign currency risk (Continued)
Increase/(decrease)
Increase/(decrease)
in foreigncurrency rate
in profitbefore tax
% RMB’000 2015 If RMB weakens against the United States dollar 5 (1,100,355) If RMB strengthens against the United States dollar (5) 1,100,355 If RMB weakens against the Hong Kong dollar 5 (164,065) If RMB strengthens against the Hong Kong dollar (5) 164,065 If RMB weakens against the Euro 5 (447,816) If RMB strengthens against the Euro (5) 447,816 2014 If RMB weakens against the United States dollar 5 (1,046,523) If RMB strengthens against the United States dollar (5) 1,046,523 If RMB weakens against the Hong Kong dollar 5 (111,935) If RMB strengthens against the Hong Kong dollar (5) 111,935 If RMB weakens against the Euro 5 27,203 If RMB strengthens against the Euro (5) (27,203)
Credit riskThe Group trades only with recognised and creditworthy third parties. It is the Group’s policy that all customers who wish to trade on credit terms are subject to credit verification procedures. In addition, receivable balances are monitored on an ongoing basis and the Group’s exposure to bad debts is not significant.
The credit risk of the Group’s other financial assets, which comprise cash and bank and term deposits, loan receivables, amounts due from related companies and other receivables, arises from the default of the counterparty, with a maximum exposure equal to the carrying amounts of these instruments.
The Group is also exposed to credit risk through the granting of financial guarantees, further details of which are disclosed in note 58 to the financial statements.
Further quantitative data in respect of the Group’s exposure to credit risk arising from trade and notes receivables and insurance and reinsurance debtors are disclosed in notes 34 and 30 to the financial statements.

FOSUN INTERNATIONAL LIMITED Annual Report 2015240
NOTES TO FINANCIAL STATEMENTSYear ended 31 December 2015
63. FINANCIAL RISK MANAGEMENT OBJECTIVES AND POLICIES (Continued)
Liquidity riskThe Group’s objective is to maintain a balance between continuity of funding and flexibility through the use of interest-bearing loans and other borrowings and loans from related companies. 40% (2014: 46%) of the Group’s debts would mature in less than one year as at 31 December 2015 based on the carrying value of borrowings reflected in the financial statements.
The maturity profile of the Group’s financial liabilities as at the end of the reporting period, based on the contractual undiscounted payments, is as follows:
2015
Less thanOn demand 1 year 1 to 5 years Over 5 years Total
RMB’000 RMB’000 RMB’000 RMB’000 RMB’000 Interest-bearing bank and other borrowings — 48,788,443 62,931,679 9,031,010 120,751,132Convertible bonds — — 322,577 — 322,577Loans from related companies — 193,000 — — 193,000Trade and notes payables 1,546,945 8,889,288 — — 10,436,233Due to related companies and the holding company 3,923,793 — — — 3,923,793Financial liabilities included in accrued liabilities and other payables 9,369,393 3,483,486 — — 12,852,879Other long term payables — — 3,405,098 — 3,405,098Finance lease payables — 51,012 130,879 — 181,891Derivative financial instruments — 204,015 — — 204,015Financial liabilities for unit-linked contracts 94,614 156,963 3,705,317 109,022 4,065,916Investment contract liabilities 1,342,642 3,597,869 31,006,133 17,198,566 53,145,210Insurance and reinsurance creditors 1,782,814 1,957,561 117,333 — 3,857,708
18,060,201 67,321,637 101,619,016 26,338,598 213,339,452

FOSUN INTERNATIONAL LIMITED Annual Report 2015 241
NOTES TO FINANCIAL STATEMENTSYear ended 31 December 2015
63. FINANCIAL RISK MANAGEMENT OBJECTIVES AND POLICIES (Continued)
Liquidity risk (Continued)
The maturity profile of the Group’s financial liabilities as at the end of the reporting period, based on the contractual undiscounted payments, is as follows:
2014
Less thanOn demand 1 year 1 to 5 years Over 5 years Total
RMB’000 RMB’000 RMB’000 RMB’000 RMB’000 Interest-bearing bank and other borrowings — 46,389,197 53,365,049 1,577,440 101,331,686Convertible bonds — — 3,247,527 — 3,247,527Loans from related companies — 193,000 — — 193,000Trade and notes payables 2,498,888 17,091,681 — — 19,590,569Due to related companies and the holding company 3,792,010 — — — 3,792,010Financial liabilities included in accrued liabilities and other payables 3,406,408 9,514,639 — — 12,921,047Other long term payables — — 3,391,172 — 3,391,172Finance lease payables — 112,282 154,945 — 267,227Derivative financial instruments — 65,670 — — 65,670Financial liabilities for unit linked contracts 1,104,752 — 4,201,132 — 5,305,884Investment contract liabilities — 12,326,734 25,015,563 14,630,335 51,972,632Insurance and reinsurance creditors 1,453,267 — — — 1,453,267
12,255,325 85,693,203 89,375,388 16,207,775 203,531,691
In addition, the guarantees provided by the Group will be called in case of default in payments by the guaranteed companies as set out in note 59.
Price riskPrice risk is the risk that the fair values of equity and debt securities decrease or increase as a result of changes in the levels of equity indices and the value of individual securities. The Group was exposed to price risk arising from individual investments classified as equity investments at fair value through profit or loss (note 33) and available-for-sale investments measured at fair value (note 23) as at 31 December 2015. The Group’s listed investments that are listed on stock exchanges in Hong Kong, Shenzhen, Shanghai, NASDAQ, Athens, Tokyo, Singapore, other countries in Europe, Oceania, Latin America, North America, South America, Africa and Asia are valued at quoted market prices at the end of the reporting period.

FOSUN INTERNATIONAL LIMITED Annual Report 2015242
NOTES TO FINANCIAL STATEMENTSYear ended 31 December 2015
63. FINANCIAL RISK MANAGEMENT OBJECTIVES AND POLICIES (Continued)
Price risk (Continued)
The following table demonstrates the sensitivity to a reasonably possible change in the fair values of the equity investments, with all other variables held constant and before any impact on tax, based on their carrying amounts at the end of the reporting period. For the purpose of this analysis, for the available-for-sale investments, the impact is deemed to be on the available-for-sale investment revaluation reserve and no account is given for factors such as impairment which might impact the statement of profit or loss, and no account is given for impact on other life insurance contract liabilities (profit sharing provision).
Increase/ Increase/Carrying (decrease) (decrease) Increase/
amount of in equity in profit (decrease)investments or debt prices before tax in equity
RMB’000 % RMB’000 RMB’000* 2015
Investments listed in:Hong Kong – Available-for-sale 8,731,231 5 — 436,562
(5) — (436,562) – Held-for-trading 5,983,108 5 299,155 —
(5) (299,155) —
Shenzhen – Available-for-sale 1,259,652 5 — 62,983
(5) — (62,983)
Shanghai – Available-for-sale 1,342,972 5 — 67,149
(5) — (67,149)
United States – Available-for-sale 43,644,787 5 — 2,182,239
(5) — (2,182,239) – Held-for-trading 2,876,640 5 143,832 —
(5) (143,832) —
Europe – Available-for-sale 43,256,005 5 — 2,162,800
(5) — (2,162,800) – Held-for-trading 828,351 5 41,418 —
(5) (41,418) —

FOSUN INTERNATIONAL LIMITED Annual Report 2015 243
NOTES TO FINANCIAL STATEMENTSYear ended 31 December 2015
63. FINANCIAL RISK MANAGEMENT OBJECTIVES AND POLICIES (Continued)
Price risk (Continued)
Increase/ Increase/Carrying (decrease) (decrease) Increase/
amount of in equity in profit (decrease)investments or debt prices before tax in equity
RMB’000 % RMB’000 RMB’000* 2015
Investments listed in:Japan – Available-for-sale 185,639 5 — 9,282
(5) — (9,282)
Singapore – Available-for-sale 1,392,211 5 — 69,611
(5) — (69,611) – Held-for-trading 60,134 5 3,007 —
(5) (3,007) —
Africa – Available-for-sale 57,074 5 — 2,854
(5) — (2,854)
Oceania – Available-for-sale 184,616 5 — 9,231
(5) — (9,231)
Latin America – Available-for-sale 111,968 5 — 5,598
(5) — (5,598)
North America – Available-for-sale 1,090,257 5 — 54,513
(5) — (54,513)
South America – Available-for-sale 212,565 5 — 10,628
(5) — (10,628)
Asia – Available-for-sale 334,753 5 — 16,738
(5) — (16,738)
* Excluding retained profits

FOSUN INTERNATIONAL LIMITED Annual Report 2015244
NOTES TO FINANCIAL STATEMENTSYear ended 31 December 2015
63. FINANCIAL RISK MANAGEMENT OBJECTIVES AND POLICIES (Continued)
Price risk (Continued)
Increase/ Increase/Carrying (decrease) (decrease) Increase/
amount of in equity in profit (decrease)investments or debt prices before tax in equity
RMB’000 % RMB’000 RMB’000* 2014
Investments listed in:Hong Kong – Available-for-sale 3,917,216 5 — 195,861
(5) — (195,861) – Held-for-trading 7,552,645 5 377,632 —
(5) (377,632) —
Shenzhen – Available-for-sale 1,683,078 5 — 84,154
(5) — (84,154)
Shanghai – Available-for-sale 2,319,811 5 — 115,991
(5) — (115,991) – Held-for-trading 1,748,222 5 87,411 —
(5) (87,411) —
United States – Available-for-sale 2,161,707 5 — 108,085
(5) — (108,085) – Held-for-trading 2,540,341 5 127,017 —
(5) (127,017) —
Europe – Available-for-sale 53,865,049 5 — 2,693,252
(5) — (2,693,252) – Held-for-trading 2,551,495 5 127,575 —
(5) (127,575) —
Japan – Available-for-sale 80,001 5 — 4,000
(5) — (4,000) – Held-for-trading 92,750 5 4,638 —
(5) (4,638) —
Singapore – Available-for-sale 659,536 5 — 32,977
(5) — (32,977)
Africa – Available-for-sale 17,520 5 — 876
(5) — (876)
* Excluding retained profits

FOSUN INTERNATIONAL LIMITED Annual Report 2015 245
NOTES TO FINANCIAL STATEMENTSYear ended 31 December 2015
63. FINANCIAL RISK MANAGEMENT OBJECTIVES AND POLICIES (Continued)
Capital managementThe primary objectives of the Group’s capital management are to safeguard the Group’s ability to continue as a going concern and to maintain healthy capital ratios in order to support its business and maximise shareholders’ value.
The Group manages its capital structure and makes adjustment to it in light of changes in economic conditions. To maintain or adjust the capital structure, the Group may adjust the dividend payment to shareholders, return capital to shareholders or issue new shares. No changes were made in the objectives, policies or processes for managing capital during the years ended 31 December 2015 and 31 December 2014.
The Group monitors capital using a gearing ratio, which is net debt divided by total equity plus net debt. The Group’s policy is to keep the gearing ratio between 20% and 60%. Net debt includes interest-bearing bank and other borrowings, the liability component of convertible bonds and loans from related companies, less cash and cash equivalents. Total equity includes equity attributable to owners of the parent and non-controlling interests. The gearing ratios as at the end of the reporting periods were as follows:
2015 2014RMB’000 RMB’000
Interest-bearing bank and other borrowings 114,647,979 93,155,696Loans from related companies 193,000 193,000Convertible bonds, the liability component 268,983 2,485,546Less: Cash and cash equivalents (38,419,960) (25,890,353) Net debt 76,690,002 69,943,889
Total equity 98,154,075 75,684,492 Total equity and net debt 174,844,077 145,628,381 Gearing ratio 44% 48%
64. EVENTS AFTER THE REPORTING PERIOD(1) On 19 November 2015, China Securities Regulatory Commission (“CSRC”) approved Fosun Group to publicly issue corporate
bonds to the qualified investors. Pursuant to the approval, a par value of the corporate bonds to be issued should not exceed RMB10 billion (inclusive). On 21 January 2016, Fosun Group issued the first tranche of five-year corporate bonds with a par value of RMB4 billion and a coupon rate of 3.78% per annum. According to the term of the corporate bonds, Fosun Group shall be entitled to adjust upwards the coupon rate and the investors shall be entitled to sell back the corporate bonds at the end of the third year.
(2) On 30 December 2015, CSRC approved Fosun Pharma to publicly issue corporate bonds to the qualified investors. Pursuant to the approval, a par value of the corporate bonds to be issued should not exceed RMB5 billion (inclusive). On 4 March 2016, Fosun Pharma issued the first tranche of five-year corporate bonds with a par value of RMB3 billion and a coupon rate of 3.35% per annum. According to the term of the corporate bonds, Fosun Pharma shall be entitled to adjust upwards the coupon rate and the investors shall be entitled to sell back the corporate bonds at the end of the third year.
(3) On 24 March 2016, the Ministry of Finance and the State Administration of Taxation issued a circular according to which the replacement of business tax with value-added tax (“VAT”) will be extended to construction, real estate, finance and consumer services industries starting on 1 May 2016. The Group is currently assessing the impact of such VAT reform on the financial position or performance of the Group from the effective date.
65. COMPARATIVE AMOUNTSAs further explained in note 2.2 to the financial statements, due to the implementation of the Hong Kong Companies Ordinance (Cap. 622) during the current year, the presentation and disclosures of certain items and balances in the financial statements have been revised to comply with the new requirements. Accordingly, certain comparative amounts have been restated to conform with the current year’s presentation and disclosures. In addition, as stated in note 5 to the financial statements, the comparative segment information has been restated to reflect the change of the reporting segments of the Group.

FOSUN INTERNATIONAL LIMITED Annual Report 2015246
NOTES TO FINANCIAL STATEMENTSYear ended 31 December 2015
66. STATEMENT OF FINANCIAL POSITION OF THE COMPANYInformation about the statement of financial position of the Company at the end of the reporting period is as follows:
2015 2014RMB’000 RMB’000
NON-CURRENT ASSETSInvestments in subsidiaries 24,173,606 13,887,918Investment in an associate 82,421 82,421Available-for-sale investment 418,544 1,891 Total non-current assets 24,674,571 13,972,230 CURRENT ASSETSCash and bank 3,937,013 805,480Investments at fair value through profit or loss 4,590,232 6,062,759Prepayments, deposits and other receivables 84,566 52,091Due from subsidiaries 34,363,854 12,176,328Due from related companies 3,249 3,061 Total current assets 42,978,914 19,099,719 CURRENT LIABILITIESInterest-bearing bank and other borrowings 7,675,203 4,815,367Accrued liabilities and other payables 76,887 78,738Due to the holding company 979,101 673,617Due to subsidiaries 13,796,419 2,457,214 Total current liabilities 22,527,610 8,024,936 NET CURRENT ASSETS 20,451,304 11,074,783 TOTAL ASSETS LESS CURRENT LIABILITIES 45,125,875 25,047,013 NON-CURRENT LIABILITIESInterest-bearing bank and other borrowings 8,452,079 5,798,571Deferred tax liabilities 7,748 287,428 Total non-current liabilities 8,459,827 6,085,999 Net assets 36,666,048 18,961,014 EQUITYShare capital 36,046,143 16,281,011Equity component of convertible bonds (note) 68,674 721,171Other reserves (note) 551,231 1,958,832 Total equity 36,666,048 18,961,014
Guo Guangchang Ding GuoqiDirector Director

FOSUN INTERNATIONAL LIMITED Annual Report 2015 247
NOTES TO FINANCIAL STATEMENTSYear ended 31 December 2015
66. STATEMENT OF FINANCIAL POSITION OF THE COMPANY (Continued)
Note:
A summary of the Company’s reserves is as follows:
Available-for-sale
Exchange investment CapitalShare Other fluctuation revaluation redemption Convertible Retained
premium reserve reserve reserve reserve bonds earnings TotalRMB’000 RMB’000 RMB’000 RMB’000 RMB’000 RMB’000 RMB’000 RMB’000
At 1 January 2014 11,785,713 — (2,785,245) — 1,465 721,171 4,552,741 14,275,845
Transition to no-par value regime (11,785,713) — — — (1,465) — — (11,787,178)Final dividend declared — — — — — — (816,399) (816,399)Total comprehensive income for the year — — 31,265 — — — 976,470 1,007,735 At 31 December 2014 and 1 January 2015 — — (2,753,980) — — 721,171 4,712,812 2,680,003Final dividend declared — — — — — — (1,035,103) (1,035,103)Conversion of convertible bonds to ordinary shares — — — — — (652,497) — (652,497)Equity-settled share-based payments — 21,831 — — — — — 21,831Total comprehensive income/(loss) for the year — — 1,825,042 (208,449) — — (2,010,922) (394,329) At 31 December 2015 — 21,831 (928,938) (208,449) — 68,674 1,666,787 619,905
67. APPROVAL OF THE FINANCIAL STATEMENTSThe financial statements were approved and authorised for issue by the board of directors on 30 March 2016.

FOSUN INTERNATIONAL LIMITED Annual Report 2015248
CORPORATE INFORMATION
EXECUTIVE DIRECTORSGuo Guangchang (Chairman)Liang Xinjun (Vice Chairman and Chief Executive Officer)Wang Qunbin (President)Ding GuoqiQin XuetangChen Qiyu (appointed as Director on 10 July 2015)Xu Xiaoliang (appointed as Director on 10 July 2015)Wu Ping (resigned as Director on 10 July 2015)
NON-EXECUTIVE DIRECTORFan Wei (resigned as Director on 10 July 2015)
INDEPENDENT NON-EXECUTIVE DIRECTORSZhang ShengmanZhang HuaqiaoDavid T. ZhangYang Chao
AUDIT COMMITTEEZhang Shengman (Chairman)Zhang HuaqiaoDavid T. ZhangYang Chao
REMUNERATION COMMITTEEZhang Huaqiao (Chairman)Liang XinjunZhang ShengmanDavid T. ZhangYang Chao
NOMINATION COMMITTEEDavid T. Zhang (Chairman)Wang QunbinZhang ShengmanZhang HuaqiaoYang Chao
COMPANY SECRETARYSze Mei Ming
AUTHORISED REPRESENTATIVESQin XuetangDing Guoqi
AUDITORSErnst & Young
LEGAL ADVISOR AS TO HONG KONG LAWKing & Wood Mallesons
PRINCIPAL BANKERSIndustrial and Commercial Bank of ChinaChina Development BankAgricultural Bank of ChinaBank of ChinaBank of CommunicationsChina Merchants BankChina Construction BankShanghai Pudong Development BankPing An BankThe Export-Import Bank of ChinaBank of ShanghaiHang Seng BankBank of East AsiaHongkong and Shanghai Banking Corporation Limited
REGISTERED OFFICERoom 808, ICBC Tower3 Garden RoadCentralHong Kong
PRINCIPAL OFFICENo. 2 East Fuxing RoadShanghai 200010PRC

CORPORATE INFORMATION
FOSUN INTERNATIONAL LIMITED Annual Report 2015 249
SHARE REGISTRARComputershare Hong Kong Investor Services Limited17M FloorHopewell Centre183 Queen’s Road EastWanchaiHong Kong
STOCK CODE00656
WEBSITEhttp://www.fosun.com

FOSUN INTERNATIONAL LIMITED Annual Report 2015250
GLOSSARY
FORMULAEBITDA = profit for the year + tax + net interest expenditures + depreciation and amortisationTotal debt = current and non-current interest-bearing borrowings + convertible bonds + loans from related partiesNet debt = total debt – cash and bank and term depositsTotal capitalization = equity attributable to owners of the parent + non-controlling interests + total debtInterest coverage = EBITDA/net interest expendituresCapital employed = equity attributable to owners of the parent + total debtNet gearing ratio = net debt/shareholder’s equityROE = profit attributable to owners of the parent for the year/[(opening balance of equity attributable to
owners of the parent + ending balance of equity attributable to owners of the parent)/2]
ABBREVIATIONSArticles of Association the current articles of association of the Company with the latest amendments made on 17 June 2008Billion Infinity Billion Infinity Investment LimitedBillion Infinity Share Purchase Agreement
the share purchase agreement dated 23 March 2015 entered into among Billion Infinity and the Billion Infinity Sellers in relation to the Billion Infinity acquisition
BHF KB BHF Kleinwort Benson Group SA (formerly known as RHJ International SA), the shares of which are listed on Euronext Brussels with stock code BHFKB
the Board the board of DirectorsBONA Bona Film Group LimitedCAGR compound annual growth rateCainiao Cainiao Network Technology Co., Ltd.Carlye-Fosun Fosun-Carlye (Shanghai) Equity Investment Fund L.P.CG Code Corporate Governance Code and Corporate Governance Report contained in Appendix 14 of the
Listing RulesChuangfu Finance Leasing Chuangfu Finance Leasing (Shanghai) Co., Ltd.Club Med Club Méditerranée SACMF China Momentum Fund, L.P.the Company Fosun International Limitedthe Director(s) the director(s) of the CompanyEuro Euro, the official currency of the EurozoneFidelidade Fidelidade-Companhia de Seguros, S.A.Fidelidade Assistência Fidelidade Assistência - Companhia de Seguros, S.A. (formerly known as Cares - Companhia de
Seguros, S.A.)Fidelidade Share Purchase Agreement
the share purchase agreement dated 23 March 2015 entered into among Fidelidade and the Fidelidade Sellers in relation to the Fidelidade acquisition
Focus Media Focus Media Holding LimitedFolli Follie Folli Follie GroupForte Shanghai Forte Land Co., Ltd.Fosun Capital Shanghai Fosun Capital Equity Investment Fund Partnership (L.P.)Fosun Chuanghong Shanghai Fosun Chuanghong Equity Investment Fund Partnership (L.P.)Fosun Eurasia Capital Fosun Eurasia Capital Limited Liability CompanyFosun Finance Company Shanghai Fosun High Technology Group Finance Co., Ltd.Fosun Hani Securities Fosun Hani Securities Limited (formerly known as Hani Securities (H.K.) Limited)

GLOSSARY
FOSUN INTERNATIONAL LIMITED Annual Report 2015 251
Fosun High Technology Shanghai Fosun High Technology (Group) Co., LtdFosun Holdings Fosun Holdings LimitedFosun Industrial Development Shanghai Fosun Industrial Technology Development Co., Ltd.Fosun International Holdings Fosun International Holdings Ltd.Fosun Insurance Portugal Fidelidade, Multicare and Fidelidade AssistênciaFosun Pharma Shanghai Fosun Pharmaceutical (Group) Co., Ltd., a company whose A shares are listed on the SSE
with stock code 600196, and whose H shares are listed on the Hong Kong Stock Exchange with stock code 02196
Fosunling Shanghai Fosunling Asset Management Ltd.GBP Pound Sterling, the official currency of United KingdomGFA gross floor areathe Group or Fosun the Company and its subsidiariesH&A Hauck & Aufhäuser Privatbankiers KGaAHainan Mining Hainan Mining Co., Ltd., a company whose A shares are listed on the SSE with stock
code 601969Hangzhou Financial Investment Leasing
Hangzhou Financial Investment Leasing Co., Ltd.
HKD Hong Kong dollars, the official currency of Hong KongHong Kong the Hong Kong Special Administrative Region of PRCHong Kong Stock Exchange The Stock Exchange of Hong Kong LimitedIDERA IDERA Capital Management Ltd.Ironshore Ironshore Inc.Jin’an Mining Anhui Jin’an Mining Co., Ltd.JPY Japanese yen, the official currency of JapanListing Rules the Rules Governing the Listing of Securities on the Hong Kong Stock ExchangeLuz Saúde Luz Saúde, S.A. (formerly known as ESPÍRITO SANTO SAÚDE - SGPS, SA), a company listed
on the Euronext Lisbon with stock code LUZMIG Meadowbrook Insurance Group, Inc., whose shares were delisted and ceased trading on the New York
Stock Exchange in July 2015Minsheng Bank China Minsheng Banking Corp., Ltd., a company whose A shares are listed on the SSE
with stock code 600016, and whose H shares are listed on the Hong Kong Stock Exchange with stock code 01988
Model Code the Model Code for Securities Transactions by Directors of Listed Issuers contained in Appendix 10 of the Listing Rules
Multicare Multicare-Seguros de Saúde, S.A.Mybank Zhejiang E-Commerce Bank Co., Ltd.Nanjing Iron & Steel Nanjing Iron & Steel Co., Ltd., a company whose A shares are listed on the SSE with stock code 600282Nanjing Nangang Nanjing Nangang Iron & Steel United Co., Ltd.NEEQ National Equities Exchange and QuotationsNew China Life Insurance New China Life Insurance Company Ltd., a company whose A shares are listed on the SSE with stock code
601336, and whose H shares are listed on the Hong Kong Stock Exchange with stock code 01336Peak Reinsurance Peak Reinsurance Company LimitedPhoenix Holdings Phoenix Holdings Ltd.Pramerica-Fosun China Opportunity Fund
Pramerica - Fosun China Opportunity Fund, L.P.
Pramerica Fosun Life Insurance Pramerica Fosun Life Insurance Co., Ltd.PRC or China the People’s Republic of China

GLOSSARY
FOSUN INTERNATIONAL LIMITED Annual Report 2015252
Reporting Period the year ended 31 December 2015Resolution Property Resolution Property Investment Management LLPResource Property Shanghai Resource Property Consultancy Co., Ltd., a company listed on NEEQ with stock code 833517Rights Issue the issuance of the rights shares at the subscription price on the basis of 56 rights shares for
every 500 Shares held on the record date, payable in full on acceptanceRMB Renminbi, the official currency of the PRCROC Roc Oil Company Limited, the shares of which were delisted from the Australian Securities Exchange
in January 2015Sanyuan Foods Beijing Sanyuan Foods Co., Ltd., a company whose A shares are listed on the SSE with stock code 600429SFO the Securities and Futures Ordinance (Charter 571) of the laws of Hong KongShare(s) the share(s) of the CompanyShare Option Scheme the share option scheme of the Company adopted on 19 June 2007Silver Cross Silver Cross Nurseries LimitedSSE the Shanghai Stock ExchangeSinopharm Sinopharm Group Co., Ltd., a company whose H shares are listed on the Hong Kong Stock Exchange
with stock code 01099Star Capital Shanghai Star Equity Investment L.P.Starcastle Senior Living Shanghai Starcastle Senior Living Co., Ltd.Studio 8 Studio 8, LLCThomas Cook Thomas Cook Group plcTianjin Jianlong Tianjin Jianlong Iron & Steel Industrial Co., Ltd.USD United States dollars, the official currency of the United StatesWeishi Fund Shanghai Fosun Weishi Phase I Equity Investment Fund Partnership (L.P.)Xinghong Fund Shanghai Xinghong Phase I Equity Investment Fund Partnership (L.P.)Yong’an P&C Insurance Yong’an Property Insurance Company LimitedYuyuan Shanghai Yuyuan Tourist Mart Co., Ltd., a company whose A shares are listed on the SSE
with stock code 600655Zhaojin Mining Zhaojin Mining Industry Co., Ltd., a company whose H shares are listed on the Hong Kong
Stock Exchange with stock code 01818Zhejiang Growth Fund Hangzhou Zhejiang Momentum Fund LLPZhongshan Public Utilities Zhongshan Public Utilities Group Co., Ltd., a company whose A shares are listed on the Shenzhen
Stock Exchange with stock code 000685


