41
Profitability and Ownership Structure of US Foreign Ventures Why US Joint Ventures Abroad Are Less Profitable Than Wholly Owned Ventures Ben Gomes-Casseres Mauricio Jenkins Peter ZÆmborsk

Profita
bili
ty a
nd O
wner
ship
Str
uct
ure
of U
S F
ore
ign V
entu
res
Wh
y U
S J
oin
t V
en
ture
s A
bro
ad
Are
Less
P
rofi
tab
le T
han
Wh
olly O
wn
ed
Ven
ture
s
Ben
Gom
es-C
asse
res
Mau
rici
o J
enki
ns
Pet
er Z
ámbors
ký

Low
pro
fita
bili
ty o
f U
S J
Vs
abro
ad
!U
S m
anufa
cturi
ng join
t ve
ntu
res
abro
ad e
arned
an a
vera
ge
3%
ret
urn
on a
sset
s in
1977-2
003
!W
holly
-ow
ned
man
ufa
cturing
affilia
tes
earn
ed 6
.4%
RO
A

Profita
bili
ty G
ap,
1977-2
003
Man
ufac
turin
g
-2.0
%
0.0%
2.0%
4.0%
6.0%
8.0%
10.0
%
12.0
% 1975
1980
1985
1990
1995
2000
2005
Maj
ority
Min
ority
Gap
Poss
ible
exp
lanat
ions
for
gap
We
test
ed for:
!Siz
e!
Age
!Tax
rat
es!
Non-d
ivid
end p
aym
ents
!M
NC�s
ow
ner
ship
-spec
ific
cap
abili
ties

Sty
lized
fac
ts e
mer
gin
g fro
m d
ata
1.
Ther
e is
a p
osi
tive
gap
on a
vera
ge
2.
It is
larg
est
in s
ecto
rs w
her
e U
S M
NCs
are
most
com
pet
itiv
e ab
road
3.
The
gap
shrinks
ove
r tim
e on a
vera
ge

Rel
ated
aca
dem
ic liter
atu
re
!D
esai, F
ole
y an
d H
ines
(2004)
found
shar
ply
dec
linin
g p
ropen
sity
of U
S
MN
Es
to form
JVs
abro
ad
!They
focu
s on t
he
det
erm
inan
ts o
f ow
ner
ship
str
uct
ure
to e
xpla
in t
his

Dec
linin
g u
se o
f JV
s by
US M
NEs
Shar
e of
JVs
on T
otal
No. o
f US
Fore
ign
Vent
ures
0%20%
40%
60%
80%
100%
1982
1989
1994
1997
Othe
r
JV S
hare

Does
glo
bal
izat
ion r
educe
rat
ional
e fo
r in
tern
atio
nal
alli
ance
s an
d J
Vs?
!G
lobaliz
atio
n r
educe
s tr
ade
bar
rier
s an
d c
om
munic
ations
cost
s, m
akin
g
inte
rnat
ional alli
ance
s m
ore
att
ract
ive
!O
n t
he
oth
er h
and,
it a
lso incr
ease
s th
e re
turn
to c
oord
inat
ing o
per
atio
ns
within
multin
ational firm
s

Profita
bili
ty D
eter
min
ants
Neg
lect
ed
!D
esai finds
retu
rn o
n a
sset
s (R
OA)
is
dec
reas
ing funct
ion o
f fo
reig
n t
ax r
ates
!Contr
ols
: af
filia
te lev
erag
e, s
ale
s,
countr
y G
DP
and G
DP
per
cap
ita
!They
don�t p
erfo
rm a
ny
furt
her
an
aly
sis
of
RO
A d
eter
min
ants
Profita
bili
ty G
ap N
ot
Exp
lore
d Y
et
!D
esai et
al did
not
unco
ver
the
pro
fita
bili
ty g
ap b
etw
een w
holly
and
par
tially
ow
ned
ven
ture
s
!N
eith
er d
id o
ther
res
earc
her
s
Profita
bili
ty G
ap D
efin
ed
!Pr
ofita
bili
ty�
Net
Inco
me/
Net
Ass
ets
!W
holly
-ow
ned
�m
ajority
-ow
ned
ve
ntu
res,
90%
of th
em a
re 1
00%
ow
ned
!Jo
int
Ven
ture
s�All
affilia
tes
min
us
maj
ority
-ow
ned
Incl
udes
50-5
0 J
Vs,
whic
h a
ccount
for
about
54%
of JV
affili
ates
Prev
iew
of
dat
a
!Sourc
e: U
S B
ure
au o
f Eco
nom
ic A
naly
sis
!1977 a
nd 1
982-2
003
!N
on-b
ank
affilia
tes
of
non-b
ank
par
ents
!In
dust
ry lev
el,
25 t
hre
e-dig
it s
ecto
rs!
2 &
1 d
igit s
ecto
rs,
countr
ies,
reg
ions
!Avg
. no.
of w
holly
ow
ned
fore
ign
ventu
res
in m
anufa
cturing:
6,3
49
!N
o.
of fo
reig
n m
anufa
cturing J
Vs:
856

Profita
bili
ty G
ap,
1977-2
003
Man
ufac
turin
g
-2.0
%
0.0%
2.0%
4.0%
6.0%
8.0%
10.0
%
12.0
% 1975
1980
1985
1990
1995
2000
2005
Maj
ority
Min
ority
Gap

Ques
tions
about
RO
A G
ap
!W
her
e an
d w
hen
is
it p
osi
tive
?!
In w
hic
h s
ecto
rs,
countr
ies,
reg
ions?
!W
her
e an
d w
hen
is
it n
egat
ive?
!
Why
is it
posi
tive
/neg
ative
?!
Is it
shrinki
ng?
Gro
win
g?
Wher
e?

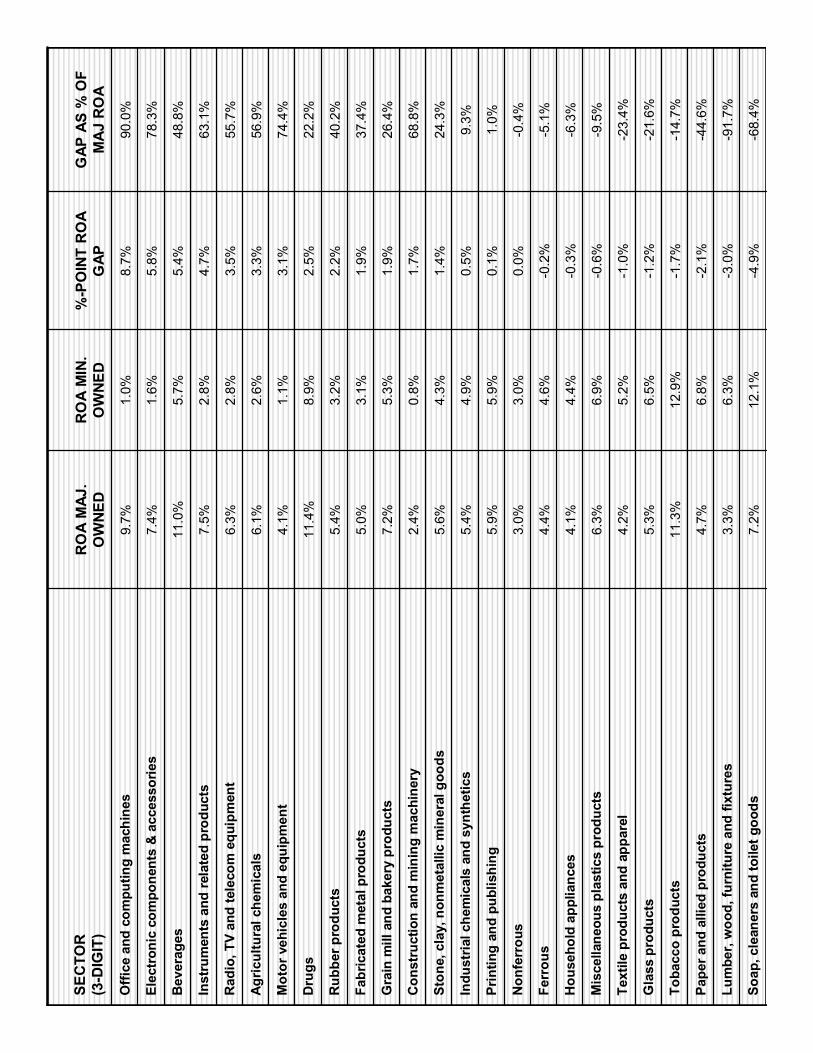
Top a
nd B
ott
om
3 S
ecto
rs b
y G
ap -4.9
Soa
p, c
lean
ers
and
toile
t goo
ds
-3.0
Lum
ber,
woo
d an
d fu
rnitu
re
-2.1
Pap
er a
nd a
llied
prod
ucts
5.4
Bev
erages
5.8
Ele
ctro
nic
com
ponen
ts e
tc
8.7
Offic
e m
ach
ines
, co
mpute
rs
RO
A G
ap
Sec
tor
(3-d
igit c
lass
ific
atio
n)
-68.
4%-4
.9%
12.1
%7.
2%So
ap, c
lean
ers
and
toile
t goo
ds
-91.
7%-3
.0%
6.3%
3.3%
Lum
ber,
woo
d, fu
rnitu
re a
nd fi
xtur
es
-44.
6%-2
.1%
6.8%
4.7%
Pape
r and
alli
ed p
rodu
cts
-14.
7%-1
.7%
12.9
%11
.3%
Toba
cco
prod
ucts
-21.
6%-1
.2%
6.5%
5.3%
Gla
ss p
rodu
cts
-23.
4%-1
.0%
5.2%
4.2%
Text
ile p
rodu
cts
and
appa
rel
-9.5
%-0
.6%
6.9%
6.3%
Mis
cella
neou
s pl
astic
s pr
oduc
ts
-6.3
%-0
.3%
4.4%
4.1%
Hou
seho
ld a
pplia
nces
-5.1
%-0
.2%
4.6%
4.4%
Ferr
ous
-0.4
%0.
0%3.
0%3.
0%N
onfe
rrou
s
1.0%
0.1%
5.9%
5.9%
Prin
ting
and
publ
ishi
ng
9.3%
0.5%
4.9%
5.4%
Indu
stria
l che
mic
als
and
synt
hetic
s
24.3
%1.
4%4.
3%5.
6%St
one,
cla
y, n
onm
etal
lic m
iner
al g
oods
68.8
%1.
7%0.
8%2.
4%C
onst
ruct
ion
and
min
ing
mac
hine
ry
26.4
%1.
9%5.
3%7.
2%G
rain
mill
and
bak
ery
prod
ucts
37.4
%1.
9%3.
1%5.
0%Fa
bric
ated
met
al p
rodu
cts
40.2
%2.
2%3.
2%5.
4%R
ubbe
r pro
duct
s
22.2
%2.
5%8.
9%11
.4%
Dru
gs
74.4
%3.
1%1.
1%4.
1%M
otor
veh
icle
s an
d eq
uipm
ent
56.9
%3.
3%2.
6%6.
1%Ag
ricul
tura
l che
mic
als
55.7
%3.
5%2.
8%6.
3%R
adio
, TV
and
tele
com
equ
ipm
ent
63.1
%4.
7%2.
8%7.
5%In
stru
men
ts a
nd re
late
d pr
oduc
ts
48.8
%5.
4%5.
7%11
.0%
Bev
erag
es
78.3
%5.
8%1.
6%7.
4%El
ectr
onic
com
pone
nts
& a
cces
sorie
s
90.0
%8.
7%1.
0%9.
7%O
ffice
and
com
putin
g m
achi
nes
GAP
AS
% O
F M
AJ
RO
A%
-PO
INT
RO
A G
APR
OA
MIN
. O
WN
ED
RO
A M
AJ.
OW
NED
SEC
TOR
(3-D
IGIT
)
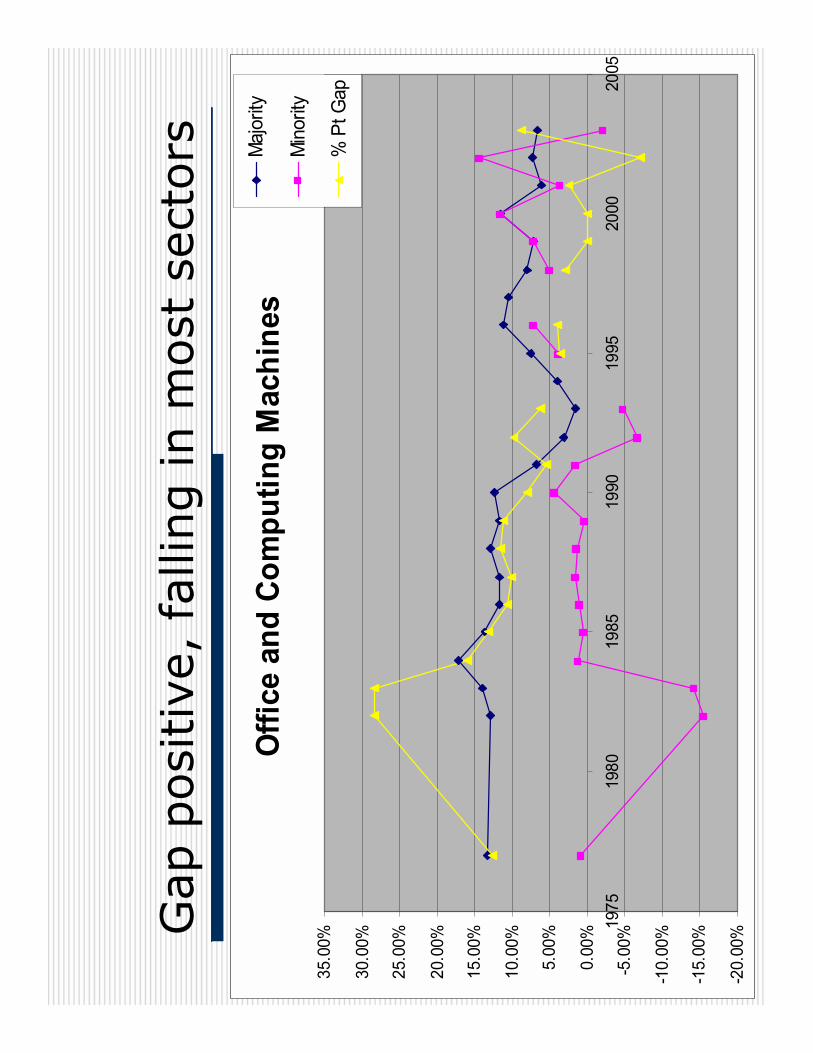
Gap
posi
tive
, fa
lling in m
ost
sec
tors
Offi
ce a
nd C
ompu
ting
Mac
hine
s
-20.
00%
-15.
00%
-10.
00%
-5.0
0%
0.00
%
5.00
%
10.0
0%
15.0
0%
20.0
0%
25.0
0%
30.0
0%
35.0
0%
1975
1980
1985
1990
1995
2000
2005
Maj
ority
Min
ority
% P
t Gap

But
in s
om
e st
ays
stab
le,
neg
ativ
e
Soap
s an
d To
iletr
ies
-25.
00%
-20.
00%
-15.
00%
-10.
00%
-5.0
0%
0.00
%
5.00
%
10.0
0%
15.0
0%
20.0
0%
25.0
0%
30.0
0%
1975
1980
1985
1990
1995
2000
2005
Maj
ority
Min
ority
% P
t Gap

Gap
clo
se t
o z
ero in s
om
e co
untr
ies
Unite
d Ki
ngdo
m
-15.
0%
-10.
0%
-5.0
%
0.0%
5.0%
10.0
%
15.0
% 1975
1980
1985
1990
1995
2000
2005
Maj
Min
Gap

Som
e re
gio
ns
are
closi
ng t
he
gap
Asia
and
Pac
ific
-5.0
%
0.0%
5.0%
10.0
%
15.0
% 1975
1980
1985
1990
1995
2000
2005
Maj
Min
Gap

Theo
retica
l Exp
lanation:
Ow
ner
ship
-spec
ific
cap
abili
ties
!O
wner
ship
-spec
ific
cap
abili
ties
of M
NE
!Ref
lect
com
pet
itiv
e ad
vanta
ge
of
MN
E
com
par
ed t
o loca
l riva
ls a
bro
ad

Det
erm
inan
ts
of ow
ner
ship
and p
rofita
bili
ty
!If
the
ow
ner
ship
-spec
ific
cap
abili
ties
ar
e st
rong,
MN
E lik
ely
to c
hoose
w
hole
ow
ner
ship
, pro
fits
hig
h
!If
they
are
wea
k, M
NE lik
ely
to s
eek
additio
nal ca
pabili
ties
fro
m loca
l firm
, pro
fits
lik
ely
to b
e lo
wer

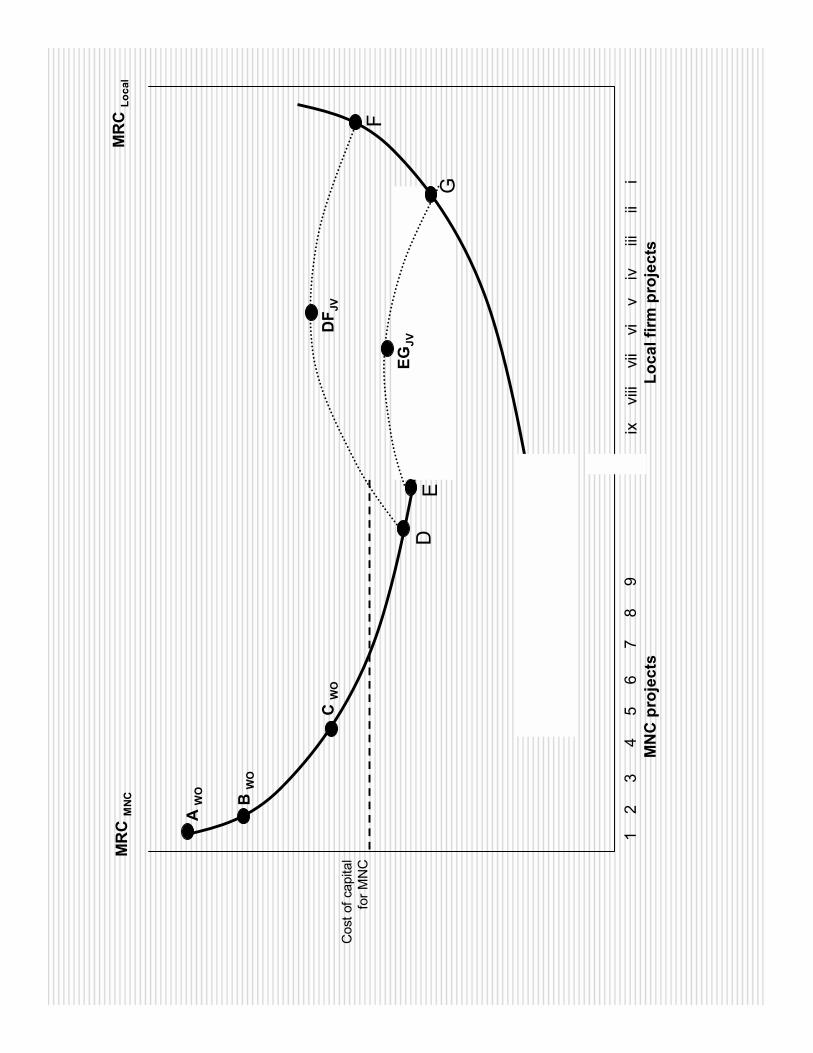
Inve
stm
ent p
roje
cts
or C
apita
l inv
este
d
Ret
urn
to th
e fir
m
Cos
t of c
apita
l
1
2
3
4
5
6
7
8
9
10
11
12
Mar
gina
l ret
urn
to c
apita
l (M
RC
)
Proj
ects
don
ePr
ojec
ts n
ot d
one

MR
C
MR
CM
NC
MR
CLo
cal
Exte
nt o
f com
petit
ive
adva
ntag
e of
MN
C
Cap
ital I
nves
ted
1
2
3
4
5
6
7
8
9
ix
v
iii
vii
vi
v
iv
i
ii
ii
i
MR
C M
NC
MR
C Lo
cal
MN
C p
roje
cts
Loca
l firm
pro
ject
s
Cos
t of c
apita
lfo
r MN
C
D
F
DF J
V
EG
EGJV
A W
O B W
O
C W
O

Mea
sure
s of
ow
ner
ship
-spec
ific
cap
abili
ties
!Should
ref
lect
inte
rnational
com
pet
itiv
e ad
vanta
ge
of
MN
E/i
ndust
ry
!Sal
es o
f U
S c
orp
ora
tions
abro
ad/
Sal
es o
f U
S c
orp
ora
tions
in t
he
US
!Sal
es o
f U
S f
irm
s ab
road/
Sal
es o
f al
l firm
s in
the
US
!Sal
es d
ata
from
BEA a
nd C
ensu
s of
US
Man
ufa
cture
rs
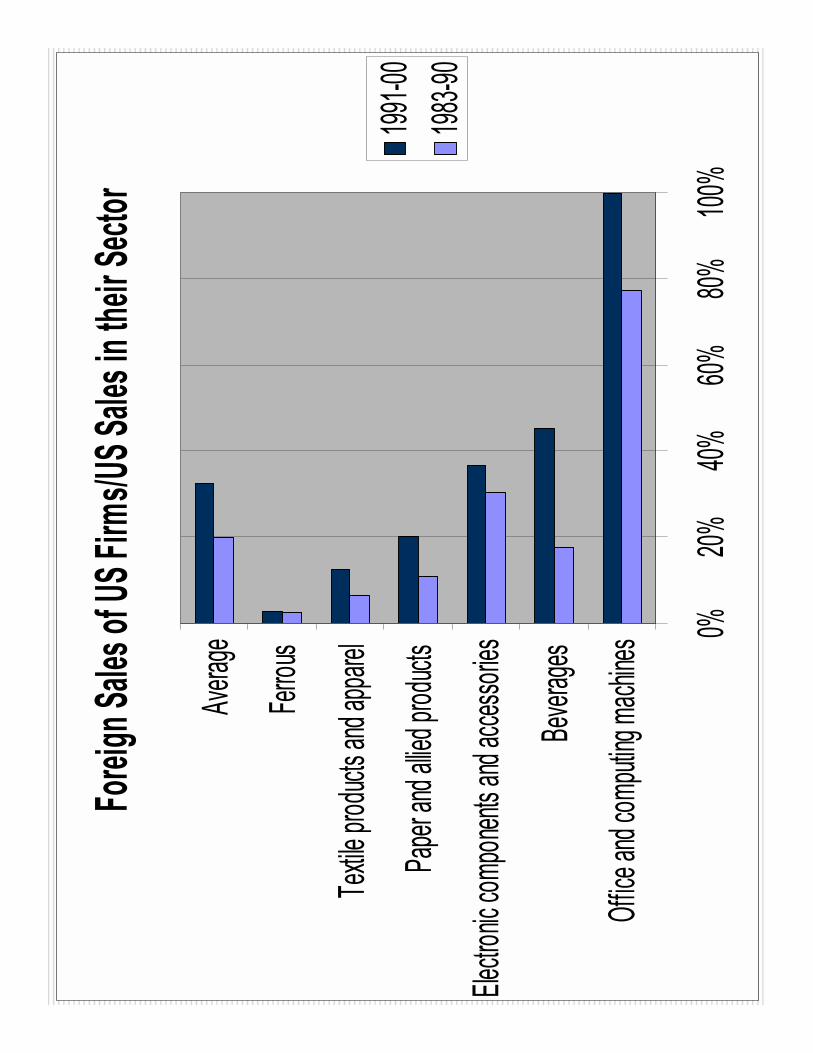
Forei
gn Sa
les of
US Fi
rms/U
S Sale
s in th
eir Se
ctor
0%20%
40%60%
80%100
%
Office
and c
omput
ing ma
chines
Bever
ages
Electro
nic co
mpone
nts an
d acce
ssories
Paper
and a
llied pro
ducts
Textile
produc
ts and
appare
l
Ferrou
s
Avera
ge
1991-0
0198
3-90
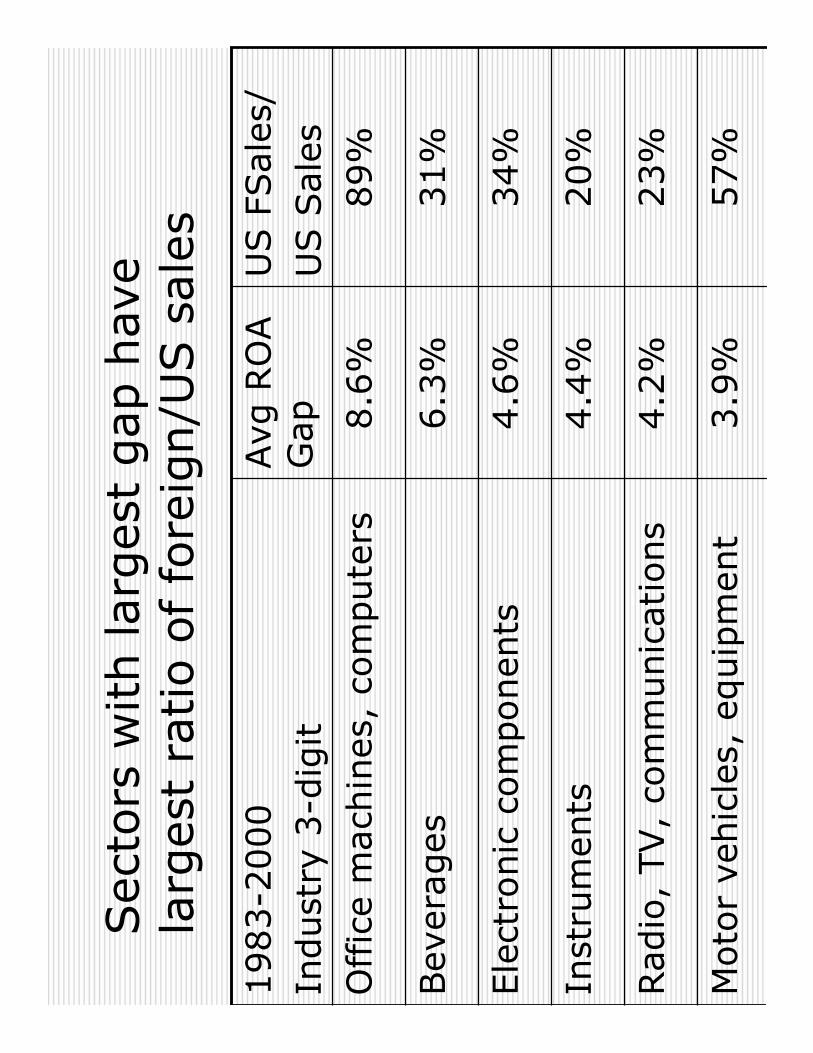
Sec
tors
with lar
ges
t gap
hav
e la
rges
t ra
tio o
f fo
reig
n/U
S s
ales
57%
3.9
%M
oto
r ve
hic
les,
equip
men
t
23%
4.2
%Rad
io,
TV,
com
munic
ations
20%
4.4
%In
stru
men
ts
34%
4.6
%Ele
ctro
nic
com
ponen
ts
31%
6.3
%Bev
erages
89%
8.6
%O
ffic
e m
ach
ines
, co
mpute
rs
US F
Sal
es/
US S
ales
Avg
RO
A
Gap
1983-2
000
Indust
ry 3
-dig
it
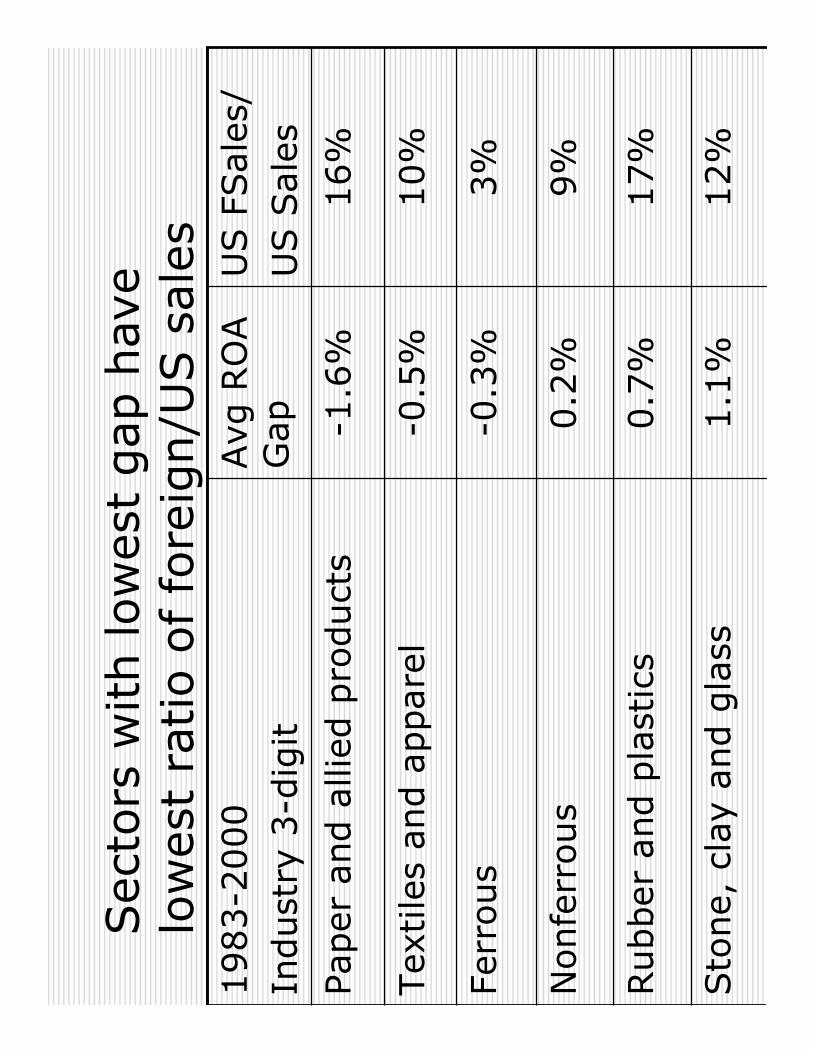
Sec
tors
with low
est
gap
hav
e lo
wes
t ra
tio o
f fo
reig
n/U
S s
ales
12%
1.1
%Sto
ne,
cla
y and g
lass
17%
0.7
%Rubber
and p
last
ics
9%
0.2
%N
onfe
rrous
3%
-0.3
%Fe
rrous
10%
-0.5
%Tex
tile
s an
d a
ppare
l
16%
-1.6
%Paper
and a
llied
pro
duct
s
US F
Sal
es/
US S
ales
Avg
RO
A
Gap
1983-2
000
Indust
ry 3
-dig
it

Corr
elat
ion b
etw
een t
he
Gap
an
d t
he
sale
s ra
tios
is 0
.30
!Sale
s of U
S f
irm
s ab
road
/Sale
s of
all
firm
s in
the
US
�Corr
elation C
oef
fici
ent=
0.3
0
!Sale
s of U
S c
orp
ora
tions
abro
ad/
Sale
s of U
S c
orp
ora
tions
in t
he
US
�Corr
elation C
oef
fici
ent=
0.3
0

Lim
itat
ions
of sa
les
ratios
as
mea
sure
s of
intl.
com
p.
adva
nta
ge
!Fo
reig
n/d
om
estic
asse
t ra
tios
would
be
per
hap
s m
ore
appro
priate
!Fo
reig
n/d
om
estic
sale
s ra
tio h
as b
een
risi
ng in a
ll se
ctors
, w
hile
the
gap
has
bee
n s
hrinki
ng in m
ost
sec
tors
Lim
itations
of
dat
a
!Sm
all num
ber
of obse
rvat
ions
for
JVs,
par
ticu
larly
for
3-d
igit s
ecto
rs
!Sm
all num
ber
of
indust
ry-l
evel
dat
a poin
ts,
no a
cces
s to
firm
lev
el d
ata

Tes
ts for
stat
sig
nific
ance
of gap
!T-t
est
for
stat
sig
nific
ance
of
gap e
stim
ates
co
nfirm
s re
sults
for
most
1 &
2 d
igit s
ecto
rs
!O
nly
min
ing,
fabri
cate
d m
etal
s in
signific
ant
!M
any
3-d
igit s
ecto
rs h
ave
< t
han 2
0 J
Vs

1-d
igit indust
ries
, 1977-2
003
3.4
%**
7,19
232
7Fi
nance
-0.1
7615
Min
ing
2.0
%**
937
76Ser
vice
s
3.4
%**
6,34
985
6M
anufa
cturing
42.4
%**
1,72
632
0Pe
trole
um
1.0
%**
23,2
011,
911
All
indust
ries
Gap
# O
ther
# J
Vs
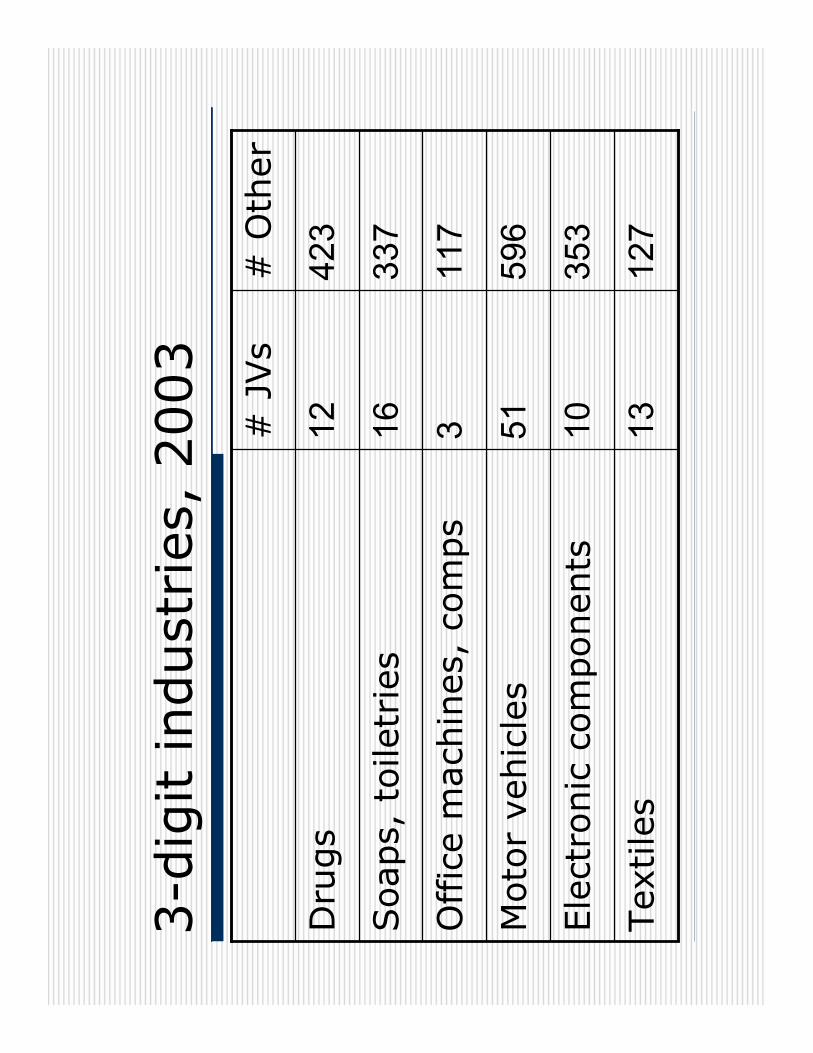
3-d
igit indust
ries
, 2003
127
13Tex
tile
s
353
10Ele
ctro
nic
com
ponen
ts
596
51M
oto
r ve
hic
les
117
3O
ffic
e m
ach
ines
, co
mps
337
16Soaps,
toile
trie
s
423
12D
rugs
# O
ther
# J
Vs
Futu
re e
conom
etric
test
s:D
epen
den
t va
riable
: RO
AExp
lanat
ory
var
iable
s:!
Sal
es r
atio
!Pa
rtia
l ow
ner
ship
(JV
) dum
my
!JV
dum
my
inte
ract
ed w
ith s
ales
ratio
!Fu
ll ow
ner
ship
(FO
) dum
my
!FO
dum
my
inte
ract
ed w
ith s
ales
rat
io!
Countr
y/in
dust
ry,
year
fix
ed e
ffec
ts!
Contr
ols
Oth
er p
oss
ible
exp
lanat
ions
for
gap
We
test
ed for:
!Siz
e!
Age
!Tax
rat
es!
Non-d
ivid
end p
aym
ents
Oth
er idea
s?!
Polic
y ch
anges

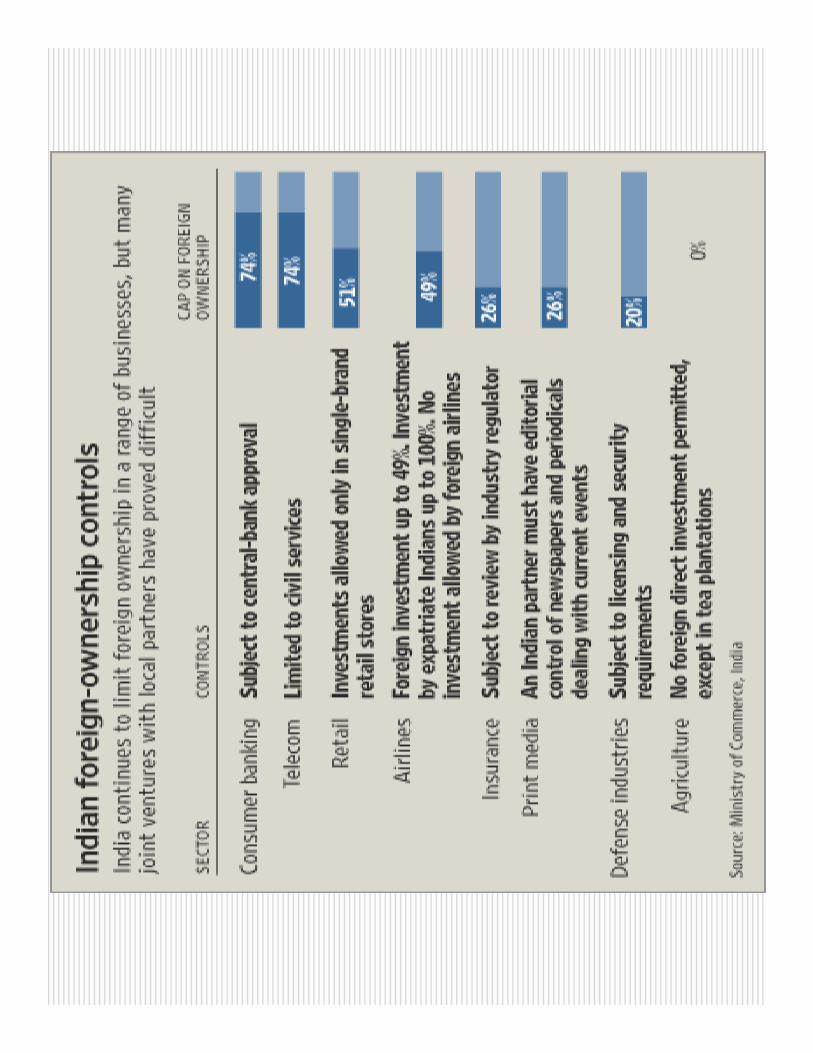
Post
script:
JVs
in I
ndia
and C
hin
a
!W
all Str
eet
Journ
alre
port
ed o
n t
he
tro
ub
les
of
inte
rnati
on
al
JVs
in I
nd
ia
!Chin
a Busi
nes
s O
nlin
ere
port
s on t
he
decl
inin
g n
um
bers
of
JVs
in C
hin
a

Cau
ses
of
falli
ng J
Vnum
ber
s in
India
!Le
ss g
ove
rnm
ent
rest
rict
ions
!D
iffe
rence
s bet
wee
n p
artn
ers
!Cla
shes
ove
r ex
pan
sion p
lans
!Com
pet
ing inte
rest
s of firm
s

Dec
linin
g u
se o
f JV
s in
Chin
aSh
are
of J
Vs o
n FD
I flo
ws
to C
hina
0.00
%
20.0
0%
40.0
0%
60.0
0%
80.0
0%
100.
00%
120.
00%
2000
2001
2002
2003
2004
Oth
er
JVs


![untitled 2 [people.brandeis.edu]people.brandeis.edu/~sekuler/papers/SekulerNature1997.pdf · Presentation ofsound Figure I Percentage of reports of stimulus bouncing. In each trial,](https://static.documents.pub/doc/80x56/5f4e7aa9b6f9633f2c3bd2e4/untitled-2-sekulerpaperssekulernature1997pdf-presentation-ofsound-figure.jpg)