1 Progetto S2 – Valutazione del potenziale sismogenetico e probabilità dei forti terremoti in Italia Task1, Organizzazione di un sistema di riferimento unitario per la descrizione della sismogenesi. UR 1.1 - Coordinatore: Roberto Basili (INGV-RM1) 1 - Summary The main objectives of this Research Unit (RU) were to (1) update and improve the Database of Individual Seismogenic Sources (DISS), version 3, and (2) supply insights and support to other RUs in using it. As for (1) the efforts of this RU were dedicated on both Information Technology (IT) and scientific developments. Although our activities needed to be re-scheduled more than once to satisfy requests from other parts of the project, all main goals of this RU have been satisfactorily accomplished and the planned deliverables will be supplied in due time. We also planned an additional issue of DISS which will incorporate the latest results of the project. The main difficulty encountered in the development of our tasks was the shortage in human resources with top-level Information Technology expertise. The following sections will illustrate results and achievements of this RU. 2 - Results 2.1 – IT developments of DISS The architecture of DISS provides three different modes of access: (1) a specifically designed cartographic (ArcIMS) and alphanumeric web interface that only requires a web browser and a fast (640 kbps or faster) Internet connection (Fig. 1a); (2) a web interface based on the Google Earth application (Fig. 1b), that requires a browser, a fast Internet connection and the Google Earth software (available free for Mac, PC and Linux computers at http://earth.google.com/download-earth.html); (3) standalone mode, which uses a custom application based on MapBasic. This access mode requires MapInfo 6.5 or higher and is available only for PC computers. It is intended for database developers and for selected users that wish to contribute their own data and interpretations to the database. It allows users to access several information levels not available on the web versions of the database, including georeferenced cartography in raster format, stress data, and several types of geophysical data. This version, including the dedicated software, is available upon request to sophisticated users and potential collaborators. The main difference between the system available to developer-users (access mode (3) on desktop PC) and those available to all other remote users (i.e. those who use DISS 3 by access modes (1) and (2) through the Internet) is the number and functionality of supported tools. Built-in GIS tools on remote platforms are not, and will likely not be for long, as efficient as those on desktop computers. Thus, as of today, advanced spatial analyses and statistical computations can not be performed directly within the Internet user interfaces. To facilitate users we then distribute in seamless mode the main data tables in several GIS proprietary formats, such as MapInfo (mif/mid), ESRI ArcInfo Export (E00), ESRI Shape (shp), AutoCAD (DXF), and Google Earth (kml). All the information on accessing DISS 3 is available at the Internet site http://www.ingv.it/DISS. Figure 2 illustrates the web server/client architecture of the DISS system. As inferred from the statistics of our web site, users who routinely visit DISS belong to various categories. They come not only from Italian and non-Italian research institutions and universities, but also from several regional administrations and private consulting companies. Figure 3 and Table 1 show some access statistics between June 16, 2006 and June 15, 2007. When DISS 3.0.1 was available the average daily access was of ~8.3 visits and ~19.5 pageviews. With the version 3.0.2 these numbers have raised to ~18.1 visits and ~43.0 pageviews. Notice that the web page that put users through the DISS 3.0.2 seamlessly downloadable data tables was visited 368 times in about nine months.
Transcript
1
Progetto S2 – Valutazione del potenziale sismogenetico e probabilità dei forti terremoti in Italia
Task1, Organizzazione di un sistema di riferimento unitario per la descrizione
della sismogenesi.
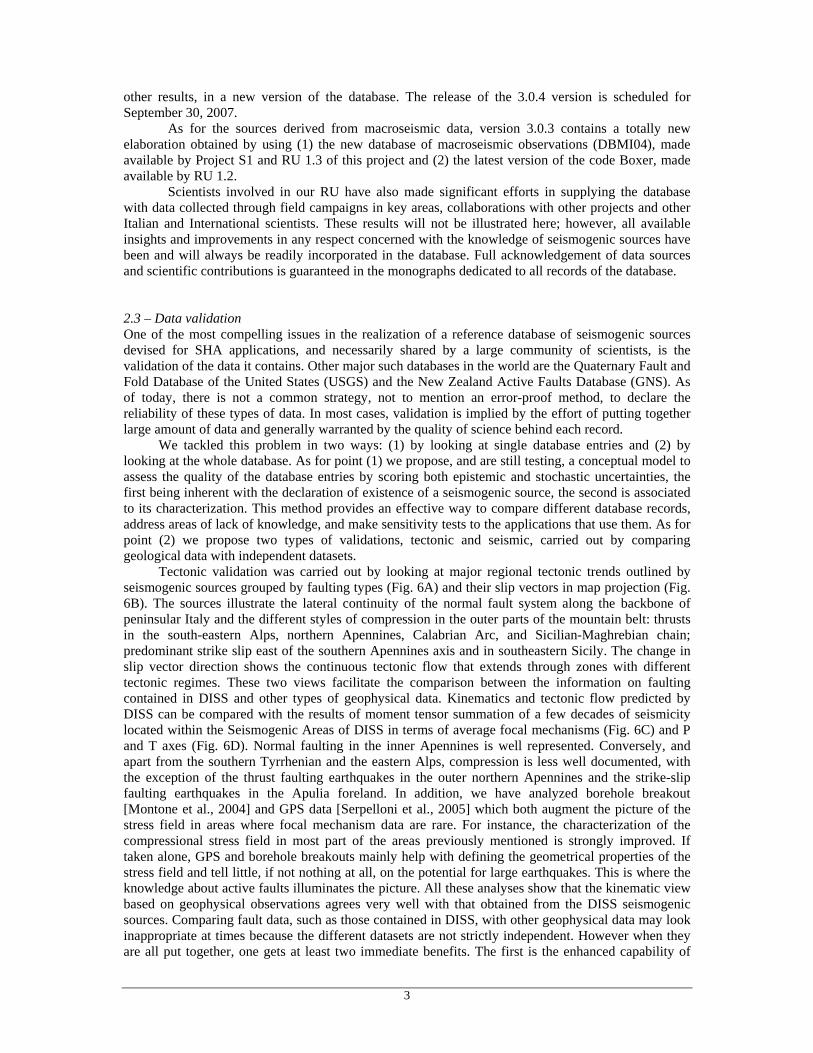
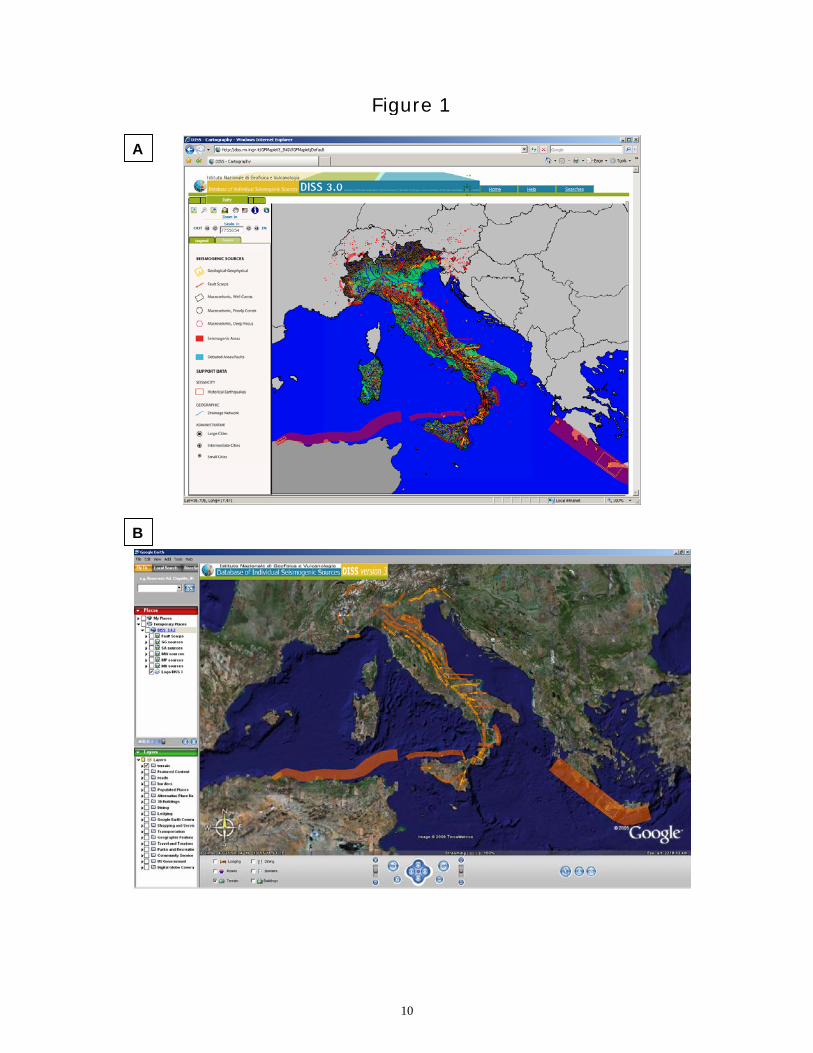
UR 1.1 - Coordinatore: Roberto Basili (INGV-RM1) 1 - Summary The main objectives of this Research Unit (RU) were to (1) update and improve the Database of Individual Seismogenic Sources (DISS), version 3, and (2) supply insights and support to other RUs in using it. As for (1) the efforts of this RU were dedicated on both Information Technology (IT) and scientific developments. Although our activities needed to be re-scheduled more than once to satisfy requests from other parts of the project, all main goals of this RU have been satisfactorily accomplished and the planned deliverables will be supplied in due time. We also planned an additional issue of DISS which will incorporate the latest results of the project. The main difficulty encountered in the development of our tasks was the shortage in human resources with top-level Information Technology expertise. The following sections will illustrate results and achievements of this RU. 2 - Results 2.1 – IT developments of DISS The architecture of DISS provides three different modes of access: (1) a specifically designed cartographic (ArcIMS) and alphanumeric web interface that only requires a web browser and a fast (640 kbps or faster) Internet connection (Fig. 1a); (2) a web interface based on the Google Earth application (Fig. 1b), that requires a browser, a fast Internet connection and the Google Earth software (available free for Mac, PC and Linux computers at http://earth.google.com/download-earth.html); (3) standalone mode, which uses a custom application based on MapBasic. This access mode requires MapInfo 6.5 or higher and is available only for PC computers. It is intended for database developers and for selected users that wish to contribute their own data and interpretations to the database. It allows users to access several information levels not available on the web versions of the database, including georeferenced cartography in raster format, stress data, and several types of geophysical data. This version, including the dedicated software, is available upon request to sophisticated users and potential collaborators. The main difference between the system available to developer-users (access mode (3) on desktop PC) and those available to all other remote users (i.e. those who use DISS 3 by access modes (1) and (2) through the Internet) is the number and functionality of supported tools. Built-in GIS tools on remote platforms are not, and will likely not be for long, as efficient as those on desktop computers. Thus, as of today, advanced spatial analyses and statistical computations can not be performed directly within the Internet user interfaces. To facilitate users we then distribute in seamless mode the main data tables in several GIS proprietary formats, such as MapInfo (mif/mid), ESRI ArcInfo Export (E00), ESRI Shape (shp), AutoCAD (DXF), and Google Earth (kml). All the information on accessing DISS 3 is available at the Internet site http://www.ingv.it/DISS. Figure 2 illustrates the web server/client architecture of the DISS system. As inferred from the statistics of our web site, users who routinely visit DISS belong to various categories. They come not only from Italian and non-Italian research institutions and universities, but also from several regional administrations and private consulting companies. Figure 3 and Table 1 show some access statistics between June 16, 2006 and June 15, 2007. When DISS 3.0.1 was available the average daily access was of ~8.3 visits and ~19.5 pageviews. With the version 3.0.2 these numbers have raised to ~18.1 visits and ~43.0 pageviews. Notice that the web page that put users through the DISS 3.0.2 seamlessly downloadable data tables was visited 368 times in about nine months.
2
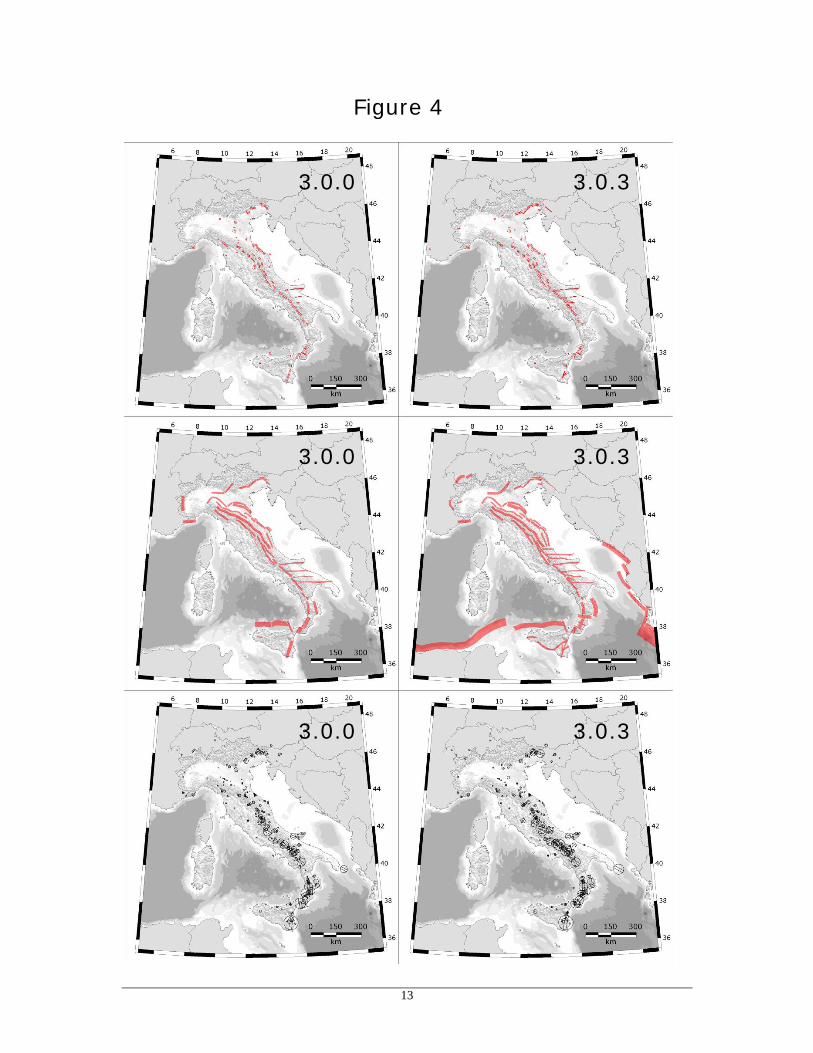
The DISS web site was accessed by users from 67 foreign countries, via 150 different network locations. Returning visitors were almost 50 percent, and a significant part of them visited the web pages more than 10 times each. This implies that the use of DISS extends well beyond the community of sibling researchers and that we may expect to meet an ever increasing demand. 2.2 – DISS scientific developments and content DISS’ main object is the Seismogenic Source. In Version 3 we distinguish three main categories of Seismogenic Sources based on their attributes, their expected use, the nature and reliability of data used to define them [Basili et al., 2007]: (1) “Individual Seismogenic Sources” are defined by geological and geophysical data and are characterized by a full set of geometric (strike, dip, length, width and depth), kinematic (rake), and seismological parameters (single event displacement, magnitude, slip rate, recurrence interval). Each parameter is then rated for accuracy. Individual Seismogenic Sources are assumed to exhibit strictly-periodic recurrence with respect to rupture length/width, slip per event, and expected magnitude. They are compared to worldwide databases for internal consistency in terms of length, width, single event displacement and magnitude, and can be augmented by fault scarp data when available. This category is intended to supply the most accurate information available for the best identified sources, but it can not guarantee the completeness of the sources themselves. As such, Individual Seismogenic Sources can be used for calculating earthquake and tsunami scenarios and for tectonic and geodynamic investigations, but are not meant to comprise a complete input dataset for probabilistic assessment of seismic hazard. (2) “Seismogenic Areas” also are based on geological and geophysical data and characterized by geometric (strike, dip, width, depth) and kinematic (rake) parameters. The length of “characteristic” rupture, however, is poorly defined or unknown, thus the source spans an unspecified number of Individual Sources. They are not assumed to be capable of a specific size earthquake but their seismic potential can be estimated from existing earthquake catalogues. A Seismogenic Area is essentially an inferred structure based on regional surface and subsurface geological data that are exploited well beyond the simple identification of active faults or youthful tectonic features. As opposed to the previous case, this category of sources was conceived to achieve completeness of the record of potential earthquake sources, although this may imply a smaller accuracy of source description. In conjunction with seismicity and modern strain data, Seismogenic Areas can thus contribute to the development of regional probabilistic seismic hazard assessment and for investigating large-scale geodynamic processes. (3) “Macroseismic Sources” are based on automatic processing of macroseismic data of earthquakes with M 5.5 and larger using the algorithm developed by Gasperini et al. [1999]. They are subdivided into three categories (Macroseismic-Well Constrained; Macroseismic-Poorly Constrained; Macroseismic-Deep) depending on the quality of the macroseismic dataset and on the parameters supplied for each of them. The main purpose for including macroseismic sources is to better define the previous two categories of sources and to constrain the seismogenic properties and potential of poorly known areas. Table 2 and Figure 4 illustrate the main improvements of DISS throughout the Project. All versions between 3.0.0 and 3.0.3 have always been made available to project partners and the public in the forms described in section 2.2. As for the sources derived from geological/geophysical data, we took particular care in realizing and distributing version 3.0.2 because this is the version used in all other parts of the project. Apparently, the Seismogenic Areas is the category that has been mostly augmented and that incurred in several major changes. This is because this category was first introduced at the beginning of the project. However, thanks to the collaborative effort among many components of the project and its partners we have significantly improved this dataset that turned to be a major input data source for many innovative analyses (see Section 3). Version 3.0.3 contains only limited changes with respect to its immediate predecessor and, obviously, cannot include the final results of Task 2. Figure 5 shows some of the areas that have already been analyzed by our RU but not included in version 3.0.3. In the forthcoming months we will analyze and validate the results obtained by the RUs of Task 2 and incorporate them, together with our
3
other results, in a new version of the database. The release of the 3.0.4 version is scheduled for September 30, 2007. As for the sources derived from macroseismic data, version 3.0.3 contains a totally new elaboration obtained by using (1) the new database of macroseismic observations (DBMI04), made available by Project S1 and RU 1.3 of this project and (2) the latest version of the code Boxer, made available by RU 1.2. Scientists involved in our RU have also made significant efforts in supplying the database with data collected through field campaigns in key areas, collaborations with other projects and other Italian and International scientists. These results will not be illustrated here; however, all available insights and improvements in any respect concerned with the knowledge of seismogenic sources have been and will always be readily incorporated in the database. Full acknowledgement of data sources and scientific contributions is guaranteed in the monographs dedicated to all records of the database. 2.3 – Data validation One of the most compelling issues in the realization of a reference database of seismogenic sources devised for SHA applications, and necessarily shared by a large community of scientists, is the validation of the data it contains. Other major such databases in the world are the Quaternary Fault and Fold Database of the United States (USGS) and the New Zealand Active Faults Database (GNS). As of today, there is not a common strategy, not to mention an error-proof method, to declare the reliability of these types of data. In most cases, validation is implied by the effort of putting together large amount of data and generally warranted by the quality of science behind each record. We tackled this problem in two ways: (1) by looking at single database entries and (2) by looking at the whole database. As for point (1) we propose, and are still testing, a conceptual model to assess the quality of the database entries by scoring both epistemic and stochastic uncertainties, the first being inherent with the declaration of existence of a seismogenic source, the second is associated to its characterization. This method provides an effective way to compare different database records, address areas of lack of knowledge, and make sensitivity tests to the applications that use them. As for point (2) we propose two types of validations, tectonic and seismic, carried out by comparing geological data with independent datasets. Tectonic validation was carried out by looking at major regional tectonic trends outlined by seismogenic sources grouped by faulting types (Fig. 6A) and their slip vectors in map projection (Fig. 6B). The sources illustrate the lateral continuity of the normal fault system along the backbone of peninsular Italy and the different styles of compression in the outer parts of the mountain belt: thrusts in the south-eastern Alps, northern Apennines, Calabrian Arc, and Sicilian-Maghrebian chain; predominant strike slip east of the southern Apennines axis and in southeastern Sicily. The change in slip vector direction shows the continuous tectonic flow that extends through zones with different tectonic regimes. These two views facilitate the comparison between the information on faulting contained in DISS and other types of geophysical data. Kinematics and tectonic flow predicted by DISS can be compared with the results of moment tensor summation of a few decades of seismicity located within the Seismogenic Areas of DISS in terms of average focal mechanisms (Fig. 6C) and P and T axes (Fig. 6D). Normal faulting in the inner Apennines is well represented. Conversely, and apart from the southern Tyrrhenian and the eastern Alps, compression is less well documented, with the exception of the thrust faulting earthquakes in the outer northern Apennines and the strike-slip faulting earthquakes in the Apulia foreland. In addition, we have analyzed borehole breakout [Montone et al., 2004] and GPS data [Serpelloni et al., 2005] which both augment the picture of the stress field in areas where focal mechanism data are rare. For instance, the characterization of the compressional stress field in most part of the areas previously mentioned is strongly improved. If taken alone, GPS and borehole breakouts mainly help with defining the geometrical properties of the stress field and tell little, if not nothing at all, on the potential for large earthquakes. This is where the knowledge about active faults illuminates the picture. All these analyses show that the kinematic view based on geophysical observations agrees very well with that obtained from the DISS seismogenic sources. Comparing fault data, such as those contained in DISS, with other geophysical data may look inappropriate at times because the different datasets are not strictly independent. However when they are all put together, one gets at least two immediate benefits. The first is the enhanced capability of
4
exploring the information from geographically scattered point data (focal mechanisms, borehole breakouts, GPS measurements) over the spatial domain. The second is the longer time window that can be analyzed; few years to few decades for geophysical data compared to thousands of years for geologic data on active faults. Seismic validation was carried out by assessing the database completeness. Completeness, in turn is given by balancing the seismic moment rate produced by the seismogenic sources with that produced by historical earthquakes. To do so we first subdivided the Italian territory into eight regions. Each region being dominated by a well characterized geodynamic process, containing the least possible number of faulting types, and a significant number of historical earthquakes. Figure 7 shows that in six regions (#1, #2, #3, #4, #5, #8) the earthquake moment rate production (MRP) falls within the range of geological MRP predicted by the Seismogenic Areas and in only two regions (#6, #7) the earthquake MRP is higher than the geological MRP. Assuming that earthquake MRP is stationary over time in the eight regions, this picture tells us that in some regions we may have either failed to map all possible geological sources or have underestimated the geological slip rates. However, at the scale of the entire country the completeness level of the database is well addressed. This is a very encouraging result that gives strength to all applications that uses this dataset. It also confirms the good choice of introducing the category of Seismogenic Areas into DISS. 3 – Outline of collaborations with other project partners This section will briefly illustrate the main activities carried out in close collaborations with other partners of the project. The scientific outcomes of these collaborations are to be found in the pertinent reports of those partners.
• Project S2 o RU2.4 Burrato. Collaboration with this RU was held throughout the project. Most of
the improvements of DISS in key areas come from this RU. Specific work was done in northeastern Italy and western Slovenia [Burrato et al., 2007] and the southern Apennines.
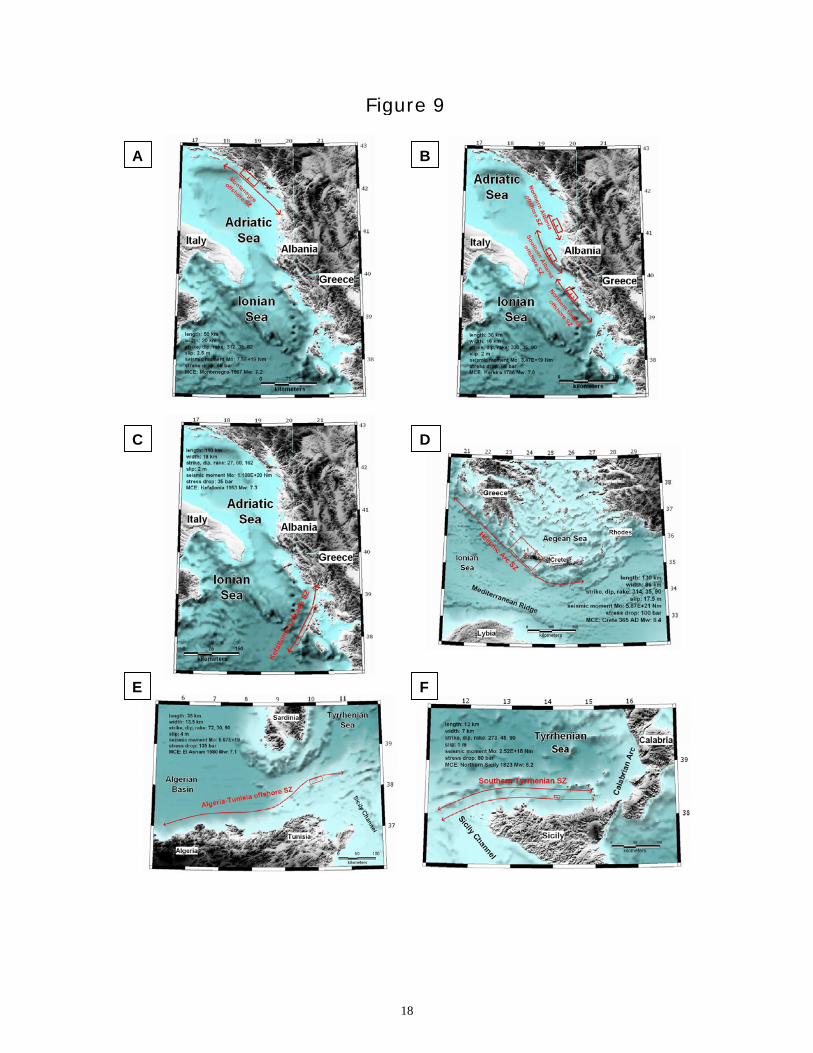
o RU2.19b Piatanesi. Collaboration with this RU was held throughout the project. Figure 8 shows the areas scrutinized during the project. Figure 9 shows the six areas were we carried out in-depth analysis and supplied fully parameterized seismogenic sources (Tab. 3) for the calculations of tsunami scenarios. More details on the scientific activity can be found in Lorito et al. [2007].
o RU3.1 Barba. Collaboration with this RU was held throughout the project. Our RU supplied updated and in-depth information about seismogenic sources and major active tectonic structures, not strictly identified as seismogenic sources, to be incorporated in the numerical modeling for determining strain rates and slip rates of faults. Figure 10 shows a comparison of slip rates geologically determined and numerically calculated. Notice how numerical modeling helps filling the knowledge gaps between pairs of geological data that are necessarily scattered.
o RU4.1 Akinci; RU4.4 Garavaglia; RU4.8 Peruzza; RU4.9 Rotondi. Collaboration with these RUs was mainly aimed at providing insights into the parameterization of seismogenic sources and the evaluation of the associated uncertainties. Our RU also supplied RU4.4 and RU4.9 with specifically designed elaborations, including lists of earthquakes associated to Seismogenic Areas and the regional subdivision of the Italian territory in terms of tectonic processes (see Fig. 7). This activity strongly contributed to develop one of the most innovative ways of calculating earthquake probabilities by using Seismogenic Areas instead of the most widely adopted Individual Sources.
• Project S3 (Coordinated by M. Mucciarelli and F. Pacor). o Collaboration with this project mostly concerned the in-depth analysis and critical
review of a number of Individual Seismogenic Sources and Seismogenic Areas to be used as input data for calculating seismic shaking and intensity based scenarios.
5
References (papers made during the project in italics) Basili, R., G. Valensise, P. Vannoli, P. Burrato, U. Fracassi, S. Mariano, M.M. Tiberti, E. Boschi (2007). The Database of Individual Seismogenic Sources (DISS), version 3: summarizing 20 years of research on Italy’s earthquake geology. Tectonophysics, (submitted 10/10/2006; revision 16/04/2007). Burrato, P., M.E. Poli, P. Vannoli, A. Zanferrari, R. Basili, F. Galadini (2007). Sources of Mw 5+ earthquakes in northeastern Italy and western Slovenia: an updated view based on geological and seismological evidence. Tectonophysics, (submitted 16/10/2006; revision 13/06/2007). Gasperini, P., F. Bernardini, G. Valensise, E. Boschi (1999). Defining seismogenic sources from historical earthquake felt reports. Bull. Seism. Soc. Am., 89, 94-110. Gasperini, P., G. Vannucci (2003). FPSPACK: a package of FORTRAN subroutines to manage earthquake focal mechanism data. Computers & Geosciences, 29, 893–901. Lorito, S., M.M. Tiberti, R. Basili, A. Piatanesi, G. Valensise (2007). Earthquake-generated tsunamis in the Mediterranean Sea: scenarios of potential threats to Southern Italy. J. Geophys. Res., (submitted 22/01/2007). Montone, P., M.T. Mariucci, S. Pondrelli, A. Amato (2004). An improved stress map for Italy and surrounding regions (Central Mediterranean). J. Geophys. Res., 109, B10410, doi:10.1029/2003JB002703. Serpelloni, E., M. Anzidei, P. Baldi, G. Casula, A. Galvani (2005). Crustal velocity and strain-rate fields in Italy and surrounding regions: new results from the analysis of permanent and non-permanent GPS networks. Geophys. J. Int., 161, 861-880. Vannucci, G., P. Gasperini (2003). A database of revised fault plane solutions for Italy and surrounding regions. Computers & Geosciences, 29, 903–909.
6
Figure Captions. Figure 1 – DISS 3 user interfaces. (A) Web interface provides navigation tools to users through a web application based on ArcIMS GIS engine; (B) Google Earth interface provides interactive navigation through the free Google Earth software. Figure 2 – DISS system server-client scheme illustrating the location of the server within the WAN and LAN systems, the hardware and software platforms, and the data distribution modes. Figure 3 – Statistics of access to the DISS web site http://www.ingv.it/DISS/ over a one-year period (June 16, 2006 – Jun 15, 2007). The top panel shows that visits picked right after the announcement that DISS 3.0.2 was released. Successive picks followed the Erice Meeting of October 18-24, 2006. Average pageviews of DISS 3.0.2 are significantly higher than those of the previous version. Weekly cycles are also evident. The Map Overlay shows that USA is the top visiting foreign country. Detail of Italian cities shows high points in Rome, Milan, and Naples (see Table 1 for details). Figure 4 – Maps showing the increment of data incorporated into DISS during the project. Version 3.0.0 was the one available at the beginning of the project. Version 3.0.3 will appear in the main deliverable of this RU. From top to Bottom: Individual Seismogenic Sources based on geological/geophysical data; Seismogenic Areas based on geological/geophysical data; Macroseismic Sources (this layer was developed in collaboration with RU1.2 and RU1.3). Figura 5 – Map showing areas (in blue) where the RU carried out original investigations during the project with DISS 3.0.3 in the background. A: Slovenian area; B: Montello-Conegliano thrust; C: Mirandola anticline; D: Mid-Adriatic Outer Front; E: Gubbio-Gualdo Tadino area; F: Mattinata-Gondola shear zone; G: Ufita River Valley-Vulture area; H: Crati River Valley; I: Southern Calabria Ionian Front; J: Terreforti anticlines; L: Hyblean area. These analyses will contribute in enriching DISS 3.0.4 (to be released by September 30, 2007). Figure 6 – (A) Individual Seismogenic Sources and Seismogenic Areas shown by color-coded faulting mechanisms. Blue: reverse or thrust; red: normal; dark green: right-lateral strike slip; light green: left-lateral strike slip. (B) Slip vectors with their angular variability from Individual Seismogenic Sources and Seismogenic Areas projected on the horizontal plane. (C) Average focal mechanisms and (D) P and T axes from moment tensor summation of earthquakes within the Seismogenic Areas of DISS (original elaboration by RU1.2 using the EMMA database by Gasperini and Vannucci [2003] and Vannucci and Gasperini [2003]). Figure 7 – Map showing the comparison between earthquake and geological moment rate productions in eight tectonically coherent regions. Figure 8 – Sketch map of main tsunamigenic sources in the Mediterranean area. In Red the zones studied during this project; in blue other potential source zones. Seismicity and main tectonic features are shown in the background. Figure 9 – Maps of the tsunamigenic earthquake sources studied during the project: (A) Montenegro; (B) Albania – Greece; (C) Kefallonia-Lefkada; (D) Hellenic Arc; (E) Algeria-Tunisia; (F) Southern Tyrrhenian. See fault parameters in Table 3. Figure 10 – (A) Slip rates of Individual Sources in DISS 3.0.3 from paleoseismological studies (red) and long-tern tectonic studies (blue). (B) Slip rates of Seismogenic Areas calculated through numerical modeling by RU 3.4 (preliminary results as of May 2007, see RU3.4 report for final results).
7
Table 1 – Statistics of access to the DISS web sites, http://www.ingv.it/DISS, between 16 June, 2006, and 15 June, 2007. World: countries Country Visits Pages/Visit United States 127 2.09 France 69 1.99 United Kingdom 62 1.39 Germany 32 2.00 Poland 27 1.22 Spain 24 2.79 Switzerland 22 1.64 Greece 21 2.71 Sweden 21 1.43 Portugal 18 1.33 Country Detail: Italian cities City Visits Pages/Visit (not set) 981 2.34 Rome 692 2.04 Milan 615 2.13 Naples 238 2.41 Messina 135 1.65 Bologna 106 2.66 Catania 95 1.87 Augusta 95 1.93 Bari 84 2.14 Florence 73 2.22 Content Detail: …/Version302.html* Country Visits Pages/Visit Italy 368 5.82 France 11 3.18 United States 7 7.71 Germany 5 5.60 Greece 5 6.00 * Started September 7, 2006.
8
Table 2 – Major improvements of DISS during the project with respect to seismogenic sources based on geological/geophysical data.
DISS 3.0.0 DISS 3.0.3
Date Released Jan 2005 Jun 2007
Significant improvements
• Seismogenic Areas introduced• Web version implemented • 11 non-Italian sources added
1 Number of independent references attached to the seismogenic sources. 2 Number of independent images (original of from published literature) documenting the seismogenic sources. 3 Number of equivalent pages of original texts documenting the seismogenic sources. 4 Previous fault compilations: georeferenced fault maps from previous papers/investigators. 5 Additional data: georeferenced sets of geophysical, geological data from various investigators.
9
Table 3 – Parameters of the typical faults used in each source zone for the tsunami scenarios.
L (km)
W (km)
D (km)
Slip (m)
Strike (deg)
Dip (deg)
Rake (deg)
MCE (Mw)
Algeria-Tunisia 35 13.5 1 4 72 30 90 7.1
Southern Tyrrhenian 12 7 3 1 273 45 90 6.2
Hellenic Arc 130 86 5 17.5 314 35 90 8.4
Montenegro 50 20 1 2.5 312 35 82 7.2
Albania - Greece 36 16 1 2.0 330 35 90 7.0
Kefallonia-Lefkada 110 18 3 2.0 27 60 162 7.3
10
A
B
Figure 1
11
CLIENT type: developer/compiler Access type: HTTP, SSH, SCP, Remote Desktop Activity 1: database update and maintenance GIS engine: MapInfo Professional Software: DISS3.mbx, FaultStudio.mbx, CadmoDriver Activity 2: software maintenance LAN/VPN transactions: 10 MB per day incoming/outgoing
CLIENT type: end user Access type: HTTP Activity: textual and cartographic navigation GIS engine: ESRI ArcIMS Software: CadmoDriver, MySQL WAN transactions: 1 MB per day incoming 100 MB per day outgoing
CLIENT type: end user Access type: HTTP Activity: navigation through descriptive database documentation; seamless distribution of main data tables in various formats WAN transactions: 12+ visits per day ~30 pageviews per day