Page 1
HAL Id: hal-02557976https://hal.univ-lorraine.fr/hal-02557976
Submitted on 29 Apr 2020
HAL is a multi-disciplinary open accessarchive for the deposit and dissemination of sci-entific research documents, whether they are pub-lished or not. The documents may come fromteaching and research institutions in France orabroad, or from public or private research centers.
L’archive ouverte pluridisciplinaire HAL, estdestinée au dépôt et à la diffusion de documentsscientifiques de niveau recherche, publiés ou non,émanant des établissements d’enseignement et derecherche français ou étrangers, des laboratoirespublics ou privés.
Prognostic impact of plasma volume estimated fromhemoglobin and hematocrit in heart failure with
preserved ejection fractionMasatake Kobayashi, Nicolas Girerd, Kévin Duarte, Gregoire Preud’Homme,
Bertram Pitt, Patrick Rossignol
To cite this version:Masatake Kobayashi, Nicolas Girerd, Kévin Duarte, Gregoire Preud’Homme, Bertram Pitt, et al..Prognostic impact of plasma volume estimated from hemoglobin and hematocrit in heart failure withpreserved ejection fraction. Clinical Research in Cardiology, Springer Verlag, 2020, 109 (11), pp.1392-1401. �10.1007/s00392-020-01639-4�. �hal-02557976�
Page 2
1
Prognostic Impact of Plasma Volume Estimated from Hemoglobin and Hematocrit in
Heart Failure with Preserved Ejection Fraction
Masatake Kobayashi 1*
, Nicolas Girerd 1*
, Kevin Duarte 1, Gregoire Preud'homme
1,
Bertram Pitt 2, Patrick Rossignol
1
*Equally contributed
1. Université de Lorraine, INSERM, Centre d'Investigations Cliniques 1433, CHRU de Nancy,
Inserm 1116 and INI-CRCT (Cardiovascular and Renal Clinical Trialists) F-CRIN Network,
Nancy, France.
2. Department of Medicine, University of Michigan School of Medicine, Ann Arbor, Michigan,
USA.
Corresponding Author:
Pr. Patrick Rossignol
Centre d'Investigation Clinique Pierre Drouin -INSERM - CHRU de Nancy, Institut lorrain du cœur et
des, vaisseaux Louis Mathieu, Nancy, France
Address : 4, rue du Morvan. 54500 Vandoeuvre-Les-Nancy
E-mail: [email protected]
Short title: Estimated plasma volume status in HFpEF patients
Keywords: Plasma volume, hemoglobin, hematocrit, congestion, heart failure with preserved ejection
fraction
Total number of tables and figures: tables 3 figures 2
Page 3
2
Abstract
Background
Plasma volume (PV) estimated from Duarte's formula (based on hemoglobin/hematocrit) has been
associated with poor prognosis in patients with heart failure (HF). There are, however, limited data
regarding the association of estimated PV status (ePVS) derived from hemoglobin/hematocrit with
clinical profiles and study outcomes in patients with HF and preserved ejection fraction (HFpEF).
Methods and results
Patients from North and South America enrolled in the Treatment of Preserved Cardiac Function Heart
Failure with an Aldosterone Antagonist trial (TOPCAT) with available hemoglobin/hematocrit data
were studied. The association between ePVS (Duarte formula and Hakim formula) and the composite
of cardiovascular mortality, HF hospitalization or aborted cardiac arrest was assessed.
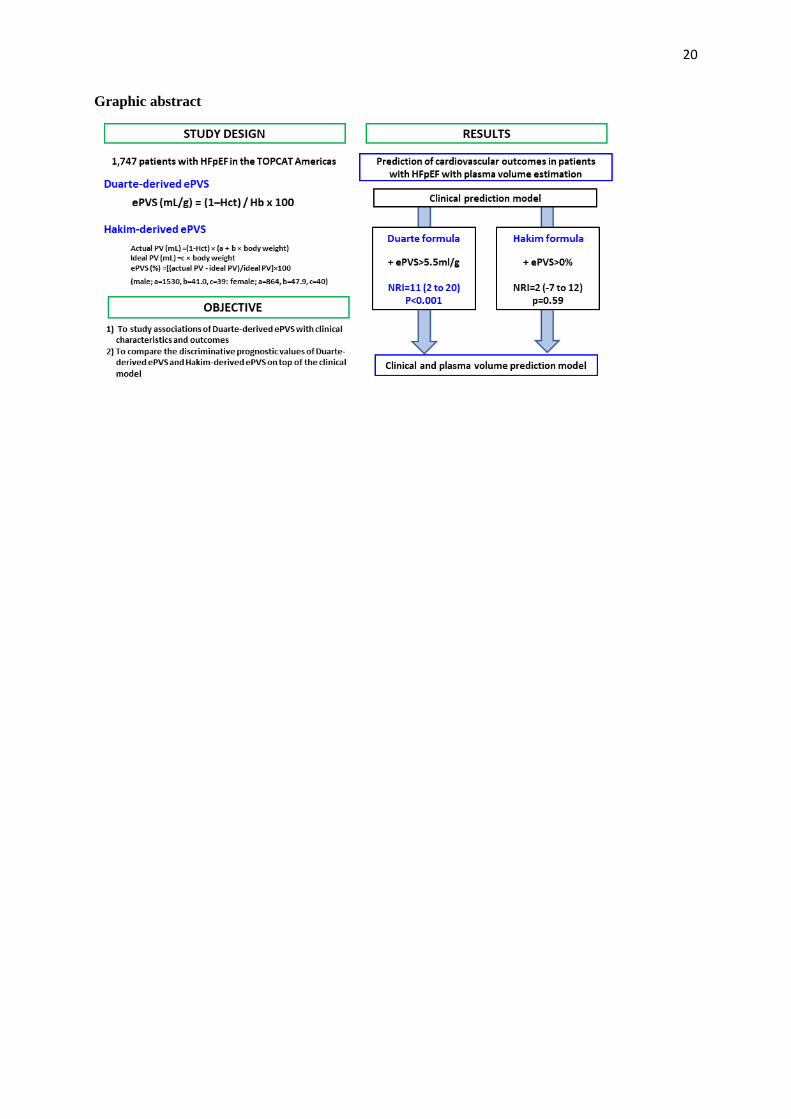
Among 1,747 patients (age 71.6 years; males 50.1%), mean ePVS derived from Duarte formula was
4.9±1.0 ml/g. Higher Duarte-derived ePVS was associated with prior HF admission, diabetes, more
severe congestion, poor renal function, higher natriuretic peptide level and E/e’. After adjustment for
potential covariates including natriuretic peptide, higher Duarte-derived ePVS was associated with an
increased rate of the primary outcome [highest vs. lowest ePVS quartile: adjusted-HR (95%CI)=1.79
(1.28-2.50), p<0.001]. Duarte-derived ePVS improved prognostic performance on top of clinical and
routine variables (including natriuretic peptides) (NRI=11, P<0.001), whereas Hakim-derived ePVS
did not (P=0.59). The prognostic value of Duarte-derived ePVS was not modified by renal function (p
interaction>0.10 for all outcomes).
Conclusion
ePVS from Duarte’s formula was associated with congestion status and improved risk-stratification,
regardless of renal function. Our findings suggest that Duarte-derived ePVS is a useful congestion
variable in patients with HFpEF.
Page 4
3
Introduction
Patients with heart failure (HF) often present signs and symptoms of congestion, which is one
of the main causes of hospitalization. Hospitalization for worsening HF has been associated with a
higher risk of cardiovascular death 1, 2. There is a large body of literature regarding the clinical
importance of assessing and monitoring congestion repeatedly before its progression to
decompensation or during decongestion therapy 1, 3-6
. However, there is little consensus among
clinicians with regard to the strategy for the quantification and monitoring of congestion. A readily
available and inexpensive monitoring tool to assess patients’ congestion status may represent a
valuable avenue of investigation.
Plasma volume (PV) is a marker of volume overload 7, 8
, and patients with decompensated HF
exhibit a 40% increase in PV compared with healthy controls 9. PV may be estimated from the Duarte
formula (based on hemoglobin and hematocrit) or from the Hakim formula (based on hematocrit and
dry body weight), both of which have been reported to be associated with clinical outcomes in patients
with acute HF and HF with reduced ejection fraction (HFrEF) 10-16
. However, despite published data
on the different fluid distributions between HFrEF and preserved ejection fraction (HFpEF) 17, 18
,
whether estimated plasma volume status (ePVS) contributes to poor clinical outcome in patients with
HFpEF has not been sufficiently investigated 19, 20
. Recent data showed that the Duarte formula rather
than Hakim formula was associated with left-sided hemodynamic marker of congestion 21. It is
however unclear which ePVS formula, between the Duarte formula and Hakim formula, has better risk
stratification in this setting. Furthermore, previous studies have shown a significant association
between ePVS and renal function 12, 13, 16, 20, 22
, although whether the prognostic value of ePVS may be
influenced by renal function is yet to be studied in HFpEF.
The main objectives of the present study were to: 1) determine the association between clinical
characteristics and other congestion variables using Duarte-derived ePVS; 2) study the association
between Duarte-derived ePVS and study outcomes; 3) compare the discriminative prognostic values of
Duarte-derived ePVS and Hakim-derived ePVS on top of the clinical model; 4) assess whether the
prognostic value of Duarte-derived ePVS is modified by renal function, i.e. the presence of chronic
kidney disease as defined by an estimated glomerular filtration rate (eGFR) below 60ml/min/1.73m2.
Page 5
4
Methods
Study Population
The present study consists of a post-hoc analysis of data obtained in the Treatment of Preserved
Cardiac Function Heart Failure with an Aldosterone Antagonist (TOPCAT) trial 23
. Inclusion criteria
were age 50 years or older, >1 sign and at least one symptom of HF, left ventricular ejection fraction
(LVEF)≥45%, controlled systolic blood pressure and serum potassium <5.0 mmol/L. Additional
criteria were either a history of HF hospitalization within the prior 12 months, or B-type natriuretic
peptide (BNP) ≥100 pg/mL or N-terminal pro-BNP (NT-proBNP) ≥360 pg/mL within 60 days prior to
randomization. Due to previously published regional differences in patient characteristics, outcomes,
and response to spironolactone between patients enrolled in Russia/Georgia and the Americas 24
, the
current study was analyzed in patients who had available hemoglobin/hematocrit data in the Americas
(United States, Canada, Brazil and Argentina). Each site approved the protocols and all patients signed
informed consent prior to randomization. This study complies with the Declaration of Helsinki and the
local Institutional Review Board has approved this research.
Estimated Plasma Volume Status
ePVS was calculated from the Strauss-derived Duarte formula using hematocrit and hemoglobin 10, 25
as follows:
ePVS (mL/g)=100 × (1-hematocrit) ⁄ hemoglobin in g/dL
The Hakim formula was also used for calculating PV estimation derived from hematocrit and
dry body weight using the following equations 26:
Actual plasma volume=(1-hematocrit) × (a + b × body weight in kg)
Ideal plasma volume=c × body weight in kg
(males: a=1530, b=41.0, c=39; females; a=864, b=47.9, c=40),
ePVS=[(actual plasma volume - ideal plasma volume)/ideal plasma volume]×100.
Page 6
5
Study Outcomes
The primary outcome of TOPCAT was the composite of cardiovascular mortality, HF hospitalization
or aborted cardiac arrest. The current analysis also included all-cause mortality, cardiovascular
mortality and HF hospitalization as previously published 23
. Cardiovascular mortality was defined by
any death from myocardial infarction, pump failure, sudden death, stroke, pulmonary embolism or
others. Patients hospitalized for worsening HF needed to meet at least one symptom, 2 signs of
congestion and requiring decongestion treatment.
Statistical Analysis
Categorical variables are expressed as frequencies (percentages) and continuous variables as means ±
standard deviation or median (25th and 75th percentiles) according to the distribution of the variables.
Comparisons of demographic, clinical, biological and echocardiographic parameters among ePVS
quartiles were analyzed using χ² tests for categorical variables and ANOVA or Kruskal-Wallis test for
continuous variables. Patients were also divided into four groups according to the categories of ePVS
and eGFR calculated by the Modification of Diet in Renal Disease formula 27.
Linear regression analyses were performed to assess the associations of clinical, biological and
echocardiographic variables with ePVS. Variables were entered into the multivariable model with
backward selection. Covariates considered to be of potential predictive impact comprised 34 baseline
patient characteristics (Supplementary table 1). These variables had a small proportion of missing
values (<10%), and no multiple imputation was performed. Internal validation of the model was
performed by bootstrapping (x200).
Time-to-event comparisons were analyzed using log rank test and Cox proportional hazards
models. Survival probabilities were estimated using the Kaplan-Meier method and plotted as survival
curves with ePVS quartiles and ePVS/eGFR categories, respectively. Cox proportional hazards models
were then used to obtain unadjusted and covariate adjusted hazard ratios (HRs). Time-to-event
analysis for HF hospitalization was conducted using a competing risk model as described by Fine and
Gray 28
, with HF hospitalization as the outcome and all-cause mortality as the competing risk. The
covariates used for adjustment included age, sex, BMI, previous myocardial infarction, NYHA III or
Page 7
6
IV, LVEF, potassium and eGFR at baseline. An additional adjustment consisting of the
aforementioned covariates plus log-transformed standardized (z-score) natriuretic peptide (i.e., BNP or
NT-proBNP) was also performed. Interactions between ePVS and eGFR on clinical outcomes were
assessed using both continuous and categorical variables.
Continuous net reclassification improvement (NRI) and integrated diagnostic improvement
(IDI) were calculated to estimate an improvement in risk prediction of the primary outcome by the
addition of ePVS on top of the aforementioned variables 29
.
All analyses were performed using R (R Development Core Team, Vienna, Austria). A two-
sided p-value <0.05 was considered statistically significant.
Results
Baseline Characteristics
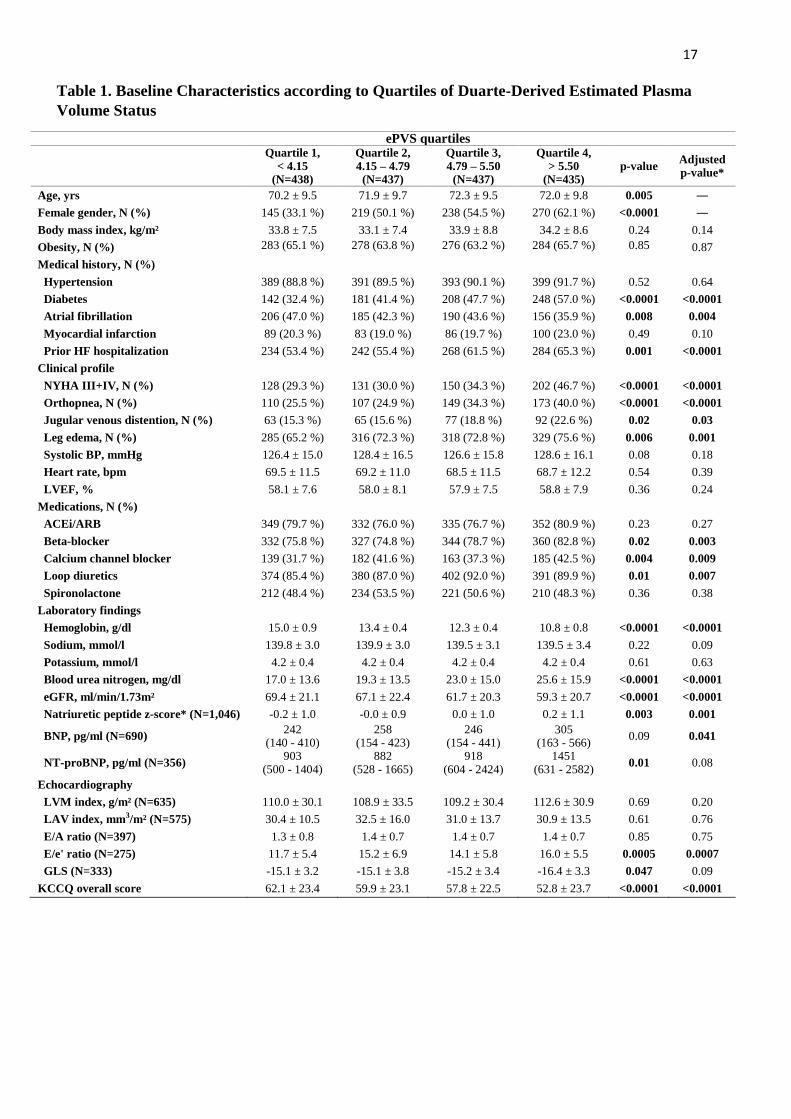
Among the 1,747 patients included in this study, half of the patients (N=875) were male, mean
age was 71.6±9.7 years, mean BMI was 33.8±8.1 kg/m² and over half had a prior admission for HF
(58.8%) (Table 1).
Mean ePVS was 4.9±1.0 ml/g. Patients with higher ePVS were more likely to have atrial
fibrillation, prior HF admission, more severe congestion, poorer renal function, higher natriuretic
peptide level, E/e’ and a more impaired quality of life (Table 1).
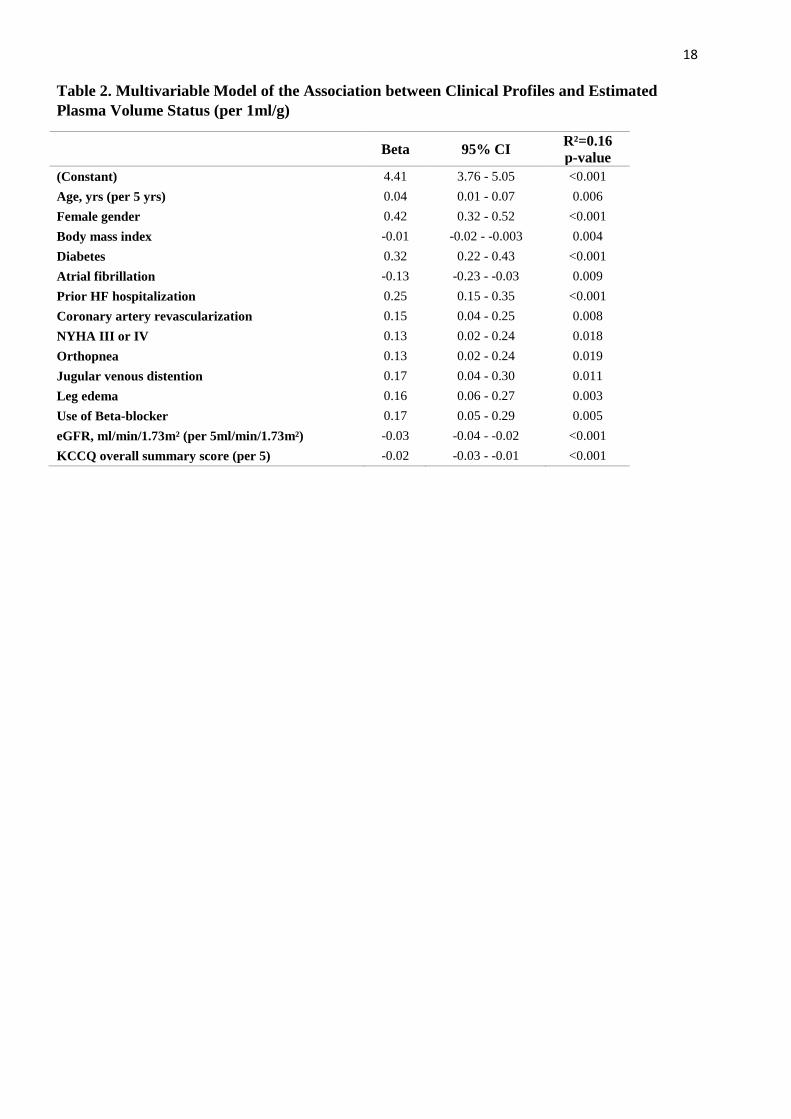
Clinical Determinants of Estimated Plasma Volume Status
In the linear regression models, poorer renal function, prior HF admission, congestion
signs/symptoms (i.e., NYHA, orthopnea, jugular venous distention and leg edema), female sex,
diabetes and use of beta-blocker remained significantly associated with higher ePVS levels (Table 2).
Similar results were obtained in considering the highest ePVS quartiles as outcome (Supplementary
table 2).
Page 8
7
Survival Analysis
During a median follow up of 2.5 years, 29.6%, 22.0% and 22.7% of patients met the primary
outcome, all-cause mortality and HF hospitalization, respectively. The primary outcome occurred
more frequently in patients with higher ePVS (Figure 1). Compared with the lowest quartile, the
highest ePVS quartile (>5.5ml/g) was associated with a doubling of the rates of the primary outcome
[adjusted-HR (95%CI)=2.00 (1.55-2.59), p<0.001] (Table 3). After further adjustment for covariates
including natriuretic peptide, the highest ePVS quartiles remained significantly associated with the
primary outcome [adjusted-HR (95%CI)=1.79 (1.28-2.50), p<0.001]. Similarly, the highest ePVS
level was associated with increased HF hospitalization rates (Supplementary table 3).
In univariable model, when compared with patients with low ePVS (<5.5ml/g) and high eGFR
(>60ml/min/1.73m²), patients with high ePVS (>5.5ml/g) with either lower eGFR (<60ml/min/1.73m²)
or higher eGFR (>60ml/min/1.73m²) had a significantly higher risk of the primary outcome
[respectively HR (95%CI)=2.65 (2.08-3.37), p<0.001; HR (95%CI)=1.90 (1.41-2.55), p<0.001]. After
adjusting for potential confounders including natriuretic peptide, patients with high ePVS expressed an
increased risk of similar magnitude for the primary outcome in patients with lower and higher eGFR
(Table 3). Concordantly, patients with higher ePVS were associated with a higher risk of other clinical
outcomes irrespective of eGFR level (Supplementary table 3).
There was no significant interaction between ePVS and eGFR on study outcomes (all-P
interaction>0.1). In addition, no interaction was found between ePVS and spironolactone (all-P
interaction>0.1).
Estimated Plasma Volume Status on Top of the Clinical Models
In the current analysis, patients in the highest quartile of Duarte-derived ePVS (>5.5ml/g) had
a worse prognosis. The addition of Duarte-derived ePVS (>5.5ml/g) significantly improved
reclassification [NRI (95%CI)=10.1 (3.2-16.5), p=0.004 and IDI (95%CI)=1.3 (0.4-2.7), p<0.001] on
the aforementioned potential covariates, whereas the addition of higher Hakim-derived ePVS (>0%)
did not (Figure 2 & Supplementary table 4). Furthermore, Duarte-derived ePVS still significantly
Page 9
8
improved reclassification [NRI (95%CI)=10.3 (2.9-18.5), p<0.001 and IDI (95%CI)=0.80 (0.01-2.10),
p=0.04] on top of a model containing the Hakim-derived ePVS and baseline clinical variables.
Discussion
The present study investigated the clinical and prognostic impact of Duarte-derived ePVS in
patients with HFpEF. Our main findings were; 1) higher Duarte-derived ePVS was associated with a
more severe congestion status; 2) higher Duarte-derived ePVS was independently associated with a
higher-risk of study outcomes; 3) the Duarte-derived ePVS prognosis value persisted irrespective of
renal function; 4) Duarte-derived ePVS significantly improved risk-stratification on top of clinical and
routine biological variables (including natriuretic peptides), whereas the Hakim-derived ePVS did not.
Our findings suggest that PV estimated from the Duarte formula may provide better patient risk
stratification than the Hakim formula in patients with HFpEF.
Duarte-Derived Estimated Plasma Volume Status as a Better Prognostic Marker
In the present analysis, median Duarte-derived ePVS was 4.9±1.0 ml/g, which is in line with
previous reports 10, 12, 19
. Our results furthermore showed that Duarte-derived ePVS was associated
with the primary outcome. In a previous post-hoc analysis of TOPCAT, ePVS values were calculated
based on the Hakim formula in 3,414 patients with CHF and LVEF>45% 20
. Within 5 years (during
which 19.2% of patients met the primary outcome), higher ePVS (>0%) was significantly associated
with a higher incidence of the primary outcome. However, given the well-known regional differences
in the TOPCAT trial 24
, analyzing the individuals enrolled in the Americas has proven to be more
informative. In this latter subset, and contrary to the results herein using the Duarte-derived formula,
higher ePVS was not significantly associated with study outcomes in multivariable Cox models
adjusted for natriuretic peptide (e.g. HR=1.06 (0.98 - 1.16) p=0.17 for the primary endpoint). In a
previous report assessing the association between Duarte-derived ePVS and the composite of HF
hospitalization or all-cause mortality in 449 patients with HFpEF19
, after a median follow-up of 10.7
years, the best-cut off point, ePVS>5.5ml/g, was found to associated with poor outcomes (21.6% of
patients died and 24.7% had HF hospitalization)19
. However, the analyses were not adjusted for
natriuretic peptide, which could result in residual confounding.
Page 10
9
To the best of our knowledge, the present study is the first to assess the prognostic/risk-
stratification value of Duarte-derived ePVS and Hakim-derived ePVS on top of clinical and routine
biological covariates (including natriuretic peptides). By demonstrating a significant reclassification
improvement of ePVS derived from Duarte formula but not Hakim formula, our findings suggest a
better prognostic utility of Duarte-derived ePVS in patients with HFpEF. The main difference in the
aforementioned ePVS formulas is the use of dry body weight in the Hakim formula. Given the
complex interplay between congestion and cardiac cachexia in patients with HF 30, 31
, dry body weight
may represent a difficult variable to assess and could introduce major bias in the formula.
Previous reports have shown different fluid profiles between patients with HFpEF and HFrEF
32, 33. Miller et al. compared body fluid profiles measured using the
131I-labeled albumin method
between patients with HFpEF and HFrEF 17. Their results showed that patients with HFpEF had a
higher interstitial fluid volume with higher body weight compared with those with HFrEF, suggesting
greater extravascular volume distribution in patients with HFpEF. These results may explain why dry
body weight is less associated with PV in patients with HFpEF, leading to the limited prognostic value
of the Hakim-derived ePVS in this setting.
Duarte-Derived ePVS as a Congestion Marker and its Interplay with Renal Function
In the current study, patients with higher Duarte-derived ePVS were associated with a more
severe congestion status as assessed by clinical variables (NYHA III or IV, orthopnea, jugular venous
distention and leg edema), NT-proBNP and E/e’. These results support the premise that ePVS derived
from hemoglobin/hematocrit is an integrative congestion marker in HFpEF. Previous studies assessing
the change in hemoglobin or hematocrit showed an association with clinical assessments of congestion
34-36. Recent reports also showed a significant association of hemoglobin with biological, ultrasound or
radiographic measures of congestion in ambulatory HF patients with fewer signs/symptoms of
congestion 37, 38
. Hemoglobin itself is thus likely to be the preferred marker with high sensitivity for
the assessment or monitoring of congestion in conjunction with lung ultrasound or natriuretic peptide
1, 39. Furthermore, a recent meta-analysis assessed the association between clinical profiles and
Page 11
10
measured blood volume components in 368 patients with HF. Their results showed that hemoglobin
was significantly associated with measured PV, but not with blood volume 40
. These findings further
strengthen that Duarte-derived ePVS could potentially become an easy-to-use and promising
assessment tool for evaluating congestion/plasma volume in patients with HF.
Renal functional deterioration enhances neurohormonal activation, leading to increased PV
values 41
. Renal venous congestion due to increased PV has been implicated in the pathogenesis of
renal impairment 42
, whereas decreased PV, similar to hemoconcentration, is also associated with
worsening renal function 34-36
. Despite this reported intimate relationship between PV and renal
function, we did not find any statistical interaction between ePVS and eGFR with regard to study
outcomes. Our observations thus suggest that Duarte-derived ePVS may help clinicians in better
identifying patients at higher risk of cardiovascular events regardless of renal function.
Clinical perspective
Hemodynamic congestion begins gradually and ultimately results in symptomatic congestion
and/or urgent hospitalization. Close biological monitoring of congestion may therefore provide better
stratification of patient risk. Accordingly, plasma volume, estimated from hemoglobin/hematocrit
using Duarte’s formula, may represent an easy-to-use marker in patients with HFpEF in clinical
routine.
In the present study, the highest quartile of PV estimated from Duarte's formula (≥5.5ml/g)
appeared to drive a higher risk of study outcomes regardless of renal function. This threshold for the
prognostic value of ePVS (≥5.5ml/g) is in keeping with recent data regarding ePVS in patients with
acute or chronic HF 12, 13, 19
. Further studies are needed to determine whether this threshold may help
optimize decongestion therapy and the monitoring of ambulatory patients.
Limitations
The present study has several limitations. This is a post-hoc analysis of the TOPCAT trial and
thus, given its inherent limitations, we are unable to infer causality nor exclude residual confounders.
First, no direct measurement of PV was performed by conventional radioisotope-labeled albumin or
Page 12
11
red blood cell assays, although these techniques are relatively impractical in routine clinical practice
given their high cost and technical requirements. Second, we did not have access to serial
hemoglobin/hematocrit measurements. Changes in ePVS, especially by the effect of mineralocorticoid
receptor antagonist, may also provide good patient risk stratification 43
. Third, we cannot exclude
analytical or laboratory variability introduced by natriuretic peptide measured at the clinical site
laboratories.
Conclusion
Duarte-derived ePVS appears as an integrative congestion variable capable of improving
patient risk-stratification, whereas the Hakim-derived ePVS did not. Duarte-derived ePVS provided
prognostic information irrespective of renal function. Our findings suggest that ePVS derived from
hemoglobin/hematocrit alone could be clinically useful for quantifying congestion status in patients
with HFpEF.
Acknowledgements
The TOPCAT trial was funded and sponsored by the NHLBI.
The Nancy team is supported by the RHU Fight-HF, a public grant overseen by the French National
Research Agency (ANR) as part of the second “Investissements d’Avenir” program (reference: ANR-
15-RHUS-0004), by the French PIA project “Lorraine Université d’Excellence” (reference: ANR-15-
IDEX-04-LUE), the ANR FOCUS-MR (reference: ANR-15-CE14-0032-01), ERA-CVD EXPERT
(reference: ANR-16-ECVD-0002-02), Contrat de Plan Etat Lorraine IT2MP and FEDER Lorraine.
Disclosures
P.R. reports grants and personal fees from AstraZeneca, grants and personal fees from Bayer, grants
and personal fees from CVRx, personal fees from Fresenius, grants and personal fees from Novartis,
personal fees from Grunenthal, personal fees from Servier, personal fees from Stealth Peptides,
personal fees from Vifor Fresenius Medical Care Renal Pharma, personal fees from Idorsia, personal
Page 13
12
fees from NovoNordisk, personal fees from Ablative Solutions, personal fees from G3P, personal fees
from Corvidia, personal fees from Relypsa, outside the submitted work; and Cofounder: CardioRenal,
a company developing a telemonitoring loop in heart failure (including potassium measurements).
B.P. reports personal fees (consulting) from Bayer, KBP Pharmaceuticals, AstraZeneca,
Relypsa/Vifor, Sanofi, sc Pharmaceuticals, Sarfez pharmaceuticals, Stealth Peptides, Cereno
Scientific, SQinnovations, G3 pharmaceuticals, Ardelyx and Tricida; stock options from KBP
Pharmaceuticals, sc Pharmaceuticals, Sarfez pharmaceuticals, Relypsa, Cereno scientific,
SQinnovations, G3 pharmaceuticals, Ardelyx and Tricida; patent for site specific delivery of
eplerenone to the myocardium US patent Number 9931412. N.G. reports honoraria from Novartis and
Boehringer. All other authors have no conflicts to disclose.
References
1. Girerd N, Seronde MF, Coiro S, Chouihed T, Bilbault P, Braun F, Kenizou D, Maillier B, Nazeyrollas
P, Roul G, Fillieux L, Abraham WT, Januzzi J, Jr., Sebbag L, Zannad F, Mebazaa A and Rossignol P. Integrative
Assessment of Congestion in Heart Failure Throughout the Patient Journey. JACC Heart Fail. 2018;6:273-285.
2. Pokorney SD, Al-Khatib SM, Sun JL, Schulte P, O'Connor CM, Teerlink JR, Armstrong PW,
Ezekowitz JA, Starling RC, Voors AA, Velazquez EJ, Hernandez AF and Mentz RJ. Sudden cardiac death after
acute heart failure hospital admission: insights from ASCEND-HF. Eur J Heart Fail. 2018;20:525-532.
3. Gheorghiade M, Follath F, Ponikowski P, Barsuk JH, Blair JE, Cleland JG, Dickstein K, Drazner MH,
Fonarow GC, Jaarsma T, Jondeau G, Sendon JL, Mebazaa A, Metra M, Nieminen M, Pang PS, Seferovic P,
Stevenson LW, van Veldhuisen DJ, Zannad F, Anker SD, Rhodes A, McMurray JJ, Filippatos G, European
Society of C and European Society of Intensive Care M. Assessing and grading congestion in acute heart failure:
a scientific statement from the acute heart failure committee of the heart failure association of the European
Society of Cardiology and endorsed by the European Society of Intensive Care Medicine. Eur J Heart Fail.
2010;12:423-33.
4. Abraham WT, Adamson PB, Bourge RC, Aaron MF, Costanzo MR, Stevenson LW, Strickland W,
Neelagaru S, Raval N, Krueger S, Weiner S, Shavelle D, Jeffries B and Yadav JS. Wireless pulmonary artery
haemodynamic monitoring in chronic heart failure: a randomised controlled trial. Lancet. 2011;377:658-66.
5. Ambrosy AP, Pang PS, Khan S, Konstam MA, Fonarow GC, Traver B, Maggioni AP, Cook T,
Swedberg K, Burnett JC, Jr., Grinfeld L, Udelson JE, Zannad F and Gheorghiade M. Clinical course and
predictive value of congestion during hospitalization in patients admitted for worsening signs and symptoms of
heart failure with reduced ejection fraction: findings from the EVEREST trial. Eur Heart J. 2013;34:835-43.
Page 14
13
6. Coiro S, Girerd N, Rossignol P, Ferreira JP, Maggioni A, Pitt B, Tritto I, Ambrosio G, Dickstein K and
Zannad F. Association of beta-blocker treatment with mortality following myocardial infarction in patients with
chronic obstructive pulmonary disease and heart failure or left ventricular dysfunction: a propensity matched-
cohort analysis from the High-Risk Myocardial Infarction Database Initiative. Eur J Heart Fail. 2016.
7. Francis GS, Benedict C, Johnstone DE, Kirlin PC, Nicklas J, Liang CS, Kubo SH, Rudin-Toretsky E
and Yusuf S. Comparison of neuroendocrine activation in patients with left ventricular dysfunction with and
without congestive heart failure. A substudy of the Studies of Left Ventricular Dysfunction (SOLVD).
Circulation. 1990;82:1724-9.
8. Miller WL. Fluid Volume Overload and Congestion in Heart Failure: Time to Reconsider
Pathophysiology and How Volume Is Assessed. Circ Heart Fail. 2016;9:e002922.
9. Kaplan E, Puestow RC, Baker LA and Kruger S. Blood volume in congestive heart failure as
determined with iodinated human serum albumin. Am Heart J. 1954;47:824-38.
10. Duarte K, Monnez JM, Albuisson E, Pitt B, Zannad F and Rossignol P. Prognostic Value of Estimated
Plasma Volume in Heart Failure. JACC Heart Fail. 2015;3:886-93.
11. Ling HZ, Flint J, Damgaard M, Bonfils PK, Cheng AS, Aggarwal S, Velmurugan S, Mendonca M,
Rashid M, Kang S, Papalia F, Weissert S, Coats CJ, Thomas M, Kuskowski M, Cohn JN, Woldman S, Anand IS
and Okonko DO. Calculated plasma volume status and prognosis in chronic heart failure. Eur J Heart Fail.
2015;17:35-43.
12. Kobayashi M, Rossignol P, Ferreira JP, Aragao I, Paku Y, Iwasaki Y, Watanabe M, Fudim M, Duarte
K, Zannad F and Girerd N. Prognostic value of estimated plasma volume in acute heart failure in three cohort
studies. Clin Res Cardiol. 2018.
13. Chouihed T, Rossignol P, Bassand A, Duarte K, Kobayashi M, Jaeger D, Sadoune S, Buessler A, Nace
L, Giacomin G, Hutter T, Barbe F, Salignac S, Jay N, Zannad F and Girerd N. Diagnostic and prognostic value
of plasma volume status at emergency department admission in dyspneic patients: results from the PARADISE
cohort. Clin Res Cardiol. 2018.
14. Yoshihisa A, Abe S, Sato Y, Watanabe S, Yokokawa T, Miura S, Misaka T, Sato T, Suzuki S, Oikawa
M, Kobayashi A, Yamaki T, Kunii H, Saitoh SI and Takeishi Y. Plasma volume status predicts prognosis in
patients with acute heart failure syndromes. Eur Heart J Acute Cardiovasc Care. 2017:2048872617690889.
15. Balderston JR, Shah KB, Paciulli SC and Gertz ZM. Usefulness of Estimated Plasma Volume at
Postdischarge Follow-Up to Predict Recurrent Events in Patients With Heart Failure. Am J Cardiol.
2018;122:1191-1194.
16. Kobayashi M, Bercker M, Huttin O, Pierre S, Sadoul N, Bozec E, Chouihed T, Ferreira JP, Zannad F,
Rossignol P and Girerd N. Chest X-ray quantification of admission lung congestion as a prognostic factor in
patients admitted for worsening heart failure from the ICALOR cohort study. Int J Cardiol. 2019.
17. Miller WL and Mullan BP. Volume Overload Profiles in Patients With Preserved and Reduced Ejection
Fraction Chronic Heart Failure: Are There Differences? A Pilot Study. JACC Heart Fail. 2016;4:453-9.
18. Takei M, Kohsaka S, Shiraishi Y, Goda A, Izumi Y, Yagawa M, Mizuno A, Sawano M, Inohara T,
Kohno T, Fukuda K, Yoshikawa T and West Tokyo Heart Failure Registry I. Effect of estimated plasma volume
reduction on renal function for acute heart failure differs between patients with preserved and reduced ejection
fraction. Circulation Heart failure. 2015;8:527-32.
Page 15
14
19. Huang CY, Lin TT, Wu YF, Chiang FT and Wu CK. Long-term Prognostic Value of Estimated Plasma
Volume in Heart Failure with Preserved Ejection Fraction. Sci Rep. 2019;9:14369.
20. Grodin JL, Philips S, Mullens W, Nijst P, Martens P, Fang JC, Drazner MH, Tang WHW and Pandey
A. Prognostic implications of plasma volume status estimates in heart failure with preserved ejection fraction:
insights from TOPCAT. Eur J Heart Fail. 2019.
21. Kobayashi M, Huttin O, Donal E, Duarte K, Hubert A, Le Breton H, Galli E, Fournet M, Mabo P,
Schnell F, Leclercq C, Rossignol P and Girerd N. Association of estimated plasma volume status with
hemodynamic and echocardiographic parameters. Clin Res Cardiol. 2020.
22. Okonko DO, Jouhra F, Abu-Own H, Filippatos G, Colet JC, Suki C, Mori C, Ponikowski P and Anker
SD. Effect of ferric carboxymaltose on calculated plasma volume status and clinical congestion: a FAIR-HF
substudy. ESC Heart Fail. 2019;6:621-628.
23. Pitt B, Pfeffer MA, Assmann SF, Boineau R, Anand IS, Claggett B, Clausell N, Desai AS, Diaz R, Fleg
JL, Gordeev I, Harty B, Heitner JF, Kenwood CT, Lewis EF, O'Meara E, Probstfield JL, Shaburishvili T, Shah
SJ, Solomon SD, Sweitzer NK, Yang S and McKinlay SM. Spironolactone for heart failure with preserved
ejection fraction. N Engl J Med. 2014;370:1383-92.
24. Pfeffer MA, Claggett B, Assmann SF, Boineau R, Anand IS, Clausell N, Desai AS, Diaz R, Fleg JL,
Gordeev I, Heitner JF, Lewis EF, O'Meara E, Rouleau JL, Probstfield JL, Shaburishvili T, Shah SJ, Solomon
SD, Sweitzer NK, McKinlay SM and Pitt B. Regional variation in patients and outcomes in the Treatment of
Preserved Cardiac Function Heart Failure With an Aldosterone Antagonist (TOPCAT) trial. Circulation.
2015;131:34-42.
25. Strauss MB, Davis RK, Rosenbaum JD and Rossmeisl EC. Water diuresis produced during recumbency
by the intravenous infusion of isotonic saline solution. J Clin Invest. 1951;30:862-8.
26. RM. H. Plasmapheresis. In: I. D. JT, B. PG and I. TS, eds. Handbook of dialysis, 3rd ed Philadelphia:
Lippincott. Williams and Wilkins; 2001: 236.
27. Levey AS, Bosch JP, Lewis JB, Greene T, Rogers N and Roth D. A more accurate method to estimate
glomerular filtration rate from serum creatinine: a new prediction equation. Modification of Diet in Renal
Disease Study Group. Ann Intern Med. 1999;130:461-70.
28. Fine JP and Gray RJ. A proportional hazards model for the subdistribution of a competing risk. J Am
Stat Assoc. 1999;94:496-509.
29. Uno H, Tian L, Cai T, Kohane IS and Wei LJ. A unified inference procedure for a class of measures to
assess improvement in risk prediction systems with survival data. Stat Med. 2013;32:2430-42.
30. Ambrosy AP, Cerbin LP, Armstrong PW, Butler J, Coles A, DeVore AD, Dunlap ME, Ezekowitz JA,
Felker GM, Fudim M, Greene SJ, Hernandez AF, O'Connor CM, Schulte P, Starling RC, Teerlink JR, Voors AA
and Mentz RJ. Body Weight Change During and After Hospitalization for Acute Heart Failure: Patient
Characteristics, Markers of Congestion, and Outcomes: Findings From the ASCEND-HF Trial. JACC Heart
Fail. 2017;5:1-13.
31. Anker SD, Negassa A, Coats AJS, Afzal R, Poole-Wilson PA, Cohn JN and Yusuf S. Prognostic
importance of weight loss in chronic heart failure and the effect of treatment with angiotensin-converting-
enzyme inhibitors: an observational study. The Lancet. 2003;361:1077-1083.
Page 16
15
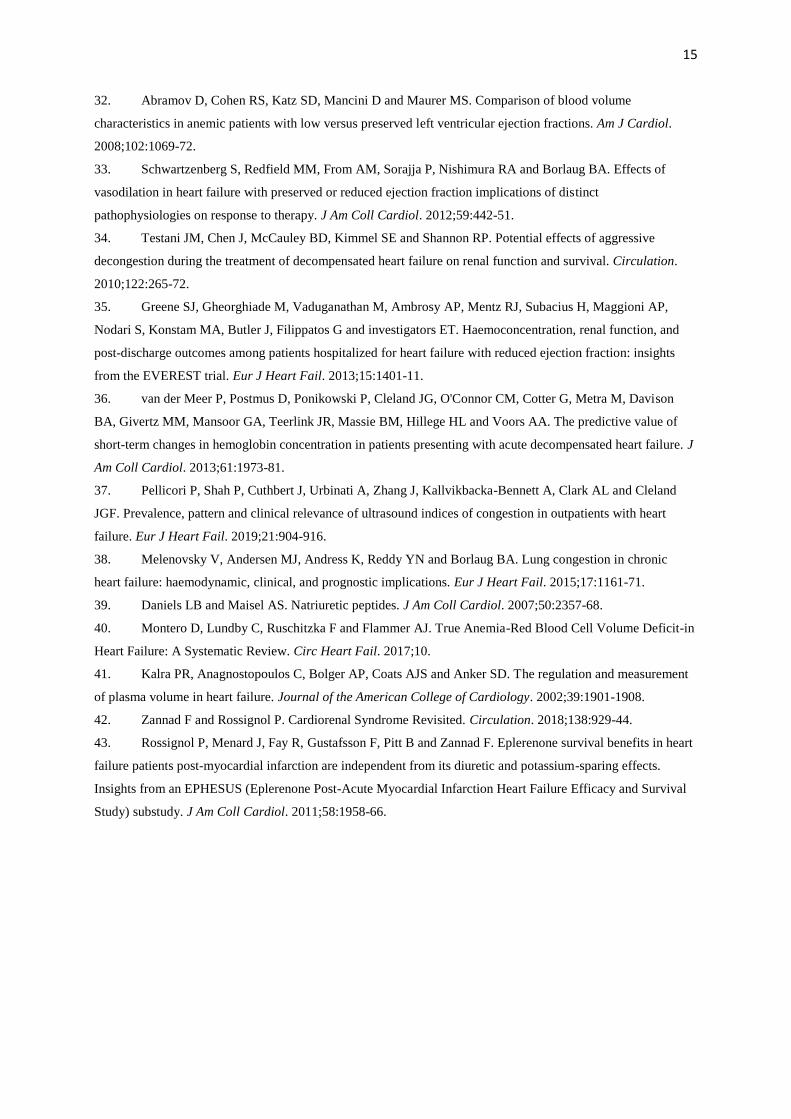
32. Abramov D, Cohen RS, Katz SD, Mancini D and Maurer MS. Comparison of blood volume
characteristics in anemic patients with low versus preserved left ventricular ejection fractions. Am J Cardiol.
2008;102:1069-72.
33. Schwartzenberg S, Redfield MM, From AM, Sorajja P, Nishimura RA and Borlaug BA. Effects of
vasodilation in heart failure with preserved or reduced ejection fraction implications of distinct
pathophysiologies on response to therapy. J Am Coll Cardiol. 2012;59:442-51.
34. Testani JM, Chen J, McCauley BD, Kimmel SE and Shannon RP. Potential effects of aggressive
decongestion during the treatment of decompensated heart failure on renal function and survival. Circulation.
2010;122:265-72.
35. Greene SJ, Gheorghiade M, Vaduganathan M, Ambrosy AP, Mentz RJ, Subacius H, Maggioni AP,
Nodari S, Konstam MA, Butler J, Filippatos G and investigators ET. Haemoconcentration, renal function, and
post-discharge outcomes among patients hospitalized for heart failure with reduced ejection fraction: insights
from the EVEREST trial. Eur J Heart Fail. 2013;15:1401-11.
36. van der Meer P, Postmus D, Ponikowski P, Cleland JG, O'Connor CM, Cotter G, Metra M, Davison
BA, Givertz MM, Mansoor GA, Teerlink JR, Massie BM, Hillege HL and Voors AA. The predictive value of
short-term changes in hemoglobin concentration in patients presenting with acute decompensated heart failure. J
Am Coll Cardiol. 2013;61:1973-81.
37. Pellicori P, Shah P, Cuthbert J, Urbinati A, Zhang J, Kallvikbacka-Bennett A, Clark AL and Cleland
JGF. Prevalence, pattern and clinical relevance of ultrasound indices of congestion in outpatients with heart
failure. Eur J Heart Fail. 2019;21:904-916.
38. Melenovsky V, Andersen MJ, Andress K, Reddy YN and Borlaug BA. Lung congestion in chronic
heart failure: haemodynamic, clinical, and prognostic implications. Eur J Heart Fail. 2015;17:1161-71.
39. Daniels LB and Maisel AS. Natriuretic peptides. J Am Coll Cardiol. 2007;50:2357-68.
40. Montero D, Lundby C, Ruschitzka F and Flammer AJ. True Anemia-Red Blood Cell Volume Deficit-in
Heart Failure: A Systematic Review. Circ Heart Fail. 2017;10.
41. Kalra PR, Anagnostopoulos C, Bolger AP, Coats AJS and Anker SD. The regulation and measurement
of plasma volume in heart failure. Journal of the American College of Cardiology. 2002;39:1901-1908.
42. Zannad F and Rossignol P. Cardiorenal Syndrome Revisited. Circulation. 2018;138:929-44.
43. Rossignol P, Menard J, Fay R, Gustafsson F, Pitt B and Zannad F. Eplerenone survival benefits in heart
failure patients post-myocardial infarction are independent from its diuretic and potassium-sparing effects.
Insights from an EPHESUS (Eplerenone Post-Acute Myocardial Infarction Heart Failure Efficacy and Survival
Study) substudy. J Am Coll Cardiol. 2011;58:1958-66.
Page 17
16
Table 1. Baseline Characteristics according to Quartiles of Duarte-Derived Estimated Plasma
Volume Status
Values are expressed as mean ±SD, n (%) or median (25th to 75th percentile)
ePVS, estimated plasma volume status; HF, heart failure; NYHA, New York Heart Association; BP, blood pressure; LVEF,
left ventricular ejection fraction; ACEi, angiotensin converting enzyme inhibitor; ARB, angiotensin receptor blocker; eGFR,
estimated glomerular filtration rate; BNP, brain natriuretic peptide; NT-proBNP, N-terminal-pro brain natriuretic peptide;
LVM, left ventricular mass; LAV, left atrial volume; GLS, global longitudinal strain; KCCQ, Kansas City Cardiomyopathy
Questionnaire.
* p-value adjusted for age and sex at entry.
**Natriuretic peptide z-score was calculated using both BNP and NT-proBNP.
Table 2. Multivariable Model of the Association between Clinical Profiles and Estimated Plasma
Volume Status (per 1ml/g)
CI, confidence interval; HF, heart failure; NYHA, New York Heart Association; eGFR, estimated glomerular filtration rate;
KCCQ, Kansas City Cardiomyopathy Questionnaire.
Table 3. Cox Proportional Hazard Model of Duarte-Derived Estimated Plasma Volume Status for the
Primary Outcome
Model 1, univariable model.
Model 2, adjusted for age, female gender, body mass index, previous myocardial infarction, left ventricular ejection fraction,
New York Heart Association III or IV, potassium and estimated glomerular filtration rate at baseline.
Model 3, adjusted for covariables in Model 2 plus natriuretic peptide (BNP or NT-proBNP) transformed by z-score.
HR, hazard ratio; CI, confidence interval; ePVS, estimated plasma volume status; eGFR, estimated glomerular filtration rate.
Page 18
17
Table 1. Baseline Characteristics according to Quartiles of Duarte-Derived Estimated Plasma
Volume Status
ePVS quartiles
Quartile 1,
< 4.15 (N=438)
Quartile 2,
4.15 – 4.79 (N=437)
Quartile 3,
4.79 – 5.50 (N=437)
Quartile 4,
> 5.50 (N=435)
p-value Adjusted p-value*
Age, yrs 70.2 ± 9.5 71.9 ± 9.7 72.3 ± 9.5 72.0 ± 9.8 0.005 ―
Female gender, N (%) 145 (33.1 %) 219 (50.1 %) 238 (54.5 %) 270 (62.1 %) <0.0001 ―
Body mass index, kg/m² 33.8 ± 7.5 33.1 ± 7.4 33.9 ± 8.8 34.2 ± 8.6 0.24 0.14
Obesity, N (%) 283 (65.1 %) 278 (63.8 %) 276 (63.2 %) 284 (65.7 %) 0.85 0.87
Medical history, N (%)
Hypertension 389 (88.8 %) 391 (89.5 %) 393 (90.1 %) 399 (91.7 %) 0.52 0.64
Diabetes 142 (32.4 %) 181 (41.4 %) 208 (47.7 %) 248 (57.0 %) <0.0001 <0.0001
Atrial fibrillation 206 (47.0 %) 185 (42.3 %) 190 (43.6 %) 156 (35.9 %) 0.008 0.004
Myocardial infarction 89 (20.3 %) 83 (19.0 %) 86 (19.7 %) 100 (23.0 %) 0.49 0.10
Prior HF hospitalization 234 (53.4 %) 242 (55.4 %) 268 (61.5 %) 284 (65.3 %) 0.001 <0.0001
Clinical profile
NYHA III+IV, N (%) 128 (29.3 %) 131 (30.0 %) 150 (34.3 %) 202 (46.7 %) <0.0001 <0.0001
Orthopnea, N (%) 110 (25.5 %) 107 (24.9 %) 149 (34.3 %) 173 (40.0 %) <0.0001 <0.0001
Jugular venous distention, N (%) 63 (15.3 %) 65 (15.6 %) 77 (18.8 %) 92 (22.6 %) 0.02 0.03
Leg edema, N (%) 285 (65.2 %) 316 (72.3 %) 318 (72.8 %) 329 (75.6 %) 0.006 0.001
Systolic BP, mmHg 126.4 ± 15.0 128.4 ± 16.5 126.6 ± 15.8 128.6 ± 16.1 0.08 0.18
Heart rate, bpm 69.5 ± 11.5 69.2 ± 11.0 68.5 ± 11.5 68.7 ± 12.2 0.54 0.39
LVEF, % 58.1 ± 7.6 58.0 ± 8.1 57.9 ± 7.5 58.8 ± 7.9 0.36 0.24
Medications, N (%)
ACEi/ARB 349 (79.7 %) 332 (76.0 %) 335 (76.7 %) 352 (80.9 %) 0.23 0.27
Beta-blocker 332 (75.8 %) 327 (74.8 %) 344 (78.7 %) 360 (82.8 %) 0.02 0.003
Calcium channel blocker 139 (31.7 %) 182 (41.6 %) 163 (37.3 %) 185 (42.5 %) 0.004 0.009
Loop diuretics 374 (85.4 %) 380 (87.0 %) 402 (92.0 %) 391 (89.9 %) 0.01 0.007
Spironolactone 212 (48.4 %) 234 (53.5 %) 221 (50.6 %) 210 (48.3 %) 0.36 0.38
Laboratory findings
Hemoglobin, g/dl 15.0 ± 0.9 13.4 ± 0.4 12.3 ± 0.4 10.8 ± 0.8 <0.0001 <0.0001
Sodium, mmol/l 139.8 ± 3.0 139.9 ± 3.0 139.5 ± 3.1 139.5 ± 3.4 0.22 0.09
Potassium, mmol/l 4.2 ± 0.4 4.2 ± 0.4 4.2 ± 0.4 4.2 ± 0.4 0.61 0.63
Blood urea nitrogen, mg/dl 17.0 ± 13.6 19.3 ± 13.5 23.0 ± 15.0 25.6 ± 15.9 <0.0001 <0.0001
eGFR, ml/min/1.73m² 69.4 ± 21.1 67.1 ± 22.4 61.7 ± 20.3 59.3 ± 20.7 <0.0001 <0.0001
Natriuretic peptide z-score* (N=1,046) -0.2 ± 1.0 -0.0 ± 0.9 0.0 ± 1.0 0.2 ± 1.1 0.003 0.001
BNP, pg/ml (N=690) 242
(140 - 410) 258
(154 - 423) 246
(154 - 441) 305
(163 - 566) 0.09 0.041
NT-proBNP, pg/ml (N=356) 903
(500 - 1404) 882
(528 - 1665) 918
(604 - 2424) 1451
(631 - 2582) 0.01 0.08
Echocardiography
LVM index, g/m² (N=635) 110.0 ± 30.1 108.9 ± 33.5 109.2 ± 30.4 112.6 ± 30.9 0.69 0.20
LAV index, mm3/m² (N=575) 30.4 ± 10.5 32.5 ± 16.0 31.0 ± 13.7 30.9 ± 13.5 0.61 0.76
E/A ratio (N=397) 1.3 ± 0.8 1.4 ± 0.7 1.4 ± 0.7 1.4 ± 0.7 0.85 0.75
E/e' ratio (N=275) 11.7 ± 5.4 15.2 ± 6.9 14.1 ± 5.8 16.0 ± 5.5 0.0005 0.0007
GLS (N=333) -15.1 ± 3.2 -15.1 ± 3.8 -15.2 ± 3.4 -16.4 ± 3.3 0.047 0.09
KCCQ overall score 62.1 ± 23.4 59.9 ± 23.1 57.8 ± 22.5 52.8 ± 23.7 <0.0001 <0.0001
Page 19
18
Table 2. Multivariable Model of the Association between Clinical Profiles and Estimated
Plasma Volume Status (per 1ml/g)
Beta 95% CI
R²=0.16
p-value
(Constant) 4.41 3.76 - 5.05 <0.001
Age, yrs (per 5 yrs) 0.04 0.01 - 0.07 0.006
Female gender 0.42 0.32 - 0.52 <0.001
Body mass index -0.01 -0.02 - -0.003 0.004
Diabetes 0.32 0.22 - 0.43 <0.001
Atrial fibrillation -0.13 -0.23 - -0.03 0.009
Prior HF hospitalization 0.25 0.15 - 0.35 <0.001
Coronary artery revascularization 0.15 0.04 - 0.25 0.008
NYHA III or IV 0.13 0.02 - 0.24 0.018
Orthopnea 0.13 0.02 - 0.24 0.019
Jugular venous distention 0.17 0.04 - 0.30 0.011
Leg edema 0.16 0.06 - 0.27 0.003
Use of Beta-blocker 0.17 0.05 - 0.29 0.005
eGFR, ml/min/1.73m² (per 5ml/min/1.73m²) -0.03 -0.04 - -0.02 <0.001
KCCQ overall summary score (per 5) -0.02 -0.03 - -0.01 <0.001
Page 20
19
Table 3. Cox Proportional Hazard Model of Duarte-Derived Estimated Plasma Volume Status for the Primary Outcome
Primary endpoint Model 1 Model 2 Model 3
HR 95% CI p-value HR 95% CI p-value HR 95% CI p-value
ePVS Continuous (per 1ml/g) 1.33 1.24 - 1.44 <0.001 1.27 1.18 - 1.37 <0.001 1.23 1.10 - 1.37 <0.001
ePVS Categorical
Q1 (reference) (reference) (reference)
Q2 1.02 0.78 - 1.35 0.87 1.07 0.81 - 1.41 0.63 1.15 0.80 - 1.65 0.44
Q3 1.40 1.08 - 1.82 0.01 1.39 1.07 - 1.80 0.01 1.25 0.88 - 1.78 0.22
Q4 2.16 1.69 - 2.75 <0.001 2.00 1.55 - 2.59 <0.001 1.79 1.28 - 2.50 <0.001
ePVS and eGFR interplay
ePVS<5.5 ml/g & eGFR>60 ml/min/1.73m²
(reference)
(reference)
(reference)
ePVS<5.5 ml/g & eGFR<60 ml/min/1.73m² 1.53 1.23 – 1.89 <0.001 1.28 0.94 – 1.75 0.12 1.99 1.31 – 3.00 0.001
ePVS>5.5 ml/g & eGFR>60 ml/min/1.73m² 1.90 1.41 – 2.55 <0.001 1.83 1.35 – 2.47 <0.001 2.00 1.36 – 2.92 <0.001
ePVS>5.5 ml/g & eGFR<60 ml/min/1.73m² 2.65 2.08 – 3.37 <0.001 2.13 1.51 – 3.00 <0.001 2.59 1.63 – 4.11 <0.001
p-value for interaction with eGFR
Continuous 0.45
Categorical 0.65
Page 21
20
Graphic abstract
Page 22
21
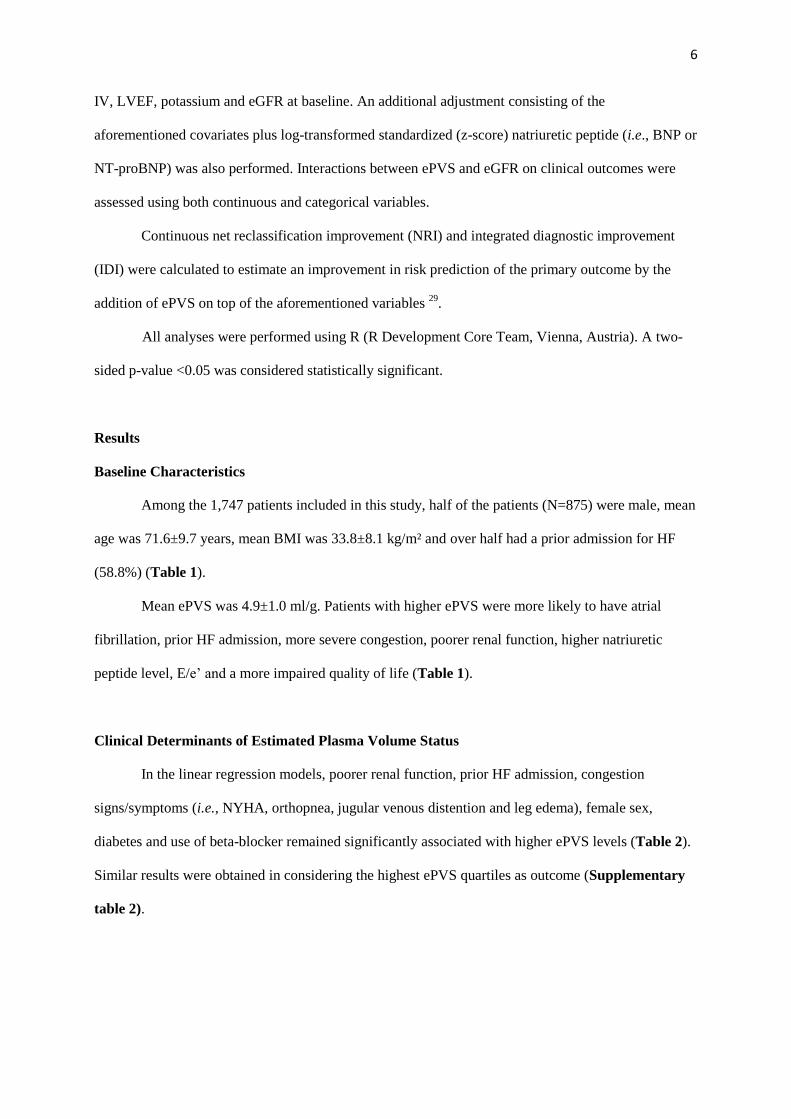
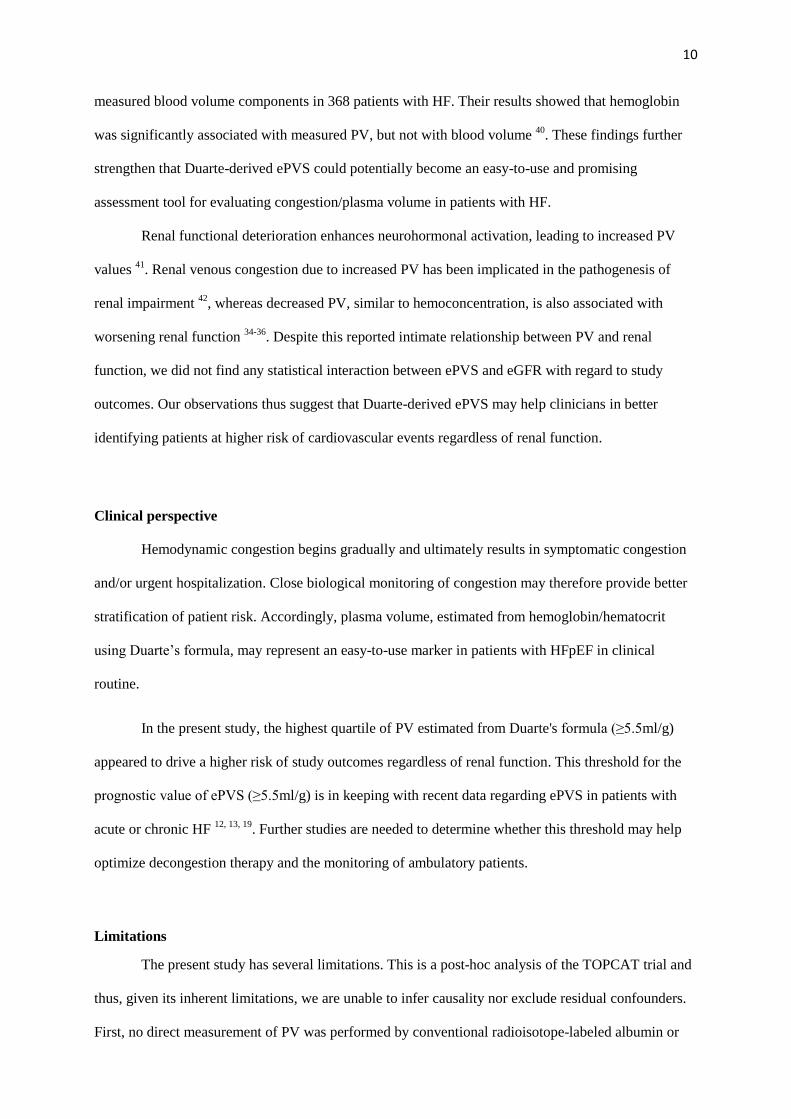
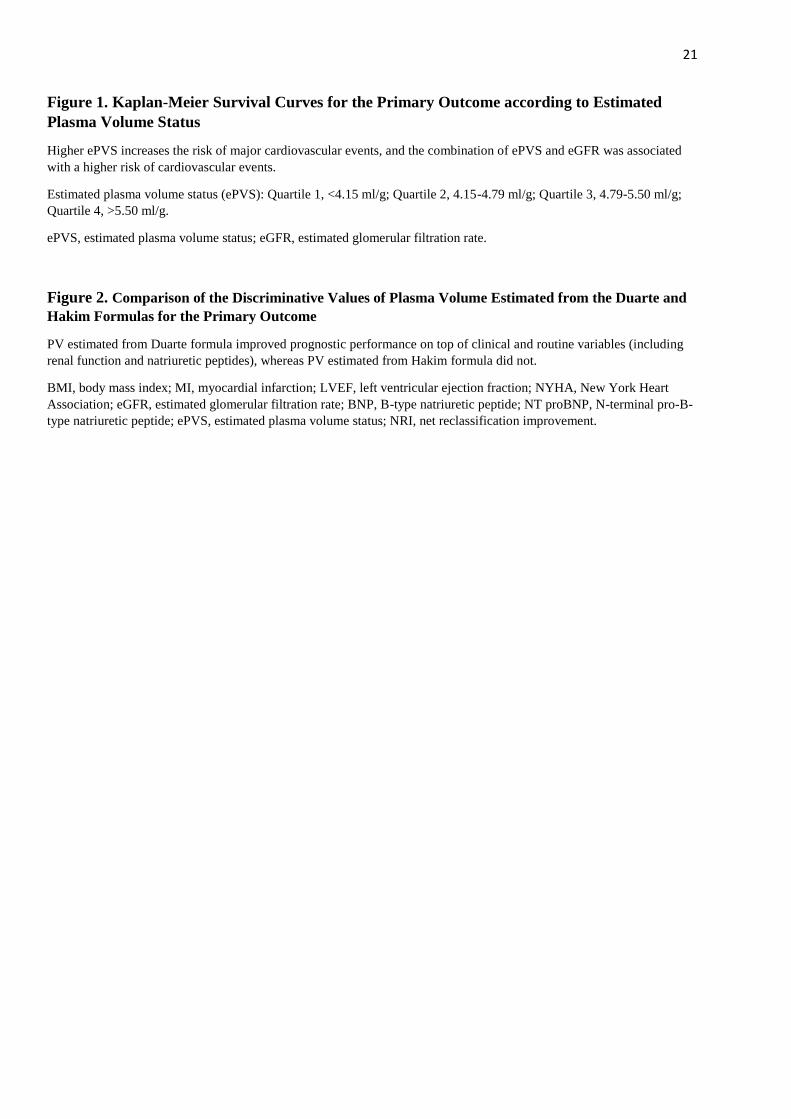
Figure 1. Kaplan-Meier Survival Curves for the Primary Outcome according to Estimated
Plasma Volume Status
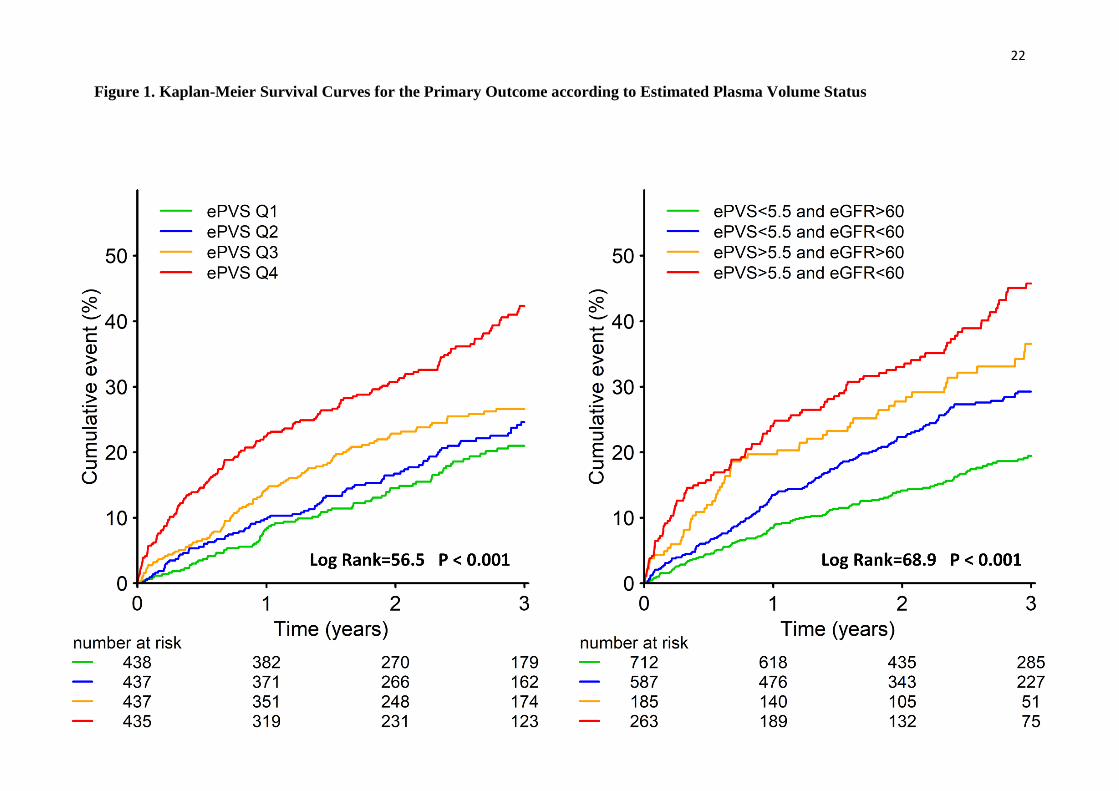
Higher ePVS increases the risk of major cardiovascular events, and the combination of ePVS and eGFR was associated
with a higher risk of cardiovascular events.
Estimated plasma volume status (ePVS): Quartile 1, <4.15 ml/g; Quartile 2, 4.15-4.79 ml/g; Quartile 3, 4.79-5.50 ml/g;
Quartile 4, >5.50 ml/g.
ePVS, estimated plasma volume status; eGFR, estimated glomerular filtration rate.
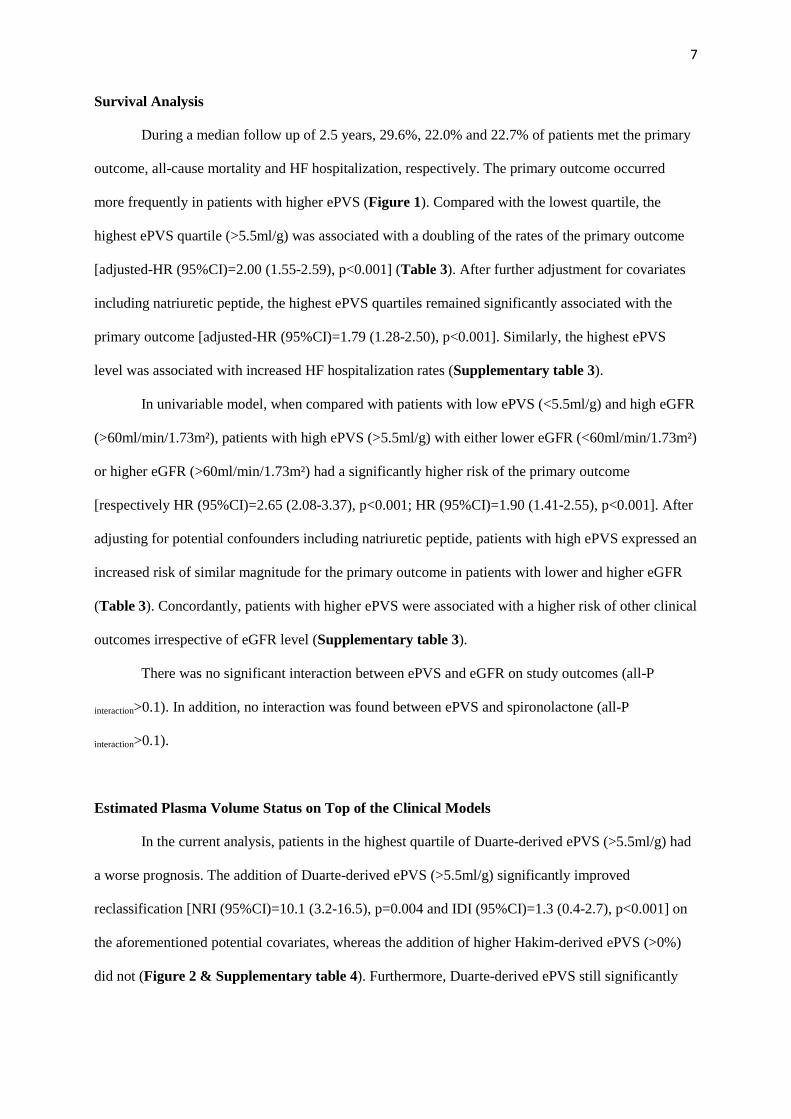
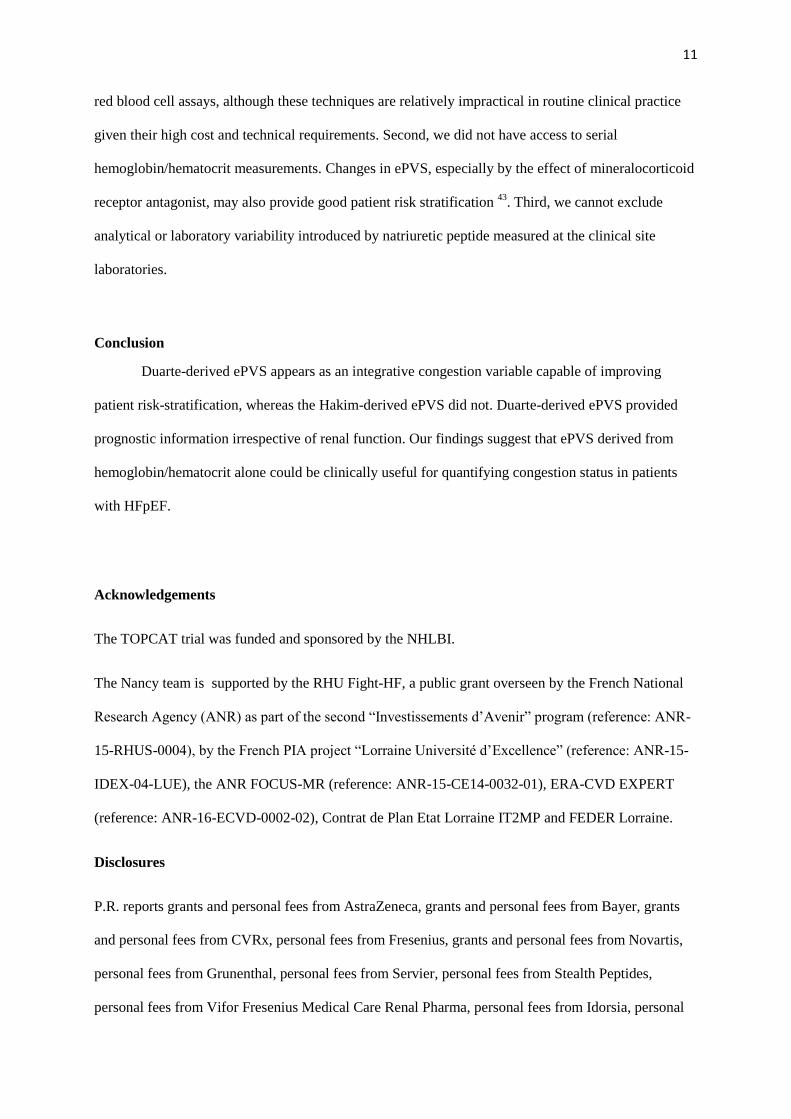
Figure 2. Comparison of the Discriminative Values of Plasma Volume Estimated from the Duarte and
Hakim Formulas for the Primary Outcome
PV estimated from Duarte formula improved prognostic performance on top of clinical and routine variables (including
renal function and natriuretic peptides), whereas PV estimated from Hakim formula did not.
BMI, body mass index; MI, myocardial infarction; LVEF, left ventricular ejection fraction; NYHA, New York Heart
Association; eGFR, estimated glomerular filtration rate; BNP, B-type natriuretic peptide; NT proBNP, N-terminal pro-B-
type natriuretic peptide; ePVS, estimated plasma volume status; NRI, net reclassification improvement.
Page 23
22
Figure 1. Kaplan-Meier Survival Curves for the Primary Outcome according to Estimated Plasma Volume Status
Page 24
23
Figure 2. Comparison of the Discriminative Values of Plasma Volume Estimated from the Duarte and
Hakim Formulas for the Primary Outcome
Page 25
24
Supplementary table 1. Candidate Clinical Variables Predicting Duarte-Derived Estimated Plasma Volume Status
Variables % missing
value Variables
% missing
value Variables
% missing
value
Age 0 Clinical profiles
Laboratory findings
Female 0 NYHA III or IV 0.2 White blood cell 0.2
Body mass index 0.4 Orthopnea 1.1 Alkaline phosphatase 1.1
Medical history Jugular venous distention 5.9 Albumin 5.9
Hypertension 0.1 Leg edema 0.1 Sodium 0.1
Diabetes 0.1 Systolic BP 0.1 Potassium 0.1
Dyslipidemia 0.1 Heart rate 0.2 eGFR 0.2
Use of Insulin 0.1 Left ventricular ejection fraction 0 KCCQ overall score 0
Atrial fibrillation 0.1 Medications 0
Previous myocardial infarction 0.1 ACEi or ARB 0
Coronary artery revascularization 0.1 Beta-blocker 0
Prior HF admission 0.1 Calcium channel blocker 0
Stroke 0.1 Loop diuretics 0
Peripheral artery disease 0.1 Spironolactone 0
Chronic obstructive pulmonary disease 0.1
HF, heart failure; NYHA, New York Heart Association; BP, blood pressure; ACEi, angiotensin converting enzyme inhibitor; ARB, angiotensin receptor blocker; eGFR, estimated
glomerular filtration rate; KCCQ, Kansas City Cardiomyopathy Questionnaire.
Page 26
25
Supplementary table 2. Multivariable Model for the Association between Clinical Profiles and
the Highest Quartile of Estimated Plasma Volume Status (>5.5 ml/g)
OR 95% CI p-value
Age>75yrs 1.33 1.04 - 1.70 0.02
Female 1.85 1.46 - 2.35 <0.001
Diabetes 1.88 1.47 - 2.41 <0.001
Prior HF hospitalization 1.23 0.96 - 1.58 0.10
NYHA III or IV 1.65 1.30 - 2.10 <0.001
Systolic BP>110mmHg 0.69 0.46 - 0.99 0.05
Albumin >3.7mg/dl 2.27 1.78 - 2.90 <0.001
eGFR >60ml/min/1.73m² 0.68 0.53 - 0.86 0.001
OR, odd ratio; CI, confidence interval; HF, heart failure; NYHA, New York Heart Association; BP, blood pressure;
eGFR, estimated glomerular filtration rate.
Page 27
26
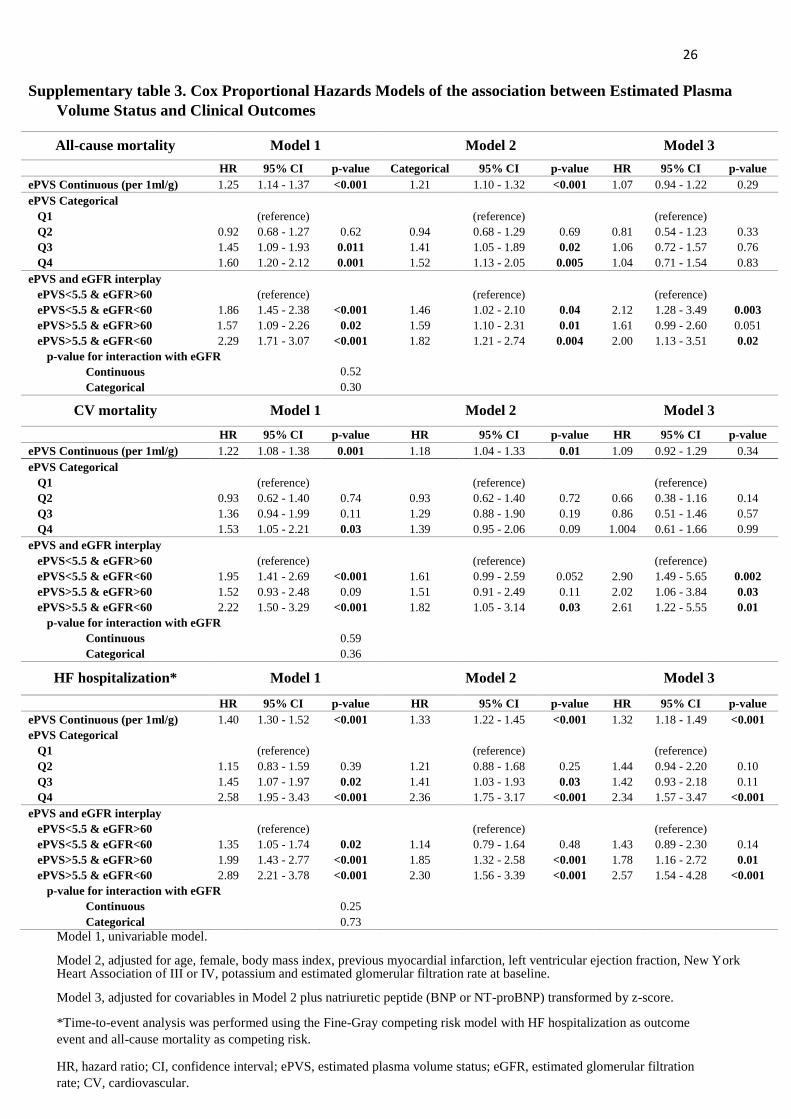
Supplementary table 3. Cox Proportional Hazards Models of the association between Estimated Plasma
Volume Status and Clinical Outcomes
All-cause mortality Model 1 Model 2 Model 3
HR 95% CI p-value Categorical 95% CI p-value HR 95% CI p-value
ePVS Continuous (per 1ml/g) 1.25 1.14 - 1.37 <0.001 1.21 1.10 - 1.32 <0.001 1.07 0.94 - 1.22 0.29
ePVS Categorical
Q1
(reference)
(reference)
(reference)
Q2 0.92 0.68 - 1.27 0.62 0.94 0.68 - 1.29 0.69 0.81 0.54 - 1.23 0.33
Q3 1.45 1.09 - 1.93 0.011 1.41 1.05 - 1.89 0.02 1.06 0.72 - 1.57 0.76
Q4 1.60 1.20 - 2.12 0.001 1.52 1.13 - 2.05 0.005 1.04 0.71 - 1.54 0.83
ePVS and eGFR interplay
ePVS<5.5 & eGFR>60
(reference)
(reference)
(reference)
ePVS<5.5 & eGFR<60 1.86 1.45 - 2.38 <0.001 1.46 1.02 - 2.10 0.04 2.12 1.28 - 3.49 0.003
ePVS>5.5 & eGFR>60 1.57 1.09 - 2.26 0.02 1.59 1.10 - 2.31 0.01 1.61 0.99 - 2.60 0.051
ePVS>5.5 & eGFR<60 2.29 1.71 - 3.07 <0.001 1.82 1.21 - 2.74 0.004 2.00 1.13 - 3.51 0.02
p-value for interaction with eGFR
Continuous 0.52
Categorical 0.30
CV mortality Model 1 Model 2 Model 3
HR 95% CI p-value HR 95% CI p-value HR 95% CI p-value
ePVS Continuous (per 1ml/g) 1.22 1.08 - 1.38 0.001 1.18 1.04 - 1.33 0.01 1.09 0.92 - 1.29 0.34
ePVS Categorical
Q1
(reference)
(reference)
(reference)
Q2 0.93 0.62 - 1.40 0.74 0.93 0.62 - 1.40 0.72 0.66 0.38 - 1.16 0.14
Q3 1.36 0.94 - 1.99 0.11 1.29 0.88 - 1.90 0.19 0.86 0.51 - 1.46 0.57
Q4 1.53 1.05 - 2.21 0.03 1.39 0.95 - 2.06 0.09 1.004 0.61 - 1.66 0.99
ePVS and eGFR interplay
ePVS<5.5 & eGFR>60
(reference)
(reference)
(reference)
ePVS<5.5 & eGFR<60 1.95 1.41 - 2.69 <0.001 1.61 0.99 - 2.59 0.052 2.90 1.49 - 5.65 0.002
ePVS>5.5 & eGFR>60 1.52 0.93 - 2.48 0.09 1.51 0.91 - 2.49 0.11 2.02 1.06 - 3.84 0.03
ePVS>5.5 & eGFR<60 2.22 1.50 - 3.29 <0.001 1.82 1.05 - 3.14 0.03 2.61 1.22 - 5.55 0.01
p-value for interaction with eGFR
Continuous 0.59
Categorical 0.36
HF hospitalization* Model 1 Model 2 Model 3
HR 95% CI p-value HR 95% CI p-value HR 95% CI p-value
ePVS Continuous (per 1ml/g) 1.40 1.30 - 1.52 <0.001 1.33 1.22 - 1.45 <0.001 1.32 1.18 - 1.49 <0.001
ePVS Categorical
Q1
(reference)
(reference)
(reference)
Q2 1.15 0.83 - 1.59 0.39 1.21 0.88 - 1.68 0.25 1.44 0.94 - 2.20 0.10
Q3 1.45 1.07 - 1.97 0.02 1.41 1.03 - 1.93 0.03 1.42 0.93 - 2.18 0.11
Q4 2.58 1.95 - 3.43 <0.001 2.36 1.75 - 3.17 <0.001 2.34 1.57 - 3.47 <0.001
ePVS and eGFR interplay
ePVS<5.5 & eGFR>60
(reference)
(reference)
(reference)
ePVS<5.5 & eGFR<60 1.35 1.05 - 1.74 0.02 1.14 0.79 - 1.64 0.48 1.43 0.89 - 2.30 0.14
ePVS>5.5 & eGFR>60 1.99 1.43 - 2.77 <0.001 1.85 1.32 - 2.58 <0.001 1.78 1.16 - 2.72 0.01
ePVS>5.5 & eGFR<60 2.89 2.21 - 3.78 <0.001 2.30 1.56 - 3.39 <0.001 2.57 1.54 - 4.28 <0.001
p-value for interaction with eGFR
Continuous 0.25
Categorical 0.73
Model 1, univariable model.
Model 2, adjusted for age, female, body mass index, previous myocardial infarction, left ventricular ejection fraction, New York Heart Association of III or IV, potassium and estimated glomerular filtration rate at baseline.
Model 3, adjusted for covariables in Model 2 plus natriuretic peptide (BNP or NT-proBNP) transformed by z-score.
*Time-to-event analysis was performed using the Fine-Gray competing risk model with HF hospitalization as outcome
event and all-cause mortality as competing risk.
HR, hazard ratio; CI, confidence interval; ePVS, estimated plasma volume status; eGFR, estimated glomerular filtration
rate; CV, cardiovascular.
Page 28
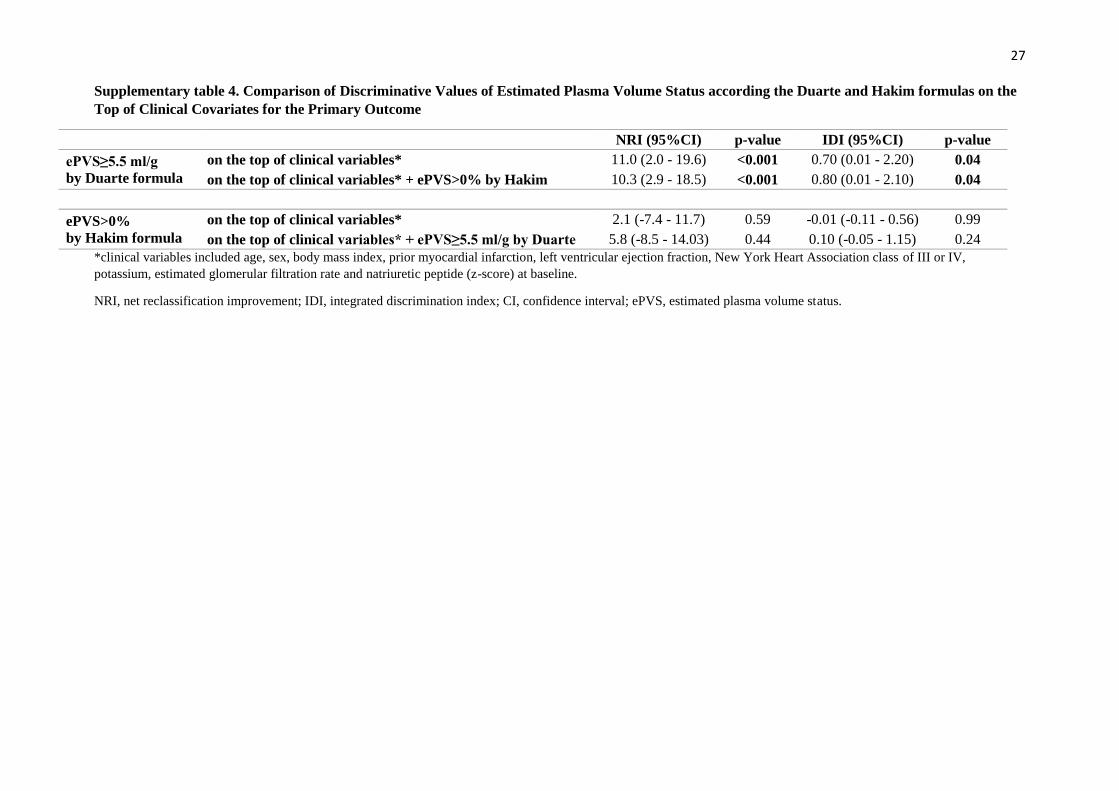
27 Supplementary table 4. Comparison of Discriminative Values of Estimated Plasma Volume Status according the Duarte and Hakim formulas on the
Top of Clinical Covariates for the Primary Outcome
NRI (95%CI) p-value IDI (95%CI) p-value
ePVS≥5.5 ml/g
by Duarte formula
on the top of clinical variables* 11.0 (2.0 - 19.6) <0.001 0.70 (0.01 - 2.20) 0.04
on the top of clinical variables* + ePVS>0% by Hakim 10.3 (2.9 - 18.5) <0.001 0.80 (0.01 - 2.10) 0.04
ePVS>0%
by Hakim formula
on the top of clinical variables* 2.1 (-7.4 - 11.7) 0.59 -0.01 (-0.11 - 0.56) 0.99
on the top of clinical variables* + ePVS≥5.5 ml/g by Duarte 5.8 (-8.5 - 14.03) 0.44 0.10 (-0.05 - 1.15) 0.24
*clinical variables included age, sex, body mass index, prior myocardial infarction, left ventricular ejection fraction, New York Heart Association class of III or IV,
potassium, estimated glomerular filtration rate and natriuretic peptide (z-score) at baseline.
NRI, net reclassification improvement; IDI, integrated discrimination index; CI, confidence interval; ePVS, estimated plasma volume status.