80
Program Management Contractor & Investment Partner Annual Report 2011 April 1, 2010 — March 31, 2011

Program Management Contractor & Investment Partner
Annual Report 2011April 1, 2010 — March 31, 2011
JGC
CO
RPO
RA
TIO
N A
nnu
al R
eport 2011

Profile
JGC Corporation was founded in 1928, and has since completed over 20,000 projects in
approximately 70 countries, making it one of the world’s top engineering contractors.
The Company has developed proprietary engineering technology and displayed unsurpassed
project management capabilities in the fields of petroleum refining and gas processing,
LNG, petrochemicals and other hydrocarbons, as well as those involving non-ferrous metals,
nuclear power, pharmaceuticals, hospitals, laboratories and numerous other sectors.
In order to respond to the diverse needs of its clients, JGC has moved beyond its role as an
engineering contractor to expand its investment business into domains such as power
generation and desalination, water, the environment, renewable energy and resource
development. At the same time, JGC provides planning and management services in the
urban development domain.
JGC recently launched its medium-term management plan, “New Horizon 2015,” under which
it has charted a course to become a “Program Management Contractor & Investment Partner.”

01 JGC Corporationannual report 2011

02 JGC Corporationannual report 2011

Corporate Philosophy
The JGC Group, with its core business of engineering-based ser-
vices, reaffirms its corporate policy of pursuing the highest standards
of performance and achieving enduring growth as a globally active
company, while contributing to world economic and social prosperity
as well as to the conservation of the earth’s environment.
Core ValuesEach and every person working in the JGC Group, from director to
employee, full-time or part-time, understands and adheres to the core
values stated below as integral to realizing corporate policy:
1. Decision-making: Highest ethical standards and sense of legal
responsibility
2. Conduct: Fairness and transparency
3. Corporate atmosphere: Progressive spirit and open mind
4. Corporate direction: Customer satisfaction and trust of society, as
well as corporate growth in harmony with society
Management PoliciesSharing these core values, the JGC Group seeks to continuously pro-
vide services and products based on the highest standards of technol-
ogy and in compliance with the following management policies:
1. Secure profit and realize continuous growth
2. Strengthen power of JGC Group technologies and establish innovative
technologies, as well as develop lines of business with vertical and
horizontal diversification
3. Accumulate and utilize capital and resources with provision for
the future
4. Maintain fair personnel policy and develop capabilities as well as
vitality of individuals
ResponsibilitiesAs a globally active entity with engineering-based services as its core
business, JGC Group makes the maximum effort to enhance its
corporate values and, in doing so, realize its corporate policy, with
the fullest level of recognition given to social responsibilities:
1. Conservation of the earth’s environment and engagement in cor-
porate activities beneficial to society
2. Accountability and integrity
3. Fair trade and fostering mutually beneficial relationships
4. Shareholders’ confidence
03 JGC Corporationannual report 2011

Principles of Business Conduct
For the long-term stability of the JGC Group and for its
further growth, each person working, from director to
employee, full-time or part-time, is required to keep in
mind clear principles of business conduct and perform his
or her daily activities in compliance with such principles.
Through continued stable operations, JGC Group achieves
its Corporate Philosophy by maintaining and honoring the
following principles derived from the previously stated
“Core Values”:
1. Decision-making: Highest ethical standards and sense of legal responsibility
(1) Behave in accordance with the highest ethical standards,
and in a socially acceptable manner.
(2) Understand the requirements, and observe the laws, regu-
lations and rules of the business conducted.
2. Conduct: Fairness and transparency(1) Be fair, honest and transparent at all times in conducting
business.
(2) Maintain integrity in all the relationships that constitute the
business being conducted.
3. Corporate atmosphere: Progressive spirit and open mind
(1) Maintain a progressive spirit not restricted merely to estab-
lished business practices, and behave at all times with a
sense of innovation and improvement not limited to tradi-
tional practices.
(2) Based on a will to achieve objectives, devote oneself to
the maximum extent possible as an individual and to
the team.
(3) Through free and aggressive exchanges, strive to enhance
the intelligence of the organization.
4. Corporate direction: Customer satisfaction and trust of society, as well as corporate growth in harmony with society
(1) Gain the trust of clients and shareholders by performing
faithfully and by providing an adequate level of information.
(2) Direct efforts at providing reliable services and products
that satisfy the client’s needs.
(3) Seek corporate growth together with the development of
society, in the knowledge that without prosperity of society
the JGC Group will not grow.
04 JGC Corporationannual report 2011

Management Vision
The first principle at JGC is to have an accurate grasp of customer
needs and to bring the Company’s unique intellectual capital to bear on
these needs, thereby contributing to prosperity by providing customer
satisfaction. Next, while moving forward with vertical integration and
horizontal expansion, the Company is responding to changing customer
requirements by using its operational assets in unlimited innovation,
striving to remain a trusted partner for success and a solutions provider.
05 JGC Corporationannual report 2011

Contents
07 Financial Highlights
08 To Our Shareholders
11 Special Feature
12 Special Feature 1
“New Horizon 2015” New Medium-Term Management Plan– Program Management Contractor & Investment Partner
14 Special Feature 2
Expanding Natural Gas Utilization
16 Review of Operations
20 Performance Highlights by Business Sector
21 Performance Highlights by Region
22 Major Projects
23 Major Contracts awarded
24 Environmental activities and Contribution to Society
27 Corporate Governance
30 Board of Directors, auditors and Executive Officers
31 Financial Section
74 JGC Group
75 Outline of JGC
Caution Regarding Forward-Looking StatementsThis annual report contains information about forward-looking statements related to such matters as the plans, strategies, and business results of JGC and the JGC Group. These forward-looking statements repre-sent judgments made by the Company based on information available at present and are inherently subject to a variety of risks (see page 37) and uncertainties. The Company’s actual activities and business results could differ significantly due to factors including, but not limited to, changes in the economic environment, business environment, demand, and exchange rates.
06 JGC Corporationannual report 2011

02007 2008 2009 2010 2011
200
400
600
800
608.5
551.0
460.1450.9
349.9
414.2
317.5
447.2
359.5
528.7
0
10
20
30
40
20.1
30.0
21.3
31.530.2
27.1
21.2
25.4
22.8
15.1
2007 2008 2009 2010 2011
600
400
200
0
800
301.3
402.3
348.7
506.1
440.5
733.5
675.5
618.2
569.1
255.0
2007 2008 2009 2010 20110
200
400
600
1,200
1,000
800744.6
632.8607.3
671.3641.7
982.5953.5
1,189.61,163.0
728.1
2007 2008 2009 2010 2011
Financial HighlightsFor the years ended March 31. Yen amounts are in millions except per share data.
Net Sales(Billions of yen)
Net Income(Billions of yen)
New Contracts(Billions of yen)
Outstanding Contracts(Billions of yen)
Millions of yen Thousands of
U.S. dollars
Consolidated 2011 2010 2009 2011
Net Sales ¥ 447,223 ¥414,258 ¥450,912 $ 5,378,509
Operating Income 63,559 41,919 52,003 764,390
Income Before Taxes on Income and Minority Interests
in Earnings of Consolidated Subsidiaries 52,771 37,850 49,444 634,648
Net Income 25,478 27,112 31,543 306,410
Net Income per Share (in yen and U.S. dollars) 100.83 107.25 124.76 1.21
New Contracts 618,203 733,549 506,135 7,434,793
Outstanding Contracts 1,189,606 982,594 671,341 14,306,747
Millions of yen Thousands of
U.S. dollars
Non-Consolidated 2011 2010 2009 2011
Net Sales ¥ 359,561 ¥317,597 ¥349,925 $ 4,324,245
Operating Income 51,918 32,145 41,356 624,390
Income Before Taxes on Income 45,205 27,934 44,578 543,656
Net Income 22,853 21,271 30,214 274,841
Net Income per Share (in yen and U.S. dollars) 90.44 84.15 119.50 1.09
New Contracts 569,128 675,505 440,548 6,844,598
Outstanding Contracts 1,163,078 953,511 641,781 13,987,717
Notes: 1. U.S. dollar amounts represent translations of Japanese yen, for convenience only, at the rate of ¥83.15=$1.00, the prevailing rate of exchange at March 31, 2011. 2. Net income per share is computed based upon the average number of shares of common stock outstanding during the period.
■ Consolidated■ Non-consolidated
■ Consolidated■ Non-consolidated
■ Consolidated■ Non-consolidated
■ Consolidated■ Non-consolidated
07 JGC Corporationannual report 2011

Record Operating Income in Fiscal 2010
In fiscal 2010, the year ended March 31, 2011, the support of shareholders and clients, as well as the hard work of
everybody in the Group, helped JGC to achieve consolidated net sales of ¥447.2 billion. In terms of earnings, we
recorded gross profit of ¥81.3 billion, operating income of ¥63.5 billion and net income of ¥25.4 billion. With the
exception of net income, all earnings figures were records for JGC. We paid a full-year dividend of ¥30.0 per share, as
planned. Contracts awarded reached ¥618.2 billion, eclipsing our consolidated target of ¥500.0 billion despite the
highly competitive market.
Our forecasts for fiscal 2011 are for consolidated net sales of ¥550.0 billion, operating income of ¥64.0 billion, and
net income of ¥42.0 billion. We have set a target for consolidated orders of ¥550.0 billion, and will do our best to
achieve this target.
The engineering and construction market for fiscal 2010 saw the effects of the global financial crisis that began in
the US in September 2008 almost completely disappear. Furthermore, the price of crude oil was stable at between $70
to $80 per barrel, energy demand rose and urbanization advanced in emerging markets, while populations grew in
resource-rich nations. Against this backdrop, many capital investment plans relating to oil, natural gas and petrochemi-
cals were implemented.
Under these conditions, JGC prevailed in the face of fierce competition. In Japan, we won an order for an LNG
receiving terminal, while overseas we won orders for a large-scale gas processing plant in Qatar, an LNG plant in
Indonesia, and a diesel hydrotreater project in Singapore, among other highlights. These achievements helped our
We would like to open this letter by thanking you for your ongoing support of JGC and the
JGC Group.
Fiscal 2011 is the first year of our New Horizon 2015 medium-term management plan.
Besides steadily executing strategies to achieve our numerical targets, we will forge ahead
with our transition to becoming a Program Management Contractor & Investment Partner,
which is a medium- to long-term goal.
Program Management Contractor & Investment Partner
To Our Shareholders
(left)Keisuke Takeuchi
Chairman of the Board of Directors and Chief Executive Officer
(right)Koichi Kawana
President and Chief Operating Officer
JGC Corporationannual report 201108

contracts awarded reach ¥618.2 billion on a consolidated basis, which exceeded our ¥500.0 billion target. Meanwhile,
in our investment business, we acquired equity interests in a water and waste water utility in Australia, and in a
concentrated solar power business in Spain. We have seen steady progress in the investment business in fiscal 2011
as well, and acquired an equity stake in a shale oil production and development business in the US.
Since the end of 2010, the world has witnessed democratic uprisings in Tunisia, Egypt, Libya and other countries in
the Middle East and North Africa. JGC has ongoing projects in Algeria, Qatar, Saudi Arabia, and Abu Dhabi. As these
countries have not experienced noticeable disorder, our projects have proceeded steadily without being affected.
Focus on Achieving Targets of New Medium-Term Management Plan.
Clients’ Continued Robust Capital Investments in Fiscal 2011.
Concentrating on Achieving EPC Business Order Target. Investment Business and
Management Services Business Also Being Vigorously Developed.
Fiscal 2011 is the inaugural year of our new medium-term management plan “New Horizon 2015.” The core strategies
of this plan focus on the EPC business, and investment and service businesses. We plan to steadily execute these
strategies to achieve our numerical targets and deliver the expected results.
As in fiscal 2010, investment in oil and gas resources around the world is expected to remain lively. Supporting this
robust investment activity is rising energy demand in emerging nations and resource-rich nations, as mentioned earlier.
Based on this forecast, fiscal 2011 capital investment is projected to exceed the fiscal 2010 level.
JGC Corporationannual report 2011 09

By region, in the Middle East and North Africa oil refining and gas chemicals project plans are taking shape
with the aim of adding value to oil and gas. At the same time, natural gas-related projects will move ahead against
the backdrop of rising demand for natural gas as a fuel for electricity generation and as a feedstock for gas chemi-
cals. In Asia and Oceania, it is expected that LNG demand will be spurred in Southeast Asian countries by lower
gas and LNG prices due to increased shale gas production volume in the US. Moreover, LNG demand in China and
India is expected to remain buoyant. In light of these conditions, many LNG projects are in the planning phase,
especially in Australia. Meanwhile, in Japan we expect to see continued capital investment in the biopharmaceuti-
cals field in particular.
Amid this anticipated market environment, JGC will concentrate all of its efforts in fiscal 2011 on attaining our
consolidated order target of ¥550.0 billion. Regarding projects we have long been working to win contracts for, such as
a petroleum refinery in Vietnam and LNG projects in Australia, we will strive to deliver results. We are also determined
to win against tough competition, drawing on the successes of the company-wide activities over the past few years
designed to strengthen our cost competitiveness.
As before, we will concentrate on participating in clients’ development plans from the earliest stage. At the same
time, in regions and fields where we can take full advantage of our competitive edge, we aim to maintain a solid
competitive position and translate that into orders. To strengthen our order-winning ability, we will make optimal
proposals that dovetail with clients’ project implementation policies on both the technology and cost fronts. We will also
continue to strengthen our cost competitiveness and will work to quickly nurture overseas EPC subsidiaries.
In the investment business, we have positioned as key fields under New Horizon 2015 the following: infrastructure-
related businesses such as power and water, the environment and new energy, and water; and resource development
businesses including oil and gas development and production. In addition, we will actively develop program manage-
ment services in smart city development projects already under way in India, as well as accelerate the commercializa-
tion of technologies presently under development.
We ask our shareholders for your continued support and guidance as we implement New Horizon 2015 to drive
further growth.
July 2011
Keisuke TakeuchiChairman of the Board of Directors
and Chief Executive Officer
Koichi KawanaPresident and Chief Operating Officer
10 JGC Corporationannual report 2011

Special Feature
“New Horizon 2015” New Medium-Term Management Plan– Program Management Contractor & Investment Partner
Special Feature 1
Special Feature 2
Expanding Natural Gas Utilization
11 JGC Corporationannual report 2011

Special Feature 1
Positioning
5-year plan focused on 10 years in the future
Transition to new corporate vision= Program Management Contractor
& Investment Partner
New Horizon 2015 Next Medium-Term Management Plan
2010 2015 2020
“New Horizon 2015” New Medium-Term Management Plan– Program Management Contractor & Investment Partner
In April 2011, JGC embarked on a new medium-term management plan entitled “New Horizon 2015,” which sets out new goals for the Company to achieve over the course of the next five years. Besides achieving numerical targets, under this new plan we aim to begin transforming our business model with the goal of becoming a “Program Management Contractor & Investment Partner,” as a milestone for the JGC Group from a medium- to long-term standpoint.
Aiming for Consolidated Net Income of ¥50.0 Billion in Fiscal 2015“New Horizon 2015” sets the goal of achieving consolidated net income of ¥50.0 billion in fiscal 2015, the fiscal year
ending March 31, 2016.
However, the plan does not set any targets for net sales. The reason for this is that we aim to expand our business
in the fields of enterprise investment and planning and management services, where performance cannot be accu-
rately gauged based on sales targets.
“New Horizon 2015” 10-Year MilestoneThe central goal of “New Horizon 2015” is to serve as a milestone in the transformation of the Group’s business model
over the medium and long term. Previously, JGC’s business model has been focused largely on the EPC business. In
the previous medium-term management plan, we added enterprise investment as a new business field. Now, under
“New Horizon 2015,” we plan to strengthen and expand in these two arenas, while adding planning and management
services business to our repertoire, bringing us closer to our goal of reinventing JGC as a Program Management
Contractor & Investment Partner. However, business model reform is a management issue of considerable complexity
and requires time to achieve. This is why we position “New Horizon 2015” as a mid-term goal with its focus set firmly
10 years in the future.
We have decided to transform our
business model because, since the EPC
business is greatly influenced by changes
in the market, being involved solely in the
EPC business produces large swings in
company performance. Competition in the
EPC business is also expected to escalate
in the near future. However, social infra-
structure fields such as water, electricity
and transportation will unquestionably
expand in size in tandem with economic
growth in emerging nations. We believe
that the fields to which the JGC Group can contribute will greatly broaden as a result.
Strengthening the EPC Business, Expanding and Developing Enterprise Investment and Services BusinessesIn light of these market forecasts, “New Horizon 2015” lays out a plan for strengthening our EPC business, while
expanding and developing enterprise investment and services businesses.
12 JGC Corporationannual report 2011

New Horizon 2015 Medium-Term Management Plan: Business Model
■ EPC business: Developing business in new sectors as well as existing sectors
■ Investment and Service: Increasing business investment and developing planning and management services
EPC business Investment/Service businesses
Business investment and operation
Planning and management services
Manufacturing, IT services, etc.
Existing sectors
New sectors
In the EPC business, we plan to enhance JGC’s cost competitiveness in overseas hydrocarbon projects. Parallel to
this, we will also develop new fields, as we seek to expand overseas in non-hydrocarbon sectors. Strengthening and
expanding EPC subsidiaries in Japan and overseas is a major pillar of our strategy. At overseas EPC subsidiaries in
particular, we will increase the workforce, with the aim of making them capable of executing small and medium-sized
local projects in an integrated manner entirely in-house.
In the investment business, we will actively invest in businesses that play to the strengths of the JGC Group. We
will therefore continue to concentrate on sectors such as power and new energy, resource development, water, and
the environment, but we will also invest in new fields. Plans call for the investment of around ¥100 billion over the
next 5 years.
In planning and management services,
we will provide services that help bring
customers’ business plans to fruition. We
believe that this business will enable us to
become involved in various domains such
as total management of customers’ busi-
ness plans, investment and EPC services.
JGC Group is poised to undergo a
major metamorphosis over the next five
years. While EPC will remain our core
business, we are looking to broaden our
horizons as a Program Management
Contractor & Investment Partner. We are
convinced that this path will lead the JGC Group to greater growth.
Urban and infrastructure development is a perfect context for
giving examples of how we seek to achieve our goal of becom-
ing a Program Management Contractor & Investment Partner.
Urban development requires the construction of various
systems and infrastructure, including medical, fire-prevention,
law enforcement, and other security systems which serve as
important lifelines supporting people’s daily lives, as well as
cultural and educational facilities. In recent years, the creation
of sustainable cities that provide comfortable, environmen-
tally-friendly living has also gained traction, along with the
concept of the “smart and compact community.”
JGC is engaged in the development of new cities and
infrastructure based on these concepts. As a first step, we
are conducting feasibility studies for achieving an environ-
mentally sound urban development (a “smart community”) in
Shendra in the Indian province of Maharashtra, as a part of
the Delhi-Mumbai Industrial Corridor Initiative being
promoted by the Indian and Japanese governments. This
project aims to develop the economies of regional cities and
will involve smart grids, recyclable water and waste process-
ing, environmentally friendly city structures and other ele-
ments. The aim is to create environmentally sound cities with
a low carbon footprint. JGC’s role is to accurately identify
needs in India, clarify what it will take to realize solutions,
and draw up a highly realistic blueprint that effectively inte-
grates the technology and expertise of Japanese partners,
centered on JGC. In a nutshell, this is what we mean by
“program management service.”
The Program Management Contractor & Investment Partner
is a new corporate vision for JGC. It entails cooperating with our
clients on planning, proposals, business promotion, operation
and management in accordance with clients’ needs and strate-
gies; offering the required EPC services for plants and infra-
structure; and at times participating as a business partner.
Delhi-Mumbai Industrial Corridor Feasibility Study—The First Step toward Becoming a Program Management Contractor & Investment Partner—
13 JGC Corporationannual report 2011

JGC constructed this large-scale gas processing plant in Qatar.
*1 International Energy Agency: World Energy Outlook 2010*2 BP: Statistical Review of World Energy 2000 and 2010
Expanding Natural Gas Utilization
Special Feature 2
—Natural Gas Today—At present, more than 80% of the world’s primary energy is supplied from fossil fuels such as coal, oil and natural gas.
Of all the fossil fuels, natural gas emits the lowest amount of carbon dioxide during combustion.
In its gaseous form, natural gas is difficult to transport and store, limiting the scope of its utilization compared with
coal and oil. However, natural gas usage has increased sharply in recent years along with the construction of inter-
national pipeline networks and the expanding use of LNG. By 2035, demand is expected to be more than 1.4 times*1
what it is today, equivalent to an annual growth rate of 1.4%. Furthermore, amid increasing demand for energy due to
growing populations and rising living standards, natural gas is seen as a “bridge” energy source in that it is expected to
bridge the time gap until renewable energies are widely available. Natural gas is also expected to see growing use as
the most efficient and practical energy resource for making the transition to a low-carbon society.
—Natural Gas and JGC—JGC is presently involved in large-scale gas processing projects in Algeria, the U.A.E. and Qatar, as well as LNG
projects in Australia and Indonesia. No other engineering contractor in the world is involved simultaneously in as many
gas-related projects. Since 1990, annual global gas production has increased by 50%, from approximately 2,000
billion cubic meters (bcm) to approximately 3,000 bcm*2. During this time, gas processing and LNG plants constructed
by JGC have produced more than 150 bcm annually in total. JGC’s share of annual global gas production over the past
20 years has been more than 15%.
14 JGC Corporationannual report 2011

JGC constructed this large-scale LNG plant in Indonesia.
—JGC’s Technology, Proposal and Project Management Capabilities—Since winning orders for a gas processing plant in Algeria and an LNG plant in Brunei in the 1970s that at the time
were the largest in the world, JGC has been continuously involved in the construction of many gas-related facilities. As
a result of handling various types of feed gas around the world, JGC has amassed considerable technological capabili-
ties and expertise. For instance, the standard production capacity of gas processing and LNG plants has increased by
a factor of more than five over the past 40 years. This is a result of clients and JGC precisely and boldly combining the
latest elemental technologies in various fields. At present, gas field development is subject to many more hurdles
standing in the way of the start of commercial production than in the past. These hurdles include higher levels of
impurities found in the gas, harsher natural environments surrounding the location of gas fields, the need for more
careful scrutiny of development procedures to ensure economic viability, and the need to take environmental concerns
into consideration. As one example of how JGC addresses higher levels of impurities, at gas processing plants under
construction in the U.A.E. and Qatar, JGC is installing the world’s largest sulfur recovery facilities. Furthermore, as an
environmental protection measure at the operational In Salah gas processing plant in Algeria and the Gorgon LNG
plant under construction in Australia, JGC has installed CCS (Carbon dioxide Capture and Storage) facilities that rein-
ject CO2 captured from the gas into underground reservoirs for storage. JGC may also participate in a client’s plans
from the initial stages, drawing on its wealth of technology and expertise to support the development of a viable busi-
ness. For example, at the In Salah gas processing project, JGC worked with the client to conduct a comparative study
of the production sequence at multiple gas fields over several decades. The project was developed after repeated test-
ing of economic viability.
—Contributing to Further Advances in Natural Gas—JGC has demonstrated its outstanding technological and project management capabilities in a host of projects, includ-
ing production of natural gas for a pipeline from North Africa to Europe, securing feedstock for gas-fired electricity
generation and gas chemicals in the Middle East, and production of LNG for users around the world. These capabilities
have supported the increasing global use of natural gas. Looking ahead, while striving for harmony with the natural
environment, JGC will continue to take up the challenge of contributing to advancements in the development and
utilization of natural gas resources. Examples include construction of FPSO (Floating Production, Storage and Offload-
ing) for offshore gas fields, and application of modular construction for remote locations.
15 JGC Corporationannual report 2011

Oil and Gas Development Projects
TOTAl ENGINEERING BUSINESS
Review of Operations
The market for the JGC Group’s total engineering business in fiscal 2010 saw lively capital investment in large-scale oil and natural gas developments in the Middle East and North Africa. This capital investment activity was spurred by consistently high crude oil prices, and rising energy demand in oil and gas producing nations, especially in the aforementioned regions. On the other hand, with new contractors having entered the market, particularly in Asia and Europe, competition to win orders was as severe as ever.In these circumstances, the JGC Group aggressively focused on winning orders by working to reduce the cost of plants in its tenders. As for projects currently under way, close attention was paid to a variety of risks to ensure successful project execution.Since the beginning of 2011, the Middle East and North Africa have been experiencing continuing civil unrest. Fortunately, however, JGC Group’s ongoing projects in the region have not been affected. In addition, the JGC Group’s workforce and assets were largely unaffected by the Great East Japan Earthquake, and ongoing projects did not sustain damage that would have a large impact on operating results.
In the field of oil and gas development, capital investment continues
in upstream areas, led by crude oil and natural gas development,
due to increasing demand for energy in oil and gas producing
nations, notably in the Middle East and North Africa.
In January 2011, JGC won an EPC service contract for a large-
scale gas processing plant in Qatar that is being promoted by the
state-run oil company and ExxonMobil. This project is one of the
largest orders for a natural gas processing plant that JGC has been
awarded to date. As showcased in the special feature section of this
annual report, “Expanding Natural Gas Utilization” (pages 14 to 15),
JGC’s extensive track record, technological capabilities and ability to
execute large projects have been recognized by clients. JGC believes
that this recognition led to the award of this order.
In 2010, JGC was awarded an EPC contract for a gas boosting
compressor station in the In Amenas region of Algeria for Sonatrach,
Algeria’s state-owned oil and gas company. Also in Algeria, JGC is
In the petroleum refining field, oil companies, led by the oil majors,
have been successively closing ageing refineries with high mainte-
nance costs in developed countries. Meanwhile, in China, India,
Brazil, Vietnam and certain other developing countries, plans exist to
construct and increase the capacity of petroleum refineries as these
countries become more motorized.
constructing a large gas processing facility for Sonatrach in the Gassi
Touil field, which is scheduled for completion in 2013. In addition, in
the Rhourde Nouss region of Algeria, JGC is working to complete gas
and oil separation facilities in 2011, and since the beginning of fiscal
2011, we have also won an EPC contract for crude oil processing
facilities in the Bir Seba region from Sonatrach and other parties.
In the Emirate of Abu Dhabi, United Arab Emirates (UAE), we are
constructing large-scale gas processing facilities for Abu Dhabi Gas
Industries Ltd. in the Habshan district. This project is scheduled for
completion in 2013.
In Saudi Arabia, we are executing an EPC services contract for the
state-owned oil company Saudi Aramco involving off-site facilities
(including a water-injection system used in oil fields, crude oil stor-
age tanks and shipping equipment) for a large-scale crude oil
processing facility in the Manifa region. This project is also sched-
uled for completion in 2013.
In December 2010 in Singapore, JGC was awarded an EPC
contract for a diesel hydrotreater project by ExxonMobil Asia Pacific
Pte. Ltd. This project has a target completion date in 2014.
In Japan, JGC revamped refining facilities for petroleum refining
companies, and carried out maintenance work.
Petroleum Refining Projects
16 JGC Corporationannual report 2011
In the new energy field, we are active in the area of gas to liquids
(GTL) as well as in dimethyl ether (DME) and other projects.
Currently in Qatar, JGC is providing project management services
for the world’s largest GTL project for Qatar Shell GTL Limited, a
subsidiary of Royal Dutch Shell plc. JGC’s role also includes project
management as well as EPCM activities for GTL synthesis. This
project began shipping products from Train 1 in June 2011, and
work is proceeding steadily toward completion.
In the nuclear power field, construction needs for nuclear power
plants are rapidly rising at present in the Middle East and Southeast
Asia. JGC has established a long track record of constructing radio-
active waste treatment facilities at nuclear power plants in Japan,
and has also completed numerous large-scale oil refineries and gas
processing plants in the Middle East and Southeast Asia. We believe
that our excellent project management capabilities, backed by our
technological capabilities in the nuclear power field and extensive
track record in overseas projects, will be useful in overseas nuclear
power plant projects. We therefore intend to actively pursue business
in this area in the future.
In the LNG field, an oversupply of LNG is expected to continue until
around 2015, due to the ongoing development of shale gas
processed in the U.S., and new LNG plants coming onstream in the
Middle East and elsewhere. Over the long term, however, we believe
that the demand for LNG will grow rapidly in Japan, as well as in
China, India and some countries in Southeast Asia, where energy
demand will increase even more sharply in the future. As a result, we
expect new LNG projects to continue to take shape, especially in
Southeast Asia, Oceania and Russia.
In January 2011, JGC won an EPC contract for an LNG plant in
Sulawesi in central Indonesia from Sulawesi LNG Development,
which is partially owned by Mitsubishi Corporation. In recent years,
the volume of LNG produced in Indonesia has declined in line with
declining gas production. This project will play an important role in
maintaining and increasing LNG production volume in Indonesia.
JGC has a wealth of experience in Indonesia and LNG projects, and
we drew on this experience in our continuous proposals to the client
from the plan conception stage, which helped us win the order. The
project is scheduled for completion in 2014.
In Australia, we are constructing the Gorgon LNG plant on Barrow
Island for the Chevron-operated Gorgon LNG joint venture. Plans call
for this project to begin producing LNG in 2014. Also in Australia,
JGC executed Front End Engineering and Design (FEED) services for
the Ichthys LNG project planned by INPEX Browse, Ltd. We are
currently preparing an estimate for EPC services for the LNG plant.
In Papua New Guinea, we are constructing an LNG plant for Esso
Highlands Limited, which is owned by Exxon Mobil and others.
Meanwhile, in Japan in October 2010, JGC was awarded the EPC
contract for an LNG receiving terminal in Hachinohe, Aomori Prefec-
ture, by JX Nippon Oil & Energy Corporation.
In the petrochemical and chemical products field, the manufacture of
commodity products such as ethylene and propylene continues to
shift from Japan and other developed countries to oil and gas produc-
ing countries in the Middle East, as well as China, India and other
emerging nations. We expect to see more project plans go ahead for
manufacturing highly price-competitive chemical products in the
Middle East due to the access to inexpensive oil and gas in this region.
We believe these moves apply not only to commodity products, but
also to high value-added, high-function “specialty products.” As such,
the Middle East is likely to become a major production base for petro-
chemical and chemical products going forward.
In Saudi Arabia, JGC conducted project management services for
a feasibility study on the development of the Rabigh Phase II project
(Rabigh II Project), which is being promoted by Sumitomo Chemical
Co., Ltd. and the state-owned oil company Saudi Aramco. JGC is
also working on a project in Saudi Arabia to construct large-scale
ethylene units and other facilities for Saudi Polymers Company. This
project is scheduled for completion in 2011.
In Japan, we are constructing a petrochemical plant for a major
oil company.
LNG Projects
Chemical Projects
Power Generation, Nuclear Power and New Energy Projects
17 JGC Corporationannual report 2011

In the field of pharmaceuticals, Japanese pharmaceutical companies
continue to make robust capital investments in facilities for antibod-
ies and high-potency active pharmaceutical ingredients.
Against this backdrop, in fiscal 2010, JGC won orders from
several major pharmaceutical companies for constructing facilities
for manufacturing antibodies and other substances. Construction
work on these projects is under way.
In September 2010, JGC established JGC Pharma Services Co., Ltd.
after acquiring all the shares of Tokyo CRO, Inc., which was engaged
in clinical development and pharmaceutical affairs consulting. Due
to this move, the JGC Group will now be able to offer wide-ranging
In the field of medical facilities, JGC has constructed high-quality
medical facilities throughout Japan and offered project management
services, both of which have received favorable evaluations from
many clients. Recently, an increasing number of projects have been
utilizing the Private Finance Initiative (PFI) method, where funding
and know-how from private-sector companies are used to efficiently
construct and operate local public hospitals. We intend to be actively
involved in this area, taking advantage of our expertise based on our
long history of working on projects in the medical field.
In fiscal 2010, JGC won a number of orders from hospitals. These
included a headquarters building for Ibaraki Resident Co-Operative
Union in Ibaraki Prefecture, the Nishi-Kumamoto Hospital for
Medical Co. LTA. in Kumamoto Prefecture, and a renovation project
for the Maki Hospital for the Hokuyokai Foundation in Hokkaido.
Furthermore, construction of a new wing is currently under way in
the refurbishing and management of the Tokyo Metropolitan Mental
Living and General Production Projects
Environmental Protection, Social Development and IT Projects
services in addition to EPC service for pharmaceutical facilities princi-
pally by JGC and services relating to the manufacture of pharmaceuti-
cal products, including Good Manufacturing Practice compliance.
Through JGC Pharma Services, the JGC Group will support the manu-
facturing of investigational products and pharmaceuticals, as well as
brokering their manufacture on a contract basis.
In the field of non-ferrous metal refining, JGC is involved in a
project to construct a nickel refining plant that is being promoted by
Sumitomo Metal Mining Co., Ltd. in the Taganito district in the north-
eastern part of the island of Mindanao in the Philippines. This project
is slated to begin production in 2013.
Health Center (tentative name), where JGC became the first domes-
tic engineering contractor to be selected as a hospital PFI operator.
In addition, JGC is also constructing residences for the elderly for the
nursing business company I.P.C. Ltd. in Ibaraki Prefecture, carrying
out renovation work on the Morita Hospital for the Yushinkai Foundation
in Kanagawa Prefecture. At the beginning of 2011, we completed a
project in Fukuoka Prefecture to expand the care wing of Inoue
Hospital for the Seishinkai Foundation. Since the beginning of fiscal
2011, we have completed a project in Niigata Prefecture to rebuild
Kido Hospital for the Niigata Medicalcare Cooperative.
In the area of research facilities, in mid 2010 we completed
construction of a new research wing at the Fukuyama plant for
Yasuhara Chemical Co., Ltd. in Hiroshima Prefecture, and at the
beginning of 2011 completed construction of a new pharmaceutical
research building for Mitsubishi Tanabe Pharma Corporation in
Kanagawa Prefecture.
Enterprise Investment Business
JGC positioned expansion of the enterprise investment business as a
key strategy of its previous medium-term management plan. We set
a target of investing ¥40.0 billion over 5 years in businesses where
we could make use of our unique knowledge. In the year ended
March 2011, the final year of the plan, we had invested almost
¥40.0 billion. Furthermore, we began to book dividends and equity-
method earnings from some of the projects we invested in during the
initial stages of the plan.
In fiscal 2010, we embarked on a bio-ethanol production and
power plant business together with ITOCHU Corporation and other
partners in the Philippines in April 2010. In May 2010, we acquired
Trility (formerly United Utilities Australia Pty Limited), an Australian
water company together with Mitsubishi Corporation, Innovation
Network Corporation of Japan, and others. In September 2010, we
teamed up with Spanish company Abengoa Solar to own concentrat-
ing solar power plants in Spain. The same month, we began
18 JGC Corporationannual report 2011

In fiscal 2010, the business environment was extremely difficult, as
clients postponed and re-examined their business plans and the
product market contracted amid economic stagnation in Japan, the
main market for this business. In response to this environment, JGC
Group companies in the catalyst and fine products business made
efforts to improve profitability. These efforts included undertaking
price negotiations with clients, reducing manufacturing costs, trim-
ming fixed expenses, and efficiently assigning personnel. As a result
of these efforts, while sales declined year on year, operating income
increased substantially.
In the catalysts business, sales of FCC catalysts, for which we hold
the leading market share in Japan, saw demand plateau as the
increase in demand which had been spawned by domestic clients
shifting to heavy oil ran its course. In hydrotreating catalysts, sales
declined as clients put off catalyst replacement plans.
In the fine products business, demand for products in the IT field
was strong due mainly to economic growth in emerging markets, led
by China and India. In particular, sales of materials for hard disk
abrasives, and antireflective and antistatic materials for flat-panel
displays increased, supported by a strong IT-related market, espe-
cially in China, South Korea and Taiwan. Additionally, sales of cath-
ode materials for lithium-ion batteries used in hybrid cars and
electric vehicles increased sharply to clients in and outside of Japan.
The market environment for the catalysts and fine products busi-
ness in fiscal 2011 is expected to see a continuation of harsh condi-
tions for the catalysts business due to sluggish domestic demand.
However, the fine products business should see robust conditions
continue in IT-related fields, including antireflective and antistatic
materials, and lifestyle-related fields such as raw materials for
cosmetics. Moreover, demand for cathode materials for lithium-ion
batteries is expected to remain high. In this climate, JGC Group
companies in the catalysts and fine products businesses will work to
develop new products such as catalysts that require no rare earths or
substantially reduced amounts and additives. At the same time, they
will rigorously reduce various costs, and actively work to develop new
clients in response to the testing business environment. We will also
work to improve profitability for all of our products, accelerate
advances into overseas markets, and build a new business base.
constructing a demonstration plant for upgrading low-grade Indone-
sian coal into a fuel that can be used as an alternative to petroleum
in a project with Indonesia’s Sinarmas Group.
Since the beginning of fiscal 2011, we have acquired shale oil
properties in the U.S. in June 2011. Shale oil has attracted consid-
erable attention in recent times. Together with project operator
Chesapeake, we will forge ahead with production and development.
In July 2011, JGC announced that a gas column had been discov-
ered in an exploratory well at a gas field in the U.S., where JGC
holds a 9.5% share in assets. The well is scheduled to start gas
production in early 2012.
The current status of the projects invested in to date is as follows:
Power Generation and Water Desalination Business
Business rights to two projects acquired in Abu Dhabi. Power gener-
ation and desalination facilities are currently operating commercially.
Business rights to one project acquired in Saudi Arabia. Power
generation and desalination facilities are currently operating
commercially.
Water Business
JGC is jointly operating a seawater desalination business in China,
together with a partner company.
Along with Mitsubishi Corporation, JGC invested in Ebara
Engineering Services Co., Ltd., a water business subsidiary of
EBARA Corporation. In April 2011, this company was renamed
Swing Corporation and is presently offering a wide range of services
as a comprehensive water company.
Emissions Credits Business
JGC has already developed four emissions credits business projects
in China. Of these, two projects are smoothly issuing CER (Certified
Emission Reduction) credits.
Resource Development Business
One oil and gas field development and production project under way
in the U.S. At present, the equivalent of 1,000 barrels per day of
crude oil and natural gas and oil are being produced and sold.
Under “New Horizon 2015,” JGC’s new medium-term management
plan launched in April 2011, JGC plans to focus on its enterprise
investment business and has earmarked around ¥100.0 billion for
investment over 5 years, mainly in the power generation, water,
environment, renewable energy and resource development fields.
CATAlYSTS AND FINE PRODUCTS BUSINESS
19 JGC Corporationannual report 2011

0
2007 2008 2009
200
400
600
800(Billions of yen)
2010 2011
0
300
600
900
2007 2008 2009 2010 2011
(Billions of yen)
0
200
400
600
800
1,000
1,200(Billions of yen)
2007 2008 2009 2010 2011
Performance Highlights by Business SectorAll figures are on a consolidated basis.
Net Sales (Millions of yen)Years ended March 31 2011 2010 2009 2008 2007
■ Oil and Gas Development 150,688(149,895)
59,382(58,753)
51,304(48,470)
78,500(78,200)
134,557(134,151)
■ Petroleum Refining 40,292(8,711)
110,566(31,894)
89,838(36,182)
131,116(48,809)
130,194(68,191)
■ LNG 61,512(58,969)
42,428(41,122)
36,261(35,627)
89,680(89,013)
69,128(67,838)
■ Chemical 84,377(64,049)
111,216(87,611)
145,769(102,095)
122,250(80,806)
170,579(142,965)
■ Power Generation, Nuclear Power and New Energy
20,869(12,621)
20,391(12,359)
25,281(16,230)
34,096(21,365)
30,813(20,347)
■ Living and General Production 17,255(7,938)
8,128(1,502)
35,743(7,836)
30,509(14,277)
18,294(4,389)
■ Environmental Protection, Social Development and IT
25,344(46)
16,488(15)
20,788(1)
18,144(35)
14,127(2,726)
■ Others 10,851(6,937)
7,827(3,578)
6,654(2,059)
4,419(252)
5,766(558)
Total Engineering Business and Other Business (Overseas)
411,191(309,170)
376,430(236,837)
411,642(248,503)
508,717(332,762)
573,463(441,169)
incl. Total Engineering Business incl. Other Business
401,1989,992
——
——
——
——
■ Catalysts and Fine Products 36,031 37,828 39,270 42,345 35,067 Total 447,223 414,258 450,912 551,062 608,530
New Contracts (Millions of yen)Years ended March 31 2011 2010 2009 2008 2007
■ Oil and Gas Development 264,042(263,483)
352,087(351,358)
268,868(268,519)
11,301(8,398)
30,288(29,889)
■ Petroleum Refining 67,188(52,129)
39,358(13,228)
50,826(7,716)
79,191(20,479)
89,179(27,423)
■ LNG 180,096(157,267)
233,553(233,382)
31,284(21,963)
16,019(15,541)
14,804(13,943)
■ Chemical 24,838(9,288)
25,492(6,495)
78,492(60,685)
243,907(215,637)
61,524(21,268)
■ Power Generation, Nuclear Power and New Energy
23,575(8,463)
15,038(2,249)
20,373(13,349)
17,756(6,153)
31,142(21,517)
■ Living and General Production 29,255(79)
48,902(34,325)
6,759(463)
10,441(122)
48,748(21,452)
■ Environmental Protection, Social Development and IT
11,280(94)
11,046(34)
43,376(1)
19,234(15)
20,077(118)
■ Others 17,924(13,351)
8,069(3,844)
6,153(1,493)
4,498(247)
5,580(470)
Total (Overseas)
618,203(504,157)
733,549(644,918)
506,135(374,193)
402,352(266,596)
301,347(136,084)
incl. Total Engineering Business incl. Other Business
608,2889,914
——
——
——
——
Outstanding Contracts (Millions of yen)Years ended March 31 2011 2010 2009 2008 2007
■ Oil and Gas Development 614,768(614,621)
501,414(501,034)
227,740(227,460)
38,128(35,362)
103,294(103,131)
■ Petroleum Refining 64,920(45,772)
38,024(2,354)
110,037(21,798)
150,081(51,065)
204,138(81,418)
■ LNG 351,466(323,610)
232,881(225,311)
44,960(36,255)
50,612(50,594)
128,195(127,988)
■ Chemical 47,415(38,787)
106,953(93,548)
212,230(194,217)
304,917(261,032)
187,487(130,426)
■ Power Generation, Nuclear Power and New Energy
22,247(4,877)
19,541(9,035)
27,677(21,927)
33,594(25,817)
51,336(42,411)
■ Living and General Production 61,030(25,590)
49,029(33,449)
9,040(1,410)
37,939(8,683)
53,894(18,690)
■ Environmental Protection, Social Development and IT
19,533(67)
33,597(19)
39,040(0)
16,408(—)
15,864(20)
■ Others 8,222(7,010)
1,149(596)
613(42)
1,144(590)
468(5)
Total (Overseas)
1,189,606(1,060,337)
982,594(865,351)
671,341(503,112)
632,827(433,147)
744,679(504,092)
incl. Total Engineering Business incl. Other Business
1,187,7541,851
980,6641,929
——
——
——
20 JGC Corporationannual report 2011

0
300
600
900
2007 2008 2009 2010 2011
(Billions of yen)
0
200
400
600
800
1,000
1,200(Billions of yen)
2007 2008 2009 2010 2011
0
200
400
600
800
2007 2008 2009 2010 2011
(Billions of yen)
Performance Highlights by RegionAll figures are on a consolidated basis.
Net Sales (Millions of yen)Years ended March 31 2011 2010 2009 2008 2007
■Japan 102,020 139,592 163,138 175,952 132,297
■Asia 31,240 28,197 64,730 95,128 84,425
■Middle East 181,683 141,355 175,392 212,916 322,437
■Africa 40,899 30,533 7,068 21,494 32,695
■North and South America 4,633 18,425 76 1,289 1,479
■Europe and CIS 1,342 5 38 404 127
■Oceania 49,372 18,320 1,196 1,532 0
Total Engineering Business and Other Business 411,191 376,430 411,642 508,717 573,463
■Catalysts and Fine Products 36,031 37,828 39,270 42,345 35,067
Total 447,223 414,258 450,912 551,062 608,530
New Contracts (Millions of yen)Years ended March 31 2011 2010 2009 2008 2007
■Japan 114,045 88,630 131,942 135,753 165,269
■Asia 189,614 45,547 14,327 15,181 63,951
■Middle East 264,921 228,985 299,650 232,030 60,103
■Africa 13,504 134,106 47,609 7,556 9,095
■North and South America 23,100 9,305 85 9,830 481
■Europe and CIS 2,391 142 38 8 47
■Oceania 10,625 226,831 12,483 1,991 2,398
Total 618,203 733,549 506,135 402,352 301,347
Outstanding Contracts (Millions of yen)Years ended March 31 2011 2010 2009 2008 2007
■Japan 129,268 117,243 168,228 199,679 240,587
■Asia 202,270 43,896 28,170 79,082 157,214
■Middle East 544,495 461,257 409,148 338,897 323,251
■Africa 111,569 138,964 41,250 2,125 19,191
■North and South America 18,816 349 9,298 9,256 710
■Europe and CIS 1,187 137 0 0 396
■Oceania 181,999 220,746 15,244 3,787 3,328
Total 1,189,606 982,594 671,341 632,827 744,679
21 JGC Corporationannual report 2011

Major Projects
Business Sector Client Project Location
Contracts Awarded
Oil and Gas Development Projects Ras Gas Company Limited Gas Processing Plant Ras Laffan/Qatar
Petroleum Refining Projects ExxonMobil Asia Pacific Pte. Ltd. Petroleum Refining-related Plant Jurong/Singapore
LNG Projects Sulawesi LNG Development LNG Plant Luwuk/Indonesia
JX Nippon Oil & Energy Corporation LNG Receiving Terminal Aomori/Japan
Environmental Protection, Social Development
and IT Projects
Ibaraki Resident Co-operative Union Headquarters Building Ibaraki/Japan
Medial Co. LTA. Hospital Kumamoto/Japan
Hokuyokai Foundation Hospital Hokkaido/Japan
Contracts Underway
Oil and Gas Development Projects Abu Dhabi Gas Industries Ltd. Gas Processing Plant Habshan/Abu Dhabi
Sonatrach Gas Processing Plant Gassi Touil/Algeria
Sonatrach Gas & Oil Separation Facilities Rhourde Nouss/Algeria
Saudi Arabian Oil Co. (Saudi Aramco) Utilities, Storage and Shipping Facilities for
the Central Processing Facilities
Manifa/Saudi Arabia
LNG Projects Chevron Australia Pty Ltd LNG Plant Barrow Island/Australia
Esso Highlands Limited LNG Plant Port Moresby/Papua New Guinea
Chemical Projects Saudi Polymers Company Petrochemical Plant Al Jubail/Saudi Arabia
Power Generation, Nuclear Power and New
Energy Projects
Qatar Shell GTL Ltd. GTL Plant Ras Laffan/Qatar
Living and General Production Projects DENKA SEIKEN Co., Ltd. Pharmaceutical-related Facilities Niigata/Japan
Environmental Protection, Social Development
and IT Projects
Medical Management Matsuzawa Co., Ltd. Hospital Tokyo/Japan
Niigata Medicalcare Cooperative Hospital Niigata/Japan
I. P. C Ltd. Senior Citizen Complex Ibaraki/Japan
Yushinkai Foundation Hospital Kanagawa/Japan
Contracts Completed
LNG Projects INPEX Browse, Ltd. FEED Service for LNG Plant Darwin/Australia
Environmental Protection, Social Development
and IT Projects
YASUHARA CHEMICAL Co., Ltd. Research Center Hiroshima/Japan
22 JGC Corporationannual report 2011

Major Contracts awarded
announced as of March 31, 2008Business Sector* Client Project Location Completion
CHM Saudi Polymers Company Petrochemical Plant Al Jubail/Saudi Arabia 2011
ENV Sanden Corporation Research & Development Center Gunma/Japan 2008
ENV Shijinkai Foundation Hospital Saitama/Japan 2009
ENV Seiryoukai Foundation Hospital Hyogo/Japan 2009
ENV Maruho Co., Ltd. Renovation of Research & Development Center
Kyoto/Japan 2008
announced as of March 31, 2009Business Sector* Client Project Location Completion
OGD Sonatrach Gas & Oil Separation Facilities Rhourde Nouss/Algeria 2011
OGD Saudi Arabian Oil Co. (Saudi Aramco) Utilities, Storage and Shipping Facilities for the Central Processing Facilities
Manifa/Saudi Arabia —
LNG INPEX Browse, Ltd. FEED Service for LNG Plant Darwin/Australia —
LIV TOA EIYO LTD. Pharmaceutical-related Facilities Fukushima/Japan 2010
ENV Medical Management Matsuzawa Co., Ltd. Hospital Tokyo/Japan 2013
ENV Niigata Medicalcare Cooperative Hospital Niigata/Japan 2011
announced as of March 31, 2010Business Sector* Client Project Location Completion
OGD Abu Dhabi Gas Industries Ltd. Gas Processing Plant Habshan/Abu Dhabi 2013
Sonatrach Gas Processing Plant Gassi Touil/Algeria 2013
LNG Chevron Australia Pty Ltd. LNG Plant Barrow Island/Australia —
Esso Highlands Limited LNG Plant Port Moresby/Papua New Guinea
—
CHM Saudi Arabian Oil Co. (Saudi Aramco) and Sumitomo Chemical Co., Ltd.
Engineering and Project Management Services for the Feasibility Study
Rabigh/Saudi Arabia —
LIV DENKA SEIKEN Co., Ltd. Pharmaceutical-related Facilities Niigata/Japan 2011
ENV I. P. C Ltd. Senior Citizen Complex Ibaraki/Japan 2012
Yushinkai Foundation Hospital Kanagawa/Japan 2011
YASUHARA CHEMICAL Co., Ltd. Research Center Hiroshima/Japan 2010
* BUSINESS SECTOR OGD: Oil and Gas Development Projects PET: Petroleum Refining Projects LNG: LNG Projects CHM: Chemical Projects PWR: Power Generation, Nuclear Power and New Energy Projects LIV: Living and General Production Projects ENV: Environmental Protection, Social Development and IT Projects
23 JGC Corporationannual report 2011

JGC has formulated the JGC CSR Policy, which took effect from fiscal 2011. Guided by this basic policy, the JGC Group will
continue to involve itself in activities that make further contributions to the well-being and prosperity of society.
Environmental activities and Contribution to Society
JGC CSR (Corporate Social Responsibility) PolicyJGC is committed to fulfilling its role as an organization func-
tioning within society (Corporate Citizenship). We recognize
that the foundation of our business activities is strengthened
by our contributions to the prosperity of the world economy
and society, and to the sustainable development of society
and the global environment.
To meet this commitment, JGC hereby establishes the follow-
ing principles, which shall be applied throughout its operations.
1. We shall conduct our business with a full understanding of the importance of quality, safety, and the environment.
2. We shall make our contributions to society based on our strengths as a company.
3. We shall comply with legal requirements inside and outside the country, and conduct our business in a fair and honest manner following a proper governance system.
4. We shall disclose necessary information to our stakehold-ers in a timely and appropriate manner.
5. We shall endeavor to maintain and further improve fair human resource management to develop the ability and vitality of our employees based on the principles of mutual trust and responsibility.
6. We shall promote the awareness of CSr and further develop our CSr activities reflecting the voices of stakeholders.
Environmental ActivitiesJGC’s Engineering & Construction (E&C) business, which
provides engineering, procurement and construction (EPC)
services for energy-related plants such as those for oil and
natural gas, is closely related to environmental protection in
and of itself.
Since the 1960s, JGC has worked on environmental issues
as an engineering contractor, striving to develop cleaner petro-
leum products, make its plants more energy-efficient, and
eliminate the production of hazardous waste. Our understand-
ing that our business activities can themselves contribute to
environmental protection has not changed today, and this is
symbolically expressed in our corporate philosophy.
Furthermore, we are expanding our environmental protec-
tion activities into a wider range of fields outside of our EPC
business, including our new clean development mechanism
(CDM) business which we are developing as part of our enter-
prise investment initiatives.
Activities focused on how to provide our customers with
plants that place a minimum burden on the environment are
also an important part of JGC’s environmental management
approach. We engage in testing various techniques and
improvements at each stage of our EPC business, and our
methods have been evaluated highly by our clients.
Measures taken to lessen the burden on the environment
at the home office and construction sites involved in EPC
activities are the foundation supporting JGC’s environmental
management efforts. CO2 reductions at the home office and
reduction/recycling of waste products at construction sites are
producing improved results every year.
Considering HSE in Business ActivitiesThe JGC Group executes projects around the world in busi-
ness sectors ranging from resource development, oil, natural
gas, and petrochemicals, to the environment, catalysts and
fine chemicals, pharmaceuticals, water resources, and new
energy. Through all these projects, the JGC Group strives to
always fully consider factors concerning health, safety, and the
environment (HSE). HSE aspects must of course be consid-
ered in EPC services, but they must also be considered in
marketing and at all project stages, from feasibility studies to
maintenance and plant decommissioning, as well as our
investment and services businesses. The JGC Group has
added HSE factors to its engineering and management capa-
bilities, as it aims to help create a sustainable society.
In this section, we look at some examples of how the JGC
Group considers the environment at the construction planning
and construction stages of project execution.
<Construction Planning Stage>Meticulous concern for sustainability at plant construction
sites is essential. In many countries, construction of new
plants requires submission of an environmental impact
assessment (EIA) report for the purpose of minimizing envi-
ronmental impacts wherever possible. The EIA report
describes in detail the impacts that construction work will
have on the air, water, soil, flora, fauna, and marine life. JGC
applies environmental management systems to construction
work to ensure that we demonstrate consideration for the
environment in compliance with EIA reports, emphasizing the
following points:
➊ We practice strict legal compliance and environmental
risk management by identifying environmental laws and
regulations and environmental considerations that have
a bearing on construction work.
24 JGC Corporationannual report 2011

➋ We endeavor to increase customer satisfaction and
reinforce communication with stakeholders.
➌We manage environmental risks and endeavor to mini-
mize the possibility of incidents which may have a
negative impact on the environment by anticipating,
preparing for, and speedily responding to emergencies.
Before starting construction work, we consider the above
matters and unfailingly perform the following preliminary work:
➊ identifying environmental impacts of the construction work
➋ Setting environmental objectives and targets for the
construction work
➌preparing an environmental management plan for
construction work
➍providing new workers with environmental education
and training
We incorporate the Zero Emissions Initiative, a JGC Group
independent environmental conservation initiative, into this
preliminary work, and thoroughly confirm environmental
conservation measures before starting construction.
<Construction>Construction work by JGC is preceded by thorough consideration
of possible effects on the environment at the planning stage.
Matters decided in the Construction Environmental Manage-
ment Plan include the project environmental policy, which
organizations and persons will be responsible for environment-
related work, what environmental protection measures will be
put in place, guidelines for environmental performance moni-
toring and measurement, emergency prevention and mitigation
procedures, environmental monitoring, and monthly reporting.
Following the start of construction, a review of the environmen-
tal aspects of the project (the relationship between construc-
tion work and the environment) is conducted to confirm
whether the construction work differs from the plan. If any
deviations are found, the plan is revised to ensure that there
are no omissions in the environmental considerations included
in the environmental management framework.
Continuous Improvement of Environmental Management SystemsIn December 2003, JGC obtained international standard ISO
14001 certification for its environmental management systems
from Lloyd’s Register Quality Assurance (LRQA).
After two renewals, JGC completed the fiscal 2010
maintenance examination in March 2011, which included
overseas sites.
Making Environmental Improvement Activities More Applicable to Core BusinessEnvironmental improvement activities at JGC’s headquarters
in the past have tended to center on the reduction of waste,
paper, and electricity consumption. For this reason, the
challenge for JGC has been to shift focus to environmental
improvement activities more related to its core business. In
order to address this challenge, all department heads took
part in discussions about how to identify environmental
aspects in their primary work and review target-setting proce-
dures. These discussions established the following shared
awareness:
· It is important to strive for the development of a sustainable
society by addressing environmental problems through core
businesses, and to link this with the creation of corporate
value and greater competitiveness.
· Amid rising global concern over environmental problems,
JGC has been helping to address environmental issues
directly and indirectly through its core business activities.
JGC recognizes that its pursuit of sustainability must be
undertaken in its core businesses.
· JGC is mindful of the following points for achieving continu-
ous development.
➊ Maintaining and managing operations so as not to cause
environmental problems.
➋ Making continuous improvements so as to raise earn-
ings, while considering the environment.
Based on this shared understanding, JGC has continued to
explore the significance of environmental targets and goals,
and has promoted environmental management activities along
the following lines:
· Environmental management activities based on environmen-
tal targets and goals are business operations in themselves,
rather than separate activities.
· The operating policies of divisions and departments are set
with the aim of raising the actual performance of the organi-
zation and business operations.
· The operating policies themselves are quality targets.
· The environmental targets of departments with an indirect
environmental impact are to be considered as quality targets.
In this way, JGC’s environmental management system is
loosely linked to the quality management system, and JGC
promotes environmental improvement activities that are appli-
cable to its core businesses.
Construction Waste RecyclingJGC aims to minimize final waste through rigorous implemen-
tation of the Zero Emissions Initiative. In fiscal 2010, JGC
lowered the final disposal rate to 4.1% in construction work in
Japan, close to its goal of no more than 4%. Each site uses
industrial waste management survey forms prescribed by the
Company to confirm the recycling rate with intermediate waste
disposers before contracting with them. Because there is a
large difference among waste disposers in terms of the
disposal method for construction sludge and the recycling rate
in particular, an extensive comparative analysis of each
company is conducted regarding the disposal methods and
disposal costs. Furthermore, appropriate plans for separating
waste are drawn up before the commencement of
25 JGC Corporationannual report 2011

The fiscal 2011 award ceremony for qualifiers of the JGC-S scholarship
The KAUST Faculty
KICP member, and based on its technological prowess and
expertise developed over many years of plant engineering and
construction activities, JGC also supports the creation of next-
generation technology and the training of personnel that will
contribute to the progress of both Saudi Arabia and interna-
tional society. In September 2010, Japanese lecturers offered
12 lectures about Japan, introducing the country’s technolo-
gies and culture. A total of 335 people attended these
lectures, which received glowing evaluations by attending
students and faculty.
JGC-S Scholarship Foundation: Support for the Next GenerationThrough the JGC-S Scholarship Foundation, JGC contributes
to the cultivation of scientists and the advancement of science
and technology in Japan and overseas. The foundation was
established in March 1968 with an endowment by JGC
Founder Masao Saneyoshi. Its principal undertakings include
provision of educational loans and grants to Japanese univer-
sity and graduate school students majoring in science and
technology fields, grants to foreign students studying in Japan,
and research funding assistance for young researchers. Up to
2010, the foundation had provided educational loans to a total
of 13,354 students, educational grants to 4,846 students, and
research funding assistance to 1,986 researchers. Annual
disbursements have reached ¥351.65 million. Furthermore,
the foundation established a special category that substantially
expanded the ordinary category for funding recipients attend-
ing foundation-designated universities that suffered damage in
the Great East Japan Earthquake that struck Japan on March
11, 2011 to support affected students. Over the past year, the
foundation took steps to shift administration to a public inter-
est incorporated
foundation. Follow-
ing receipt of the
required certifica-
tion, the foundation
made a new start on
April 1, 2011 as the
JGC-S Scholarship
Foundation.
JGC Social Welfare FoundationThe JGC Social Welfare Foundation develops and provides
welfare equipment for persons with physical disabilities, as
well as funding for support groups and volunteer organizations
for senior citizens and persons with disabilities in Kanagawa
Prefecture. Since its establishment in March 1994, the foun-
dation had made 514 contributions to support groups, 335
contributions to volunteer organizations and 25 contributions
to other groups through fiscal 2010. In fiscal 2010, it made
39, 21 and 2 contributions to such groups, respectively.
construction based on the nature of the waste generated.
During construction, efforts are made to improve the recycling
rate by rigidly enforcing waste separation in accordance with
the plan.
Social Contribution ActivitiesIn the new JGC CSR Policy, which took effect from the begin-
ning of fiscal 2011, JGC has systematically organized its ongo-
ing social contribution activities.
Basic Policy for Social Contribution ActivitiesThe JGC Group has declared that it will contribute to the
sustainable development of society and the global environ-
ment in the JGC CSR Policy. The Group has specified four key
fields for realizing this and for conducting suitable social
contribution activities.
<Four Key Fields>1. Environment actively contribute to environmental conservation2. Education Support the professional development of future
engineers3. Science and Technology Support science and technology as the basis for
sustainable development4. Community Contribution Contribute to the sustainable development of the
communities where we conduct business
Here we introduce some examples of actual activities in
the areas of education, science and technology, and commu-
nity contribution.
KAUST Industry-University Collaboration ProgramIn Saudi Arabia, JGC has been participating as one of the
member companies of the KAUST Industrial Collaboration
Program (KICP), an industrial collaboration program promoted
by the King Abdullah University of Science & Technology
(KAUST), which opened in 2009.
KAUST is a graduate-studies level university established by
an initiative of King Abdullah as a research base in such
advanced technology fields as resources, energy, water, the
environment, biotechnology, life sciences, catalysts, nanotech-
nology, and computer science. With support from the Japa-
nese Ministry of
Economy, Trade and
Industry for the past
three years, JGC
has facilitated
academic and
cultural exchanges
between Japan and
Saudi Arabia. As a
26 JGC Corporationannual report 2011

Corporate Governance Framework
Executive Officer System
JGC has introduced an executive officer system, which clari-
fies the division of management decision-making and over-
sight functions from executive functions. This has further
enhanced management efficiency and strengthened the
Company’s executive accountability system.
Board of Directors
The Board of Directors, headed by the Chairman of the
Board of Directors, has 15 members and meets twice a
month in principle. The Company also has five corporate
auditors (including three outside auditors) who regularly
attend board meetings.
The Company recognizes the importance of mainly
appointing directors with a high degree of EPC business
knowledge and who are well-versed in a wide range of busi-
ness markets. As a result, at present the Board of Directors
comprises only internal directors with abundant experience.
However, the Company will continue to consider the appoint-
ment of outside directors in the future based on the avail-
ability of suitable candidates.
Meetings for the Execution of Business Operations
The Company has a Director and Executive Officer Commit-
tee, which meets once a month in principle for the purposes
of sharing information regarding management policies and
their status, and reporting/confirming the status of opera-
tions. The Chairman of the Board of Directors heads this
committee, which is composed of directors, executive offi-
cers, and corporate auditors.
The Management Strategy Committee meets once a
week in principle to examine important matters for JGC
and the JGC Group relating to management strategy. The
Chairman Emeritus of the JGC Group heads this committee,
which is comprised of directors, corporate auditors, and
other members.
JGC has also established the Operations Steering
Committee to consult and make decisions related to the
execution of operations of the Company and the JGC Group.
Chaired by the President, this committee includes corporate
auditors and other individuals selected by the President. The
committee meets twice a month in principle.
In addition, a Nominating Committee and an Assessment
Committee have been established to enhance fairness and
transparency in the selection of executive personnel and in
the determination of compensation issues. The Nominating
Committee and the Assessment Committee each meet once
a year in principle.
Board of Auditors
The Company has adopted the “company with internal audi-
tors” model to preserve the effectiveness of corporate gover-
nance by strengthening the framework of conducting audits
by corporate auditors. At present, the Board of Auditors has
five corporate auditors, including three outside appoint-
ments. In collaboration with the Internal Audit department
and the accounting auditor, corporate auditors attend meet-
ings of the Board of Directors and other important meetings,
offer necessary comments when appropriate, and further
improve corporate governance through hearings regarding
the business execution of the company’s divisions and
through surveys of domestic and overseas offices and plants.
The three outside corporate auditors have no personal,
capital, or trading relationships or other conflicts of interest
with the Company.
Improving Our Corporate Value by Fulfilling Our Social ResponsibilitiesJGC is keenly aware of the importance of corporate governance. Recognizing the need to foster that awareness in our corporate
culture and climate, we have formulated the JGC Corporate Philosophy. Through awareness-raising, education and training, we
will work to win the public’s trust and maintain harmony with society in our corporate activities.
Under the JGC Corporate Philosophy, we are working to increase corporate value and realize the principles set out in this philoso-
phy while keeping corporate social responsibility in mind. At the same time, we make it a rule to strive for fairness and transpar-
ency in our corporate activities, in accordance with the Company’s code of conduct.
Corporate Governance
27 JGC Corporationannual report 2011

Independent Auditor
The certified public accountants who audit JGC’s accounts
are Makoto Ishikawa, Kazutoshi Isogai and Yoshihisa Uchida
of KPMG AZSA LLC. Four other CPAs and seven other indi-
viduals assist in carrying out these audits.
Status of the Internal Control System
JGC has established an Internal Auditing Office to monitor,
evaluate and improve the effectiveness of the internal control
systems of JGC and of the Group as a whole, as well as to
carry out individual audits where necessary. Additionally,
JGC has created management authority regulations that
specify the authority and responsibilities of all management
personnel, thereby clarifying the system of accountability for
corporate management and executive functions. JGC has
also established Group management regulations for each
Group member firm.
In terms of compliance, JGC’s Legal & Compliance Office
has compiled a corporate ethics and regulatory compliance
manual, and conducts regular education and training to
ensure a high level of fairness and transparency in all the
Group’s business activities. In addition, we are working
through our PR and IR department to foster the timely and
appropriate disclosure of corporate information.
Status of the Risk Management System
JGC has established a Risk Management Committee as part
of a comprehensive risk management system designed to
systematically identify risks throughout the Group. In particu-
lar, project risk management is conducted in three broad
stages: 1) the project selection stage, 2) the estimate and
bidding stage, and 3) the execution stage.
1) Project Selection Stage
The Global Marketing Division is constantly gathering a wide
range of project information based on various factors such
as region, client, and technical field, and activities to obtain
orders are conducted based on the study and evaluation of
the following points:
· Project size (value)
· Technical expertise and experience required
· Country risk
· Allocation of engineers
· Competitive environment, etc.
The results of these studies and evaluations are used in
determining JGC’s level of interest in the respective projects.
2) Estimate and Bidding Stage
After acquiring requirement documents from the client, the
Project Divisions organize an estimate team, and examine
the details of the bid. After the details have been identified, a
Risk Study Committee meeting is held to analyze project-
specific risks.
Major risk management points are:
· Clarity of the project plan and scope of responsibility
· Client’s project funding plan and project execution policy
· Level of technology required and degree of difficulty
· Price and supply-demand trends for materials, machinery
and labor
· Degree of difficulty in meeting deadlines
· Existence of excessive contractual obligations
· Competitiveness of bidding environment
· Appropriateness of the project execution plan
A detailed estimate policy is drawn up and an estimate is
created based on this risk analysis.
3) Execution Stage
Problems and other matters affecting the budget and timing
that occur during execution of the project are reported in a
timely manner, and problem areas are analyzed.
The Project Divisions regularly hold Project Review
Committee meetings to ask the project manager for status
reports, and if improvement is needed, smooth project
management is supported through instructions and assis-
tance designed to bring about appropriate improvements.
Regarding crisis management, the Company has estab-
lished a Security Management Section to gather and process
information related to risk management, conduct risk manage-
ment training, and respond to any urgent issues that arise.
Furthermore, the JGC Group has also established a
Personal Information Protection Policy and Personal Infor-
mation Protection Regulations to build a system for manag-
ing personal information centered on those employees with
duties that involve the handling of this information.
28 JGC Corporationannual report 2011
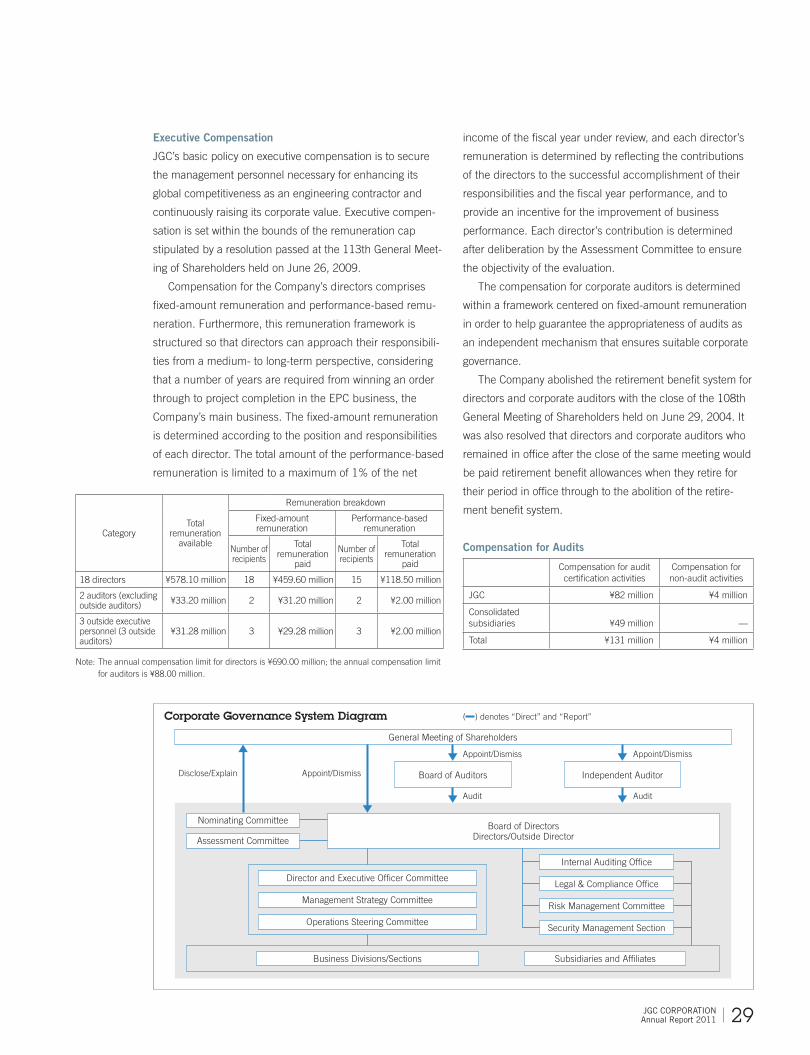
General Meeting of Shareholders
Board of Auditors Independent Auditor
Appoint/Dismiss
Appoint/Dismiss
Audit
Appoint/Dismiss
Audit
Board of DirectorsDirectors/Outside Director
Nominating Committee
Assessment Committee
Internal Auditing Office
Legal & Compliance Office
Risk Management Committee
Security Management Section
Director and Executive Officer Committee
Management Strategy Committee
Operations Steering Committee
Disclose/Explain
Business Divisions/Sections Subsidiaries and Affiliates
Corporate Governance System Diagram ( ) denotes “Direct” and “Report”
Executive Compensation
JGC’s basic policy on executive compensation is to secure
the management personnel necessary for enhancing its
global competitiveness as an engineering contractor and
continuously raising its corporate value. Executive compen-
sation is set within the bounds of the remuneration cap
stipulated by a resolution passed at the 113th General Meet-
ing of Shareholders held on June 26, 2009.
Compensation for the Company’s directors comprises
fixed-amount remuneration and performance-based remu-
neration. Furthermore, this remuneration framework is
structured so that directors can approach their responsibili-
ties from a medium- to long-term perspective, considering
that a number of years are required from winning an order
through to project completion in the EPC business, the
Company’s main business. The fixed-amount remuneration
is determined according to the position and responsibilities
of each director. The total amount of the performance-based
remuneration is limited to a maximum of 1% of the net
income of the fiscal year under review, and each director’s
remuneration is determined by reflecting the contributions
of the directors to the successful accomplishment of their
responsibilities and the fiscal year performance, and to
provide an incentive for the improvement of business
performance. Each director’s contribution is determined
after deliberation by the Assessment Committee to ensure
the objectivity of the evaluation.
The compensation for corporate auditors is determined
within a framework centered on fixed-amount remuneration
in order to help guarantee the appropriateness of audits as
an independent mechanism that ensures suitable corporate
governance.
The Company abolished the retirement benefit system for
directors and corporate auditors with the close of the 108th
General Meeting of Shareholders held on June 29, 2004. It
was also resolved that directors and corporate auditors who
remained in office after the close of the same meeting would
be paid retirement benefit allowances when they retire for
their period in office through to the abolition of the retire-
ment benefit system.
Compensation for Audits
Compensation for audit certification activities
Compensation for non-audit activities
JGC ¥82 million ¥4 million
Consolidated subsidiaries ¥49 million —
Total ¥131 million ¥4 million
CategoryTotal
remuneration available
Remuneration breakdown
Fixed-amount remuneration
Performance-based remuneration
Number of recipients
Total remuneration
paid
Number of recipients
Total remuneration
paid
18 directors ¥578.10 million 18 ¥459.60 million 15 ¥118.50 million
2 auditors (excluding outside auditors) ¥33.20 million 2 ¥31.20 million 2 ¥2.00 million
3 outside executive personnel (3 outside auditors)
¥31.28 million 3 ¥29.28 million 3 ¥2.00 million
Note: The annual compensation limit for directors is ¥690.00 million; the annual compensation limit for auditors is ¥88.00 million.
29 JGC Corporationannual report 2011

Chairman Emeritus of JGC GroupYoshihiro Shigehisa
Vice Chairman and DirectorMasahiko Yaegashi
Chairman and Chief Executive Officer*Keisuke Takeuchi
Executive Vice President* and Senior General Manager, Corporate Strategy OfficeSei Tange
Executive Vice PresidentTadashi Ishizuka
Executive Vice President*Tadanori Aratani
President and Chief Operating Officer*Koichi Kawana
Senior Managing Directors
Yutaka YamazakiSenior General Manager, International Project Division
Eiki FurutaSenior General Manager, Global Marketing Division
Managing Directors
Hideaki MiuraSenior General Manager, Engineering Division
Tsutomu AkabaneGeneral Manager, International Project Division
Masayuki SatoSenior General Manager, Corporate Administrative & Financial Affairs Division and Chief Financial Officer
Directors
Toyohiko ShimadaSenior General Manager, Business Planning & Government/Industry Relations Office
Yasumasa IsetaniSenior General Manager, Business Promotion & Execution Division
Satoshi SatoGeneral Manager, International Project Division
Hiroyasu FukuyamaGeneral Manager, Global Marketing Division
Corporate Auditors
Teruo Nakamura
Minoru Sakuma**
Toshiyuki Tsuchida
Masaru Yamamoto**
Masao Mori**
Executive Officers
Yusuke ShinodaGeneral Manager, Business Promotion & Execution Division
Keiichi ShibataGeneral Manager, International Project Division
Yoshimichi MurakamiSenior General Manager, Industrial & Domestic Energy Project Division
Tadao Takahashi President, JGC Gulf International Ltd.
Shigeru AbeGeneral Manager, International Project Division
Takashi YasudaSenior General Manager, Research & Development Division and Chief Technology Officer
Yasushi MomoseGeneral Manager, Global Marketing Division
Toru KikuchiSenior General Manager, China Business Development Office
Yutaka YamanakaGeneral Manager, Engineering Division
Hiroshi BunazawaGeneral Manager, International Project Division
Shin MatsuiProject Director, Ichthys LNG Project, International Project Division
Hitoshi KitagawaGeneral Manager, Industrial & Domestic Energy Project Division
Tokutaro NomuraGeneral Manager, Project Operation Services Division
Shigeo KobayashiProject Director, Gasco IGD Project, International Project Division
Yoshikatsu NishidaGeneral Manager, Business Promotion & Execution Division
Yuji KatoGeneral Manager, Business Promotion & Execution Division
Hisakazu NishiguchiSenior General Manager, Legal & Compliance Office
Kazuyoshi MutoSenior General Manager, Project Operation Services Division
Takahiro KoboriGeneral Manager, Engineering Division
Yasutoshi OkazakiProject Director, NSRP Project, International Project Division
Note: * Representative Directors ** Outside Auditor
Board of Directors, Auditors and Executive OfficersAs of July, 2011
30 JGC Corporationannual report 2011

Financial Section
Contents
32 Six-Year Summary—Consolidated
33 Analysis of Performance and Financial Position
37 Risks Impacting Operations
38 Consolidated Balance Sheets
40 Consolidated Statements of Income
41 Consolidated Statements of Comprehensive Income
42 Consolidated Statements of Changes in Net Assets
43 Consolidated Statements of Cash Flows
44 Notes to Consolidated Financial Statements
61 Internal Control Report
62 Independent Auditors’ Report
63 Six-Year Summary—Non-Consolidated
64 Non-Consolidated Balance Sheets
66 Non-Consolidated Statements of Income
67 Non-Consolidated Statements of Changes in Net Assets
68 Notes to Non-Consolidated Financial Statements
73 Independent Auditors’ Report
JGC CORPORAtION Annual Report 2011 31

Six-Year Summary—ConsolidatedFor the six years ended March 31. Yen amounts are in millions except per share data.
2011 2010 2009 2008 2007 2006
Net Sales ¥ 447,223 ¥414,258 ¥450,912 ¥551,062 ¥608,530 ¥ 550,301
Operating Income 63,559 41,919 52,003 44,896 26,413 20,389
Net Income 25,478 27,112 31,543 30,020 20,187 15,011
Total Current Assets 319,464 283,538 335,220 324,617 327,333 231,777
Total Current Liabilities 174,293 137,728 208,023 217,339 237,586 175,428
Working Capital 145,171 145,810 127,197 107,278 89,747 56,349
Current Ratio 183.3% 205.9% 161.1% 149.4% 137.8% 132.1%
Net Property and Equipment 64,634 66,058 66,509 68,450 67,220 65,688
Total Assets 468,503 430,176 480,279 466,773 470,286 375,288
Long-Term Debt, Less Current Maturities 6,624 21,926 23,255 17,300 17,799 993
Total Net Assets 264,483 246,141 224,488 207,537 189,239 173,355
New Contracts 618,203 733,549 506,135 402,352 301,347 807,649
Outstanding Contracts 1,189,606 982,594 671,341 632,827 744,679 1,024,348
Net Income per Share (in yen) 100.83 107.25 124.76 118.33 79.52 58.33
Cash Dividends per Share (in yen) 30.0 21.0 30.0 21.0 15.0 11.0
Number of Employees 5,826 5,795 5,739 4,723 4,531 4,205
JGC CORPORAtION Annual Report 201132

Our View of the Operating EnvironmentThe global economy generally moved onto a recovery track during the fiscal year under review thanks to the benefits of pump-priming strategies in various countries. There was, however, the risk of a downturn in some regions. Japan’s economy showed signs of recovery in some quarters. However, economic activity was muted after the Great East Japan Earthquake, with the future outlook for the economy remaining uncertain.
In oil and gas producing countries, which have the greatest impact on JGC Group’s total engineering business, capital investment continued to be planned and executed in a host of countries due to rising energy demand and consistently high crude oil prices. In the Middle East in particular, there was greater development of natural gas due to increasing demand for natural gas as a fuel source in power generation, water desalination plants and other applications, as populations in the region grow and countries urbanize. Furthermore, in Southeast Asia and Oceania, natural gas-related projects are being planned and progressively implemented, particularly those related to LNG plants.
The Great East Japan Earthquake caused some physical damage to Group facilities, but operations continued as normal, meaning there was no impact on operating results. In the past year, the world witnessed large-scale democratic uprisings in some parts of the Middle East and North Africa. However, the Group does not have any ongoing projects in the areas involved, so there has been no impact on operating results to date.
Under these conditions, in the fiscal year under review, the Group’s total engineering business worked to strengthen its order-winning ability. As a result, orders received were higher than the Group’s initial target. Paying close attention to the various risks involved, the Group worked to steadily implement projects, including those currently being carried out.
Results of OperationsConsolidated net sales for the Group in the year ended March 31, 2011 were ¥447,223 million, up 8.0% year on year. Con-solidated operating income climbed 51.6% to ¥63,559 million. Consolidated net income declined 6.0% to ¥25,478 million.
Net SalesReflecting steady progress in projects accounted for on a percentage of completion basis, consolidated net sales increased ¥32,965 million year on year to ¥447,223 million.
Cost of Sales, and Selling, General and Administrative ExpensesCost of sales was ¥365,824 million, increasing ¥11,918 million year on year in line with higher net sales. Selling, general and administrative expenses declined ¥593 million to ¥17,840 million.
Operating IncomeOperating income increased ¥21,640 million to ¥63,559 million in line with higher net sales. The operating income ratio was 14.2%, compared with 10.1% in the previous fiscal year.
Other Income (Expenses)Other expenses, net were ¥10,788 million, compared with ¥4,069 million in the previous fiscal year. While interest and divi-dend income increased, provision for doubtful accounts declined, and gain on sales of marketable and investment securities increased, the Group recorded an exchange loss, net and a settlement package charge. Income before taxes on income and minority interests in earnings of consolidated subsidiaries increased ¥14,921 million to ¥52,771 million.
Taxes on IncomeIncome tax and other taxes increased ¥11,062 million to ¥23,493 million. This increase reflected an increase in income before taxes on income and minority interests in earnings of consolidated subsidiaries and a decrease in tax expenses for tax calculation purposes. Deferred taxes on income were ¥3,520 million, meaning tax expenses (net) came to ¥27,013 million.
Analysis of Performance and Financial Position
JGC CORPORAtION Annual Report 2011 33

Minority Interests in Earnings (Losses) of Consolidated SubsidiariesMinority interests, primarily consisting of earnings allocated to minority shareholders of consolidated subsidiary JGC-ITC Rabigh Utility Co., Ltd., were ¥280 million, an improvement of ¥397 million year on year.
Net IncomeAs a result of the above, net income decreased by ¥1,634 million to ¥25,478 million.
Segment InformationReporting SegmentNet sales in the total engineering business rose ¥36,369 million to ¥401,199 million, the result of steady progress with projects accounted for on a percentage of completion basis. Operating income was ¥57,688 million, due to the higher net sales.
Net sales in the catalysts and fine products business declined ¥1,797 million, to ¥36,031 million, the result of clients pushing back and re-examining business plans. However, operating income rose ¥2,406 million, to ¥4,989 million, reflecting efforts to reduce manufacturing costs and fixed expenses, as well as efforts to increase profitability through the efficient assignment of personnel, and other measures. The total engineering business accounted for 90% of net sales and 91% of operating income.
Effective from the fiscal year under review, the Group adopted “Accounting Standard for Disclosures about Segments of an Enterprise and Related Information” and “Guidance on Accounting Standard for Disclosures about Segments of an Enterprise and Related Information.”
Financial PositionConsolidated total assets at March 31, 2011 totaled ¥468,503 million, a year-on-year increase of ¥38,327 million.
Total liabilities increased ¥19,985 million to ¥204,020 million.Total net assets were ¥264,483 million, up ¥18,342 million year on year.The shareholders’ equity ratio was 56.3%.Balance sheet indicators for the Group were as follows:
Mar. 2009 Mar. 2010 Mar. 2011
Current ratio (%) 161 206 183Fixed asset ratio (%) 65 60 56
Notes: Current ratio: Current assets/current liabilities Fixed asset ratio: (Net property and equipment + total other assets)/total net assets All indicators are calculated using consolidated financial figures.
■ Total Engineering Business■ Catalysts and Fine Products Business
Net Sales by Reporting Segment(Billions of yen)
0
100
200
300
400
500
600
20102007 2008 2009
364.8
411.6
573.4
508.7
401.1
39.2 37.842.335.0 36.0
2011
Effective from the year ended March 31, 2011, the Company adopted “Accounting Standard for Disclosures about Segments of an Enterprise and Related Information” and “Guidance on Accounting Standard for Disclosures about Segments of an Enterprise and Related Information.” Figures for the fiscal year ended March 31, 2010 have been retroactively restated.
JGC CORPORAtION Annual Report 201134

Cash FlowCash and cash equivalents on a consolidated basis increased ¥38,086 million to ¥161,894 million.
Net cash provided by operating activities was ¥48,215 million, mainly reflecting ¥52,771 million in income before taxes on income and minority interests in earnings of consolidated subsidiaries and income taxes paid.
Investing activities provided net cash of ¥116 million, the net result mainly of investments in new fields and proceeds from sales of affiliated company shares.
Financing activities used net cash of ¥7,317 million, mainly for cash dividends paid.Cash flow indicators for the Group are as follows:
Mar. 2009 Mar. 2010 Mar. 2011
Shareholders’ equity ratio (%) 46.6 57.1 56.3Shareholders’ equity ratio (market basis, %) 58.8 98.0 104.9Years to redemption of liabilities (years) 0.7 — 0.4Interest coverage ratio (times) 47.1 — 86.2
Notes: Shareholders’ equity ratio: (Total net assets–minority interests)/total assets Shareholders’ equity ratio (market basis): Total market value of shares/total assets Years to redemption of liabilities: Interest-bearing liabilities/net operating cash flow Interest coverage ratio: Net operating cash flow/interest expenses
*All indicators are calculated using consolidated financial figures. * Interest-bearing liabilities include all liabilities posted on the Consolidated Balance Sheets on which interest was paid. Net operating cash flow is
taken from the cash flow provided by operating activities, as reported in the Consolidated Statements of Cash Flows. Interest paid is taken from the amount of interest paid as reported in the Consolidated Statements of Cash Flows.
*Years to redemption of liabilities and interest coverage ratio are not shown for fiscal years in which net cash is negative.
Analysis of New ContractsNew contracts on a consolidated basis totaled ¥618,203 million. This figure exceeded our initial forecast of ¥500,000 million.
A breakdown of new contracts by business sector and region is as follows:
New Contracts by Business Sector(Billions of yen)
Mar. 2010 Mar. 2011
Mar. 2011 Percentage of new contracts
Oil and gas development projects 352.0 264.0 42.7%Petroleum refining projects 39.3 67.1 10.9%LNG projects 233.5 180.0 29.2%Chemical projects 25.4 24.8 4.0%Other projects 83.0 82.0 13.2%
■ Shareholders’ EquityShareholders’ Equity Ratio
Shareholders’ Equity and Shareholders’ Equity Ratio(Billions of yen/%)
Free Cash Flows(Billions of yen)
2007 2008
10.1
–45.0
65.1
13.8
–60
–20
–40
0
20
40
60
80
2009 2010
48.3
20110
10
20
30
40
60
50
2007 2008
40.2
44.446.646.6
0
50
100
150
250
200
300
2009 2010
223.8223.8
245.8
57.1
188.9188.9207.2207.2
263.9263.9
56.3
2011
JGC CORPORAtION Annual Report 2011 35

New Contracts by Region(Billions of yen)
Mar. 2010 Mar. 2011
Mar. 2011 Percentage of new contracts
Japan 88.6 114.0 18.4%Asia 45.5 189.6 30.7%Africa 134.1 13.5 2.2%Middle East 228.9 264.9 42.9%Oceania and Others 236.2 36.1 5.8%
The consolidated outstanding contracts totaled ¥1,189,606 million, after adjustments for currency exchange and revision to contract figures.
Future OutlookIn the total engineering business, we expect the desire to invest in plant facilities to remain firm in the Group’s key markets centered on the Middle East, North Africa and Southeast Asia, due to increasing energy demand against a backdrop of increasing populations and economic growth. At the same time, the competitive environment is expected to remain severe because of escalating competition to win orders on the part of newly-emerging contractors. Amid these conditions, fiscal 2011, the year ending March 31, 2012, is the inaugural year of our medium-term management plan “New Horizon 2015” under which we aim to become a “Program Management Contractor & Investment Partner.” With this goal in mind, we plan to strengthen and expand our business domains in our core EPC business, as well as our enterprise investment business and planning and services business, to achieve greater growth as a group.
In the catalysts and fine products business, the outlook for the domestic market is filled with uncertainty. In the fine prod-ucts business in particular, companies will continue to develop operations overseas in light of the buoyant market conditions in China, South Korea, Taiwan and other markets. Furthermore, we intend to form cooperative relationships with overseas catalysts companies, step up the pace at which we develop sales in overseas markets, bolster exports of environmental cata-lysts to Europe and the U.S., expand sales in the Chinese market and progressively move production bases overseas. In addi-tion, we will develop and produce new materials in the environment and energy fields for next-generation vehicles, solar power generation and other applications.
Other< Nigeria LNG Project >In respect of the investigation of the members of the TSKJ consortium in connection with the captioned projects which were awarded since 1995, as announced on April 7, 2011, JGC reached the settlement with the U.S. department of Justice (DOJ) for the resolution of the investigation relating with JGC, and paid US $218.8 million to DOJ. As announced on January 31, 2011, JGC also reached the settlement with the Nigerian authority as of January 7th, 2011 in relation to the captioned projects, and paid US $28.5 million to the Nigerian authority. The amounts for these two settlements were already accrued as Special Loss in the Fiscal year ending March 2011.
In 2002, JGC established an office which is exclusively devoted to compliance issues and since then JGC has been making efforts for the promotion of compliance. JGC hereby advises that it is committed to reviewing, and making further improvements to, its compliance program.
JGC CORPORAtION Annual Report 201136

The following matters regarding risks associated with the businesses of the JGC Group could potentially have an effect on the judgments and decisions of investors.
Forward-looking statements are based on the best information available and give consideration to the overall activities of the JGC Group as of March 31, 2011.
1. Risks With Overseas CausesOverseas businesses generate about 70% of the JGC Group’s total net sales. Such businesses are subject to country risks—economic, political and social. These include political unrest, wars, revolutions, civil strife, changes in economic policy, default on foreign debts and changes in exchange and taxation systems. To minimize the effects on its businesses arising from these risks, the JGC Group continuously reviews and reinforces its risk management system, carries trade insurance, recovers receivables as early in a project as possible, forms joint ventures, and takes various other steps. However, when changes in the business environment are more radical than anticipated, and projects are canceled, suspended or delayed, the possibility of a negative impact on JGC’s performance arises.
2. Risks Affecting Project ExecutionAlmost all contracts for projects in which the JGC Group participates are lump sum, full-turnkey contracts. However, to enable hedging of some of the risks in these contracts, the Group uses cost-plus-fee contracts and contracts based on the cost dis-closure estimate method, depending on the project. The Group draws fully upon its past experience to anticipate and incorpo-rate into each contract provisions for dealing with the risks that threaten to arise during its execution. When confronted with unforeseen impediments to the execution of a project, including sudden steep rises in the costs of materials, equipment, machinery and labor, outbreaks of disease, natural disasters, or if the JGC Group’s actions or a problem during project execu-tion should cause a major accident, the economics of a project can be adversely affected, which can have a negative impact on the JGC Group’s performance.
3. Risks Affecting Investing ActivitiesThe JGC Group invests in resource development businesses including oil, gas, and new fuels, as well as water and power generation businesses, and the global warming gas-emissions credits business. In making these decisions, specific criteria are in place to facilitate new investments and reinvestments, monitoring of existing businesses, as well as decisions to with-draw from businesses, thereby ensuring the execution of appropriate risk management. However, unanticipated dramatic changes in the investing environment, such as sudden price fluctuations in oil, gas or other energy resources and changes in estimated reserves, can have a negative impact on the JGC Group’s performance.
4. Risks of Changes in Exchange RatesAlmost all of the income from JGC Group sales generated by overseas business is paid in foreign currencies. To hedge the associated exchange rate risk, we have introduced countermeasures including signing project contracts denominated in multiple currencies, conducting overseas procurement, ordering in overseas currencies, and entering into foreign exchange contracts. However, sudden exchange rate fluctuations could negatively affect the JGC Group’s performance.
Risks Impacting Operations
JGC CORPORAtION Annual Report 2011 37

Millions of yen
Thousands of U.S. dollars
(Note 1)
Assets 2011 2010 2011
Current Assets:
Cash and deposits (Notes 13 & 18) ¥131,894 ¥ 83,308 $1,586,218
Marketable securities (Notes 9, 13 & 18) 30,000 40,500 360,794
Notes and accounts receivable (Notes 2, 15 & 18) 108,810 87,626 1,308,599
Inventories (Note 4) 24,348 36,897 292,820
Deferred tax assets (Note 12) 10,240 12,182 123,151
Other current assets (Notes 2, 10 & 18) 14,273 23,117 171,654
Allowance for doubtful accounts (Note 1 (v)) (101) (92) (1,215)
Total Current Assets 319,464 283,538 3,842,021
Property and Equipment (Note 3):
Land (Notes 14, 17 & 19) 26,459 26,459 318,208
Buildings and structures (Note 17) 58,785 56,617 706,975
Machinery and equipment 47,205 45,520 567,709
Construction in progress 821 1,719 9,874
Other (Note 19) 1,494 1,747 17,968
134,764 132,062 1,620,734
Less accumulated depreciation (70,130) (66,004) (843,416)
Net Property and Equipment 64,634 66,058 777,318
Other Assets:
Investments in unconsolidated subsidiaries and affiliates (Note 9) 36,147 31,968 434,720
Marketable and investment securities (Notes 9 & 18) 29,967 29,699 360,397
Long-term loans receivable (Notes 2, 15 & 18) 1,780 1,085 21,407
Deferred tax assets (Note 12) 10,304 10,750 123,921
Other (Note 19) 6,207 7,078 74,648
Total Other Assets 84,405 80,580 1,015,093
Total Assets ¥468,503 ¥430,176 $5,634,432
The accompanying notes are an integral part of these statements.
Consolidated Balance SheetsJGC CORPORATION March 31, 2011 and 2010
JGC CORPORAtION Annual Report 201138

Millions of yen
Thousands of U.S. dollars
(Note 1)
Liabilities and Net Assets 2011 2010 2011
Current Liabilities:
Short-term loans and current maturities of long-term debt (Note 3) ¥ 14,439 ¥ 1,052 $ 173,650
Notes and accounts payable (Notes 2 & 18) 70,762 59,392 851,016
Advances received on uncompleted contracts 25,819 46,767 310,511
Reserve for job warranty costs 312 456 3,752
Reserve for losses on contracts 526 146 6,326
Income taxes payable 18,710 7,671 225,015
Other current liabilities (Notes 2, 10 & 18) 43,725 22,244 525,857
Total Current Liabilities 174,293 137,728 2,096,127
Long-Term Debt, Less Current Maturities (Notes 3 & 18) 6,624 21,926 79,663
Retirement and Severance Benefits (Note 6) 14,623 15,720 175,863
Deferred Tax Liabilities for Land Revaluation (Notes 12 & 14) 3,783 3,783 45,496
Other Non-Current Liabilities (Notes 2 & 12) 4,697 4,878 56,489
Total Liabilities 204,020 184,035 2,453,638
Contingencies (Note 7)
Net Assets (Note 8):
Shareholders’ Equity
Common stock
Authorized — 600,000,000 shares,
Issued — 259,052,929 shares in 2011 and 2010 23,511 23,511 282,754
Capital surplus 25,603 25,601 307,913
Retained earnings 224,347 204,177 2,698,100
Treasury stock, at cost (6,169) (5,735) (74,191)
Total Shareholders’ Equity 267,292 247,554 3,214,576
Accumulated Other Comprehensive Income (Loss)
Net unrealized holding gains on securities (Notes 9 & 18) 3,338 5,087 40,144
Deferred gains on hedges (Note 10) 2,519 2,712 30,295
Land revaluation, net of deferred tax portion (Note 14) (6,553) (6,553) (78,809)
Foreign currency translation adjustments (2,613) (2,980) (31,425)
Total Accumulated Other Comprehensive Income (Loss) (3,309) (1,734) (39,795)
Minority Interests 500 321 6,013
Total Net Assets 264,483 246,141 3,180,794
Total Liabilities and Net Assets ¥468,503 ¥430,176 $5,634,432
JGC CORPORAtION Annual Report 2011 39
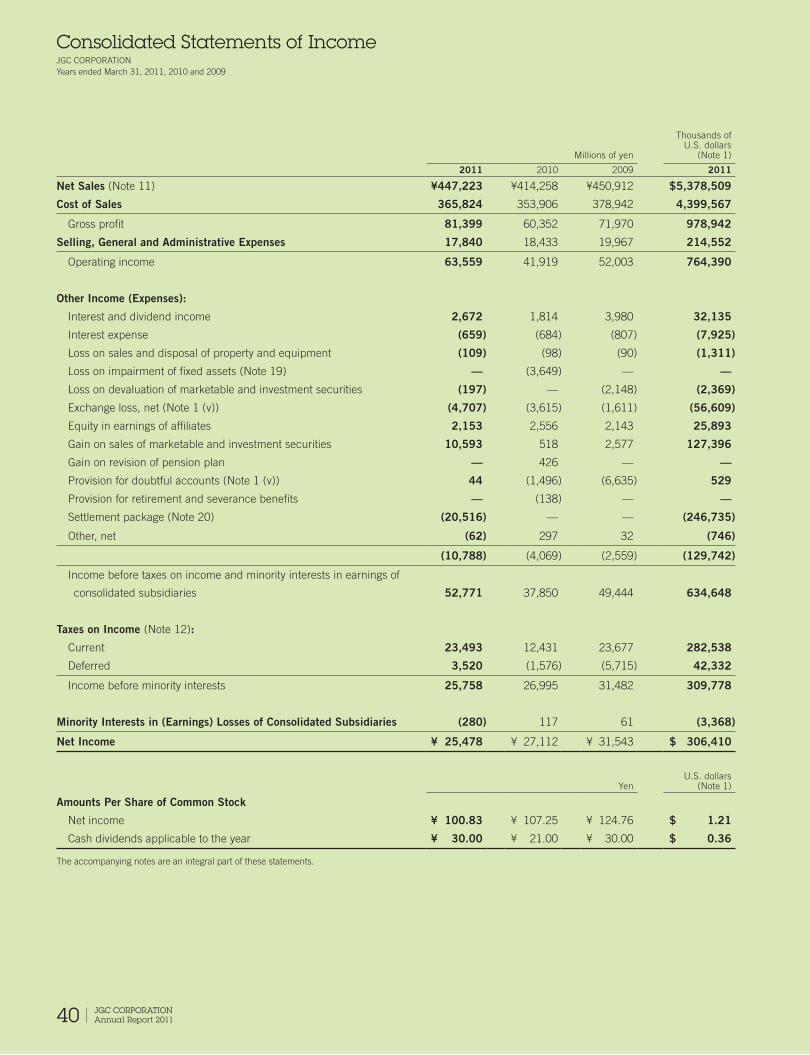
Consolidated Statements of IncomeJGC CORPORATION Years ended March 31, 2011, 2010 and 2009
Millions of yen
Thousands of U.S. dollars
(Note 1)
2011 2010 2009 2011
Net Sales (Note 11) ¥447,223 ¥414,258 ¥450,912 $5,378,509
Cost of Sales 365,824 353,906 378,942 4,399,567
Gross profit 81,399 60,352 71,970 978,942
Selling, General and Administrative Expenses 17,840 18,433 19,967 214,552
Operating income 63,559 41,919 52,003 764,390
Other Income (Expenses):
Interest and dividend income 2,672 1,814 3,980 32,135
Interest expense (659) (684) (807) (7,925)
Loss on sales and disposal of property and equipment (109) (98) (90) (1,311)
Loss on impairment of fixed assets (Note 19) — (3,649) — —
Loss on devaluation of marketable and investment securities (197) — (2,148) (2,369)
Exchange loss, net (Note 1 (v)) (4,707) (3,615) (1,611) (56,609)
Equity in earnings of affiliates 2,153 2,556 2,143 25,893
Gain on sales of marketable and investment securities 10,593 518 2,577 127,396
Gain on revision of pension plan — 426 — —
Provision for doubtful accounts (Note 1 (v)) 44 (1,496) (6,635) 529
Provision for retirement and severance benefits — (138) — —
Settlement package (Note 20) (20,516) — — (246,735)
Other, net (62) 297 32 (746)
(10,788) (4,069) (2,559) (129,742)
Income before taxes on income and minority interests in earnings of
consolidated subsidiaries 52,771 37,850 49,444 634,648
Taxes on Income (Note 12):
Current 23,493 12,431 23,677 282,538
Deferred 3,520 (1,576) (5,715) 42,332
Income before minority interests 25,758 26,995 31,482 309,778
Minority Interests in (Earnings) Losses of Consolidated Subsidiaries (280) 117 61 (3,368)
Net Income ¥ 25,478 ¥ 27,112 ¥ 31,543 $ 306,410
YenU.S. dollars
(Note 1)
Amounts Per Share of Common Stock
Net income ¥ 100.83 ¥ 107.25 ¥ 124.76 $ 1.21
Cash dividends applicable to the year ¥ 30.00 ¥ 21.00 ¥ 30.00 $ 0.36
The accompanying notes are an integral part of these statements.
JGC CORPORAtION Annual Report 201140

Consolidated Statements of Comprehensive IncomeJGC CORPORATION Years ended March 31, 2011 and 2010
Millions of yen
Thousands of U.S. dollars
(Note 1)
2011 2010 2011
Income Before Minority Interests ¥25,758 ¥26,995 $309,778
Other Comprehensive Income (Loss)
Net unrealized holding gains on securities (Notes 9 & 18) (1,750) 2,606 (21,046)
Deferred gains (losses) on hedges (Note 10) (193) 3,739 (2,321)
Translation adjustments (862) (274) (10,367)
Equity for equity method affiliates 1,230 253 14,793
Total Other Comprehensive Income (Loss) ¥ (1,575) ¥ 6,324 $ (18,941)
Total Comprehensive Income ¥24,183 ¥33,319 $290,837
Comprehensive income attributable to JGC Corporation ¥23,903 ¥33,434 $287,469
Comprehensive income (loss) attributable to minority interests ¥ 280 ¥ (115) $ 3,368
The accompanying notes are an integral part of these statements.
Effective from the year ended March 31, 2011, the new accounting standards for presentation of comprehensive income (ASBJ Statement No. 25) have been adopted and certain prior year amounts have been reclassified to conform to the current year presentation.
JGC CORPORAtION Annual Report 2011 41

Consolidated Statements of Changes in Net AssetsJGC CORPORATION Years ended March 31, 2011, 2010 and 2009
Thousands of shares Millions of yen
Common stock
Capital surplus
Retained earnings
Treasury stock, at cost
Net unrealized holding gains
(losses) on securities
(Notes 9 & 18)
Deferred gains
(losses) on hedges
(Note 10)
Land revaluation,
net of deferred tax portion
(Note 14)
Foreign currency
translation adjustments
Minority interestsShares Amount
Balance at March 31, 2008 259,053 ¥ 23,511 ¥ 25,593 ¥ 160,311 ¥ (5,532) ¥ 8,056 ¥ 331 ¥ (6,590) ¥ 1,575 ¥ 282 Net income for the year 31,543Effect of change in scope of consolidation 2,003 (48) 435Cash dividends (5,310)Gain on retirement of treasury stock 6 15Land revaluation, net of deferred tax portion 0 (0)Net unrealized holding losses on securities (5,575)Net deferred losses on hedges (1,358)Foreign currency translation adjustments (4,489)Increase of treasury stock (154)Net changes during the year (117)
Balance at March 31, 2009 259,053 ¥ 23,511 ¥ 25,599 ¥ 188,547 ¥ (5,671) ¥ 2,481 ¥(1,027) ¥ (6,590) ¥ (2,962) ¥ 600 Net income for the year 27,112Effect of change in scope of consolidation (3,861) (518)Cash dividends (7,584)Gain on retirement of treasury stock 2 2Land revaluation, net of deferred tax portion (37) 37Net unrealized holding gains on securities 2,606Net deferred gains on hedges 3,739Foreign currency translation adjustments 500Increase of treasury stock (66)Net changes during the year (279)
Balance at March 31, 2010 259,053 ¥ 23,511 ¥ 25,601 ¥ 204,177 ¥ (5,735) ¥ 5,087 ¥ 2,712 ¥ (6,553) ¥ (2,980) ¥ 321
Net income for the year 25,478Effect of change in scope of consolidation 1,229Cash dividends (5,308)Gain on retirement of treasury stock 2 2Land revaluation, net of deferred tax portionNet unrealized holding losses on securities (1,749)Net deferred losses on hedges (193)Foreign currency translation adjustments (862)Increase of treasury stock (436)Net changes during the year 179
Balance at March 31, 2011 259,053 ¥23,511 ¥25,603 ¥224,347 ¥(6,169) ¥ 3,338 ¥2,519 ¥(6,553) ¥(2,613) ¥500
Thousands of U.S. dollars (Note 1)
Common stock
Capital surplus
Retained earnings
Treasury stock, at cost
Net unrealized holding gains
(losses) on securities
(Notes 9 & 18)
Deferred gains
(losses) on hedges
(Note 10)
Land revaluation,
net of deferred tax portion
(Note 14)
Foreign currency
translation adjustments
Minority interests
Balance at March 31, 2010 $ 282,754 $ 307,889 $ 2,455,526 $ (68,972) $ 61,178 $ 32,616 $ (78,809) $ (35,839) $ 3,860Net income for the year 306,410Effect of change in scope of consolidation 14,781Cash dividends (63,836)Gain on retirement of treasury stock 24 24Land revaluation, net of deferred tax portionNet unrealized holding losses on securities (21,034)Net deferred losses on hedges (2,321)Foreign currency translation adjustments (10,367)Increase of treasury stock (5,243)Net changes during the year 2,153
Balance at March 31, 2011 $282,754 $307,913 $2,698,100 $(74,191) $40,144 $30,295 $(78,809) $(31,425) $6,013
The accompanying notes are an integral part of these statements.
JGC CORPORAtION Annual Report 201142

Consolidated Statements of Cash FlowsJGC CORPORATION Years ended March 31, 2011, 2010 and 2009
Millions of yen
Thousands of U.S. dollars
(Note 1)2011 2010 2009 2011
Cash Flows From Operating Activities: Income before taxes on income and minority interests in earnings of consolidated subsidiaries ¥ 52,771 ¥ 37,850 ¥ 49,444 $ 634,648 Adjustments to reconcile income before taxes on income and minority interests in earnings of consolidated subsidiaries to net cash provided by operating activities: Depreciation and amortization 7,517 9,134 6,979 90,403 Amortization of goodwill (6) 391 764 (72) Increase (decrease) in allowance for doubtful accounts (Note 1 (v)) (2,271) 780 6,687 (27,312) Increase (decrease) in reserve for losses on contracts 380 (1,689) (776) 4,570 Decrease in retirement and severance benefits (1,056) (375) (8) (12,700) Interest and dividend income (2,672) (1,814) (3,980) (32,135) Interest expense 659 684 807 7,925 Exchange (gain) loss (Note 1 (v)) 3,788 (15) 660 45,556 Equity in earnings of affiliates (2,153) (2,556) (2,143) (25,893) Gain on sales of marketable and investment securities (10,593) (518) (2,577) (127,396) Loss on devaluation of marketable and investment securities 197 — 2,148 2,369 Loss on sales and disposal of property and equipment 109 98 90 1,311 Loss on impairment of fixed assets (Note 19) — 3,649 — — Increase in notes and accounts receivable (21,343) (14,973) (4,141) (256,681) Decrease in inventories 12,451 25,377 7,146 149,741 Decrease (increase) in other assets 4,474 (5,560) 5,758 53,806 Increase (decrease) in notes and accounts payable 11,450 (22,014) 9,103 137,703 Decrease in advances received on uncompleted contracts (20,948) (34,735) (31,909) (251,930) Other 21,633 (3,404) 5,014 260,170 Subtotal 54,387 (9,690) 49,066 654,083 Interest and dividends received 6,783 4,854 6,667 81,575 Interest paid (559) (925) (777) (6,723) Income taxes paid (12,396) (19,419) (18,361) (149,079) Net Cash Provided by (Used in) Operating Activities 48,215 (25,180) 36,595 579,856
Cash Flows From Investing Activities: Payments for purchases of property and equipment (3,252) (4,766) (6,042) (39,110) Proceeds from sales of property and equipment 57 121 195 686 Payments for purchase of intangible fixed assets (1,179) (2,540) (1,211) (14,179) Payments for purchase of marketable and investment securities (8,652) (12,494) (21,528) (104,053) Proceeds from sales of marketable and investment securities 13,740 942 5,399 165,244 Decrease (increase) in short-term loans receivable 72 28 (77) 866 Payments for long-term loans receivable (802) (528) (3,375) (9,645) Proceeds from long-term loans receivable 56 171 63 673 Other 76 (758) 119 913 Net Cash Provided by (Used in) Investing Activities 116 (19,824) (26,457) 1,395
Cash Flows From Financing Activities: Decrease in short-term loans — — (75) — Proceeds from long-term bank loans — — 6,839 — Repayments of long-term bank loans (1,339) (737) (808) (16,103) Repayments of finance lease obligation (234) (59) (33) (2,814) Payments for purchase of treasury stock (432) (62) (133) (5,196) Cash dividends paid (5,296) (7,579) (5,307) (63,693) Cash dividends paid to minority shareholders (16) (20) (11) (192) Other — (437) — — Net Cash Provided by (Used in) Financing Activities (7,317) (8,894) 472 (87,998)
Effect of Exchange Rate Changes on Cash and Cash Equivalents (2,928) 2,290 (2,815) (35,213)Net Increase (Decrease) in Cash and Cash Equivalents 38,086 (51,608) 7,795 458,040Cash and Cash Equivalents at Beginning of Year 123,808 174,282 164,617 1,488,972Increase in Cash and Cash Equivalents From Newly Consolidated Subsidiaries — 1,134 1,870 —Cash and Cash Equivalents at End of Year (Note 13) ¥161,894 ¥123,808 ¥174,282 $1,947,012
The accompanying notes are an integral part of these statements.
JGC CORPORAtION Annual Report 2011 43

Notes to Consolidated Financial Statements
Note 1 — Summary of Accounting Policies(a) Basis of Presenting Consolidated Financial StatementsThe accompanying consolidated financial statements of JGC Corporation (Nikki
Kabushiki Kaisha, the “Company”) and its consolidated subsidiaries have been
prepared in accordance with the provisions set forth in the Japanese Financial
Instruments and Exchange Law and its related accounting regulations, and in
conformity with accounting principles generally accepted in Japan (“Japanese
GAAP”), which are different in certain respects as to application and disclosure
requirements from International Financial Reporting Standards.
Prior to the year ended March 31, 2009, the accounts of consolidated
overseas subsidiaries were based on their accounting records maintained in
conformity with generally accepted accounting principles prevailing in the
respective countries of domicile. As discussed in Note 1 (e), the accounts of
consolidated overseas subsidiaries for the year ended March 31, 2010 were
prepared in accordance with either International Financial Reporting Standards
or U.S. generally accepted accounting principles, with adjustments for the
specified six items as applicable. The accompanying consolidated financial
statements have been restructured and translated into English (with some
expanded descriptions) from the consolidated financial statements of the
Company, prepared in accordance with Japanese GAAP and filed with the
appropriate Local Finance Bureau of the Ministry of Finance as required by the
Japanese Financial Instruments and Exchange Law. Certain supplementary
information included in the statutory Japanese language consolidated financial
statements, but not required for fair presentation, is not presented in the
accompanying consolidated financial statements.
The translation of the Japanese yen amounts into U.S. dollars is included
solely for the convenience of readers outside Japan, using the prevailing
exchange rate at March 31, 2011, which was ¥83.15 to U.S.$1. The conve-
nience translations should not be construed as representations that the Japa-
nese yen amounts have been, could have been, or could in the future be,
converted into U.S. dollars at this or any other rate of exchange.
(b) Reporting EntityThe consolidated financial statements include the accounts of the Company
and its significant subsidiaries that include less than 50% owned affiliates
controlled through substantial ownership of majority voting rights or existence
of substantial control. All significant inter-company transactions and account
balances are eliminated in consolidation.
Investments in non-consolidated subsidiaries and affiliates over which the
Company has the ability to exercise significant influence over operating and
financial policies of the investees are accounted for by the equity method.
The number of consolidated subsidiaries and affiliates accounted for
using the equity method at March 31, 2011, 2010 and 2009, was as follows:
2011 2010 2009
Consolidated subsidiaries 14 14 14
Affiliates under the equity method 2 3 3
Investments in non-consolidated subsidiaries and affiliates not accounted
for by the equity method are carried at cost, adjusted for any substantial and
non-recoverable decline in value. The effect on net income (loss) and retained
earnings from those investments not accounted for under the equity method is
immaterial.
At the year ended March 31, 2011, one of the affiliates, M. W. Kellogg
Limited was excluded from the scope of the equity method because the
Company sold all securities.
However, equity in earnings of M. W. Kellogg Limited before the selling
date was included in the consolidated statements of income for the year ended
March 31, 2011.
On March 10, 2008, the Accounting Standards Board of Japan issued
ASBJ Statement No. 16, “Accounting Standard for Equity Method of Account-
ing for Investments’’ and PITF No. 24, “Practical Solution on Unification of
Accounting Policies Applied to Associates Accounted for Using the Equity
Method.” This standard is effective from the year ended March 31, 2011.
There were no effects of this change on the consolidated financial statements
for the year ended March 31, 2011.
(c) Consolidated Statements of Cash FlowsIn preparing the consolidated statements of cash flows, cash on hand, readily
available deposits and short-term highly liquid investments with negligible risk
of changes in value, and maturities not exceeding three months at the time of
purchase are considered to be cash and cash equivalents.
(d) Conversion of Foreign Currencies and Translation of Statements
Receivables and payables denominated in foreign currencies are translated
into Japanese yen at the year-end rates.
Balance sheets of consolidated overseas subsidiaries are translated into
Japanese yen at the year-end rates except for net assets accounts, which are
translated at the historical rates. Income statements of consolidated overseas
subsidiaries are translated at average rates except for transactions with the
Company, which are translated at the rates used by the Company.
(e) Unification of Accounting Policies Applied to Foreign Subsidiaries for Consolidated Financial Statements
On March 17, 2006, the Accounting Standards Board of Japan issued ASBJ
Practical Issues Task Force No. 18, “Practical Solution on Unification of
Accounting Policies Applied to Foreign Subsidiaries for Consolidated Financial
Statements” (“PITF No. 18”). PITF No. 18 requires that accounting policies
and procedures applied by a parent company and its subsidiaries to similar
transactions and events under similar circumstances should, in principle, be
unified for the preparation of the consolidated financial statements. PITF
No. 18, however, as a tentative measure, allows a parent company to prepare
consolidated financial statements using foreign subsidiaries’ financial state-
ments prepared in accordance with either International Financial Reporting
Standards or U.S. generally accepted accounting principles. In this case,
adjustments for the following six items are required in the consolidation
JGC CORPORAtION Annual Report 201144

process so that their impacts on net income are accounted for in accordance
with Japanese GAAP unless the impact is not material.
(a) Goodwill not subjected to amortization
(b) Actuarial gains and losses of defined benefit plans recognized outside
profit or loss
(c) Capitalized expenditures for research and development activities
(d) Fair value measurement of investment properties, and revaluation of
property, plant and equipment, and intangible assets
(e) Retrospective treatment of a change in accounting policies
(f) Accounting for net income attributable to minority interests
There were no material effects from adopting PITF No. 18 on the consoli-
dated financial statements for the year ended March 31, 2011.
(f) Allowance for Doubtful AccountsNotes and accounts receivable, including loans and other receivables, are
valued by providing individually estimated uncollectible amounts plus the
amounts for probable losses calculated by applying a percentage based on
collection experience to the remaining accounts.
(g) Marketable Securities, Investments in Unconsoli-dated Subsidiaries and Affiliates, and Marketable and Investment Securities
The companies are required to examine the intent of holding each security and
classify those securities as (a) securities held for trading purposes, (b) debt
securities intended to be held to maturity, (c) equity securities issued by sub-
sidiaries and affiliates, and (d) all other securities that are not classified in any
of the above categories (hereafter, “available-for-sale securities”). The Company
and its domestic consolidated subsidiaries did not have securities defined as
(a) and (b) above in the years ended March 31, 2011 and 2010.
Available-for-sale securities with available fair market values are stated at
fair market value. Unrealized gains and losses on these securities are reported,
net of applicable income taxes, as a separate component of net assets. Realized
gains and losses on the sale of such securities are computed using the moving-
average method. Other securities with no available fair market value are stated
at moving-average cost. Equity securities issued by subsidiaries and affiliates,
which are not consolidated or accounted for using the equity method, are
stated at moving-average cost.
If the market value of available-for-sale securities declines significantly,
such securities are restated at fair market value and the difference between
fair market value and the carrying amount is recognized as loss in the period of
decline (See Note 9). For equity securities with no available fair market value,
if the net asset value of the investee declines significantly, such securities are
required to be written down to the net asset value with the corresponding
losses in the period of decline. In these cases, such fair market value or the
net asset value will be the carrying amount of the securities at the beginning of
the next year.
(h) Recognition of Sales, Contract Works in Progress and Advances Received on Uncompleted Contracts
On December 27, 2007, the Accounting Standards Board of Japan issued
ASBJ Statement No. 15, “Accounting Standard for Construction Contracts” and
ASBJ Guidance No. 18, “Guidance on Accounting Standard for Construction
Contracts.” The new accounting standards require that if the construction
activity is deemed certain during the course of the activity, the percentage-of-
completion method shall be applied (the percentage of the cost incurred to the
estimated total cost), otherwise the completed-contract method shall be
applied. This standard is effective from the year ended March 31, 2010.
As a result, Net Sales increased by ¥2,407 million and Gross Profit,
Operating Income, and Income before taxes on income and minority interests
in earnings of consolidated subsidiaries increased by ¥318 million, respectively
for the year ended March 31, 2010.
Prior to the year ended March 31, 2010, the Company recognized sales
on contracts using the completed-contract method except for long term con-
tracts. Under this method, costs and advances received on uncompleted
contracts are accumulated during the period of construction. These costs and
advances received on uncompleted contracts are not offset and are shown as
contract works in progress and advances received on uncompleted contracts
in the accompanying consolidated balance sheets. Accordingly, no profits or
losses are recorded before the contract is completed.
Sales on other contracts for relatively large projects, which require long
periods for completion and which generally include engineering, procurement
(components, parts, etc.) and construction on a full-turnkey basis, are recog-
nized by the percentage-of-completion method, primarily based on contract
costs incurred to date compared with total estimated costs for contract com-
pletion. The percentage-of-completion method is adopted for large jobs for
which the construction period exceeds 24 months and the contract amount
exceeds ¥5,000 million (including jobs whose construction period exceeds 36
months and the contract amount exceeds ¥3,000 million). Revisions in con-
tract revenue and cost estimates are recognized in the period in which they
are determined.
Contract works in progress are stated at cost determined by a specific
identification method and comprised of direct materials, components and
parts, direct labor, subcontractors’ fees and other items directly attributable to
the contract, and job-related overheads. Selling, general and administrative
expenses are charged to operations as incurred and are not allocated to con-
tract job work costs.
The Company normally receives payments from customers on a progress
basis in accordance with the terms of the respective construction contracts.
Net Sales recognized by the percentage-of-completion method for the
years ended March 31, 2009 were ¥270,696 million.
(i) InventoriesPrior to April 1, 2008, Inventories of the Company and its consolidated subsid-
iaries were stated at cost determined using the moving-average method except
for contract works in progress as stated Note 1(h).
JGC CORPORAtION Annual Report 2011 45

On July 5, 2006, the Accounting Standards Board of Japan issued ASBJ
Statement No. 9, “Accounting Standard for Measurement of Inventories.” As
permitted under the superseded accounting standard, some consolidated
domestic subsidiaries previously stated inventories at cost. The new account-
ing standard requires that inventories held for sale in the ordinary course of
business be measured at the lower of cost or net realizable value. The effect of
this change on the financial result is immaterial.
(j) Operating CycleAssets and liabilities related to long-term contract jobs are included in current
assets and current liabilities in the accompanying consolidated balance
sheets, as they will be liquidated in the normal course of contract completion,
although it may require more than one year.
(k) Property and Equipment, Depreciation and Finance Leases
Property and equipment are stated at cost, except for certain revalued land as
explained in Note 14. Depreciation of property and equipment is calculated
primarily using the straight-line method for buildings used for business operation,
and the declining-balance method for other property and equipment over the
estimated useful lives of the assets based on the Corporate Tax Code of Japan.
Effective from the year ended March 31, 2009, the Company and its
domestic subsidiaries shortened the estimated useful lives of machinery and
equipment based on the reassessment of the useful lives in light of the change
in the Corporation Tax Code of Japan. The effect of this change on the financial
result is immaterial.
On March 31, 2008, the Accounting Standards Board of Japan issued ASBJ
Statement No. 18, “Accounting Standard for Asset Retirement Obligations” and
ASBJ Guidance No. 21, “Guidance on Accounting Standard for Asset Retirement
Obligations.” The new accounting standards require companies to recognize an
asset retirement obligation as a liability and include the asset retirement cost
corresponding to it as a tangible fixed asset. This standard is effective from the
year ended March 31, 2011.
As a result, Operating income decreased by ¥29 million ($349 thousand)
and income before taxes on income and minority interests in earnings of
consolidated subsidiaries decreased by ¥50 million ($601 thousand) for the
year ended March 31, 2011. The effect of adopting this accounting standard
for asset retirement obligation was ¥80 million ($962 thousand).
All finance leasing transactions were capitalized except for finance leases
which commenced prior to April 1, 2008 and have been accounted for as
operating leases, and continue to be accounted for as operating leases with
disclosure of “as if capitalized” information.
Expenditures for new facilities and those that substantially increase the
useful lives of existing property and equipment are capitalized. Maintenance,
repair and minor renewals are charged to expenses as incurred.
The cost and accumulated depreciation applicable to assets retired or
otherwise disposed of is eliminated from the related accounts and the gain or
loss on disposal is credited or charged to income.
(l) Impairment of Fixed AssetsThe Company and its consolidated subsidiaries review their long-lived assets
for impairment whenever events or changes in circumstances indicate the
carrying amount of an asset or asset group may not be recoverable. An impair-
ment loss would be recognized if the carrying amount of an asset or asset
group exceeds the sum of the undiscounted future cash flows expected to
result from the continued use and eventual disposition of the asset or asset
group. The impairment loss would be measured as the amount by which the
carrying amount of the asset exceeds its recoverable amount, which is the
higher of the discounted cash flows from the continued use and eventual
disposition of the asset or the net selling price at disposition.
(m) Retirement and Severance Benefits and Pension Costs
(1) Employees’ severance and retirement benefits
The Company and its consolidated subsidiaries provide two types of post-
employment benefit plans, unfunded lump-sum payment plans and
funded non-contributory pension plans, under which all eligible employees
are entitled to benefits based on the level of wages and salaries at the time
of retirement or termination, length of service and certain other factors.
Some consolidated subsidiaries also have a defined contribution
pension plan, which was transferred from a portion of the defined benefit
pension plan.
The Company and its consolidated subsidiaries provided an allowance
for employees’ severance and retirement benefits at March 31, 2011 and
2010, based on the estimated amounts of projected benefit obligation,
actuarially calculated using certain assumptions and the fair value of the
plan assets at that date.
The estimated amount of all retirement benefits to be paid at the
future retirement date is allocated equally to each service year using the
estimated number of total service years.
The Company and its consolidated subsidiaries recognize prior service
costs as expenses in equal amounts over the average of the estimated
remaining service lives of the employees, and actuarial gains and losses as
expenses using the declining-balance method over the average of the
estimated remaining service lives commencing in the following period.
However, some consolidated subsidiaries recognized prior service
costs and actuarial differences as expenses in the period incurred.
Effective from the year ended March 31, 2010, the Company and
consolidated domestic subsidiaries adopted the “Partial Amendments to
Accounting Standard for Retirement Benefits (Part 3)” (Accounting Stan-
dards Board of Japan (“ASBJ”) Statement No. 19, issued on July 31,
2008).The new accounting standard requires domestic companies to use
the rate of return on long-term government or gilt-edged bonds as of the
end of the fiscal year for calculating the projected benefit obligation of a
defined-benefit plan. Previously, domestic companies were allowed to use
a discount rate determined taking into consideration fluctuations in the
yield of long-term government and gilt-edged bonds over a certain period.
JGC CORPORAtION Annual Report 201146

This change had no material impact on the consolidated financial state-
ments for the year ended March 31, 2010.
From the year ended March 31, 2010 one consolidated domestic
subsidiary changed the calculation method for the allowance for
employees’ severance and retirement benefits from accounting for 100%
of the lump-sum retirement benefits to actuarial calculation.
As a result, income before income taxes on income and minority
interests in earnings of consolidated subsidiaries decreased by ¥138
million for the year ended March 31, 2010.
On July1, 2009, one consolidated domestic subsidiary unified its
employees’ severance and retirement benefits to the defined benefit pen-
sion plan. The transfer is accounted for in accordance with the “Guidance
on Accounting Standard for Transfer between Retirement Benefit Plans”
(Accounting Standards Board of Japan Guidance No. 1).
On April 1, 2011, one consolidated domestic subsidiary transferred its
employees’ severance and retirement benefits to the defined benefit pen-
sion plan. Also, another consolidated domestic subsidiary terminated its
defined benefit pension plan due to the merger. These transfers are
accounted for in accordance with the “Guidance on Accounting Standard
for Transfer between Retirement Benefit Plans” (Accounting Standards
Board of Japan Guidance No. 1).
(2) Officers’ severance and retirement benefits
Domestic consolidated subsidiaries provide for liabilities in respect of
lump-sum severance and retirement benefits to directors and corporate
statutory auditors computed on the assumption that all officers retired at
year-end.
(n) Research and Development CostsResearch and development costs for the improvement of existing skills and
technologies or the development of new skills and technologies, including
basic research and fundamental development costs, are charged to operations
in the period incurred. The total amount of research and development
expenses, included in Cost of Sales and Selling, General and Administrative
expenses, was ¥4,998 million ($60,108 thousand), ¥5,009 million, and
¥5,331 million, respectively, in 2011, 2010 and 2009.
(o) Taxes on IncomeThe Company and its consolidated subsidiaries provide for tax effects of
temporary differences between the carrying amounts and the tax basis of
assets and liabilities. The asset and liability approach is used to recognize
deferred tax assets and liabilities for the expected future tax consequences
of temporary differences.
(p) Reserve for Job Warranty CostsA reserve for the estimated cost of warranty obligations is provided for the
Company’s engineering, procurement and construction work at the time the
related sales on contracts are recorded.
(q) Reserve for Losses on ContractsA reserve for losses on contracts is provided for an estimated amount of
probable losses to be incurred in future years in respect of construction
projects in progress.
(r) Per Share InformationCash dividends per share have been presented on an accrual basis and
include dividends to be approved after the balance sheet date but applicable
to the year then ended.
(s) Amortization of GoodwillGoodwill is amortized over five years on a straight-line basis, and either debited
to Selling, General and Administrative Expenses, or credited to other income.
(t) Derivatives and Hedge AccountingThe accounting standard for financial instruments requires companies to state
derivative financial instruments at fair value and to recognize changes in the
fair value as gains or losses unless the derivative financial instruments are
used for hedging purposes.
If derivative financial instruments are used as hedges and meet certain hedging
criteria, the Company and its domestic consolidated subsidiaries defer recognition of
gains or losses resulting from changes in fair value of derivative financial instruments
until the related losses or gains on the hedged items are recognized.
However, in cases where forward foreign exchange contracts are used as
hedges and meet certain hedging criteria, forward foreign exchange contracts
and hedged items are accounted for in the following manner (Allocation Method):
(1) If a forward foreign exchange contract is executed to hedge an existing
foreign currency receivable or payable,
(i) The difference, if any, between the Japanese yen amount of the hedged
foreign currency receivable or payable translated using the spot rate at
the inception date of the contract and the book value of the receivable
or payable is recognized in the statement of income in the period which
includes the inception date, and
(ii) The discount or premium on the contract (that is, the difference between
the Japanese yen amount of the contract translated using the contracted
forward rate and that translated using the spot rate at the inception date
of the contract) is recognized over the term of the contract.
(2) If a forward foreign exchange contract is executed to hedge a future trans-
action denominated in a foreign currency, the future transaction will be
recorded using the contracted forward rate, and no gains or losses on the
forward foreign exchange contract are recognized.
JGC CORPORAtION Annual Report 2011 47

Also, where interest rate swap contracts are used as hedges and meet
certain hedging criteria, the net amount to be paid or received under the
interest rate swap contract is added to or deducted from the interest on the
assets or liabilities for which the swap contract was executed (special method
for interest rate swap).
(u) Accrued Bonuses to Directors and Corporate Auditors
The company and consolidated subsidiaries recognize directors’ and
corporate auditors’ bonuses as expenses when incurred.
(v) Reclassification and RestatementCertain prior year amounts have been reclassified to conform to the current
year presentation except for the reclassification between provision for doubtful
accounts and exchange gain or loss described below.
The Company changed the recognition of exchange differences for
foreign currencies’ doubtful accounts from provision for doubtful accounts to
exchange gain or loss from the year ended March 31, 2011, in order to
properly present provision for doubtful accounts without the effect of
exchange fluctuation.
These reclassifications had no impact on previously reported results of
operations or retained earnings.
Note 2 — Receivables From and Payables to Unconsolidated Subsidiaries and Affiliates
Significant receivables from and payables to unconsolidated subsidiaries and
affiliates at March 31, 2011 and 2010, were as follows:
Millions of yen
Thousands of U.S. dollars
(Note 1)
March 31, 2011 2010 2011
Notes and accounts receivable ¥7,875 ¥1,699 $94,708
Other current assets 2,234 5,074 26,867
Long-term loans receivable 1,550 849 18,641
Notes and accounts payable 3,254 2,447 39,134
Other current liabilities 119 583 1,431
Other non-current liabilities 3 3 36
Note 3 — Borrowings and Assets Pledged as CollateralShort-term loans consisted mainly of unsecured notes and bank overdrafts
and bore interest at the annual rates of 0.95% and 1.13% at March 31, 2011
and 2010, respectively. Such loans are generally renewable at maturity.
Long-term debt consisted of the following:
Millions of yen
Thousands ofU.S. dollars
(Note 1)
March 31, 2011 2010 2011
Secured Loans0.55% – 1.75% loans from a governmental institution due serially through 2014 ¥ 951 ¥ 1,629 $ 11,437
Unsecured Debt0.46% – 3.00% loans frombanks and insurance companies due serially through 2016 20,086 21,324 241,563
21,037 22,953 253,000Less current maturities (14,413) (1,027) (173,337)Long-term debt due after one year ¥ 6,624 ¥21,926 $ 79,663
Assets pledged as collateral for long-term debt and other non-current
liabilities at March 31, 2011 and 2010, were as follows:
Millions of yen
Thousands ofU.S. dollars
(Note 1)
March 31, 2011 2010 2011
Land ¥ 5,071 ¥ 5,071 $ 60,986Buildings and structures, at net book value 3,427 3,615 41,215Machinery and equipment, at net book value 2,896 3,611 34,828
Total ¥11,394 ¥12,297 $137,029
The annual maturities of long-term debt outstanding at March 31, 2011,
were as follows:
Amount
Year ending March 31, Millions of yen
Thousands of U.S. dollars
(Note 1)
2012 ¥14,413 $173,337
2013 963 11,581
2014 5,329 64,089
2015 249 2,995
2016 83 998
Total ¥21,037 $253,000
Note 4 — InventoriesInventories at March 31, 2011 and 2010, are summarized as follows:
Millions of yen
Thousands ofU.S. dollars
(Note 1)
March 31, 2011 2010 2011
Inventories:
Contract works in progress ¥14,616 ¥28,123 $175,779
Finished goods and merchandise 5,279 4,715 63,488
Works in process 1,614 1,634 19,411
Raw materials and others 2,839 2,425 34,142
Total ¥24,348 ¥36,897 $292,820
JGC CORPORAtION Annual Report 201148
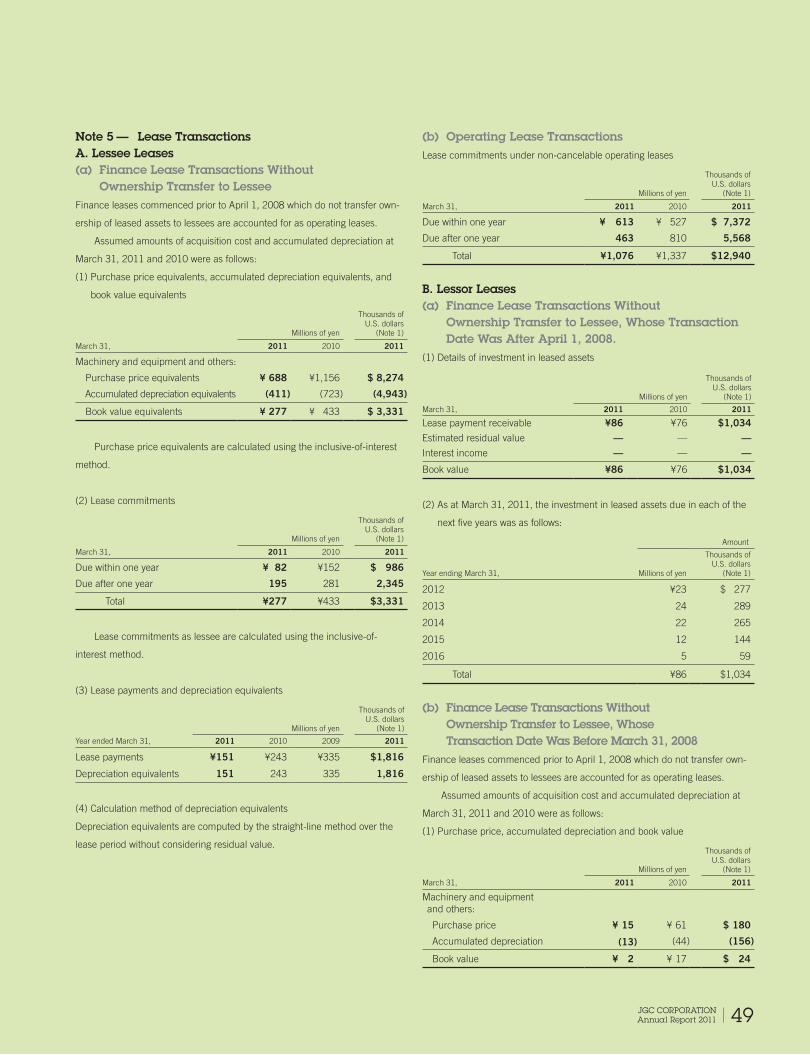
Note 5 — Lease TransactionsA. Lessee Leases(a) Finance Lease Transactions Without
Ownership Transfer to LesseeFinance leases commenced prior to April 1, 2008 which do not transfer own-
ership of leased assets to lessees are accounted for as operating leases.
Assumed amounts of acquisition cost and accumulated depreciation at
March 31, 2011 and 2010 were as follows:
(1) Purchase price equivalents, accumulated depreciation equivalents, and
book value equivalents
Millions of yen
Thousands ofU.S. dollars
(Note 1)
March 31, 2011 2010 2011
Machinery and equipment and others:
Purchase price equivalents ¥ 688 ¥1,156 $ 8,274
Accumulated depreciation equivalents (411) (723) (4,943)
Book value equivalents ¥ 277 ¥ 433 $ 3,331
Purchase price equivalents are calculated using the inclusive-of-interest
method.
(2) Lease commitments
Millions of yen
Thousands ofU.S. dollars
(Note 1)
March 31, 2011 2010 2011
Due within one year ¥ 82 ¥152 $ 986
Due after one year 195 281 2,345
Total ¥277 ¥433 $3,331
Lease commitments as lessee are calculated using the inclusive-of-
interest method.
(3) Lease payments and depreciation equivalents
Millions of yen
Thousands of U.S. dollars
(Note 1)
Year ended March 31, 2011 2010 2009 2011
Lease payments ¥151 ¥243 ¥335 $1,816
Depreciation equivalents 151 243 335 1,816
(4) Calculation method of depreciation equivalents
Depreciation equivalents are computed by the straight-line method over the
lease period without considering residual value.
(b) Operating Lease TransactionsLease commitments under non-cancelable operating leases
Millions of yen
Thousands ofU.S. dollars
(Note 1)
March 31, 2011 2010 2011
Due within one year ¥ 613 ¥ 527 $ 7,372
Due after one year 463 810 5,568
Total ¥1,076 ¥1,337 $12,940
B. Lessor Leases(a) Finance Lease Transactions Without Ownership Transfer to Lessee, Whose Transaction Date Was After April 1, 2008.(1) Details of investment in leased assets
Millions of yen
Thousands of U.S. dollars
(Note 1)
March 31, 2011 2010 2011
Lease payment receivable ¥86 ¥76 $1,034Estimated residual value — — —Interest income — — —
Book value ¥86 ¥76 $1,034
(2) As at March 31, 2011, the investment in leased assets due in each of the
next five years was as follows:
Amount
Year ending March 31, Millions of yen
Thousands of U.S. dollars
(Note 1)
2012 ¥23 $ 277
2013 24 289
2014 22 265
2015 12 144
2016 5 59
Total ¥86 $1,034
(b) Finance Lease Transactions Without Ownership Transfer to Lessee, Whose Transaction Date Was Before March 31, 2008
Finance leases commenced prior to April 1, 2008 which do not transfer own-
ership of leased assets to lessees are accounted for as operating leases.
Assumed amounts of acquisition cost and accumulated depreciation at
March 31, 2011 and 2010 were as follows:
(1) Purchase price, accumulated depreciation and book value
Millions of yen
Thousands ofU.S. dollars
(Note 1)
March 31, 2011 2010 2011
Machinery and equipment and others:
Purchase price ¥ 15 ¥ 61 $ 180
Accumulated depreciation (13) (44) (156)
Book value ¥ 2 ¥ 17 $ 24
JGC CORPORAtION Annual Report 2011 49

(2) Lease commitments
Millions of yen
Thousands ofU.S. dollars
(Note 1)
March 31, 2011 2010 2011
Due within one year ¥2 ¥10 $24
Due after one year 0 7 0
Total ¥2 ¥17 $24
Lease commitments as lessor were calculated using the inclusive-of-
interest method.
(3) Rental income and depreciation
Millions of yen
Thousands of U.S. dollars
(Note 1)
Year ended March 31, 2011 2010 2009 2011
Rental income ¥14 ¥38 ¥87 $168
Depreciation 9 30 79 108
Note 6 — Retirement and Severance BenefitsThe liabilities for employees’ severance and retirement benefits included in
retirement and severance benefits in the liability section of the consolidated
balance sheets as of March 31, 2011 and 2010 consisted of the following:
Millions of yen
Thousands of U.S. dollars
(Note 1)
March 31, 2011 2010 2011
Projected benefit obligation ¥ 44,946 ¥ 46,348 $ 540,541
Less fair value of pension assets (26,509) (26,849) (318,809)
Unfunded projected benefit obligation 18,437 19,499 221,732Less unrecognized net transition obligation (13) (17) (157)
Unrecognized actuarial differences (5,490) (5,816) (66,025)
Unrecognized prior service costs 1,350 1,686 16,236
Net liability for employees’ severance and retirement benefits 14,284 15,352 171,786
Allowance for officers’ lump-sum severance benefits 339 368 4,077
Retirement and severance benefits ¥ 14,623 ¥ 15,720 $ 175,863
Included in the consolidated statements of income for the years ended
March 31, 2011 and 2010, were severance and retirement benefit expenses
comprising the following:
Millions of yen
Thousands of U.S. dollars
(Note 1)
March 31, 2011 2010 2011
Service costs — benefits earned during the year ¥1,690 ¥1,657 $20,325Interest cost on projected benefit obligation 705 711 8,479
Expected return on plan assets (389) (374) (4,678)Amortization of net transition obligation 3 22 36
Amortization of actuarial differences 1,020 1,340 12,267
Amortization of prior service costs (211) (110) (2,538)Contribution for defined-contribution pension plan 107 81 1,286
Severance and retirement benefit expenses ¥2,925 ¥3,327 $35,177
The discount rate used by the Company and its domestic consolidated
subsidiaries was 1.5%–2.0% at March 31, 2011 and 2010. However, some
overseas consolidated subsidiaries used the rate of 8.5% at March 31, 2011
and 2010. The rate of expected return on plan assets used by the Company
and its domestic consolidated subsidiaries was 1.5% and 1.5%–2.0% for
March 31, 2011 and 2010, respectively. However, some overseas consolidated
subsidiaries used the rate of 7.0% and 9.0% at March 31, 2011 and 2010,
respectively. Actuarial differences are recognized in the consolidated state-
ments of income using the declining-balance method over 12 years to 16
years for the years ended March 31, 2011 and 2010, beginning the fiscal year
following recognition. Prior service costs are recognized using the straight line
method over 12 years or 15 years for the years ended March 31, 2011 and
2010, from the fiscal year incurred. Net transition obligation is amortized over
15 years.
Note 7 — Contingencies(1) It is a business practice in Japan for a company to guarantee the indebted-
ness of certain of its trading agents, suppliers, subcontractors and certain
subsidiaries and affiliates. The aggregate amount of such guarantees was
¥18,446 million ($221,840 thousand) and ¥5,217 million at March 31,
2011 and 2010, respectively.
(2) The Company and one consolidated subsidiary have guaranteed employees’
housing loans and others from banks in the amount of ¥11 million ($132
thousand) and ¥10 million at March 31, 2011 and 2010, respectively.
Note 8 — Net AssetsUnder the Japanese Corporation Law (“the Law”) and regulations, the entire
amount paid for new shares is required to be designated as common stock.
However, a company may, by a resolution of the Board of Directors, designate
an amount not exceeding one-half of the price of the new shares as additional
paid-in capital, which is included in capital surplus.JGC CORPORAtION Annual Report 201150

In cases where dividend distribution of surplus is made, the smaller of an
amount equal to 10% of the dividend or the excess, if any, of 25% of common
stock over the total of additional paid-in capital and legal earnings reserve must
be set aside as additional paid-in capital or legal earnings reserve.
Legal earnings reserve is included in retained earnings in the accompany-
ing consolidated balance sheets.
Additional paid-in capital and legal earnings reserve may not be distributed
as dividends. However, all additional paid-in capital and all legal earnings
reserve may be transferred to other capital surplus and retained earnings,
respectively, which are potentially available for dividends.
The maximum amount that the Company can distribute as dividends is
calculated based on the non-consolidated financial statements of the Company
in accordance with the Law.
At the annual shareholders’ meeting of the Company held on June 29,
2011, the shareholders approved cash dividends amounting to ¥7,575 million
($91,100 thousand). Such appropriations have not been accrued in the con-
solidated financial statements as of March 31, 2011. Such appropriations are
recognized in the period in which they are approved by the shareholders.
Note 9 — Information on SecuritiesA. The following tables summarize acquisition costs and book values stated at the
fair value of securities with available fair values as of March 31, 2011 and 2010.
(a) Available-for-Sale Securities With Available Fair Values
(1) Securities with book values exceeding acquisition costs:
Millions of yen
March 31, 2011 Acquisition cost Book value Difference
Equity securities ¥9,121 ¥15,971 ¥6,850
Millions of yen
March 31, 2010 Acquisition cost Book value Difference
Equity securities ¥9,271 ¥17,502 ¥8,231
Thousands of U.S. dollars (Note 1)
March 31, 2011 Acquisition cost Book value Difference
Equity securities $109,694 $192,075 $82,381
(2) Securities with book values not exceeding acquisition costs:
Millions of yen
March 31, 2011 Acquisition cost Book value Difference
Equity securities ¥4,405 ¥3,911 ¥(494)
Millions of yen
March 31, 2010 Acquisition cost Book value Difference
Equity securities ¥2,231 ¥1,974 ¥(257)
Thousands of U.S. dollars (Note 1)
March 31, 2011 Acquisition cost Book value Difference
Equity securities $52,976 $47,035 $(5,941)
B. The following tables summarize book values of securities with no available
fair values or securities not valued by fair market prices as of March 31,
2011 and 2010.
(a) Available-for-Sale Securities
Millions of yen
Thousands of U.S. dollars
(Note 1)
March 31, 2011 2010 2011
Non-listed equity securities ¥10,046 ¥10,184 $120,818
Subscription certificate 39 39 469
Bonds — — —
Negotiable certificate of deposit 30,000 40,500 360,794
Total ¥40,085 ¥50,723 $482,081
(b) Unconsolidated Subsidiaries and Affiliates
Millions of yen
Thousands of U.S. dollars
(Note 1)
March 31, 2011 2010 2011
Securities of unconsolidated subsidiaries ¥ 6,940 ¥ 5,470 $ 83,463
Securities of affiliates 29,207 26,498 351,257
Total ¥36,147 ¥31,968 $434,720
C. Available-for-sale securities with maturities are as follows:
Millions of yen
March 31, 2011 Within
one year
Over one year
but within five years
Over five years but within ten years
Over ten years Total
Negotiable certificate of deposit ¥30,000 ¥— ¥— ¥— ¥30,000
Millions of yen
March 31, 2010 Within
one year
Over one year
but within five years
Over five years but within ten years
Over ten years Total
Negotiable certificate of deposit ¥40,500 ¥— ¥— ¥— ¥40,500
Thousands of U.S. dollars (Note 1)
March 31, 2011 Within
one year
Over one year
but within five years
Over five years but within ten years
Over ten years Total
Negotiable certificate of deposit $360,794 $— $— $— $360,794
The Company and its domestic consolidated subsidiaries follow a policy of
devaluation of available-for-sale securities. The policy of devaluation for the
Company and its domestic consolidated subsidiaries is that if the available fair
value of the securities declines by 50% or more, compared with acquisition
cost, all the corresponding securities are devalued as such decline is consid-
ered to be a substantial and non-recoverable decline in value. In addition, in
the case whereby the available fair value of the securities declines by more
than 30% but by less than 50%, the Company and its domestic consolidated
subsidiaries examine the recoverability of the fair value of the securities and
devaluate if those securities are considered to be non-recoverable.
JGC CORPORAtION Annual Report 2011 51

Note 10 — Derivative Transactions and Hedge Accounting
As explained in Note 1 (t), the accounting standard for financial instruments
requires companies to state derivative financial instruments at fair value and to
recognize changes in the fair value as gains or losses unless derivative finan-
cial instruments are used for hedging purposes.
The Company utilizes foreign currency forward contracts and interest rate
swap contracts as derivative financial instruments only for the purpose of
mitigating future risks of fluctuation of foreign currency exchange rates with
respect to foreign currency receivables and payables and mitigating future
risks of interest rate increases and lowering the financing costs with respect to
borrowings.
Foreign currency forward contracts and interest rate swap contracts are
subject to risks of foreign exchange rate changes and interest rate changes,
respectively.
The derivative transactions are executed and managed in accordance
with the established policies and within the specified limit on the amounts of
derivative transactions allowed.
The following summarizes hedging derivative financial instruments used
by the Company and hedged items:
Hedging instruments: Hedged items:
Foreign currency forward
contracts
Foreign currency trade receivables,
payables and future transactions
denominated in a foreign currency
Foreign currency deposits Foreign currency trade receivables,
payables and future transactions
denominated in a foreign currency
Interest rate swap contracts Interest on loans payable
The Company evaluates hedge effectiveness semi-annually by comparing
the cumulative changes in cash flows from or the changes in fair value of
hedged items and the corresponding changes in the hedging derivative instru-
ments. However, where the principal conditions underlying the hedging instru-
ments and the hedged assets or liabilities are similar, the evaluation of hedge
effectiveness is not performed.
The Company’s financial instrument counter-parties were all prime banks
operating domestically in Japan, and the Company does not expect non-
performance by the counter-parties.
(a) Fair Value of Undesignated Derivative Financial Instruments
Fair value of undesignated derivative financial instruments as of March 31,
2011 and 2010 is summarized as follows:
Millions of yen
Contract amounts
March 31, 2011Due within
one yearDue after one year Total Fair value
Profit or loss evaluation
Forward exchange contracts
Sell U.S. dollars ¥ — ¥— ¥ — ¥— ¥—
Buy Euro ¥72 ¥— ¥72 ¥(4) ¥(4)
Millions of yen
Contract amounts
March 31, 2010Due within
one yearDue after one year Total Fair value
Profit or loss evaluation
Forward exchange contracts
Sell U.S. dollars ¥ 2,789 ¥— ¥ 2,789 ¥ (1) ¥ (1)
Buy Euro ¥12,325 ¥— ¥12,325 ¥(2,225) ¥(2,225)
Thousands of U.S. dollars (Note 1)
Contract amounts
March 31, 2011Due within
one yearDue after one year Total Fair value
Profit or loss evaluation
Forward exchange contracts
Sell U.S. dollars $ — $— $ — $ — $ —
Buy Euro $866 $— $866 $(48) $(48)
Fair value of forward exchange contracts is stated based on the quoted
price from banks.
JGC CORPORAtION Annual Report 201152

(b) Fair Value of Derivative Financial Instruments Designated as Hedging Instruments
Fair value of derivative financial instruments designated as hedging instru-
ments as of March 31, 2011 and 2010 is summarized as follows:
Millions of yen
March 31, 2011 Contract amounts
Accounting method
Hedged instruments
Hedged item
Contract amount
Portion over one year Fair value
Allocation method (Note 1 (t))
Forward exchange contracts
Sell U.S. dollars
Accounts receivable ¥37,305 ¥ 5,677 ¥3,351
Buy Euro Accounts payable ¥16,082 ¥10,807 ¥ 793
Buy British pound
Accounts payable ¥ 127 ¥ — ¥ 2
Special method for interest rate swap (Note 1 (t))
Interest rate swap contracts
Receive variable rate and Pay fixed rate swap
Long-term debt ¥11,696 ¥ 831 *
Millions of yen
March 31, 2010 Contract amounts
Accounting method
Hedged instruments
Hedged item
Contract amount
Portion over one year Fair value
Allocation method (Note 1 (t))
Forward exchange contracts
Sell U.S. dollars
Accounts receivable ¥56,058 ¥25,008 ¥4,541
Buy Euro Accounts payable ¥ 7,263 ¥ 4,364 ¥ (125)
Buy British pound
Accounts payable ¥ 1,232 ¥ — ¥ (320)
Special method for interest rate swap (Note 1 (t))
Interest rate swap contracts
Receive variable rate and Pay fixed rate swap
Long-term debt ¥12,174 ¥12,174 *
Thousands of U.S. dollars (Note 1)
March 31, 2011 Contract amounts
Accounting method
Hedged instruments
Hedged item
Contract amount
Portion over one year Fair value
Allocation method (Note 1 (t))
Forward exchange contracts
Sell U.S. dollars
Accounts receivable $448,647 $ 68,274 $40,301
Buy Euro Accounts payable $193,410 $129,970 $ 9,537
Buy British pound
Accounts payable $ 1,527 $ — $ 24
Special method for interest rate swap (Note 1 (t))
Interest rate swap contracts
Receive floating and Pay fixed rate swap
Long-term debt $140,661 $ 9,994 *
Fair value of forward exchange contracts is stated based on the quoted price from banks.* The fair value of the interest rate swap was included in the long term debt.
Note 11 — Segment InformationEffective from the fiscal year ended March 31, 2011, the Company adopted
the “Accounting Standard for Disclosures about Segments of an Enterprise
and Related Information” (Accounting Standards Board of Japan (“ASBJ”)
Statement No. 17, issued on March 27, 2009) and the “Guidance on
Accounting Standard for Disclosures about Segments of an Enterprise and
Related Information” (ASBJ Guidance No. 20, issued on March 21, 2008).
Certain prior year amounts have been reclassified to conform to the current
year presentation.
(a) Overview of Reported SegmentsThe reported segments of the Company are those units for which separate
financial statements can be obtained among the constituent units of the
Company and regularly examined by Chief Executive Officer (CEO) for deci-
sions on the allocation of management resources and for assessing business
performance. The operations of the Company and its consolidated subsidiaries
are classified into two reportable segments: the total engineering business and
the catalysts and fine products business.
Major activities included in the total engineering business are design,
procurement, construction and performance test services of machinery and
plants for petroleum, petroleum refining, petrochemicals, gas, chemicals,
nuclear energy, metal refining, biochemicals, food, pharmaceuticals, medical,
logistics, information technology, environmental conservation and pollution
control. Major activities in the catalysts and fine products business include
manufacturing and distribution of chemical and catalyst products (FCC cata-
lysts, hydrotreating catalysts, deNOx catalysts, petrochemical catalysts, etc.),
and new functional material products (colloidal silica, coating materials for
surface treatment on cathode ray tubes, material for semiconductors, cathode
materials and cosmetic products, etc.).
JGC CORPORAtION Annual Report 2011 53

The following is information about sales and profit or loss by reported segment for the years ended March 31, 2011, 2010 and 2009:
Regarding the year ended March 31, 2009, because the Company did not separate the reporting segments “Total engineering” and “Others,” “Others” was
included in “Total engineering.”
Millions of yen
Reported Segment
Year ended March 31, 2011Total
engineeringCatalysts and fine products Subtotal Others Total Adjustment Consolidated
Net sales:
External customers ¥401,199 ¥36,031 ¥437,230 ¥ 9,993 ¥447,223 ¥ — ¥447,223 Inter-segment 24 13 37 5,097 5,134 (5,134) —
Total ¥401,223 ¥36,044 ¥437,267 ¥15,090 ¥452,357 ¥ (5,134) ¥447,223
Segment profit ¥ 57,688 ¥ 4,989 ¥ 62,677 ¥ 784 ¥ 63,461 ¥ 98 ¥ 63,559
Segment assets ¥421,190 ¥37,135 ¥458,325 ¥28,709 ¥487,034 ¥(18,531) ¥468,503
Depreciation and amortization ¥ 3,660 ¥ 2,480 ¥ 6,140 ¥ 1,368 ¥ 7,508 ¥ 9 ¥ 7,517
Capital expenditures ¥ 4,598 ¥ 1,769 ¥ 6,367 ¥ 358 ¥ 6,725 ¥ (164) ¥ 6,561
Millions of yen
Reported Segment
Year ended March 31, 2010Total
engineeringCatalysts and fine products Subtotal Others Total Adjustment Consolidated
Net sales:
External customers ¥364,830 ¥37,828 ¥402,658 ¥11,600 ¥414,258 ¥ — ¥414,258
Inter-segment 20 13 33 5,062 5,095 (5,095) —
Total ¥364,850 ¥37,841 ¥402,691 ¥16,662 ¥419,353 ¥ (5,095) ¥414,258
Segment profit ¥ 39,310 ¥ 2,583 ¥ 41,893 ¥ (70) ¥ 41,823 ¥ 96 ¥ 41,919
Segment assets ¥382,371 ¥33,601 ¥415,972 ¥32,339 ¥448,311 ¥(18,135) ¥430,176
Depreciation and amortization ¥ 3,617 ¥ 2,840 ¥ 6,457 ¥ 2,708 ¥ 9,165 ¥ (31) ¥ 9,134
Capital expenditures ¥ 4,086 ¥ 720 ¥ 4,806 ¥ 2,272 ¥ 7,078 ¥ (16) ¥ 7,062
Millions of yen
Year ended March 31, 2009Total
engineeringCatalysts and fine products Total
Elimination or corporate Consolidated
Net sales:
External customers ¥411,642 ¥39,270 ¥450,912 ¥ — ¥450,912
Inter-segment 25 66 91 (91) —
Total ¥411,667 ¥39,336 ¥451,003 ¥ (91) ¥450,912
Operating income ¥ 50,688 ¥ 1,292 ¥ 51,980 ¥ 23 ¥ 52,003
Identifiable assets ¥446,976 ¥39,064 ¥486,040 ¥(5,761) ¥480,279
Depreciation and amortization ¥ 3,625 ¥ 3,354 ¥ 6,979 ¥ (0) ¥ 6,979
Capital expenditures ¥ 2,544 ¥ 2,359 ¥ 4,903 ¥ — ¥ 4,903
Thousands of U.S. dollars (Note 1)
Reported Segment
Year ended March 31, 2011Total
engineeringCatalysts and fine products Subtotal Others Total Adjustment Consolidated
Net sales:
External customers $4,825,003 $433,325 $5,258,328 $120,181 $5,378,509 $ — $5,378,509 Inter-segment 289 156 445 61,299 61,744 (61,744) —
Total $4,825,292 $433,481 $5,258,773 $181,480 $5,440,253 $ (61,744) $5,378,509
Segment profit $ 693,782 $ 60,000 $ 753,782 $ 9,429 $ 763,211 $ 1,179 $ 764,390
Segment assets $5,065,423 $446,603 $5,512,026 $345,268 $5,857,294 $(222,862) $5,634,432
Depreciation and amortization $ 44,017 $ 29,826 $ 73,843 $ 16,452 $ 90,295 $ 108 $ 90,403
Capital expenditures $ 55,298 $ 21,275 $ 76,573 $ 4,305 $ 80,878 $ (1,972) $ 78,906
JGC CORPORAtION Annual Report 201154

(b) Related InformationI. Information by Geography(1) Net Sales
Millions of yen
Thousands of U.S. dollars
(Note 1)
Year ended March 31, 2011 2010 2009 2011
Japan ¥130,975 ¥168,315 ¥193,550 $1,575,165
East and Southeast Asia 32,533 33,911 69,284 391,257
Middle East 181,683 141,467 175,872 2,185,003
Africa 40,900 30,534 7,069 491,882
Oceania 49,901 18,607 1,544 600,132
Other 11,231 21,424 3,593 135,070
Total sales ¥447,223 ¥414,258 ¥450,912 $5,378,509
*1. Net sales are classified by the place of customers’ address.*2. Middle East includes Saudi Arabia ¥113,595 million ($1,366,146 thousand), ¥104,995 million,
and ¥119,883 million and United Arab Emirates ¥51,281 million ($616,729 thousand), ¥6,208 million, and ¥43 million for the years ended March 31, 2011, 2010, and 2009, respectively.
(2) Property and Equipment
Property and equipment information is not disclosed, as the Company and its
consolidated subsidiaries operate mainly within Japan.
II. Information by Major Customers
Year ended March 31, 2011 Millions of yen
Thousands of U.S. dollars
(Note 1) Related segments
Saudi Polymers Company ¥57,730 $694,287 Total engineering
Abu Dhabi Gas Industries Ltd. 51,281 616,729 Total engineering
Saudi Arabian Oil Company 50,797 610,908 Total engineering
III. Information on Impairment LossNot Applicable for the years ended March 31, 2011 and 2009.
The following is information on impairment loss by reported segments for
the year ended March 31, 2010:
Millions of yen
Reported Segment
Year ended March 31, 2010Total
engineering
Catalysts and fine products Subtotal Others Total Adjustment Consolidated
Impairment loss ¥3,603 ¥— ¥3,603 ¥— ¥3,603 ¥— ¥3,603
IV. Information on Amortization of Goodwill and Amortized Balance
This information is not disclosed, as this is immaterial for the years ended
March 31, 2011, 2010 and 2009.
V. Information on Gain on Negative GoodwillNot Applicable for the years ended March 31, 2011, 2010 and 2009.
Note 12 — Taxes on IncomeThe statutory tax rate for 2011, 2010 and 2009 was 36.2%.
The following table summarizes the significant differences between the
statutory tax rate and the Company’s and its consolidated subsidiaries’ effec-
tive tax rate for financial statement purposes for the years ended March 31,
2011, 2010 and 2009:
2011 2010 2009
Statutory tax rate 36.2% 36.2% 36.2%
Non-deductible expenses 0.2 0.3 0.6
Non-taxable dividend income (3.0) (3.0) (1.8)
Tax credit utilized (0.7) (1.9) (1.1)
Other 18.5 (2.9) 2.4
Effective tax rate 51.2% 28.7% 36.3%
Significant components of the Company’s and its consolidated subsidiar-
ies’ deferred tax assets and liabilities as of March 31, 2011 and 2010, were
as follows:
Millions of yen
Thousands of U.S. dollars
(Note 1)
March 31, 2011 2010 2011
Current deferred taxes
Deferred tax assets:
Excess accrued employees’ bonuses ¥ 2,538 ¥ 2,474 $ 30,523
Excess reserve for job warranty costs 102 106 1,227
Excess reserve for losses on contracts 194 55 2,333
Other 9,091 11,472 109,333
Total current deferred tax assets 11,925 14,107 143,416
Deferred tax liabilities:
Retained earnings of foreign subsidiaries (164) (206) (1,972)
Other (1,521) (1,719) (18,293)
Total current deferred tax liabilities (1,685) (1,925) (20,265)
Net current deferred tax assets ¥10,240 ¥12,182 $123,151
For the years ended March 31, 2011 and 2010, there was no valuation
allowance.
JGC CORPORAtION Annual Report 2011 55

Millions of yen
Thousands of U.S. dollars
(Note 1)
March 31, 2011 2010 2011
Non-current deferred taxes
Deferred tax assets:
Employee’s retirement and severance benefits ¥ 5,216 ¥ 5,787 $ 62,730
Excess bad debt expenses 5,744 6,541 69,080
Other 1,410 1,451 16,957
Total non-current deferred tax assets 12,370 13,779 148,767
Deferred tax liabilities:
Net unrealized gains on securities (1,895) (2,888) (22,790)
Other (171) (141) (2,056)
Total non-current deferred tax liabilities (2,066) (3,029) (24,846)
Net non-current deferred tax assets ¥10,304 ¥10,750 $123,921
Deferred tax liabilities for land revaluation ¥ 3,783 ¥ 3,783 $ 45,496
Deferred tax liabilities for full revaluation of the consolidated subsidiary ¥ 245 ¥ 48 $ 2,946
Others 5 1 61
Non-current deferred tax liabilities ¥ 250 ¥ 49 $ 3,007
For the years ended March 31, 2011 and 2010, the valuation allowances
of ¥225 million ($2,706 thousand) and ¥461 million have been deducted from
the gross amount of the non-current deferred tax assets, respectively.
Note 13 — Notes to the Consolidated Statements of Cash Flows
Reconciliation of cash in the consolidated balance sheets and cash and cash
equivalents in the consolidated statements of cash flows was as follows:
Millions of yen
Thousands of U.S. dollars
(Note 1)
March 31, 2011 2010 2009 2011
Cash and deposits ¥131,894 ¥ 83,308 ¥117,782 $1,586,218
Marketable securities 30,000 40,500 56,500 360,794
Cash and cash equivalents ¥161,894 ¥123,808 ¥174,282 $1,947,012
Note 14 — Land RevaluationPursuant to Article 2 of the Enforcement Ordinance for the Law Concerning
Land Revaluation (the “Law”) effective March 31, 1998, the Company
recorded its owned land used for business at fair value as of March 31, 2002,
and the related revaluation difference, net of income taxes, was debited to
“Land revaluation, net of deferred tax portion” in the net assets section. The
applicable income tax portion was reported as Deferred Tax Liabilities for
Land Revaluation in the consolidated balance sheet at March 31, 2011 and
2010. When such land is sold, land revaluation is reversed and debited to
retained earnings.
Fair value of the revalued land as of March 31, 2011 was ¥2,775 million
($33,373 thousand) less than the book value as of March 31, 2011, which
amount includes ¥1,081 million ($13,001 thousand) relevant to rental property.
Note 15 — Related Party TransactionsSignificant transactions with related parties for the years ended March 31,
2011, 2010 and 2009 were as follows:
Millions of yen
Thousands of U.S. dollars
(Note 1)
Year ended March 31, 2011 2010 2009 2011
Medical Management Matsuzawa Co. Ltd.
— Support management and accept order for construction service ¥8,533 ¥— ¥ — $102,622
Solacor Electricidad Uno S.A. (affiliated company)
— guarantee obligation ¥5,763 ¥— ¥ — $69,308
Solacor Electricidad Dos S.A. (affiliated company)
— guarantee obligation ¥5,698 ¥— ¥ — $68,527
JGC Energy Development (USA) Inc.*
— unsecured long-term loan ¥ — ¥— ¥2,882 $ —
The balances of the Company due to related parties as of March 31,
2011, 2010 and 2009 were as follows:
Millions of yen
Thousands of U.S. dollars
(Note 1)
March 31, 2011 2010 2009 2011
Medical Management Matsuzawa Co. Ltd.
— Accounts receivable ¥7,837 ¥— ¥ — $94,251
JGC Energy Development (USA) Inc.* ¥ — ¥— ¥7,171 $ —
— unsecured long-term loan receivable ¥7,837 ¥— ¥7,171 $94,251
The Company doesn’t receive a guarantee charge from Solacor
Electricidad Uno S.A. and Solacor Electricidad Dos S.A.
The supporting management fee, the construction service fee and the
interest rate for the long-term loan receivable were reasonably determined,
considering the market interest rate. No pledged assets were furnished.
* JGC Energy Development (USA) Inc. has become material and was newly included within the scope of consolidation for the year ended March 31, 2010. All transactions and balances with JGC Energy Development (USA) Inc. were eliminated in the consolidated financial statements for the years ended March 31, 2011, and 2010.
JGC CORPORAtION Annual Report 201156

Note 16 — Business CombinationsTransactions under common control during the year ended March 31, 2010:
(a) Outline of the Transactions(1) Name and business of combined entity
Merging company: JGC Information Systems Co., Ltd. (“J-SYS”), IT business
Merged company: J-SYS Software Co., Ltd. (“J-SYS SOFT”), software sales
(2) Form of business combinations
Transactions under common control (Merger with companies which develop
information systems, and produce and sell software)
(3) Name of the entity after the reorganization
JGC Information Systems Co., Ltd.
(4) Outline and purpose of the transaction
J-SYS, a consolidated subsidiary of the Company merged with J-SYS SOFT, a
consolidated subsidiary of the Company on April 1, 2009. The purpose of this
merger was to reinforce the following:
[1] Restructuring sales transactions and improvement of sales force
[2] Reinforcement of employees and human resources
[3] Combine and develop customers’ information system and sales channel.
(b) Accounting MethodThese transactions were accounted for as a business combination among
entities under common control.
(c) Amounts of Assets and Liabilities Received and Incurred on the Date of Business Combination
Total assets ¥173 million
Total liabilities ¥166 million
Transactions under common control during the year ended March 31, 2009:
(a) Outline of the Transactions(1) Name and business of combined entity
Merging company: Catalysts & Chemicals Industries Co., Ltd. (“CCIC”),
Production and sales of catalysts
Merged company: Nikki Chemical Co., Ltd. (“NCC”), Production and
sales of catalysts
(2) Form of business combinations
Transactions under common control (Merger with companies which pro-
duce and sell catalysts)
(3) Name of the entity after the reorganization
JGC Catalysts and Chemicals Ltd.
(4) Outline and purpose of the transaction
CCIC, a consolidated subsidiary of the Company merged with NCC, a
consolidated subsidiary of the Company on July 1, 2008. The purpose of
this merger was to reinforce the following:
[1] Fusion of proprietary techniques and R&D facilities, and accelerating
R&D through qualitative and substantive expansion;
[2] Expansion of production capability by means of a two-factory system
and a reduction in production risks; and
[3] Expanding the scope of business and stabilization of management base
fulfillment by focusing on three main operations (petroleum refining
catalysts, chemical catalysts, and fine chemicals products).
(b) Accounting MethodThese transactions were accounted for as a business combination among
entities under common control.
(c) Amounts of Assets and Liabilities Received and Incurred on the Date of Business Combination
Total assets ¥7,614 million
Total liabilities ¥4,216 million
Note 17 — Rental PropertyEffective from the year ended March 31, 2010, the Company and its consoli-
dated subsidiaries adopted the “Accounting Standard for Disclosures about
Fair Value of Investment and Rental Property” (Accounting Standards Board
of Japan (“ASBJ”) Statement No. 20, issued on November 28, 2008) and
“Guidance on Accounting Standard for Disclosures about Fair Value of Invest-
ment and Rental Property” (ASBJ Guidance No. 23, issued on November 28,
2008) for the years ending on or after March 31, 2010. Pursuant to the new
requirements, information about fair value of investment and rental property
on the consolidated financial statements at March 31, 2011, and 2010, is
as follows:
Book value (net of depreciation) Fair value
March 31, 2009 Decrease
March 31, 2010
March 31, 2010
Millions of yen ¥ 8,227 ¥ (130) ¥ 8,097 ¥ 6,201
March 31, 2010 Decrease
March 31, 2011
March 31, 2011
Millions of yen ¥ 8,097 ¥ (124) ¥ 7,973 ¥ 6,201
Thousands of U.S dollars (Note 1) $97,378 $(1,491) $95,887 $74,576
Rental real estate assets are presented on the consolidated balance
sheets net of accumulated depreciation and accumulated impairment loss.
The reason for the decrease was mainly due to the depreciation of the
assets.
The fair value was calculated by the Company based on “the guidance
for apprising real estate.”
The Company has rental commercial properties (including land) in
Kanagawa prefecture. The rental incomes in Other income were ¥407 million
($4,895 thousand) and ¥403 million for the years ended March 31, 2011
and 2010, respectively.
JGC CORPORAtION Annual Report 2011 57

Note 18 — Financial InstrumentsEffective from the year ended March 31, 2010, the Company adopted the
revised Accounting Standard, “Accounting Standard for Financial Instru-
ments” (Accounting Standards Board of Japan (“ASBJ”) Statement No. 10,
revised on March 10, 2008) and the “Guidance on Disclosures about Fair
Value of Financial Instruments” (ASBJ Guidance No. 19, revised on March 10,
2008). Information on financial instruments for the years ended March 31,
2011 and 2010 required pursuant to the revised accounting standards is
as follows.
A. Qualitative Information on Financial Instruments(a) Policies for Using Financial InstrumentsThe Company manages surplus capital using financial instruments that are
short-term and carry little or no risk. The Company uses derivatives to mitigate
the risks that are described below, and as a matter of policy does not use
derivatives for speculative transactions.
(b) Financial Instruments, Associated Risks and the Risk Management System
Notes and accounts receivable expose the Company to customer credit risk.
Marketable securities are mainly negotiable certificates of deposit. Investment
securities are mainly related to the business and capital alliance companies
and expose the Company to changes in market prices. Long-term loans
receivable are mainly related to subsidiaries and affiliates.
Most notes and accounts payable are due within one year. Some accounts
payable associated with purchasing machines and construction contracts are
denominated in foreign currencies, which exposes the Company to the risks of
exchange rate fluctuations. The Company generally procures capital required
under its business plan through bank loans. Some bank loans expose the
Company to the risks of interest rate fluctuations, which the Company uses
interest rate swaps to hedge.
The Company uses derivatives transactions including forward foreign
exchange contracts to hedge the risk of exchange rate fluctuations associated
with receivables and payables denominated in foreign currencies and interest
rate swaps to hedge the risk of interest rate fluctuations associated with loans.
‘Derivative Transactions and Hedge Accounting’ in Note 1(t) and Note 10
presented earlier explain hedge accounting issues including methods, hedging
policies, hedged items and recognition of gain or loss on hedged positions.
(c) Risk Management System for Financial Instruments(1) Credit risk management (counterparty risk)
The Company has established internal procedures for receivables under
which the related divisions are primarily responsible for periodically moni-
toring counterparty status. The department manages amounts and settle-
ment dates by counterparty and works to quickly identify and mitigate
payment risk that may result from situations including deterioration of the
financial condition of counterparties. Consolidated subsidiaries are subject
to the same risk management rules.
In using derivatives transactions, the Company mitigates counterparty
risk by conducting transactions with highly creditworthy financial
institutions.
(2) Market risk management (risk of exchange rate and interest
rate fluctuations)
The Company monitors the balance of the foreign currency receivables
and payables in each currency every month and utilizes foreign currency
forward contracts and foreign currency deposits to hedge the risk of fluc-
tuations. The Company uses interest rate swaps to mitigate the risk of
interest rate fluctuations associated with loans.
Regarding marketable securities and investment securities, the
Company periodically examines fair value and the financial condition of
the issuing entities and revises its portfolio based on its relationships with
issuing entities.
The derivative transactions are executed and managed in accordance
with the established policies and within the specified limit on the amounts
of derivative transactions allowed. The Company handles the transactions
and periodically provides administrative reports on the results to the finan-
cial director and treasurer.
(3) Management of liquidity risk associated with capital procurement
(payment default risk)
The Company manages liquidity risk by creating and updating a capital
deployment plan based on reports from each division.
(d) Supplemental Information on the Fair Values of Financial Instruments
The fair value of financial instruments is based on market prices, or a reason-
able estimate of fair value for instruments for which market prices are not
available. Estimates of fair value are subject to fluctuation because they
employ variable factors and assumptions.
In addition, the contractual amounts of the derivatives transactions dis-
cussed in B (a) below are not an indicator of the market risk associated with
derivatives transactions.
JGC CORPORAtION Annual Report 201158

B. Fair Values of Financial Information(a) Fair Values of Financial InstrumentsFair values of financial instruments as of March 31, 2011 and 2010 were as
follows:
The financial instruments, whose fair value is difficult to measure, are not
included in the table below and are summarized in B (b).
Millions of yen
March 31, 2011Carrying amount
Estimated fair value Difference
Cash and deposits ¥131,894 ¥131,894 ¥ —
Marketable securities 30,000 30,000 —
Notes and accounts receivable 108,810 108,810 —
Other receivables 7,235 7,235
Marketable and investment securities 19,882 19,882 —
Long-term loans receivable, net* 1,780 1,836 56
Total assets ¥299,601 ¥299,657 ¥ 56
Notes and accounts payable ¥ 70,762 ¥ 70,762 ¥ —
Long-term debt 6,624 6,763 139
Total liabilities ¥ 77,386 ¥ 77,525 ¥139
Derivative financial instruments, net ¥ 4,142 ¥ 4,142 ¥ —
Millions of yen
March 31, 2010Carrying amount
Estimated fair value Difference
Cash and deposits ¥ 83,308 ¥ 83,308 ¥ —
Marketable securities 40,500 40,500 —
Notes and accounts receivable 87,626 87,626 —
Other receivables 11,744 11,744
Marketable and investment securities 19,476 19,476 —
Long-term loans receivable, net* 1,103 1,139 36
Total assets ¥243,757 ¥243,793 ¥ 36
Notes and accounts payable ¥ 59,392 ¥ 59,392 ¥ —
Long-term debt 21,926 22,622 696
Total liabilities ¥ 81,318 ¥ 82,014 ¥696
Derivative financial instruments, net ¥ 1,870 ¥ 1,870 ¥ —
Thousand of U.S. dollars (Note 1)
March 31, 2011Carryingamount
Estimated fair value Difference
Cash and deposits $1,586,218 $1,586,218 $ —
Marketable securities 360,794 360,794 —
Notes and accounts receivable 1,308,599 1,308,599 —
Other receivables 87,011 87,011
Marketable and investment securities 239,110 239,110 —
Long-term loans receivable, net* 21,407 22,080 673
Total assets $3,603,139 $3,603,812 $ 673
Notes and accounts payable $ 851,016 $ 851,016 $ —
Long-term debt 79,663 81,335 1,672
Total Liabilities $ 930,679 $ 932,351 $1,672
Derivative financial instruments, net $ 49,814 $ 49,814 $ —
* The amounts for probable losses calculated by applying a percentage based on collection experience to the remaining accounts are deducted.
The following methods and assumptions were used to estimate the fair
value of the financial instruments.
Cash and deposits, and marketable securities
All deposits and negotiable certificates of deposit are short-term. Therefore,
the carrying amount is used for the fair value of these items because
these amounts are essentially the same.
Notes and accounts receivable
Notes and accounts receivable are short-term. Therefore, the carrying
amount is used for the fair value of short-term receivables because these
amounts are essentially the same.
Other receivables
Other receivables are short-term. Therefore, the carrying amount is used
for the fair value of short-term receivables because these amounts are
essentially the same.
Marketable and investment securities
Marketable and investment securities are the price listed on securities
exchanges for equities. In addition, Note 9 provides information on mar-
ketable securities by holding intent.
Long-term loans receivable
Fair value of long-term loans receivable is estimated as the discounted
present value of total principal and interest using assumed interest rates
for equivalent new loans.
Notes and accounts payable
Notes and accounts payable are short-term. Therefore, the carrying
amount is used for the fair value of short-term payables because these
amounts are essentially the same.
Long-term debt
Fair value of long-term debt is estimated as discounted present value of
total principal and interest using assumed interest rates for equivalent
new loans. Interest rate swaps subject to special method are used for
long-term floating-rate loans. Principal and interest of the loans in which
these interest rate swaps are embedded are discounted using a reason-
able estimate of the interest rate on the loan at the time of issue.
Derivative financial instruments
Please refer to ‘Derivative Transactions and Hedge Accounting’ in Note
1 (t) and Note 10.
JGC CORPORAtION Annual Report 2011 59

(b) Financial Instruments Whose Fair Values Were Difficult to Measure
The financial instruments, whose fair value was difficult to measure, as of
March 31, 2011 and 2010, were as follows:
March 31,
Millions of yen
Thousands of U.S. dollars
(Note 1)
2011 2010 2011
Unconsolidated subsidiaries and affiliates ¥36,147 ¥31,968 $434,720
Non-listed equity securities 10,046 10,184 120,818
Subscription certificates 39 39 469
It is difficult to measure the fair value of these financial instruments
because there is no market price available and it is not efficient to calculate
future cash flow. Therefore, these financial instruments were not included in
the Marketable and investment securities described in B (a).
(c) Maturities of Financial InstrumentsThe maturities of the financial instruments at March 31, 2011 were as follows:
Millions of yen
Year ending March 31, 2012 2013–2016 2017–20212022 and thereafter
Cash and deposits ¥131,894 ¥ — ¥ — ¥ —
Marketable securities 30,000 — — —
Notes and accounts receivable 108,810 — — —
Other receivables 7,235 — — —
Long-term loans receivable, net — 1,036 616 128
Total assets ¥277,939 ¥1,036 ¥616 ¥128
Thousand of U.S. dollars (Note 1)
Year ending March 31, 2012 2013–2016 2017–20212022 and thereafter
Cash and deposits $1,586,218 $ — $ — $ —
Marketable securities 360,794 — — —
Notes and accounts receivable 1,308,599 — — —
Other receivables 87,011 — — —
Long-term loans receivable, net — 12,460 7,408 1,539
Total assets $3,342,622 $12,460 $7,408 $1,539
Please see Note 3 for the maturities of Long term-debt.
Note 19 — Impairment of Fixed AssetsAs discussed in Note 1 (l), the Company and its consolidated subsidiaries
have applied the accounting standard for impairment of fixed assets.
The Company and its consolidated subsidiaries have grouped their
fixed assets principally based on their business segment, while consider-
ing mutual supplementation of the cash flows.
Loss on impairment of fixed assets for the year ended March 31,
2010 consisted of the following:
Location Use Type of assets
Houston (U.S.A.) The concession for a mining area
Other—Property and EquipmentOther—Other Assets
The carrying amount of certain assets was devalued to their recoverable
amounts, since the oil and gas reserves added by additional drilling have fallen
short of the originally expected reserves. As a result, The Company and one
consolidated overseas subsidiary recognized loss on impairment in the amount
of ¥3,603 million, which consisted of other assets ¥2,716 million and property
and equipment ¥887 million.
The overseas subsidiary used the value in use which was calculated by
discounting future cash flows at the interest rate of 10% based on U.S. GAAP.
Note 20 — Settlement PackageRegarding the Nigeria LNG Project, The Company accrued the expense
incurred due to the settlement with the U.S. Department of Justice and
government of Nigeria under “Settlement Package.”
Note 21 — Subsequent EventThe Company’s wholly owned subsidiary JGC Project Services Co., Ltd.,
merged its wholly owned subsidiary, Nikki Construction Co., Ltd. on April 1,
2011 and the surviving company name is JGC Plant Solutions Co., Ltd.
JGC CORPORAtION Annual Report 201160

1 Framework of Internal Control Over Financial ReportingKeisuke Takeuchi, Chief Executive Officer, Koichi Kawana, Chief
Operating Officer, and Masayuki Sato, Chief Financial Officer of
JGC Corporation (“the Company”) are responsible for establishing
and maintaining adequate internal control over financial reporting
(as defined in the rule “On the Setting of the Standards and Prac-
tice Standards for Management Assessment and Audit concerning
Internal Control Over Financial Reporting”).
Because of its inherent limitations, internal control over finan-
cial reporting may not completely prevent or detect misstatements.
2 Assessment Scope, Timing and ProceduresBasis of Presenting Internal Control ReportThe report on internal control over financial reporting of the con-
solidated financial statements of the Company (“Internal Control
Report”) is prepared on the basis of generally accepted assess-
ment standards of internal control over financial reporting in
Japan (“Assessment Standards”) and is compiled from the Inter-
nal Control Report prepared by the Company as required by the
Financial Instruments and Exchange Law of Japan (“the Law”).
The Assessment Standards require management to assess the
internal control over financial reporting (“ICOFR”), which consists
of the internal control over the consolidated/parent only financial
statements included in the Annual Securities Report filed under
the Law and the internal control over disclosure information and
others included in the Annual Securities Report that materially
affects the reliability of the financial statements.
The scope of management’s assessment of ICOFR in this
annual report is different from the scope required by the Assess-
ment Standards. Management assessment of ICOFR for this
annual report covers the ICOFR with respect to the accompanying
consolidated financial statements only. In addition, as explained in
Note 1 on the basis of presenting consolidated financial state-
ments, the accompanying consolidated financial statements are
reclassified and modified from the consolidated financial state-
ments prepared for the purpose of the Law. Supplementary infor-
mation is also added to the consolidated financial statements. The
process of making reclassifications and modifications and the
addition of certain information is for the convenience of readers
outside Japan. Management voluntarily includes the process in its
assessment of ICOFR, even though it is outside the scope of the
Assessment Standards.
Scope of AssessmentWe have assessed our ICOFR as of March 31, 2011 in accordance
with the Assessment Standards.
We assessed the design and operation of our company-level
control and based on this assessmemt, we analysed business
processes within the scope of the internal control to be assessed,
identified a key control that would have a material impact on the
reliability of financial reporting and assessed whether the basic
components of internal control are operating with regard to the
key control.
We assessed the effectiveness of ICOFR of the Company, con-
solidated subsidiaries and affiliates to the extent necessary in light
of their degree of impact on the reliability of financial reporting.
In assessing the effectiveness of internal control, we decided
on reasonable scope of assessment for the important business
processes in light of their degree of quantitative and qualitative
impact on financial reporting based on the assessment of the
company-level control.
Locations and business units that did not have a material effect
on financial reporting were excluded from the scope of assessments.
In assessing the period-end financial reporting process, we
decided on reasonable scope of assessment in light of its degree
of quantitative and qualitative impact on financial reporting in a
similar manner as company-level control.
In assessing the business processes other than described
above, based on the assessment of the company-level controls,
we assessed the significant business locations based on the their
sales levels until their combined sales amounts reaches approxi-
mately two-thirds on a consolidated basis and the business pro-
cesses which impact the accounts (sales, accounts receivable and
inventory) that were closely associated with the significant busi-
ness locations’ business objectives.
3 Results of assessmentBased on the above assessments, the Company’s management
has concluded that, as of March 31, 2011, the Company’s internal
control over financial reporting was effective.
4 Supplementary informationNot applicable.
5 OtherNot applicable.
Keisuke TakeuchiChairman of the Board of Directors
and Chief Executive Officer
June 29, 2011
Internal Control Report
JGC CoRpoRatIon annual Report 2011 61

To the Shareholders and Board of Directors of
JGC Corporation (Nikki Kabushiki Kaisha):
Financial statement auditWe have audited the accompanying consolidated balance sheets of JGC Corporation (a Japanese corporation) and consolidated
subsidiaries as of March 31, 2011 and 2010, the related consolidated statements of income, changes in net assets and cash flows
for each of the three years in the period ended March 31, 2011, and the related consolidated statements of comprehensive income
for each of the two years in the period ended March 31, 2011, expressed in Japanese yen. These consolidated financial statements
are the responsibility of the Company’s management. Our responsibility is to independently express an opinion on these consoli-
dated financial statements based on our audits.
We conducted our audits in accordance with auditing standards generally accepted in Japan. Those standards require that we plan
and perform the audit to obtain reasonable assurance about whether the financial statements are free of material misstatement. An
audit includes examining, on a test basis, evidence supporting the amounts and disclosures in the financial statements. An audit
also includes assessing the accounting principles used and significant estimates made by management, as well as evaluating the
overall financial statement presentation. We believe that our audits provide a reasonable basis for our opinion.
In our opinion, the consolidated financial statements referred to above present fairly, in all material respects, the consolidated
financial position of JGC Corporation and subsidiaries as of March 31, 2011 and 2010, and the consolidated results of their
operations and their cash flows for the years then ended, in conformity with accounting principles generally accepted in Japan.
The U.S. dollar amounts in the accompanying consolidated financial statements with respect to the year ended March 31, 2011 are
presented solely for convenience. Our audit also included the translation of yen amounts into U.S. dollar amounts and, in our opinion,
such translation has been made on the basis described in Note 1 to the consolidated financial statements.
Internal control auditWe also have audited the accompanying report on internal control over financial reporting of the consolidated financial statements of
JGC Corporation as of March 31, 2011 (“Internal Control Report”). The design and operation of internal control over financial report-
ing and the preparation of the Internal Control Report are the responsibility of the Company’s management. Our responsibility is to
independently express an opinion on the Internal Control Report based on our audit. Internal control over financial reporting may not
completely prevent or detect financial statement misstatements.
We conducted our internal control audit in accordance with auditing standards for internal control over financial reporting generally
accepted in Japan. Those standards require that we plan and perform the audit to obtain reasonable assurance about whether the
Internal Control Report is free of material misstatement. An internal control audit is performed on a test basis and includes evaluating
the appropriateness of the scope, procedures and result of the assessment determined and presented by management and the overall
Internal Control Report presentation. We believe that our internal control audit provides a reasonable basis for our opinion.
In our opinion, the Internal Control Report referred to above, in which JGC Corporation states that internal control over financial
reporting of the consolidated financial statements was effective as of March 31, 2011, presents fairly, in all material respects, the
assessment of internal control over financial reporting in conformity with assessment standards for internal control over financial
reporting generally accepted in Japan.
(KPMG AZSA LLC)
Tokyo, Japan
June 29, 2011
Independent auditors’ ReportJGC CORPORATION
JGC CoRpoRatIon annual Report 201162

2011 2010 2009 2008 2007 2006
Net Sales ¥ 359,561 ¥317,597 ¥349,925 ¥460,161 ¥528,794 ¥ 484,382
Operating Income 51,918 32,145 41,356 30,550 14,432 12,221
Income Before Taxes on Income 45,205 27,934 44,578 32,832 21,538 16,652
Net Income 22,853 21,271 30,214 21,312 15,183 11,412
Total Current Assets 272,339 232,540 276,325 270,646 278,627 191,149
Total Current Liabilities 167,621 126,240 184,205 194,470 216,473 158,011
Working Capital 104,718 106,300 92,120 76,176 62,154 33,138
Current Ratio 162.5% 184.2% 150.0% 139.2% 128.7% 121.0%
Net Property and Equipment 49,956 50,364 49,414 51,115 53,081 53,745
Total Assets 415,737 374,549 412,893 404,424 418,285 333,545
Long-Term Debt, Less Current Maturities 1,663 16,104 16,757 15,519 16,382 176
Total Net Assets 227,794 212,619 192,655 174,795 165,191 155,636
New Contracts 569,128 675,505 440,548 348,755 255,015 765,188
Outstanding Contracts 1,163,078 953,511 641,781 607,378 728,168 1,009,515
Net Income per Share (in yen) 90.44 84.15 119.50 84.01 59.81 44.49
Cash Dividends per Share (in yen) 30.0 21.0 30.0 21.0 15.0 11.0
Number of Employees 2,137 2,107 2,069 2,014 1,953 1,868
Six-Year Summary—Non-ConsolidatedFor the six years ended March 31. Yen amounts are in millions except per share data.
JGC CORPORAtION Annual Report 2011 63

Millions of yen
Thousands of U.S. dollars
(Note 1)
Assets 2011 2010 2011
Current Assets:
Cash and deposits ¥123,530 ¥ 72,718 $1,485,628
Marketable securities 30,000 40,500 360,794
Notes and accounts receivable (Note 2) 83,747 62,857 1,007,180
Contract works in progress 13,956 25,479 167,841
Deferred tax assets (Note 7) 8,363 10,775 100,577
Other current assets (Note 2) 12,840 20,295 154,421
Allowance for doubtful accounts (Note 1(q)) (97) (84) (1,167)
Total Current Assets 272,339 232,540 3,275,274
Property and Equipment (Note 3):
Land (Note 8) 22,391 22,391 269,284
Buildings and structures 48,831 46,830 587,264
Machinery and equipment 8,867 8,153 106,639
Construction in progress 438 1,643 5,268
80,527 79,017 968,455
Less accumulated depreciation (30,571) (28,653) (367,661)
Net Property and Equipment 49,956 50,364 600,794
Other Assets:
Investments in subsidiaries and affiliates 40,269 37,719 484,293
Marketable and investment securities 29,854 29,568 359,038
Long-term loans receivable (Note 2) 10,414 12,047 125,244
Deferred tax assets (Note 7) 9,163 8,829 110,198
Other 3,742 3,482 45,003
Total Other Assets 93,442 91,645 1,123,776
Total Assets ¥415,737 ¥374,549 $4,999,844
The accompanying notes are an integral part of these statements.
Non-Consolidated Balance SheetsJGC CORPORATION March 31, 2011 and 2010
JGC CORPORAtION Annual Report 201164

Millions of yen
Thousands of U.S. dollars
(Note 1)
Liabilities and Net Assets 2011 2010 2011
Current Liabilities:
Short-term loans (Notes 2 & 3) ¥ 32,652 ¥ 12,422 $ 392,688
Notes and accounts payable (Note 2) 56,371 49,387 677,943
Advances received on uncompleted contracts (Note 2) 25,720 44,844 309,321
Reserve for job warranty costs 207 225 2,489
Reserve for losses on contracts 119 86 1,431
Income taxes payable 15,819 4,515 190,247
Other current liabilities (Note 2) 36,733 14,761 441,768
Total Current Liabilities 167,621 126,240 2,015,887
Long-Term Debt, Less Current Maturities (Note 3) 1,663 16,104 20,000
Retirement and Severance Benefits 10,966 11,547 131,882
Deferred Tax Liabilities for Land Revaluation (Notes 7 & 8) 3,783 3,783 45,496
Other Non-Current Liabilities (Note 2) 3,910 4,256 47,024
Total Liabilities 187,943 161,930 2,260,289
Contingencies (Note 5)
Net Assets (Note 6):
Common stock
Authorized — 600,000,000 shares,
Issued — 259,052,929 shares in 2011 and 2010 23,511 23,511 282,754
Capital surplus 25,603 25,601 307,913
Legal earnings reserve 2,693 2,693 32,387
Retained earnings 182,978 165,434 2,200,577
Treasury stock, at cost (6,287) (5,854) (75,610)
Net unrealized holding gains on securities 3,330 5,075 40,048
Deferred gains on hedges 2,519 2,712 30,295
Land revaluation, net of deferred tax portion (Note 8) (6,553) (6,553) (78,809)
Total Net Assets 227,794 212,619 2,739,555
Total Liabilities and Net Assets ¥415,737 ¥374,549 $4,999,844
JGC CORPORAtION Annual Report 2011 65

Non-Consolidated Statements of IncomeJGC CORPORATION Years ended March 31, 2011, 2010 and 2009
Millions of yen
Thousands of U.S. dollars
(Note 1)
2011 2010 2009 2011
Net Sales ¥359,561 ¥317,597 ¥349,925 $4,324,245
Cost of Sales 297,622 275,446 298,305 3,579,338
Gross profit 61,939 42,151 51,620 744,907
Selling, General and Administrative Expenses 10,021 10,006 10,264 120,517
Operating income 51,918 32,145 41,356 624,390
Other Income (Expenses):
Interest and dividend income 8,642 8,569 12,030 103,933
Interest expense (518) (530) (725) (6,230)
Loss on sales and disposal of property and equipment (32) (73) (31) (385)
Gain on sales of marketable and investment securities — 516 2,577 —
Gain on sales of subsidiaries and affiliates’ stock 9,665 — — 116,236
Loss on devaluation of marketable and investment securities (197) — (2,143) (2,369)
Loss on devaluation of investment in subsidiaries — (6,364) — —
Settlement package (Note 9) (20,516) — — (246,735)
Exchange loss, net (Note 1 (q)) (4,293) (3,481) (2,196) (51,630)
Provision for doubtful accounts (Note 1 (q)) — (3,293) (6,638) —
Other, net 536 445 348 6,446
(6,713) (4,211) 3,222 (80,734)
Income before taxes on income 45,205 27,934 44,578 543,656
Taxes on Income (Note 7):
Current 19,175 8,200 20,071 230,607
Deferred 3,177 (1,537) (5,707) 38,208
Net Income ¥ 22,853 ¥ 21,271 ¥ 30,214 $ 274,841
YenU.S. dollars
(Note 1)
Amounts Per Share of Common Stock
Net income ¥ 90.44 ¥ 84.15 ¥ 119.50 $ 1.09
Cash dividends applicable to the year ¥ 30.00 ¥ 21.00 ¥ 30.00 $ 0.36
The accompanying notes are an integral part of these statements.
JGC CORPORAtION Annual Report 201166

Non-Consolidated Statements of Changes in Net AssetsJGC CORPORATION Years ended March 31, 2011, 2010 and 2009
Thousands of shares Millions of yen
Common stock
Capital surplus
Legal reserve
Retained earnings
Treasury stock, at cost
Net unrealized holding gains
(losses) on securities
Deferred gains
(losses) on hedges
(Note 1)
Land revaluation,
net of deferred tax portion
(Note 8)Shares Amount
Balance at March 31, 2008 259,053 ¥ 23,511 ¥ 25,593 ¥ 2,693 ¥ 126,880 ¥ (5,651) ¥ 8,028 ¥ 331 ¥ (6,590)
Net income for the year 30,214
Cash dividends (5,310)
Land revaluation, net of deferred tax portion 0 (0)
Gain on retirement of treasury stock 6 15
Net unrealized holding losses on securities (5,553)
Net deferred losses on hedges (1,358)
Increase of treasury stock (154)
Balance at March 31, 2009 259,053 ¥ 23,511 ¥ 25,599 ¥ 2,693 ¥ 151,784 ¥ (5,790) ¥ 2,475 ¥(1,027) ¥ (6,590)
Net income for the year 21,271
Cash dividends (7,584)
Land revaluation, net of deferred tax portion (37) 37
Gain on retirement of treasury stock 2 2
Net unrealized holding gains on securities 2,600
Net deferred gains on hedges 3,739
Increase of treasury stock (66)
Balance at March 31, 2010 259,053 ¥ 23,511 ¥ 25,601 ¥ 2,693 ¥ 165,434 ¥ (5,854) ¥ 5,075 ¥ 2,712 ¥ (6,553)
Net income for the year 22,853
Cash dividends (5,309)
Land revaluation, net of deferred tax portion
Gain on retirement of treasury stock 2 2
Net unrealized holding losses on securities (1,745)
Net deferred losses on hedges (193)
Increase of treasury stock (435)
Balance at March 31, 2011 259,053 ¥23,511 ¥25,603 ¥2,693 ¥182,978 ¥(6,287) ¥ 3,330 ¥2,519 ¥(6,553)
Thousands of U.S. dollars (Note 1)
Common stock
Capital surplus
Legal reserve
Retained earnings
Treasury stock, at cost
Net unrealized holding gains
(losses) on securities
Deferred gains
(losses) on hedges
(Note 1)
Land revaluation,
net of deferred tax portion
(Note 8)
Balance at March 31, 2010 $ 282,754 $ 307,889 $ 32,387 $ 1,989,585 $ (70,403) $ 61,034 $ 32,616 $ (78,809)
Net income for the year 274,841
Cash dividends (63,849)
Land revaluation, net of deferred tax portion
Gain on retirement of treasury stock 24 24
Net unrealized holding gains on securities (20,986)
Net deferred gains on hedges (2,321)
Increase of treasury stock (5,231)
Balance at March 31, 2011 $282,754 $307,913 $32,387 $2,200,577 $(75,610) $ 40,048 $30,295 $(78,809)
The accompanying notes are an integral part of these statements.
JGC CORPORAtION Annual Report 2011 67

Notes to Non-Consolidated Financial Statements
Note 1 — Summary of Accounting Policies(a) Basis of Presenting Non-Consolidated
Financial StatementsThe accompanying non-consolidated financial statements of JGC Corporation
(Nikki Kabushiki Kaisha, the “Company”) have been prepared in accordance
with the provisions set forth in the Japanese Financial Instruments and
Exchange Law and its related accounting regulations, and in conformity with
accounting principles generally accepted in Japan (“Japanese GAAP”), which
are different in certain respects as to application and disclosure requirements
of International Financial Reporting Standards.
The accompanying non-consolidated financial statements have been
restructured and translated into English (with some expanded descriptions)
from the non-consolidated financial statements of the Company prepared in
accordance with Japanese GAAP and filed with the appropriate Local Finance
Bureau of the Ministry of Finance as required by the Japanese Financial
Instruments and Exchange Law. Certain supplementary information included
in the statutory Japanese language non-consolidated financial statements, but
not required for fair presentation, is not presented in the accompanying non-
consolidated financial statements.
The translation of the Japanese yen amounts into U.S. dollars is included
solely for the convenience of readers outside Japan, using the prevailing
exchange rate at March 31, 2011, which was ¥83.15 to U.S.$1. The conve-
nience translations should not be construed as representations that the Japa-
nese yen amounts have been, could have been, or could in the future be,
converted into U.S. dollars at this or any other rate of exchange.
(b) Conversion of Foreign CurrenciesReceivables and payables denominated in foreign currencies are translated
into Japanese yen at the year-end rates.
(c) Allowance for Doubtful AccountsNotes and accounts receivables, including loans and other receivables, are
valued by providing individually estimated uncollectible amounts plus the
amounts for probable losses calculated by applying a percentage based on
collection experience to the remaining accounts.
(d) Marketable Securities, Investments in Subsidiaries and Affiliates, and Marketable and Investment Securities
The Company is required to examine the intent of holding each security and
classify those securities as (a) securities held for trading purposes, (b) debt
securities intended to be held to maturity, (c) equity securities issued by
subsidiaries and affiliates, and (d) all other securities that are not classified in
any of the above categories (hereafter, “available-for-sale securities”). The
Company did not have securities defined as (a) and (b) above in the years
ended March 31, 2011 and 2010.
Available-for-sale securities with available fair market values are stated at
fair market value. Unrealized gains and losses on these securities are reported,
net of applicable income taxes, as a separate component of net assets.
Realized gains and losses on the sale of such securities are computed using
the moving-average method. Other securities with no available fair market value
are stated at moving-average cost. Equity securities issued by subsidiaries and
affiliates, which are not consolidated or accounted for using the equity method,
are stated at moving-average cost.
If the market value of available-for-sale securities declines significantly,
such securities are restated at fair market value and the difference between fair
market value and the carrying amount is recognized as loss in the period of
decline. For equity securities with no available fair market value, if the net asset
value of the investee declines significantly, such securities are required to be
written down to the net asset value with the corresponding losses in the period
of decline. In these cases, such fair market value or the net asset value will be
the carrying amount of the securities at the beginning of the next year.
(e) Recognition of Sales, Contract Works in Progress and Advances Received on Uncompleted Contracts
On December 27, 2007, the Accounting Standards Board of Japan issued
ASBJ Statement No. 15, “Accounting Standard for Construction Contracts”
and ASBJ Guidance No. 18, “Guidance on Accounting Standard for Construc-
tion Contracts.” The new accounting standards require that if the construction
activity is deemed certain during the course of the activity, the percentage-of-
completion method shall be applied (the percentage of the cost incurred to the
estimated total cost), otherwise the completed-contract method shall be
applied. This standard is effective from the year ended March 31, 2010.
As a result, Net Sales increased by ¥1,580 million and Gross Profit, Oper-
ating Income, and Income before taxes on income increased by ¥207 million,
respectively for the year ended March 31, 2010.
Prior to the year ended March 31, 2010, the Company recognized sales
on contracts using the completed-contract method except for long-term con-
tracts. Under this method, costs and advances received on uncompleted
contracts are accumulated during the period of construction. These costs and
advances received on uncompleted contracts are not offset and are shown as
contract works in progress and advances received on uncompleted contracts
in the accompanying non-consolidated balance sheets. Accordingly, no profits
or losses are recorded before the contract is completed.
Sales on other contracts for relatively large projects which require long
periods for completion and which generally include engineering, procurement
(components, parts, etc.) and construction on a full-turnkey basis, are recog-
nized by the percentage-of-completion method, primarily based on contract
costs incurred to date compared with total estimated costs for contract com-
pletion. The percentage-of-completion method is adopted for large jobs for
which the construction period exceeds 24 months and the contract amount
exceeds ¥5,000 million (including jobs whose construction period exceeds 36
months and the contract amount exceeds ¥3,000 million). Revisions in con-
tract revenue and cost estimates are recognized in the period in which they
are determined.
Contract works in progress are stated at cost determined by a specific
identification method and comprised of direct materials, components and
JGC CORPORAtION Annual Report 201168

parts, direct labor, subcontractors’ fees and other items directly attributable to
the contract, and job-related overheads. Selling, general and administrative
expenses are charged to operations as incurred and are not allocated to
contract job work costs.
The Company normally receives payments from customers on a progress
basis in accordance with the terms of the respective construction contracts.
Net sales recognized by the percentage-of-completion method for the
years ended March 31, 2009 were ¥270,696 million.
(f) Operating CycleAssets and liabilities related to long-term contract jobs are included in current
assets and current liabilities in the accompanying non-consolidated balance
sheets, as they will be liquidated in the normal course of contract completion,
although it may require more than one year.
(g) Property and Equipment, Depreciation and Finance Leases
Property and equipment are stated at cost, except for certain revalued land as
explained in Note 8. Depreciation on property and equipment is calculated
using the straight-line method for buildings used for business operation, and
the declining-balance method for other property and equipment over the
estimated useful lives of the assets based on the Corporate Tax Code of Japan.
Effective from the year ended March 31, 2009, the Company shortened the
estimated useful lives of machinery and equipment based on a reassessment of
the useful lives in light of the change in the Corporation Tax Code of Japan. The
effect of this change on the financial result is immaterial.
All finance leasing transactions were capitalized except for finance leases
which commenced prior to April 1, 2008 and have been accounted for as
operating leases, and continue to be accounted for as operating leases with
disclosure of “as if capitalized” information.
Expenditures for new facilities and those that substantially increase the
useful lives of existing property and equipment are capitalized. Maintenance,
repair and minor renewals are charged to expenses as incurred.
The cost and accumulated depreciation applicable to assets retired or
otherwise disposed of are eliminated from the related accounts and the gain or
loss on disposal is credited or charged to income.
(h) Impairment of Fixed AssetsThe Company reviews its long-lived assets for impairment whenever events or
changes in circumstances indicate the carrying amount of an asset or asset
group may not be recoverable. An impairment loss would be recognized if the
carrying amount of an asset or asset group exceeds the sum of the undis-
counted future cash flows expected to result from the continued use and
eventual disposition of the asset or asset group. The impairment loss would be
measured as the amount by which the carrying amount of the asset exceeds
its recoverable amount, which is the higher of the discounted cash flows from
the continued use and eventual disposition of the asset or the net selling price
at disposition.
(i) Retirement and Severance Benefits and Pension Costs
The Company provides two types of post-employment benefit plans, unfunded
lump-sum payment plans and funded non-contributory pension plans, under
which all eligible employees are entitled to benefits based on the level of wages
and salaries at the time of retirement or termination, length of service and
certain other factors.
The Company provided allowance for employees’ severance and retire-
ment benefits at March 31, 2011 and 2010, based on the estimated amounts
of projected benefit obligation, actuarially calculated using certain assump-
tions, and the fair value of the plan assets at that date.
Prior service costs are recognized as expenses in equal amounts over the
average of the estimated remaining service lives of the employees (12 years),
and actuarial gains and losses are recognized as expenses using the declining-
balance method over the average of the estimated remaining service lives (12
years) commencing in the following period.
Effective from the year ended March 31, 2010, the Company adopted the
“Partial Amendments to Accounting Standard for Retirement Benefits (Part
3)” (Accounting Standards Board of Japan (“ASBJ”) Statement No. 19, issued
on July 31, 2008). The new accounting standard requires domestic compa-
nies to use the rate of return on long-term government or gilt-edged bonds as
of the end of the fiscal year for calculating the projected benefit obligation of a
defined-benefit plan. Previously, domestic companies were allowed to use a
discount rate determined taking into consideration fluctuations in the yield of
long-term government and gilt-edged bonds over a certain period. This change
had no material impact on the financial statements for the year ended March
31, 2010.
(j) Research and Development CostsResearch and development costs for the improvement of existing skills and
technologies or the development of new skills and technologies, including
basic research and fundamental development costs, are charged to operations
in the period incurred.
(k) Taxes on IncomeThe Company provides tax effects of temporary differences between the
carrying amounts and the tax basis of assets and liabilities. The asset and
liability approach is used to recognize deferred tax assets and liabilities for the
expected future tax consequences of temporary differences.
(l) Reserve for Job Warranty CostsA reserve for the estimated cost of warranty obligations is provided for the
Company’s engineering, procurement and construction work at the time the
related sales on contracts are recorded.
(m) Reserve for Losses on ContractsA reserve for losses on contracts is provided for an estimated amount of
probable losses to be incurred in future years in respect of construction
projects in progress.
JGC CORPORAtION Annual Report 2011 69
(n) Per Share InformationCash dividends per share have been presented on an accrual basis and
include dividends to be approved after the balance sheet date but applicable
to the year then ended.
(o) Derivatives and Hedge AccountingThe accounting standard for financial instruments requires companies to state
derivative financial instruments at fair value and to recognize changes in the
fair value as gains or losses unless the derivative financial instruments are
used for hedging purposes.
If derivative financial instruments are used as hedges and meet certain
hedging criteria, the Company defers recognition of gains or losses resulting
from changes in fair value of derivative financial instruments until the related
losses or gains of the hedged items are recognized.
However, in cases where forward foreign exchange contracts are used as
hedges and meet certain hedging criteria, forward foreign exchange contracts
and hedged items are accounted for in the following manner:
(1) If a forward foreign exchange contract is executed to hedge an existing
foreign currency receivable or payable,
(i) The difference, if any, between the Japanese yen amount of the hedged
foreign currency receivable or payable translated using the spot rate at
the inception date of the contract and the book value of the receivable
or payable is recognized in the statement of income in the period which
includes the inception date, and
(ii) The discount or premium on the contract (that is, the difference between
the Japanese yen amount of the contract translated using the contracted
forward rate and that translated using the spot rate at the inception date
of the contract) is recognized over the term of the contract.
(2) If a forward foreign exchange contract is executed to hedge a future trans-
action denominated in a foreign currency, the future transaction will be
recorded using the contracted forward rate, and no gains or losses on the
forward foreign exchange are recognized.
Also, where interest rate swap contracts are used as hedges and meet
certain hedging criteria, the net amount to be paid or received under the
interest rate swap contract is added to or deducted from the interest on the
assets or liabilities for which the swap contract was executed.
(p) Accrued Bonuses to Directors and Corporate Auditors
The Company recognizes directors’ and corporate auditors’ bonuses as
expenses when incurred.
(q) Reclassification and RestatementCertain prior year amounts have been reclassified to conform to the current
year presentation except for the reclassification between provision for doubtful
accounts and exchange gain or loss described below.
The Company changed the recognition of exchange differences for
foreign currencies’ doubtful accounts from provision for doubtful accounts to
exchange gain or loss from the year ended March 31, 2011, in order to
properly present provision for doubtful accounts without the effect of
exchange fluctuation.
These reclassifications had no impact on previously reported results of
operations or retained earnings.
Note 2 — Receivables from and Payables to Subsidiaries and Affiliates
Significant receivables from and payables to subsidiaries and affiliates at
March 31, 2011 and 2010 were as follows:
Millions of yen
Thousands of U.S. dollars
(Note 1)
March 31, 2011 2010 2011
Notes and accounts receivable ¥ 8,335 ¥ 1,744 $100,241
Other current assets 4,423 6,767 53,193
Long-term loans receivable 12,125 12,016 145,821
Notes and accounts payable 9,375 12,177 112,748
Short-term loans 18,787 12,072 225,941Advances received on uncompleted contracts 151 211 1,816
Other current liabilities 573 999 6,891
Other non-current liabilities 176 176 2,117
Note 3 — Borrowings and Assets Pledged as CollateralAt March 31, 2011 and 2010, short-term loans consisted of unsecured debt
from subsidiaries and bore interest at TIBOR.
Long-term debt consisted of the following:
Millions of yen
Thousands of U.S. dollars
(Note 1)
March 31, 2011 2010 2011
Unsecured Debt
0.46%–1.98% loans from banks and insurance companies, due serially through 2016 ¥ 15,528 ¥16,454 $ 186,747
Less current maturities (13,865) (350) (166,747)
Long-term debt due after one year ¥ 1,663 ¥16,104 $ 20,000
JGC CORPORAtION Annual Report 201170

Assets pledged as collateral for other non-current liabilities at March 31,
2011 and 2010, were as follows:
Millions of yen
Thousands of U.S. dollars
(Note 1)
March 31, 2011 2010 2011
Land ¥4,280 ¥4,280 $51,473
Buildings and structures, at net book value 2,317 2,438 27,866
Machinery and equipment, at net book value 3 4 36
Total ¥6,600 ¥6,722 $79,375
The annual maturities of long-term debt outstanding at March 31, 2011,
are as follows:
Amount
Year ending March 31, Millions of yen
Thousands of U.S. dollars
(Note 1)
2012 ¥13,865 $166,747
2013 665 7,998
2014 665 7,998
2015 250 3,006
2016 83 998
Total ¥15,528 $186,747
Note 4 — Lease Transactions(a) Finance Lease Transactions Without Ownership Transfer to LesseeFinance leases commenced prior to April 1, 2008 which do not transfer own-
ership of leased assets to lessees are accounted for as operating leases.
Assumed amounts of acquisition cost and accumulated depreciation at
March 31, 2011 and 2010 are as follows:
(1) Purchase price equivalents, accumulated depreciation equivalents, and
book value equivalents:
Millions of yen
March 31, 2011 2010
Machinery and equipment:
Purchase price equivalents ¥147 ¥147
Accumulated depreciation equivalents (54) (36)
Book value equivalents ¥ 93 ¥111
Thousands of U.S. dollars
(Note 1)
March 31, 2011
Machinery and equipment:
Purchase price equivalents $1,768
Accumulated depreciation equivalents (650)
Book value equivalents $1,118
Purchase price equivalents are calculated using the inclusive-of-interest
method.
(2) Lease commitments
Millions of yen
Thousands of U.S. dollars
(Note 1)
March 31, 2011 2010 2011
Due within one year ¥17 ¥ 18 $ 204
Due after one year 76 93 914
Total ¥93 ¥111 $1,118
Lease commitments are calculated using the inclusive-of-interest method.
(3) Lease payments and depreciation equivalents
Millions of yen
Thousands of U.S. dollars
(Note 1)
Year ended March 31, 2011 2010 2009 2011
Lease payments ¥18 ¥35 ¥33 $216
Depreciation equivalents 18 35 33 216
(4) Calculation method of depreciation equivalents
Depreciation equivalents are computed by the straight-line method over the
lease period without considering residual value.
(b) Operating Lease TransactionsLease commitments under non-cancelable operating leases:
Millions of yen
Thousands of U.S. dollars
(Note 1)
March 31, 2011 2010 2011
Due within one year ¥532 ¥ 449 $ 6,398
Due after one year 399 689 4,799
Total ¥931 ¥1,138 $11,197
Note 5 — Contingencies(1) It is a business practice in Japan for a company to guarantee the indebted-
ness of certain of its trading agents, suppliers, subcontractors and certain
subsidiaries and affiliates. The aggregate amount of such guarantees was
¥18,498 million ($222,465 thousand) and ¥5,274 million at March 31,
2011 and 2010, respectively.
(2) The Company has guaranteed employees’ housing loans and others from
banks in the amount of ¥11 million ($132 thousand) and ¥10 million at
March 31, 2011 and 2010, respectively.
JGC CORPORAtION Annual Report 2011 71

Note 6 — Net AssetsUnder the Japanese Corporation Law (“the Law”) and regulations, the entire
amount paid for new shares is required to be designated as common stock.
However, a company may, by a resolution of the Board of Directors, designate
an amount not exceeding one-half of the prices of the new shares as additional
paid-in capital, which is included in capital surplus.
In cases where dividend distribution of surplus is made, the smaller of an
amount equal to 10% of the dividend or the excess, if any, of 25% of common
stock over the total of additional paid-in capital and legal earnings reserve must
be set aside as additional paid-in capital or legal earnings reserve.
Additional paid-in capital and legal earnings reserve may not be distributed
as dividends. However, all additional paid-in capital and all legal earnings
reserve may be transferred to other capital surplus and retained earnings,
respectively, which are potentially available for dividends.
Note 7 — Taxes on IncomeThe statutory tax rate for 2011, 2010 and 2009, was 36.2%.
The following table summarizes the significant differences between the
statutory tax rate and the Company’s effective tax rate for financial statement
purposes for the years ended March 31, 2011, 2010 and 2009:
2011 2010 2009
Statutory tax rate 36.2% 36.2% 36.2%
Non-deductible expenses 0.3 0.5 0.6
Non-taxable dividend income (5.5) (9.0) (6.0)
Tax credits utilized (0.4) (1.3) (0.9)
Past year’s income tax adjustment 1.5 (3.1) 1.0
Other 17.4 0.6 1.3
Effective tax rate 49.5% 23.9% 32.2%
Significant components of the Company’s deferred tax assets and liabili-
ties as of March 31, 2011 and 2010, were as follows:
Millions of yen
Thousands of U.S. dollars
(Note 1)
March 31, 2011 2010 2011
Current deferred taxes
Deferred tax assets:
Excess accrued employees’ bonuses ¥ 1,660 ¥ 1,580 $ 19,964
Excess reserve for job warranty costs 75 81 902
Excess reserve for losses on contracts 43 31 517
Other 8,086 10,783 97,246
Total current deferred tax assets 9,864 12,475 118,629
Deferred tax liabilities:
Other (1,501) (1,700) (18,052)
Net current deferred tax assets ¥ 8,363 ¥10,775 $100,577
For the years ended March 31, 2011 and 2010, there is no valuation
allowance.
Millions of yen
Thousands of U.S. dollars
(Note 1)
March 31, 2011 2010 2011
Non-current deferred taxes
Deferred tax assets:
Loss recognized on percentage-of-completion method not deductible for income tax purposes ¥ 196 ¥ 196 $ 2,357 Employee’s retirement and severance benefits 3,970 4,180 47,745
Excess bad debt expenses 6,295 6,686 75,707
Other 726 782 8,731 Total non-current deferred tax assets 11,187 11,844 134,540
Deferred tax liabilities:
Net unrealized holding gains on securities (1,890) (2,880) (22,730)
Other (134) (135) (1,612)
Total deferred tax liabilities (2,024) (3,015) (24,342)
Net non-current deferred tax assets ¥ 9,163 ¥ 8,829 $110,198
Deferred tax liabilities for land revaluation ¥ 3,783 ¥ 3,783 $ 45,496
For the years ended March 31, 2011 and 2010, the valuation allowances
of ¥145 million ($1,744 thousand) and ¥288 million have been deducted from
the gross amount of the non-current deferred tax assets, respectively.
Note 8 — Land RevaluationPursuant to Article 2 of the Enforcement Ordinance for the Law Concerning
Land Revaluation (the “Law”) effective March 31, 1998, the Company
recorded its owned land used for business at the fair value as of March 31,
2002, and the related revaluation difference, net of income taxes, was debited
to “land revaluation, net of deferred tax portion” in the net assets section. The
applicable income tax portion was reported as Deferred Tax Liabilities for Land
Revaluation in the non-consolidated balance sheet at March 31, 2011 and
2010. When such land is sold, land revaluation is reversed and debited to
retained earnings.
Fair value of revalued land as of March 31, 2011 was ¥2,775 million
($33,373 thousand) less than the book value as of March 31, 2011.
Note 9 — Settlement PackageRegarding Nigeria LNG Project, the Company accrued the expense incurred
due to the settlement with the U.S. Department of Justice and government of
Nigeria under “Settlement Package.”
JGC CORPORAtION Annual Report 201172

To the Shareholders and Board of Directors of
JGC Corporation (Nikki Kabushiki Kaisha):
We have audited the accompanying non-consolidated balance sheets of JGC Corporation (a Japanese corporation) as of March 31,
2011 and 2010, and the related non-consolidated statements of income, changes in net assets for each of the three years in the
period ended March 31, 2011, expressed in Japanese yen. These non-consolidated financial statements are the responsibility of the
Company’s management. Our responsibility is to independently express an opinion on these non-consolidated financial statements
based on our audits.
We conducted our audits in accordance with auditing standards generally accepted in Japan. Those standards require that we plan
and perform the audit to obtain reasonable assurance about whether the financial statements are free of material misstatement. An
audit includes examining, on a test basis, evidence supporting the amounts and disclosures in the financial statements. An audit also
includes assessing the accounting principles used and significant estimates made by management, as well as evaluating the overall
financial statement presentation. We believe that our audits provide a reasonable basis for our opinion.
In our opinion, the non-consolidated financial statements referred to above present fairly, in all material respects, the non-consolidated
financial position of JGC Corporation as of March 31, 2011 and 2010, and the non-consolidated results of their operations for each of
the three years in the period ended March 31, 2011, in conformity with accounting principles generally accepted in Japan.
The U.S. dollar amounts in the accompanying non-consolidated financial statements with respect to the year ended March 31, 2011
are presented solely for convenience. Our audit also included the translation of yen amounts into U.S. dollar amounts and, in our
opinion, such translation has been made on the basis described in Note 1 to the non-consolidated financial statements.
(KPMG AZSA LLC)
Tokyo, Japan
June 29, 2011
Independent Auditors’ ReportJGC CORPORATION
JGC CoRpoRAtIon Annual Report 2011 73

System Solution ServicesJGC Information Systems Co., Ltd.
Equipment ProcurementNikki Shoji Co., Ltd.JGC Corporation Europe B.V.JGC (USA), Inc.
Specialized Consulting ServicesJapan NUS Co., Ltd.
Office Support ServicesNikki Business Services Co., Ltd.
Water & Power Generation BusinessJGC-ITC Rabigh Utility Co., Ltd.
Oil & Gas Production and Sales BusinessJGC Energy Development (USA) Inc.
Catalysts and fine productsTotal engineeringOthers
JGC Catalysts & Chemicals Ltd.
Japan Fine Ceramics Co., Ltd.
Nikki-Universal Co., Ltd.
JGC PROJECT SERVICES Co., Ltd.(Note)
Nikki Construction Co., Ltd.(Note)
JGC PLANTECH Co., Ltd.
JGC PLANTECH AOMORI Co., Ltd.
Nikki-Universal Co., Ltd.
JMD Greenhouse-Gas Reduction Co., Ltd.
JGC SINGAPORE PTE LTD
JGC PHILIPPINES, INC.
PT. JGC INDONESIA
Consolidated subsidiaryNon-consolidated, non-equity-method subsidiaryEquity-method subsidiary or affiliateNon-equity-method subsidiary or affiliate
Total engineering
Business Company Country Capital Capital Share Other
Engineering & Construction Services
JGC PROJECT SERVICES Co., Ltd.(Note) Japan ¥200,000,000 100%
Nikki Construction Co., Ltd.(Note) Japan ¥495,000,000 100%
JGC SINGAPORE PTE LTD Singapore S$2,100,000 100%
JGC PHILIPPINES, INC. Philippines P340,000,000 100%
PT. JGC INDONESIA Indonesia US$1,600,000 100% * JGC 70%* JGC PROJECT SERVICES 30%
Maintenance Services JGC PLANTECH Co., Ltd. Japan ¥135,000,000 100%
JGC PLANTECH AOMORI Co., Ltd. Japan ¥50,000,000 100% * JGC PLANTECH 100%
Process Licensing Services Nikki-Universal Co., Ltd. Japan ¥1,000,000,000 50%
Global Warming Gas-Emissions Credits Business
JMD Greenhouse-Gas Reduction Co., Ltd. Japan ¥30,000,000 47%
Catalysts and fine products
Company Country Capital Capital Share Other
JGC Catalysts & Chemicals Ltd. Japan ¥1,800,000,000 100%
Japan Fine Ceramics Co., Ltd. Japan ¥300,000,000 100%
Nikki-Universal Co., Ltd. Japan ¥1,000,000,000 50%
Others
Business Company Country Capital Capital Share Other
System Solution Services JGC Information Systems Co., Ltd. Japan ¥400,000,000 100%
Equipment Procurement Nikki Shoji Co., Ltd. Japan ¥40,000,000 24.50%
JGC Corporation Europe B.V. The Netherlands ˆ 2,768,000 100%
JGC (USA) Inc. U.S.A. US$100,000 100%
Specialized Consulting Services Japan NUS Co., Ltd. Japan ¥50,000,000 80%
Office Support Services Nikki Business Services Co., Ltd. Japan ¥1,455,000,000 100%
Water & Power Generation Business
JGC-ITC Rabigh Utility Co., Ltd. Japan ¥319,533,500 55.43%
Oil & Gas Production and Sales Business
JGC Energy Development (USA) Inc. U.S.A. US$58,000,000 100%
JGC CORPORATION
Provision of products and services
(Note) JGC PROJECT SERVICES Co., Ltd. and Nikki Construction Co., Ltd. merged on April 1, 2011 to form JGC Plant Solutions Co., Ltd.
JGC GroupAs of March 31, 2011
JGC CORPORAtION Annual Report 201174

Established October 25, 1928
Capital ¥23,511,189,612
Number of Employees 2,137 (Consolidated: 5,826)
Major Shareholders Number of shares (thousands)
Percentage of total (%)
Japan Trustee Services Bank, Ltd. (Trust Account) 21,719 8.38
The Master Trust Bank of Japan, Ltd. (Trust Account) 17,918 6.91
Nikki Shoji Co., Ltd. 12,112 4.67
Sumitomo Mitsui Banking Corp. 11,000 4.24
JGC-S SCHOLARSHIP FOUNDATION 8,433 3.25
Mizuho Corporate Bank, Ltd. 5,700 2.20
JP Morgan Securities Japan Co., Ltd. 3,828 1.47
State Street Bank and Trust Company 505223 3,676 1.41
Government of Singapore Investment Corporation Pte. Ltd. 3,448 1.33
Japan Trustee Services Bank, Ltd. (Trust Account 9) 3,334 1.28
JGC’s treasury stock holdings total 6,531 thousands shares, approximately 2.52% of total shares issued.
Authorized Shares 600,000,000
Issued and Outstanding Shares 259,052,929
Number of Shareholders 10,665
Administrator of the Shareholders’ Register
Mitsubishi UFJ Trust and Banking Corp. 4-5, Marunouchi 1-chome, Chiyoda-ku, Tokyo 100-8212, Japan
Distribution of Shareholders (%)
Stock Price
Banks 7.7
Foreign investors 34.6
Treasury stock 2.5
Other domestic corporations 13.3
Life and non-life insurance corporations 4.3
Trust banks (including trust accounts) 25.5
Financial instruments firms 3.2
Individuals and others 8.9
Outline of JGCAs of March 31, 2011
0
20,000
40,000
60,000
80,000
1 2 3 4 5 6 7 8 9 10 11 12 1 2 3 4 5 6 7 8 9 10 11 12 1 2 3 4 5 6 7 8 9 10 11 12 12008 2009 2010
2 3 4 5 62011
0
1,000
2,000
3,000
0
15,000
30,000
45,000
Volume (Thousands of shares)
JGC Stock Price (Yen) Nikkei Stock Average (Yen)
Nikkei Stock Average
JGC Stock Price
JGC COrpOratiOn annual report 2011 75

Domestic Offices
Tokyo Corporate OfficeNew Ohtemachi Bldg., 2-2-1, Ohtemachi, Chiyoda-ku,Tokyo 100-0004, JapanTel: 81-3-3279-5441Fax: 81-3-3273-8047
Yokohama World Operations Center2-3-1, Minato Mirai, Nishi-ku,Yokohama 220-6001, JapanTel: 81-45-682-1111Fax: 81-45-682-1112
MM Park Building Office3-6-3, Minato Mirai, Nishi-ku,Yokohama 220-0012, JapanTel: 81-45-682-1111Fax: 81-45-682-1112Research and Development Center
Research and Development Center2205, Narita-cho, Oarai-machi, Higashi Ibaraki-gun, Ibaraki Pref.311-1313, JapanTel: 81-29-266-3311Fax: 81-29-266-3310
Osaka Office3-1-18, Kitahama, Chuo-ku,Osaka 541-0041, JapanTel: 81-6-6208-0260Fax: 81-6-6208-0265
Overseas OfficesAsia
Beijing OfficeRoom No. 605, Office Tower I,Henderson Centre, No. 18Jianguomennei Dajie,Dongcheng District, Beijing100005, ChinaTel: 86-10-6518-3001Fax: 86-10-6518-3006
Jakarta OfficeWisma Kyoei Prince, 12A Floor,Jl. Jend. Sudirman Kav. 3,Jakarta 10220, IndonesiaTel: 62-21-572-3320Fax: 62-21-572-4311
Hanoi OfficeA312, The Manor Towers, My Dinh, Me Tri, Tu Liem, Hanoi, VietnamTel: 84-4-3936-6850Fax: 84-4-3936-6851
JGC KOREA CORPORATIONLotte Kwanak Tower 5th Floor395-67, Shindaebang-Dong,Dongjak-Gu, Seoul, KoreaTel: 82-2-831-7316Fax: 82-2-831-7317
JGC Engineering Consultants (Shanghai) Co., Ltd.Suite 1503-1504, POS-PLAZA,1600 Century Avenue PudongNew Area, Shanghai 200122, ChinaTel: 86-21-5058-9881Fax: 86-21-5058-9880
JGC PHILIPPINES, INC.2109 Prime Street,Madrigal Business Park,Ayala Alabang, Muntinlupa City,PhilippinesTel: 63-2-876-6000Fax: 63-2-807-0668
TECHNOSERVE CONSTRUCTION CO., INC.19th Floor Export Bank Plaza, Chino Roces Avenue, Corner Sen. Gil Puyat Avenue, Makati City, PhillippinesTel: 63-2-889-9440Fax: 63-2-845-4533
JGC VIETNAM COMPANY LIMITEDA212, The Manor Towers, My Dinh, Me Tri, Tu Liem, Hanoi, VietnamTel: 84-4-3794-0520Fax: 84-4-3794-0522
PT. JGC INDONESIAJl. TB Simatupang 7-B Jakarta 12430, IndonesiaTel: 62-21-29976500Fax: 62-21-29976599
JGC SINGAPORE PTE LTD29 International Business Park#07-01 Acer Building, Tower ASingapore 609923, SingaporeTel: 65-6-227-0122Fax: 65-6-227-0358
JGC CONSTRUCTION INTERNATIONAL PTE. LTD.29 International Business Park#07-01 Acer Building, Tower ASingapore 609923, SingaporeTel: 65-6-561-1255Fax: 65-6-561-1767
JGC MALAYSIA SDN. BHD.Level 9, Wisma Genting Jalan Sultan Ismail 50250, Kuala LumpurTel: 60-3-21612155Fax: 60-3-21619110
Oceania
Perth OfficeLevel 18, Central Park 152-158 St Georges Terrace, Perth WA 6000, AustraliaTel: 61-8-9288-1828Fax: 61-8-9288-4400
Middle East
Abu Dhabi OfficeOffice No. 305, 3rd FloorAl Salam BuildingJunction of Zayed the 1st St./Al Salam RoadP.O. Box 28543 Abu Dhabi, U.A.E. Tel: 971-2-6443-335 Fax: 971-2-6444-204
Doha OfficeAl Fardan Tower 25FP.O. Box 22173, Doha, Qatar Tel: 974-4409-3424 Fax: 974-4409-3557
Basra OfficeNo. 104, Al Bahar & Bardawil Compound Contingency Operation Base, Basra International Airport, Basra Province, Republic of Iraq
JGC Arabia LimitedP.O. Box 2414, Al-Khobar 31952,Saudi ArabiaTel: 966-3-896-5055Fax: 966-3-896-5056
JGC Gulf International Co., Ltd.P.O. Box 2257, Al-Khobar 31952, Saudi ArabiaTel: 966-3-896-5060Fax: 966-3-896-5071
JGC Middle East FZE(Jebel Ali Head Office):Office No. LB13124P.O.Box 18414, Jebel Ali, Dubai, U.A.E.Tel: 971-4-8812102Fax: 971-4-8873102(Doha Branch):Al Fardan Tower 25F, P. O. Box 22173, Doha, QatarTel: 974-4409-3424Fax: 974-4409-3557
Europe
Almaty Office050059 Almaty Samal-2 Microdistrict Bldg. 56A Office 203, KazakhstanTel: 7-727-263-5185Fax: 7-727-263-5187
Paris Office17 Rue de QuatreSeptembre 75002Paris, FranceTel: 33-1-4477-4300Fax: 33-1-4477-4311
JGC Italy S.r.I.Via Lallio n.35 Frazione Sforzatica 24044-Dalmine (BG), ItalyTel: 39-035-373705Fax: 39-035-373728
JGC CORPORATION (UK) LIMITED401 Marble Arch Tower, 55 Bryanston St., LondonWIH 7AA, U.K.Tel: 44-20-7868-8012Fax: 44-20-7868-8011
Africa
Algiers OfficeBoulevard du 11 decembre 1960, Lotissement No.6, El-Biar, Alger, AlgeriaTel: 213-21-91-2366Fax: 213-21-91-2285
JGC Algeria S.p.ABoulevard du 11 decembre 1960, Lotissement No.6, El-Biar, Alger, AlgeriaTel: 213-21-91-2366Fax: 213-21-91-2285
JGC NIGERIA LIMITEDBlock 1, Flat 6, Zion Court No.1 Samuel Adedoyin Street, Ikate Lekki, Lagos, NigeriaTel: 234-1-4630603
Americas
JGC (USA), Inc.10370 Richmond Avenue, Suite 800, Houston, TX 77042, U.S.A.Tel: 1-713-789-1441Fax: 1-713-975-7874
JGC Energy Development (USA), Inc.10370 Richmond Avenue Suite 810, Houston, TX 77042, U.S.A.Tel: 1-832-487-9965Fax: 1-832-487-9973
JGC VENEZUELA C.A.Edificio Bancaracas Piso 6Oficina 6-06,Av. San Felipe con 2da Calle,La Castellana, Caracas, VenezuelaTel: 58-212-266-9155Fax: 58-212-265-9231
Tokyo Corporate OfficeYokohama World Operations CenterMM Park Building Office
JGC COrpOratiOn annual report 201176


JGC
CO
RPO
RA
TIO
N A
nnu
al R
eport 2011
Printed in Japan
2-3-1, Minato Mirai, Nishi-Ku, Yokohama 220-6001, JapanTEL. 81-45-682-1111 FAX. 81-45-682-1112www.jgc.co.jp


