323
Application System/400 IBM Programming: GDDM Programming Guide Version 2 SC41-0536-00
Application System/400 IBM
Programming:GDDM Programming GuideVersion 2
SC41-0536-00


Application System/400 IBM
Programming:GDDM Programming GuideVersion 2
SC41-0536-00
| Take Note!
| Before using this information and the product it supports, be sure to read the general information under “Notices” on page ix.
| First Edition (May 1991)
| This edition applies to the licensed program IBM Operating System/400 (Program 5738-SS1), Version 2 Release 1 Modification 0,| and to all subsequent releases and modifications until otherwise indicated in new editions. Make sure you are using the proper| edition for the level of the product.
| Order publications through your IBM representative or the IBM branch serving your locality. Publications are not stocked at the| address given below.
| A form for readers' comments is provided at the back of this publication. If the form has been removed, you may address your| comments to:
| Attn Department 245| IBM Corporation| 3605 Highway 52 N| Rochester, MN 55901-7899
| When you send information to IBM, you grant IBM a non-exclusive right to use or distribute the information in any way it believes| appropriate without incurring any obligation to you or restricting your use of it.
| Copyright International Business Machines Corporation 1991. All rights reserved.| US Government Users Restricted Rights – Use, duplication or disclosure restricted by GSA ADP Schedule Contract with IBM Corp.
Contents
| Notices . . . . . . . . . . . . . . . . . . . . . . . . . . . . . . . . . . . . . . . . . . ix| Programming Interface . . . . . . . . . . . . . . . . . . . . . . . . . . . . . . . . . . ix
| About This Guide . . . . . . . . . . . . . . . . . . . . . . . . . . . . . . . . . . . . xi| Who Should Use This Guide . . . . . . . . . . . . . . . . . . . . . . . . . . . . . . xi
Chapter 1. An Introduction to OS/400 Graphics . . . . . . . . . . . . . . . . 1-1What Is OS/400 Graphics All About? . . . . . . . . . . . . . . . . . . . . . . . . 1-1What Are Some Uses of OS/400 Graphics? . . . . . . . . . . . . . . . . . . . . 1-1What Do I Need Before I Can Use OS/400 Graphics? . . . . . . . . . . . . . . 1-2
AS/400 Hardware . . . . . . . . . . . . . . . . . . . . . . . . . . . . . . . . 1-2AS/400 Software . . . . . . . . . . . . . . . . . . . . . . . . . . . . . . . . . 1-3Required Knowledge . . . . . . . . . . . . . . . . . . . . . . . . . . . . . . . 1-3
Chapter 2. The Application Program Interface to Graphics . . . . . . . . . 2-1Programming Considerations . . . . . . . . . . . . . . . . . . . . . . . . . . . 2-1Drawing a Simple Picture with GDDM . . . . . . . . . . . . . . . . . . . . . . 2-2
How the Program Works . . . . . . . . . . . . . . . . . . . . . . . . . . . . 2-5Drawing a Simple Chart with Presentation Graphics Routines . . . . . . . 2-11
How the Program Works . . . . . . . . . . . . . . . . . . . . . . . . . . . 2-12The Syntax of Routines . . . . . . . . . . . . . . . . . . . . . . . . . . . . . 2-14
Parameters that Supply Values to the Program . . . . . . . . . . . . . . 2-14Parameters that Get Values from the Program . . . . . . . . . . . . . . 2-14The Names of the Routines . . . . . . . . . . . . . . . . . . . . . . . . . 2-14
The Parts of a Typical Program . . . . . . . . . . . . . . . . . . . . . . . . . 2-15Summary of This Chapter . . . . . . . . . . . . . . . . . . . . . . . . . . . . 2-15
Chapter 3. Using GDDM . . . . . . . . . . . . . . . . . . . . . . . . . . . . . . 3-1Drawing Pictures . . . . . . . . . . . . . . . . . . . . . . . . . . . . . . . . . . . . 3-2
Graphic Primitives and Their Attributes . . . . . . . . . . . . . . . . . . . . . . 3-2Setting Color Attributes . . . . . . . . . . . . . . . . . . . . . . . . . . . . . . . 3-2
| Selecting a Color . . . . . . . . . . . . . . . . . . . . . . . . . . . . . . . . . 3-2| Mixing Colors . . . . . . . . . . . . . . . . . . . . . . . . . . . . . . . . . . . 3-7
The Current Position . . . . . . . . . . . . . . . . . . . . . . . . . . . . . . . 3-11| Setting the Current Position . . . . . . . . . . . . . . . . . . . . . . . . . 3-11| Querying the Current Position . . . . . . . . . . . . . . . . . . . . . . . . 3-11| Querying the Cursor Position . . . . . . . . . . . . . . . . . . . . . . . . . 3-11
How to Draw Lines . . . . . . . . . . . . . . . . . . . . . . . . . . . . . . . . 3-12| Setting Attributes for Lines . . . . . . . . . . . . . . . . . . . . . . . . . . 3-12| Drawing Straight Lines . . . . . . . . . . . . . . . . . . . . . . . . . . . . 3-14| Drawing Curved Lines . . . . . . . . . . . . . . . . . . . . . . . . . . . . . 3-17
How to Draw Filled Areas . . . . . . . . . . . . . . . . . . . . . . . . . . . . 3-22| Drawing Area-Fills . . . . . . . . . . . . . . . . . . . . . . . . . . . . . . . 3-22| Selecting a Pattern for Filled Areas . . . . . . . . . . . . . . . . . . . . . 3-24
How to Draw Graphics Symbols . . . . . . . . . . . . . . . . . . . . . . . . 3-25Controlling Symbol Sets . . . . . . . . . . . . . . . . . . . . . . . . . . . . 3-27
| Loading Symbol Sets . . . . . . . . . . . . . . . . . . . . . . . . . . . . . 3-28| Selecting a Character Mode . . . . . . . . . . . . . . . . . . . . . . . . . 3-29| Selecting the Current Symbol Set . . . . . . . . . . . . . . . . . . . . . . 3-29| Drawing Graphics Symbols . . . . . . . . . . . . . . . . . . . . . . . . . . 3-29
Copyright IBM Corp. 1991 iii
Attributes for Graphics Symbols . . . . . . . . . . . . . . . . . . . . . . . 3-30| Setting the Graphics Symbol Size . . . . . . . . . . . . . . . . . . . . . . 3-30| Setting the Character Angle . . . . . . . . . . . . . . . . . . . . . . . . . 3-32| Setting the Character Direction . . . . . . . . . . . . . . . . . . . . . . . . 3-33| Setting the Character Shear . . . . . . . . . . . . . . . . . . . . . . . . . 3-34
Drawing Graphics Images . . . . . . . . . . . . . . . . . . . . . . . . . . . . 3-35| Drawing a Graphics Image . . . . . . . . . . . . . . . . . . . . . . . . . . 3-36| Drawing a Scaled Graphics Image . . . . . . . . . . . . . . . . . . . . . . 3-38
How to Draw Markers . . . . . . . . . . . . . . . . . . . . . . . . . . . . . . . 3-38| Loading Marker Symbol Sets . . . . . . . . . . . . . . . . . . . . . . . . . 3-39| Selecting a Marker . . . . . . . . . . . . . . . . . . . . . . . . . . . . . . . 3-39| Drawing Markers . . . . . . . . . . . . . . . . . . . . . . . . . . . . . . . . 3-39| Drawing Scaled Markers . . . . . . . . . . . . . . . . . . . . . . . . . . . 3-39
Drawing Pictures: Summary . . . . . . . . . . . . . . . . . . . . . . . . . 3-40Controlling Graphics . . . . . . . . . . . . . . . . . . . . . . . . . . . . . . . . . 3-41
Program Controls . . . . . . . . . . . . . . . . . . . . . . . . . . . . . . . . . 3-41Graphics Environment Controls . . . . . . . . . . . . . . . . . . . . . . . 3-41
| Initializing and Terminating the Graphics Environment . . . . . . . . . . 3-41Error Handling Controls . . . . . . . . . . . . . . . . . . . . . . . . . . . . 3-41
| Specifying an Error Handling Program . . . . . . . . . . . . . . . . . . . 3-41| Querying the Last Error . . . . . . . . . . . . . . . . . . . . . . . . . . . . 3-42
Display Controls . . . . . . . . . . . . . . . . . . . . . . . . . . . . . . . . . . 3-42| Sending the Picture to a Device . . . . . . . . . . . . . . . . . . . . . . . 3-42
Picture Controls . . . . . . . . . . . . . . . . . . . . . . . . . . . . . . . . . . 3-43The Device . . . . . . . . . . . . . . . . . . . . . . . . . . . . . . . . . . . 3-43The Page . . . . . . . . . . . . . . . . . . . . . . . . . . . . . . . . . . . . 3-44
| Creating a Page . . . . . . . . . . . . . . . . . . . . . . . . . . . . . . . . 3-45| Selecting a Page . . . . . . . . . . . . . . . . . . . . . . . . . . . . . . . . 3-46| Clearing a Page . . . . . . . . . . . . . . . . . . . . . . . . . . . . . . . . 3-47| Deleting a Page . . . . . . . . . . . . . . . . . . . . . . . . . . . . . . . . 3-47| Querying Page Information . . . . . . . . . . . . . . . . . . . . . . . . . . 3-47
The Graphics Field . . . . . . . . . . . . . . . . . . . . . . . . . . . . . . . 3-47| Defining a Field . . . . . . . . . . . . . . . . . . . . . . . . . . . . . . . . . 3-48| Clearing a Field . . . . . . . . . . . . . . . . . . . . . . . . . . . . . . . . 3-48
The Picture Space . . . . . . . . . . . . . . . . . . . . . . . . . . . . . . . 3-48| Defining a Picture Space . . . . . . . . . . . . . . . . . . . . . . . . . . . 3-49
The Viewport . . . . . . . . . . . . . . . . . . . . . . . . . . . . . . . . . . 3-50| Defining a Viewport . . . . . . . . . . . . . . . . . . . . . . . . . . . . . . 3-52
The Graphics Window . . . . . . . . . . . . . . . . . . . . . . . . . . . . . 3-53| Defining a Graphics Window . . . . . . . . . . . . . . . . . . . . . . . . . 3-54
Clipping . . . . . . . . . . . . . . . . . . . . . . . . . . . . . . . . . . . . . 3-55| Setting the Clipping State . . . . . . . . . . . . . . . . . . . . . . . . . . . 3-56
The Graphics Segment . . . . . . . . . . . . . . . . . . . . . . . . . . . . 3-58| Creating a Graphics Segment . . . . . . . . . . . . . . . . . . . . . . . . 3-58| Closing a Graphics Segment . . . . . . . . . . . . . . . . . . . . . . . . . 3-58| Deleting a Graphics Segment . . . . . . . . . . . . . . . . . . . . . . . . 3-58| Querying the Number of Graphics Segments . . . . . . . . . . . . . . . 3-59
Retained and Temporary Data . . . . . . . . . . . . . . . . . . . . . . . . 3-63Device Controls . . . . . . . . . . . . . . . . . . . . . . . . . . . . . . . . . . 3-65
| Opening and Closing Devices . . . . . . . . . . . . . . . . . . . . . . . . 3-66| Using Devices . . . . . . . . . . . . . . . . . . . . . . . . . . . . . . . . . 3-66| Querying the Device Characteristics . . . . . . . . . . . . . . . . . . . . . 3-67| Sounding the Device Alarm . . . . . . . . . . . . . . . . . . . . . . . . . . 3-67
Controlling Graphics: Summary . . . . . . . . . . . . . . . . . . . . . . . 3-67
iv AS/400 GDDM Programming Guide
Using Graphics Data Format Files . . . . . . . . . . . . . . . . . . . . . . . . . 3-68| Retrieving Graphics Data . . . . . . . . . . . . . . . . . . . . . . . . . . . 3-68| Drawing a Picture with a Graphics Data Format File . . . . . . . . . . . 3-68
Summary of This Chapter . . . . . . . . . . . . . . . . . . . . . . . . . . . . . . 3-72
Chapter 4. Using Presentation Graphics . . . . . . . . . . . . . . . . . . . . 4-1Understanding Presentation Graphics Routines . . . . . . . . . . . . . . . . . . 4-1
Chart Types . . . . . . . . . . . . . . . . . . . . . . . . . . . . . . . . . . . . . 4-4Line Charts . . . . . . . . . . . . . . . . . . . . . . . . . . . . . . . . . . . . 4-4Scatter Plots . . . . . . . . . . . . . . . . . . . . . . . . . . . . . . . . . . . 4-5Surface Charts . . . . . . . . . . . . . . . . . . . . . . . . . . . . . . . . . . 4-6Bar Charts . . . . . . . . . . . . . . . . . . . . . . . . . . . . . . . . . . . . 4-7Histograms . . . . . . . . . . . . . . . . . . . . . . . . . . . . . . . . . . . . 4-9Pie Charts . . . . . . . . . . . . . . . . . . . . . . . . . . . . . . . . . . . . 4-10Venn Diagrams . . . . . . . . . . . . . . . . . . . . . . . . . . . . . . . . . 4-11
Using Charts to Show Data . . . . . . . . . . . . . . . . . . . . . . . . . . . 4-12Selecting a Chart Type . . . . . . . . . . . . . . . . . . . . . . . . . . . . 4-12
Drawing Charts with Presentation Graphics Routines . . . . . . . . . . . . . . 4-13The Structure of Presentation Graphics Programs . . . . . . . . . . . . . . 4-13
Control Operations . . . . . . . . . . . . . . . . . . . . . . . . . . . . . . . 4-13Chart Definition . . . . . . . . . . . . . . . . . . . . . . . . . . . . . . . . . 4-14Chart Drawing . . . . . . . . . . . . . . . . . . . . . . . . . . . . . . . . . 4-14What You Can Do in a Program and Where . . . . . . . . . . . . . . . . 4-14More Control Operations . . . . . . . . . . . . . . . . . . . . . . . . . . . 4-15
Designing the Chart Layout . . . . . . . . . . . . . . . . . . . . . . . . . . . 4-15| Setting the Chart Size . . . . . . . . . . . . . . . . . . . . . . . . . . . . . 4-15| Setting the Character Size . . . . . . . . . . . . . . . . . . . . . . . . . . 4-16| Setting the Chart Margins . . . . . . . . . . . . . . . . . . . . . . . . . . . 4-17| Enclosing the Chart in a Frame . . . . . . . . . . . . . . . . . . . . . . . 4-18| Setting the Frame Attributes . . . . . . . . . . . . . . . . . . . . . . . . . 4-18
Adding Chart Features . . . . . . . . . . . . . . . . . . . . . . . . . . . . . . 4-18Writing Chart Headings . . . . . . . . . . . . . . . . . . . . . . . . . . . . 4-19
| Writing the Chart Heading . . . . . . . . . . . . . . . . . . . . . . . . . . 4-19| Suppressing the Chart Heading . . . . . . . . . . . . . . . . . . . . . . . 4-19| Setting the Heading Attributes . . . . . . . . . . . . . . . . . . . . . . . . 4-19| Positioning the Chart Heading . . . . . . . . . . . . . . . . . . . . . . . . 4-20
Drawing Chart Axes . . . . . . . . . . . . . . . . . . . . . . . . . . . . . . 4-20| Drawing or Suppressing the Chart Axes . . . . . . . . . . . . . . . . . . 4-21| Setting the Number of Axes . . . . . . . . . . . . . . . . . . . . . . . . . 4-22| Setting the Axis Attributes . . . . . . . . . . . . . . . . . . . . . . . . . . . 4-23| Positioning the Axis . . . . . . . . . . . . . . . . . . . . . . . . . . . . . . 4-23| Setting the Axis Range . . . . . . . . . . . . . . . . . . . . . . . . . . . . 4-26| Setting the Axis Scale . . . . . . . . . . . . . . . . . . . . . . . . . . . . . 4-27| Drawing the Axis Tick Marks . . . . . . . . . . . . . . . . . . . . . . . . . 4-28| Writing the Axis Text . . . . . . . . . . . . . . . . . . . . . . . . . . . . . . 4-30
Writing Axis Titles . . . . . . . . . . . . . . . . . . . . . . . . . . . . . . . 4-30Setting the Title Attributes . . . . . . . . . . . . . . . . . . . . . . . . . . . 4-30Writing the Axis Title . . . . . . . . . . . . . . . . . . . . . . . . . . . . . . 4-31Positioning the Title . . . . . . . . . . . . . . . . . . . . . . . . . . . . . . 4-31
| Writing Axis Labels . . . . . . . . . . . . . . . . . . . . . . . . . . . . . . 4-32Setting Label Attributes . . . . . . . . . . . . . . . . . . . . . . . . . . . . 4-33Setting Individual Axis Label Attributes . . . . . . . . . . . . . . . . . . . 4-33Positioning the Labels . . . . . . . . . . . . . . . . . . . . . . . . . . . . . 4-33Blanking the Label Area . . . . . . . . . . . . . . . . . . . . . . . . . . . . 4-33
Contents v
Specifying the Type of Label . . . . . . . . . . . . . . . . . . . . . . . . . 4-33Numeric Labels Generated by the System . . . . . . . . . . . . . . . . . 4-34Month Labels Generated by the System . . . . . . . . . . . . . . . . . . 4-34Day Labels Generated by the System . . . . . . . . . . . . . . . . . . . . 4-36Your Own Labels . . . . . . . . . . . . . . . . . . . . . . . . . . . . . . . . 4-36Drawing Other Reference Lines . . . . . . . . . . . . . . . . . . . . . . . 4-37
| Drawing Grid Lines . . . . . . . . . . . . . . . . . . . . . . . . . . . . . . 4-37Setting Grid Line Attributes . . . . . . . . . . . . . . . . . . . . . . . . . . 4-38Drawing Grid Lines . . . . . . . . . . . . . . . . . . . . . . . . . . . . . . 4-38
| Drawing Translated Axis Lines and Datum Lines . . . . . . . . . . . . . 4-39Drawing Translated Axis Lines . . . . . . . . . . . . . . . . . . . . . . . . 4-39Drawing Datum Lines . . . . . . . . . . . . . . . . . . . . . . . . . . . . . 4-39Setting Translated Axis Line or Datum Line Attributes . . . . . . . . . . 4-40Drawing Translated Axis Line or Datum Line . . . . . . . . . . . . . . . . 4-40Drawing Chart Legends . . . . . . . . . . . . . . . . . . . . . . . . . . . . 4-40
| Drawing or Suppressing the Legend . . . . . . . . . . . . . . . . . . . . 4-40| Positioning the Legend . . . . . . . . . . . . . . . . . . . . . . . . . . . . 4-41| Blanking the Legend Area . . . . . . . . . . . . . . . . . . . . . . . . . . 4-41| Enclosing the Legend in a Box . . . . . . . . . . . . . . . . . . . . . . . . 4-42| Writing the Legend Key Labels . . . . . . . . . . . . . . . . . . . . . . . . 4-42
Writing Chart Notes . . . . . . . . . . . . . . . . . . . . . . . . . . . . . . 4-43| Setting Attributes for Notes . . . . . . . . . . . . . . . . . . . . . . . . . . 4-43| Blanking the Note Area . . . . . . . . . . . . . . . . . . . . . . . . . . . . 4-43| Enclosing the Note in a Box . . . . . . . . . . . . . . . . . . . . . . . . . 4-43| Writing the Note . . . . . . . . . . . . . . . . . . . . . . . . . . . . . . . . 4-43
Designing the Chart Layout: Summary . . . . . . . . . . . . . . . . . . . 4-45Drawing the Chart . . . . . . . . . . . . . . . . . . . . . . . . . . . . . . . . . 4-46
Using Component Attributes . . . . . . . . . . . . . . . . . . . . . . . . . 4-47Drawing Line Charts . . . . . . . . . . . . . . . . . . . . . . . . . . . . . . . 4-47
| Setting the Color Selection Order . . . . . . . . . . . . . . . . . . . . . . 4-47| Setting the Line Type Selection Order . . . . . . . . . . . . . . . . . . . 4-47| Setting the Line Width . . . . . . . . . . . . . . . . . . . . . . . . . . . . . 4-48| Setting the Marker Type Selection Order . . . . . . . . . . . . . . . . . . 4-48| Suppressing the Markers . . . . . . . . . . . . . . . . . . . . . . . . . . . 4-48| Setting the Line Curve . . . . . . . . . . . . . . . . . . . . . . . . . . . . . 4-48| Writing Data Values . . . . . . . . . . . . . . . . . . . . . . . . . . . . . . 4-48| Drawing the Chart . . . . . . . . . . . . . . . . . . . . . . . . . . . . . . . 4-49
Drawing Scatter Plots . . . . . . . . . . . . . . . . . . . . . . . . . . . . . . . 4-51| Setting the Color Selection Order . . . . . . . . . . . . . . . . . . . . . . 4-51| Setting the Marker Type Selection Order . . . . . . . . . . . . . . . . . . 4-51| Writing Data Values . . . . . . . . . . . . . . . . . . . . . . . . . . . . . . 4-52| Drawing the Scatter Plot . . . . . . . . . . . . . . . . . . . . . . . . . . . 4-52
Drawing Surface Charts . . . . . . . . . . . . . . . . . . . . . . . . . . . . . 4-54| Setting the Component Color Selection Order . . . . . . . . . . . . . . . 4-54| Setting the Line Curve . . . . . . . . . . . . . . . . . . . . . . . . . . . . . 4-54| Writing Data Values . . . . . . . . . . . . . . . . . . . . . . . . . . . . . . 4-55| Setting the Shading Attributes . . . . . . . . . . . . . . . . . . . . . . . . 4-55| Setting the Type of Shading to be Performed . . . . . . . . . . . . . . . 4-56| Setting the Type of Data to be Shown . . . . . . . . . . . . . . . . . . . 4-56| Drawing the Surface Chart . . . . . . . . . . . . . . . . . . . . . . . . . . 4-58| Drawing a Floating Surface Chart . . . . . . . . . . . . . . . . . . . . . . 4-60
Drawing Bar Charts . . . . . . . . . . . . . . . . . . . . . . . . . . . . . . . . 4-62| Setting the Component Color Selection Order . . . . . . . . . . . . . . . 4-62| Setting the Bar Attributes . . . . . . . . . . . . . . . . . . . . . . . . . . . 4-62
vi AS/400 GDDM Programming Guide
| Writing Bar Values . . . . . . . . . . . . . . . . . . . . . . . . . . . . . . . 4-63| Setting the Bar Spacing . . . . . . . . . . . . . . . . . . . . . . . . . . . . 4-63| Drawing the Bar Chart . . . . . . . . . . . . . . . . . . . . . . . . . . . . . 4-63| Drawing Multiple-Bar Charts . . . . . . . . . . . . . . . . . . . . . . . . . 4-65| Drawing Composite-Bar Charts . . . . . . . . . . . . . . . . . . . . . . . 4-71| Drawing Floating-Bar Charts . . . . . . . . . . . . . . . . . . . . . . . . . 4-75
Drawing Pie Charts . . . . . . . . . . . . . . . . . . . . . . . . . . . . . . . . 4-77| Setting the Component Color Selection Order . . . . . . . . . . . . . . . 4-77| Setting the Shading Attributes . . . . . . . . . . . . . . . . . . . . . . . . 4-77| Writing Pie Chart Text . . . . . . . . . . . . . . . . . . . . . . . . . . . . . 4-77| Setting the Type of Data to be Shown . . . . . . . . . . . . . . . . . . . 4-79| Controlling Pie Slices . . . . . . . . . . . . . . . . . . . . . . . . . . . . . 4-79| Drawing the Pie Chart . . . . . . . . . . . . . . . . . . . . . . . . . . . . . 4-79| Drawing a Multiple-Pie Chart . . . . . . . . . . . . . . . . . . . . . . . . . 4-81
Drawing Histograms . . . . . . . . . . . . . . . . . . . . . . . . . . . . . . . 4-87| Setting the Color of the Shaded Area . . . . . . . . . . . . . . . . . . . . 4-87| Setting the Shading Attributes . . . . . . . . . . . . . . . . . . . . . . . . 4-87| Setting the Type of Data to be Shown . . . . . . . . . . . . . . . . . . . 4-87| Suppressing the Risers . . . . . . . . . . . . . . . . . . . . . . . . . . . . 4-87| Drawing the Histogram . . . . . . . . . . . . . . . . . . . . . . . . . . . . 4-87
Drawing Venn Diagrams . . . . . . . . . . . . . . . . . . . . . . . . . . . . . 4-89| Setting the Color of the Components . . . . . . . . . . . . . . . . . . . . 4-89| Setting the Shading Attributes . . . . . . . . . . . . . . . . . . . . . . . . 4-90| Drawing the Venn Diagram . . . . . . . . . . . . . . . . . . . . . . . . . . 4-90
More Control Routines . . . . . . . . . . . . . . . . . . . . . . . . . . . . . . 4-92| Reset the Processing State . . . . . . . . . . . . . . . . . . . . . . . . . . 4-92| Reinitialize Presentation Graphics . . . . . . . . . . . . . . . . . . . . . . 4-92| Terminate Presentation Graphics . . . . . . . . . . . . . . . . . . . . . . 4-92
Summary of This Chapter . . . . . . . . . . . . . . . . . . . . . . . . . . . . . . 4-93
Chapter 5. OS/400 Programming Considerations . . . . . . . . . . . . . . . 5-1AS/400 Files Used for Graphics . . . . . . . . . . . . . . . . . . . . . . . . . . 5-1
Display Files . . . . . . . . . . . . . . . . . . . . . . . . . . . . . . . . . . . 5-1QDGDDM Display File Considerations . . . . . . . . . . . . . . . . . . . . 5-2The ALWGPH DDS Keyword . . . . . . . . . . . . . . . . . . . . . . . . . . 5-3
Printer Files . . . . . . . . . . . . . . . . . . . . . . . . . . . . . . . . . . . . . 5-5QPGDDM Printer File Considerations . . . . . . . . . . . . . . . . . . . . . 5-5
| Database Files . . . . . . . . . . . . . . . . . . . . . . . . . . . . . . . . . . . . 5-7OS/400 Graphics Symbol Sets . . . . . . . . . . . . . . . . . . . . . . . . . . 5-7
Image Symbol Sets . . . . . . . . . . . . . . . . . . . . . . . . . . . . . . . 5-9Vector Symbol Sets . . . . . . . . . . . . . . . . . . . . . . . . . . . . . . 5-10Using Graphics Symbol Sets . . . . . . . . . . . . . . . . . . . . . . . . . 5-11
Creating Graphics Symbol Sets . . . . . . . . . . . . . . . . . . . . . . . . . . 5-11Graphics Symbol Set (*GSS) Objects . . . . . . . . . . . . . . . . . . . . 5-12
Performance Considerations . . . . . . . . . . . . . . . . . . . . . . . . . . . 5-14Error Recovery . . . . . . . . . . . . . . . . . . . . . . . . . . . . . . . . . . . 5-16
Error-Handling Considerations . . . . . . . . . . . . . . . . . . . . . . . . 5-16Error Messages . . . . . . . . . . . . . . . . . . . . . . . . . . . . . . . . 5-17
User-Defined Data Streams . . . . . . . . . . . . . . . . . . . . . . . . . . . 5-19
Chapter 6. Graphics Application Program Examples . . . . . . . . . . . . . 6-1The Envelope Program in Other Languages . . . . . . . . . . . . . . . . . . . . 6-1
Envelope Program in the RPG/400 Programming Language . . . . . . . . . 6-2| Envelope Program in the COBOL/400 Programming Language . . . . . . . 6-5
Contents vii
Envelope Program in PL/I . . . . . . . . . . . . . . . . . . . . . . . . . . . . . 6-8Envelope Program in Pascal . . . . . . . . . . . . . . . . . . . . . . . . . . . . 6-9
The Line Chart Program in Other Languages . . . . . . . . . . . . . . . . . . 6-10Line Chart Program in the RPG/400 Programming Language . . . . . . . 6-11
| Line Chart Program in the COBOL/400 Programming Language . . . . . . 6-12Line Chart Program in PL/I . . . . . . . . . . . . . . . . . . . . . . . . . . . . 6-13Line Chart Program in Pascal . . . . . . . . . . . . . . . . . . . . . . . . . . 6-13
Complex Programs . . . . . . . . . . . . . . . . . . . . . . . . . . . . . . . . . . 6-15BASIC Program Showing Three Charts on a Page . . . . . . . . . . . . . . 6-15
| BASIC Program that Interacts with Database Files . . . . . . . . . . . . . . 6-21| COBOL/400 Multiple-Pie Chart Program . . . . . . . . . . . . . . . . . . . . 6-28
PL/I Planned Versus Actual Versus Trend Program . . . . . . . . . . . . . 6-33PL/I GDDM Color Table Application . . . . . . . . . . . . . . . . . . . . . . 6-36PL/I GDDM Order Form Application . . . . . . . . . . . . . . . . . . . . . . 6-40RPG/400 Program with Presentation Graphics and GDDM . . . . . . . . . 6-47
Graphics Image Programs in Each Language . . . . . . . . . . . . . . . . . . 6-54Graphics Image Drawn in BASIC . . . . . . . . . . . . . . . . . . . . . . . . 6-54Graphics Image Drawn in the RPG/400 Programming Language . . . . . 6-55
| Graphics Image Drawn in the COBOL/400 Programming Language . . . . 6-58Graphics Image Drawn in PL/I . . . . . . . . . . . . . . . . . . . . . . . . . . 6-62Graphics Image Drawn in Pascal . . . . . . . . . . . . . . . . . . . . . . . . 6-63
Appendix A. Devices Compatible with the AS/400 System . . . . . . . . A-1The IBM Plotters . . . . . . . . . . . . . . . . . . . . . . . . . . . . . . . . . A-3
How to Configure a Plotter . . . . . . . . . . . . . . . . . . . . . . . . . . A-3How to Send Pictures to a Plotter . . . . . . . . . . . . . . . . . . . . . . A-3
Printers Capable of Graphics . . . . . . . . . . . . . . . . . . . . . . . . . . A-6How to Configure a Printer . . . . . . . . . . . . . . . . . . . . . . . . . . A-6How to Send Pictures to a Printer . . . . . . . . . . . . . . . . . . . . . . A-6
Merging Text and Graphics for Print Files . . . . . . . . . . . . . . . . . . . . A-9Non-Graphics Devices . . . . . . . . . . . . . . . . . . . . . . . . . . . . . . A-12
| Bibliography . . . . . . . . . . . . . . . . . . . . . . . . . . . . . . . . . . . . . H-1
Index . . . . . . . . . . . . . . . . . . . . . . . . . . . . . . . . . . . . . . . . . . X-1
viii AS/400 GDDM Programming Guide
| Notices
| References in this publication to IBM products, programs, or services do not imply| that IBM intends to make these available in all countries in which IBM operates.
| Any reference to an IBM licensed program or other IBM product in this publication| is not intended to state or imply that only IBM's program or other product may be| used.
| IBM may have patents or pending patent applications covering subject matter in| this document. The furnishing of this document does not give you any license to| these patents. You can send license inquiries, in writing, to the IBM Director of| Commercial Relations, IBM Corporation, Purchase, NY 10577.
| The following terms, denoted by an asterisk (*) in this publication, are trademarks of| the IBM Corporation in the United States and/or other countries:
| AD/Cycle Application System/400| AS/400 IBM| Operating System/400 OS/400| Personal System/2 RPG/400| SAA Systems Application Architecture
| System/370 400
| This publication could contain technical inaccuracies or typographical errors.
| This guide may refer to products that are announced but are not yet available.
| Information that has changed since Version 1 Release 3 Modification 0 is indicated| by a vertical bar (|) to the left of the change.
| This guide contains small programs that are furnished by IBM as simple examples| to provide an illustration. These examples have not been thoroughly tested under| all conditions. IBM, therefore, cannot guarantee or imply reliability, serviceability, or| function of these programs. All programs contained herein are provided to you "AS| IS". THE IMPLIED WARRANTIES OF MERCHANTABILITY AND FITNESS FOR A| PARTICULAR PURPOSE ARE EXPRESSLY DISCLAIMED.
| Programming Interface| The GDDM Programming Guide is intended to help the customer create graphic| applications. The guide contains general-use programming interfaces, which allow| the customer to write programs that use the services of the graphic data display| manager (GDDM).
Copyright IBM Corp. 1991 ix

x AS/400 GDDM Programming Guide
| About This Guide
| This guide, together with the manual Programming: GDDM Programming| Reference, SC41-0537, describes the application programming interface for the| graphics capabilities of the AS/400 system. This guide describes the graphical data| display manager (GDDM) and presentation graphics routine (PGR) calls that are| available under the AS/400 system. Through the use of sample code and complete| programs, along with their associated output, the techniques of graphics| programming are demonstrated.
| This guide does not describe how to use the IBM AS/400 Business Graphics Utility| (BGU), nor does it describe an interface for BGU. For this information, refer to| Business Graphics Utility User’s Guide and Reference, SC09-1408.
| You may need to refer to other IBM manuals for more specific information about a| particular topic. The Publications Guide, GC41-9678, provides information on all| the manuals in the AS/400 library.
| For a list of publications related to this guide, see the “Bibliography.”
| Who Should Use This Guide| This guide is to be used by AS/400 application programmers responsible for| creating graphics applications.
| To use this guide, you should understand the concepts of the IBM Operation| System/400 licensed program and the AS/400 system.
| You should know how to write, debug, compile, and run programs in one of the| following programming languages supported by the AS/400 System: BASIC, the| COBOL/400 language, Pascal, PL/I, or the RPG/400 language. Also, you should| know how to use one of the supported display devices. You can find information| on them in the appropriate PC Support manual.
| Throughout this manual, the term personal computer applies to any IBM personal| computer that uses work station function (WSF), work station emulation (WSE), or| 5250 emulation.
Copyright IBM Corp. 1991 xi

xii AS/400 GDDM Programming Guide
Introduction
Chapter 1. An Introduction to OS/400 Graphics
What Is OS/400 Graphics All About?OS/400* (Operation System/400*) Graphics lets you add color and pictures toapplication programs. You can use the visual effect of color and pictures to helpmake your programs easier to use and make the results of your high-levellanguage programs easier to understand.
High-level language programs call OS/400 Graphics subroutines (called routines) toconstruct pictures. Each routine is like a small, self-contained program. Theroutines are organized in two groups:
GDDM routines
Presentation Graphics routines.
| Graphical Data Display Manager (GDDM) routines perform basic graphics tasks,such as drawing a line from point A to point B. A series of these line-drawingroutines in an application program can produce a more complex picture. Also,GDDM routines are called in an application program to initialize and end thegraphics environment, define characteristics for functions that other GDDM routineswill perform (such as setting the color and width of a line that another GDDMroutine will draw), send the picture to the work station, and so forth.
Presentation Graphics routines provide you with a fast and efficient way ofconverting your numeric data to color business charts in an application program.One Presentation Graphics routine can specify the type of chart used to presentyour data (for example line charts, bar charts, or pie charts). Other routines in yourprogram can do such things as label the data and specify the chart heading.
Presentation Graphics routines are built with sets of GDDM routines. Anapplication program can have any mixture of GDDM and Presentation Graphicsroutines.
Similar groups of routines are used for graphics on the IBM* System/370* family ofdata processing systems. If you have access to those systems, you may be able
| to move your PL/I and BASIC graphics application programs from the AS/400*| system.
What Are Some Uses of OS/400 Graphics?OS/400 Graphics can be used to increase the usability of your existing applicationprograms. For example, a program that uses data description specifications (DDS)display files for menus can be enhanced with GDDM routines. Menu titles andhighlighted fields can be shown with larger-than-normal characters in various fontsand colors. Also, graphics pictures, such as company logos, can be added toprogram menus.
Presentation Graphics routines can be used to change the way the output of aprogram is presented. A program that produces rows and columns of numbers canbe changed so that the program produces that same data graphically on a chart.
Copyright IBM Corp. 1991 1-1
Introduction
Other ideas for uses of OS/400 Graphics are presented in this book.
What Do I Need Before I Can Use OS/400 Graphics?
AS/400 HardwareYou can write and run OS/400 Graphics application programs using any model of
| the AS/400 System. (It must have the Operation System/400 program installed.)
Although you can write and compile the programs on any work station that hasbeen described to the system, only the following devices can be used to displaygraphics:
| � IBM personal computer with work station function (WSF)| � IBM personal computer with work station emulation (WSE)
� 5292 Model 2� IBM personal computer with 5250 emulation
Note: In this manual, the term “graphics work station” means one of thosedevices.
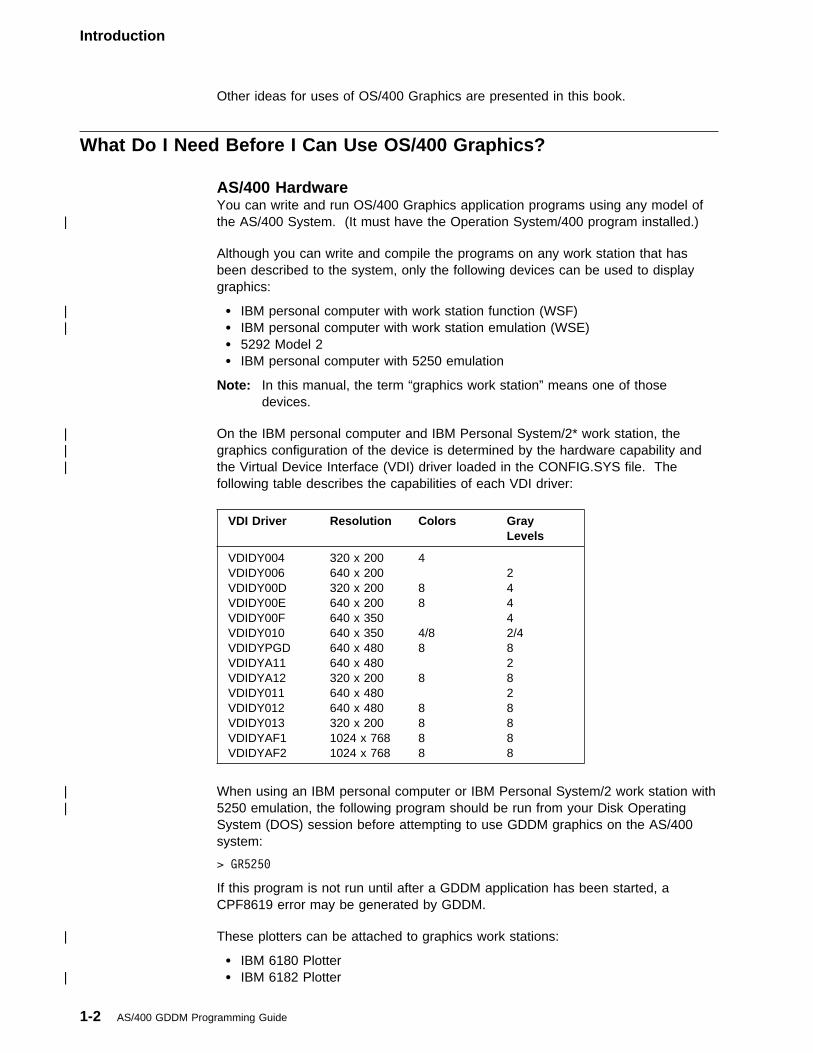
| On the IBM personal computer and IBM Personal System/2* work station, the| graphics configuration of the device is determined by the hardware capability and| the Virtual Device Interface (VDI) driver loaded in the CONFIG.SYS file. The
following table describes the capabilities of each VDI driver:
| When using an IBM personal computer or IBM Personal System/2 work station with| 5250 emulation, the following program should be run from your Disk Operating
System (DOS) session before attempting to use GDDM graphics on the AS/400system:
> GR525�
If this program is not run until after a GDDM application has been started, aCPF8619 error may be generated by GDDM.
| These plotters can be attached to graphics work stations:
� IBM 6180 Plotter| � IBM 6182 Plotter
VDI Driver Resolution Colors GrayLevels
VDIDY004VDIDY006VDIDY00DVDIDY00EVDIDY00FVDIDY010VDIDYPGDVDIDYA11VDIDYA12VDIDY011VDIDY012VDIDY013VDIDYAF1VDIDYAF2
320 x 200640 x 200320 x 200640 x 200640 x 350640 x 350640 x 480640 x 480320 x 200640 x 480640 x 480320 x 2001024 x 7681024 x 768
4 88 4/88 8 8888
24442/482828888
1-2 AS/400 GDDM Programming Guide
Introduction
| � IBM 6184 Plotter| � IBM 6185 Plotter| � IBM 6186-1 Plotter| � IBM 6186-2 Plotter
� IBM 7371 Plotter� IBM 7372 Plotter
Graphics can be printed on these Systems Network Architecture (SNA) characterstring (SCS) devices:
� IBM 4214 Printer� IBM 4234-2 Printer� IBM 5224 Printer� IBM 5225 Printer
| Graphics can also be printed on any intelligent printer data stream (IPDS) device| that supports graphics, including the following:
� IBM 3812 Printer� IBM 3816 Printer
| � IBM 4028 Printer� IBM 4224 Printer
It is also possible to send a graphics data format (GDF) file (the internal dataGDDM interprets to draw the picture) to other systems. The device receiving thegraphics data must have the software necessary to interpret the data.
AS/400 Software| Besides having the OS/400 program installed, you must have a compiler for one of
the following high-level languages:
| BASIC IBM AS/400 BASIC licensed program product, program number| 5738-BA1
| IBM SAA* AD/Cycle RPG/400*| IBM RPG/400 licensed program product, program number 5738-RG1
| IBM SAA AD/Cycle COBOL/400*| IBM AS/400 COBOL licensed program product, program number| 5738-CB1
| PL/I IBM AS/400 PL/I licensed program product, program number| 5738-PL1 (with library QGDDM in your library list)
| Pascal IBM AS/400 Pascal licensed program product, program number| 5738-PS1 (with library QGDDM in your library list)
Required KnowledgeTo write graphics application programs for the AS/400 System, you must knowAS/400 application programming in one of the five high-level languages.
You can learn the concepts and fundamentals of OS/400 Graphics from thismanual. Once you have read this manual, you can find more detailed information
| about GDDM and Presentation Graphics routines in the GDDM Programming| Reference manual.
In the next chapter, you will learn more about OS/400 Graphics and will see twosimple programs, one that shows GDDM routines and one that shows PresentationGraphics routines.
Chapter 1. Introduction 1-3
Introduction
1-4 AS/400 GDDM Programming Guide
Graphics API
Chapter 2. The Application Program Interface to Graphics
This chapter shows you how GDDM and Presentation Graphics routines can becalled by programs to produce graphics (pictures and charts).
In Chapter 1, “An Introduction to OS/400 Graphics,” you learned that OS/400Graphics has two major components, GDDM routines and Presentation Graphicsroutines. You learned that you can draw pictures by calling the appropriateroutines from your high-level language program.
This chapter gives you a brief overview of the steps needed to produce a program,followed by sample programs that show GDDM and Presentation Graphics routinesin use.
Note: In the text, the term GDDM program means a graphics application programthat uses GDDM routines; likewise, a Presentation Graphics program is agraphics application program that uses Presentation Graphics routines.
Programming ConsiderationsTo produce an OS/400 Graphics application program on the AS/400 System, youmust write an AS/400 application program in a high-level language. You must:
1. Enter the program (the source code).
2. Compile the program (unless you use the BASIC interpreter).
3. Run the program.
You can enter your OS/400 Graphics programs using the Source Entry Utility(SEU). SEU provides special display formats for each of the AS/400 high-levellanguages to help you enter your programs.
For more information on entering programs with SEU, refer to the SEU User’sGuide and Reference.
You can compile and run your graphics program in the manner provided by the| high-level language you are using. Refer to the appropriate high-level language| manual for more information on compiling and running programs.
| Graphics programs written in COBOL/400, RPG/400, Pascal, and PL/Iprogramming languages must be compiled before they can be called and run.BASIC programs can be compiled and run also, but with BASIC you have theoption to use the interpreter to LOAD and RUN source files. You can thenmake changes to your program without having to compile it again.
The Command Language (CL) command STRBAS starts the BASIC interpreter.For more information, refer to the BASIC User’s Guide and Reference.
The early program examples in this manual are all written in BASIC.Chapter 6, “Graphics Application Program Examples,” shows programs writtenin all the supported languages.
Copyright IBM Corp. 1991 2-1
Graphics API
Drawing a Simple Picture with GDDMMany of the things you do to draw a picture with GDDM are similar to things you doto draw a picture with pencils and paper.
When you draw a picture with pencils and paper, you perform these steps:
1. Initialize the graphics environment. You decide to draw a picture.
2. Set the initial attributes. You select a pencil of the type and color you want touse for your picture.
3. Draw the picture. You place the tip of the pencil at the point on a paper wherethe first line should begin. Then you draw the line to another point on thepaper. If you decide the next line should be of a different color, you get theappropriate colored pencil. You position the pencil on the paper (perhaps onthe end point of the first line), then draw the next line. You continue to drawlines until the picture is complete.
4. Display the picture. You look at it or give it to someone else to look at.
5. End the graphics environment. You decide the picture is complete.
A graphics program on the AS/400 System uses GDDM routines to perform thesame basic steps:
1. Initialize the graphics environment. The program uses a GDDM routine tosignal to the AS/400 System that it is going to call GDDM or call both GDDMand the Presentation Graphics routines.
2. Set the initial attributes. The attributes (visual characteristics) of the first item tobe drawn are defined by the appropriate GDDM routine. For example, if thefirst item to be drawn is a line, the program must use GDDM routines to specifythe color and line width attributes (the color and type of the pencil). Any otherlines that the program draws after the first line will be of the same color andline width, unless the program sets the attributes to different values for thoselines (a different color or type of pencil).
3. Draw the picture. The program uses a GDDM routine to specify a point on thescreen from which the first line will be drawn (placing the pencil on the paper).Another GDDM routine will then specify the line to draw and the point on thescreen where the line is to end (drawing the line to an end point). More GDDMroutines can specify more lines that begin at the point each previous lineended, until the picture is complete.
4. Display the picture. Once all parts of the picture have been described by theprogram, another GDDM routine sends the picture to the work station screen orhard-copy device.
5. End the graphics environment. After the picture has been sent to the device, aGDDM routine is used to end the graphics environment that was initializedearlier.
Programs that use GDDM and Presentation Graphics routines can be written in the| BASIC, COBOL/400, Pascal, PL/I, and RPG/400 high-level languages. BASIC,| COBOL/400, and RPG/400 programming languages feature a language extension,
the CALL GDDM statement. CALL GDDM is used to call each GDDM andPresentation Graphics routine and to convert data types from those used by thehigh-level language to those that can be used by GDDM. After the GDDM graphicsroutine has been performed, the data types are converted back to those used in thehigh-level language program.
2-2 AS/400 GDDM Programming Guide
Graphics API
Pascal and PL/I use a slightly different method to call graphics routines. They useinclude statements that can be named in the program. These includes declare the
| GDDM and Presentation Graphics routines and perform data-type checking.
| The envelope.| The envelope| shown here was| drawn by a| BASIC program| using GDDM| routines.
| �|
| 35MM�536A2
| �| �
The following BASIC program was used to draw the picture of the envelope:
���1� REM �����������������������������������������������������������
���2� REM INITIALIZE
���3� REM �����������������������������������������������������������
���4� CALL GDDM ('FSINIT') ! Initialize the graphics environment
���5� INTEGER ATTYPE, ATTVAL, COUNT ! Declare integer variables
���6� REM �����������������������������������������������������������
���7� REM SET ATTRIBUTES
���8� REM �����������������������������������������������������������
���9� CALL GDDM ('GSLW',2) ! Assign line width (2 = wide)
��1�� CALL GDDM ('GSCOL',5) ! Assign color (5 = turquoise)
��11� REM �����������������������������������������������������������
��12� REM DRAW ENVELOPE
��13� REM �����������������������������������������������������������
��14� CALL GDDM ('GSMOVE',1.�,75.�) ! Move to upper left corner
��15� CALL GDDM ('GSLINE',8�.�,75.�) ! Draw across to upper right
��16� CALL GDDM ('GSLINE',8�.�,1.�) ! Draw down to lower right
��17� CALL GDDM ('GSLINE',1.�,1.�) ! Draw across to lower left
��18� CALL GDDM ('GSLINE',1.�,75.�) ! Draw up to upper left corner
��19� CALL GDDM ('GSLINE',4�.�,1��.�) ! Draw up to point of flap
��2�� CALL GDDM ('GSLINE',8�.�,75.�) ! Draw down, over to upper right
��21� REM �����������������������������������������������������������
��22� REM RESET ATTRIBUTES & DRAW STAMP
��23� REM �����������������������������������������������������������
��24� CALL GDDM ('GSCOL',2) ! Assign color (2 = red)
��25� CALL GDDM ('GSAREA',1) ! Specify filled area w/outline
��26� CALL GDDM ('GSMOVE',67.�,7�.�) ! Move to upper left corner
��27� CALL GDDM ('GSLINE',77.�,7�.�) ! Draw across to upper right
Chapter 2. API to graphics 2-3
Graphics API
��28� CALL GDDM ('GSLINE',77.�,55.�) ! Draw down to lower right
��29� CALL GDDM ('GSLINE',67.�,55.�) ! Draw across to lower left
��3�� CALL GDDM ('GSLINE',67.�,7�.�) ! Draw up to upper left
��31� CALL GDDM ('GSENDA') ! Fill the area
��32� REM �����������������������������������������������������������
��33� REM WRITE ADDRESS
��34� REM �����������������������������������������������������������
��35� CALL GDDM ('GSCOL',4) ! Assign color (4 = green)
��36� CALL GDDM ('GSCHAR',3�.�,45.�, 8,'R G Blue') ! Write line 1
��37� CALL GDDM ('GSCHAR',3�.�,35.�,12,'123 Color Ln') ! Write line 2
��38� CALL GDDM ('GSCHAR',3�.�,25.�,11,'Vectorville') ! Write line 3
��39� REM �����������������������������������������������������������
��4�� REM DISPLAY THE PICTURE
��41� REM �����������������������������������������������������������
��42� CALL GDDM ('ASREAD',ATTYPE,ATTVAL,COUNT) ! Display the picture
��43� REM �����������������������������������������������������������
��44� REM END GRAPHICS
��45� REM �����������������������������������������������������������
��46� CALL GDDM ('FSTERM') ! End graphics
��47� END ! End BASIC program
As you can see from the comment lines, the program performs these steps:
1. Initialize graphics and declare data types for the variables (all integers, in thisinstance).
2. Set attributes by assigning values directly to the GDDM attribute routines.
3. Draw the picture by calling the appropriate GDDM routines.
4. Display the picture.
5. End graphics.
Note: The example program is a BASIC program. When BASIC is used forGDDM programs, it has these conventions:
� Integer variables must be declared with an INTEGER statement; integervalues can be passed to GDDM routines as literals (the number itself),or they can be passed as variables (variable = the number).
� Floating-point variables need not be declared. Floating-point values canbe passed to GDDM routines as literals, or they can be passed asvariables. Floating-point values passed as literals must contain adecimal point and at least one digit after the decimal point.
� Character variables with a length less than 19 need not be declared.Character strings can be passed to GDDM routines as literals (thestrings must be enclosed in apostrophes) or they can be passed asvariables. A character variable assigned a string of 19 or morecharacters must be declared with a dimension statement (for example,DIM A$*20 sets the dimension of character variable A$ to 20, allowingA$ to be assigned a character string of up to 20 characters).
� GDDM routine names are specified as character strings (enclosed in| apostrophes), followed by the parameters of the routine. The syntax for| GDDM in COBOL/400, RPG/400, Pascal, and PL/I programming
languages differs from that of BASIC. The examples in Chapter 6,“Graphics Application Program Examples,” show this same envelope
| program in the other languages. For more information, refer to the| GDDM Programming Reference manual.
2-4 AS/400 GDDM Programming Guide
Graphics API
How the Program WorksInitializing the Graphics Environment: The FSINIT routine initializes thegraphics environment.
���4� CALL GDDM ('FSINIT')
���5� INTEGER ATTYPE, ATTVAL, COUNT
FSINIT signals to the application program that calls to GDDM, or PresentationGraphics routines, or both will occur.
In this program, FSINIT was followed by some data declarations. When you usevariables in your program that will be set to integer values, the data types for thosevariables must be declared. Data type declarations can precede or follow FSINIT.
Setting the Initial Attributes: Attributes determine the results of certain GDDMroutines. The attributes that are set in this portion of the sample program definethe color and the line width of the envelope outline.
���9� CALL GDDM ('GSLW',2)
��1�� CALL GDDM ('GSCOL',5)
GDDM routines continue to use attribute values until different values are assigned.Default attributes are assigned if no others are specified (line width = narrow, color
| = green). Other types of attributes were assigned by default in the program. They| are discussed in Chapter 3, “Using GDDM.”
One of the attributes assigned by default in the envelope program describes thecoordinate system used for positioning the lines and characters of the picture. Forthis program, the attribute values were the default coordinates of x = 0 through 100,and y = 0 through 100; (x0,y0) is the lower-left position on the picture, and(x100,y100) is the upper-right position.
Chapter 2. API to graphics 2-5
Graphics API
| The coordinate| system. This| illustration shows| the default| coordinate| system used by| GDDM when| you do not| specify one in| your program.
| PL0536A3
Drawing the Picture: GDDM routines define the features of the picture.
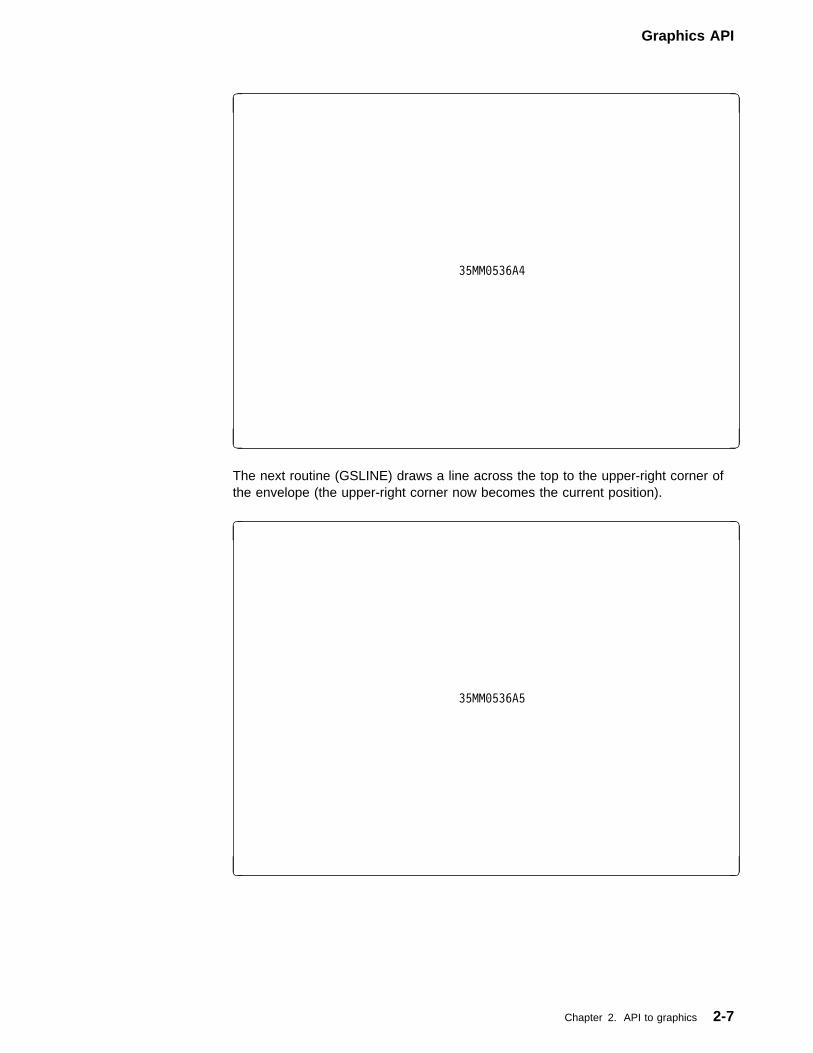
GDDM line-drawing routines use only end point coordinates, so the starting point ofthe line must be specified. The starting point is called the current position. Thecurrent position can be the point at which the last drawing routine ended, or youcan put the current position wherever you want it with the GSMOVE routine. In theexample, GSMOVE places the current position at the upper-left corner of theenvelope, coordinates x = 1, y = 75.
2-6 AS/400 GDDM Programming Guide
Graphics API
�
35MM�536A4
� �
The next routine (GSLINE) draws a line across the top to the upper-right corner ofthe envelope (the upper-right corner now becomes the current position).
�
35MM�536A5
� �
Chapter 2. API to graphics 2-7
Graphics API
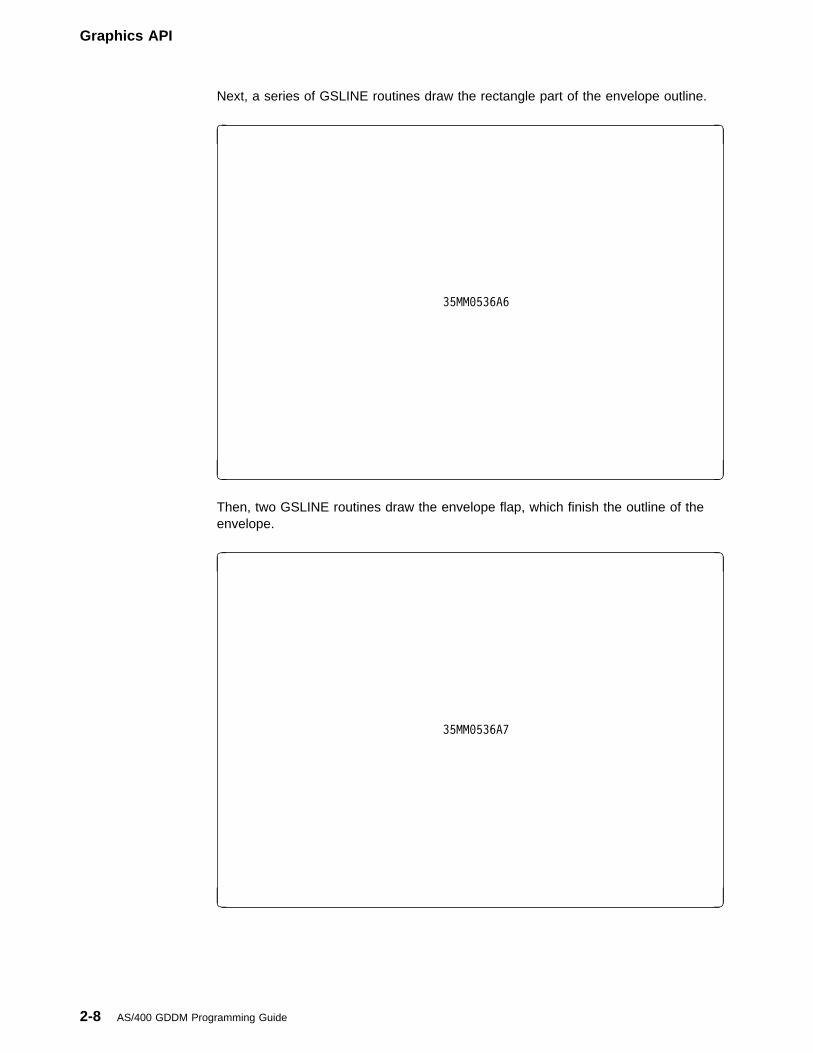
Next, a series of GSLINE routines draw the rectangle part of the envelope outline.
�
35MM�536A6
� �
Then, two GSLINE routines draw the envelope flap, which finish the outline of theenvelope.
�
35MM�536A7
� �
2-8 AS/400 GDDM Programming Guide
Graphics API
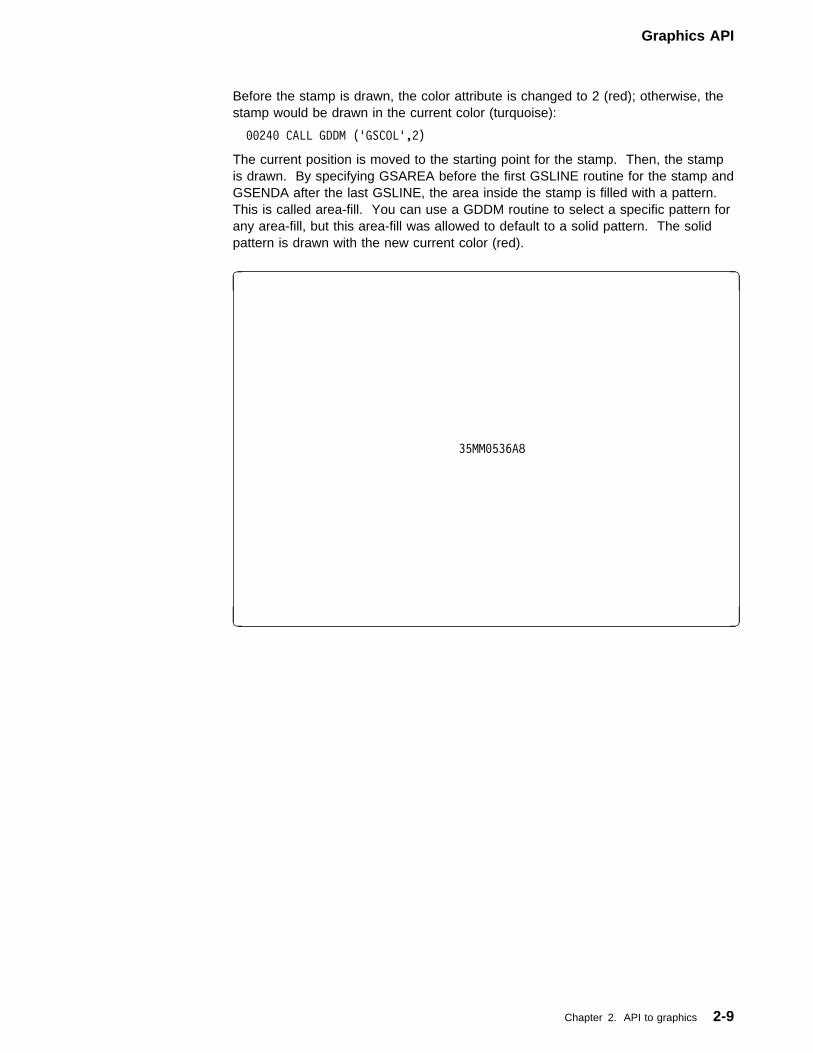
Before the stamp is drawn, the color attribute is changed to 2 (red); otherwise, thestamp would be drawn in the current color (turquoise):
��24� CALL GDDM ('GSCOL',2)
The current position is moved to the starting point for the stamp. Then, the stampis drawn. By specifying GSAREA before the first GSLINE routine for the stamp andGSENDA after the last GSLINE, the area inside the stamp is filled with a pattern.This is called area-fill. You can use a GDDM routine to select a specific pattern forany area-fill, but this area-fill was allowed to default to a solid pattern. The solidpattern is drawn with the new current color (red).
�
35MM�536A8
� �
Chapter 2. API to graphics 2-9
Graphics API
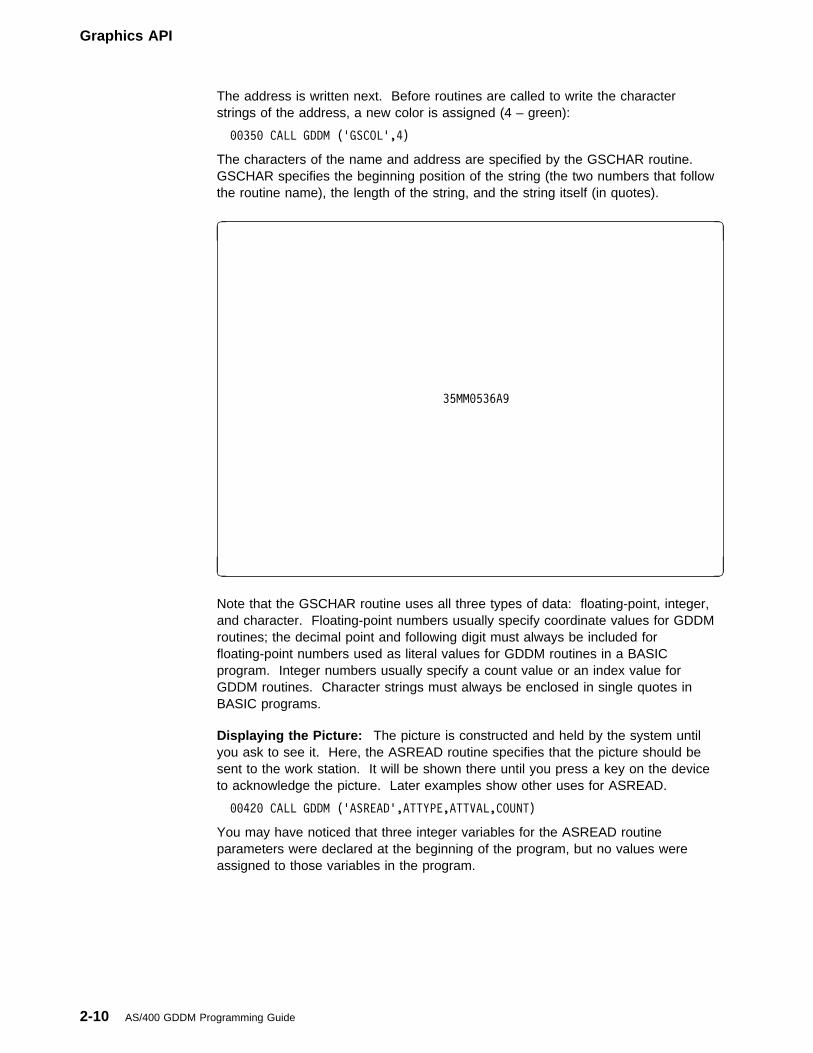
The address is written next. Before routines are called to write the characterstrings of the address, a new color is assigned (4 – green):
��35� CALL GDDM ('GSCOL',4)
The characters of the name and address are specified by the GSCHAR routine.GSCHAR specifies the beginning position of the string (the two numbers that followthe routine name), the length of the string, and the string itself (in quotes).
�
35MM�536A9
� �
Note that the GSCHAR routine uses all three types of data: floating-point, integer,and character. Floating-point numbers usually specify coordinate values for GDDMroutines; the decimal point and following digit must always be included forfloating-point numbers used as literal values for GDDM routines in a BASICprogram. Integer numbers usually specify a count value or an index value forGDDM routines. Character strings must always be enclosed in single quotes inBASIC programs.
Displaying the Picture: The picture is constructed and held by the system untilyou ask to see it. Here, the ASREAD routine specifies that the picture should besent to the work station. It will be shown there until you press a key on the deviceto acknowledge the picture. Later examples show other uses for ASREAD.
��42� CALL GDDM ('ASREAD',ATTYPE,ATTVAL,COUNT)
You may have noticed that three integer variables for the ASREAD routineparameters were declared at the beginning of the program, but no values wereassigned to those variables in the program.
2-10 AS/400 GDDM Programming Guide
Graphics API
Parameters like these are assigned values by GDDM; you can later use theseprogram-assigned values for other things in your program. In the case of ASREAD,the ATTYPE variable is assigned a value that corresponds to the type of keyboardresponse that you give to acknowledge the picture. Your keyboard response could,for example, determine what operations the program performs next: the programwill show picture A next if you press a function key, or picture B if you press theEnter key.
Other GDDM routines also use variables that are assigned values by the program.Many GDDM functions have associated query routines that use theseprogram-assigned values. More information about individual query routines can befound in the next chapter.
Ending the Graphics Environment: FSINIT was used at the beginning of theprogram to initialize the graphics environment. The FSTERM routine is used to endthe environment.
��46� CALL GDDM ('FSTERM')
��47� END
Drawing a Simple Chart with Presentation Graphics RoutinesA Presentation Graphics chart-drawing program is basically a GDDM graphicsprogram that calls Presentation Graphics routines used for chart definition.Presentation Graphics routines are IBM-supplied subroutines that contain GDDMroutines. For example, a Presentation Graphics routine that draws a line chart cancontain several GSMOVE and GSLINE routines that you do not see being calledbecause the Presentation Graphics routine calls the GDDM routines internally.
| The line chart.| The line chart| shown here was| drawn by a| BASIC program| using GDDM| and Presentation| Graphics| routines.
| �|
| 35MM�536B1
| �| �
Chapter 2. API to graphics 2-11
Graphics API
The BASIC program to draw the line chart is:
���1� REM �������������������������������������������������������
���2� REM INITIALIZE
���3� REM �������������������������������������������������������
���4� CALL GDDM ('FSINIT') ! Initialize graphics
���5� INTEGER ATTYPE, ATTVAL, COUNT ! Declare integer variables
���6� OPTION BASE 1 ! Set array subscript base
���7� DIM AX(5) ! Set array dimensions
���8� MAT READ AX ! Read x-array data
���9� DATA 1, 2, 3, 4, 5
��1�� DIM AY(1�) ! Set array dimensions
��11� MAT READ AY ! Read y-array data
��12� DATA 5, 3, 5, 5, 11
��13� DATA 8, 13, 6, 1, 7
��14� REM �������������������������������������������������������
��15� REM DRAW CHART
��16� REM �������������������������������������������������������
��17� CALL GDDM ('CHPLOT',2,5,AX(),AY())
��18� ! Format chart with 2 lines, 5 data points per line,
��19� ! with data read from arrays AX and AY
��2�� REM �������������������������������������������������������
��21� REM DISPLAY CHART
��22� REM �������������������������������������������������������
��23� CALL GDDM ('ASREAD',ATTYPE,ATTVAL,COUNT) ! Send chart to device
��24� REM ��������������������������������������������������������
��25� REM END GRAPHICS
��26� REM ��������������������������������������������������������
��27� CALL GDDM ('FSTERM') ! End graphics
��28� END ! End BASIC program
Note: In addition to the programming conventions shown for the BASIC envelopeprogram, GDDM or Presentation Graphics programs that use arrays havethese conventions:
� The statement OPTION BASE 1 is used to specify the lowest subscriptfor array dimensions.
� If the array is an integer array, it must be declared by an INTEGERstatement.
� The size (number of elements) for each array must be specified with aDIM statement.
� Several methods exist for assigning data to the array. This programuses the MAT READ statement followed by DATA statements that holdthe array data to be read.
| For information on conventions for BASIC, COBOL/400, Pascal, PL/I, and RPG/400| programs, see the GDDM Programming Reference manual, and the examples in
Chapter 6, “Graphics Application Program Examples,” that show this program inthe other languages.
How the Program WorksInitializing the Graphics Environment: A Presentation Graphics program mustbe initialized like a GDDM one. FSINIT initializes the graphics environment. Datadeclarations must also occur if integer variables are used by the routines.
2-12 AS/400 GDDM Programming Guide
Graphics API
The Presentation Graphics line graph uses two arrays (the elements in these arraysare passed as data to the CHPLOT routine):
���5� INTEGER ATTYPE, ATTVAL, COUNT
���6� OPTION BASE 1
���7� DIM AX(5)
���8� MAT READ AX
���9� DATA 1, 2, 3, 4, 5
��1�� DIM AY(1�)
��11� MAT READ AY
��12� DATA 5, 3, 5, 5, 11
��13� DATA 8, 13, 6, 1, 7
Drawing the Chart: After initialization, the chart is drawn (plotted) by the CHPLOTroutine. CHPLOT uses values that specify the components (the number of linesbeing charted that represent data), the count (the number of data points in eachline that represent data), and the data (in this case, the names of the arrays thatcontain the data).
��17� CALL GDDM ('CHPLOT',2,5,AX(),AY())
Reference lines are used on a chart so that you can interpret that data shown.
The vertical and horizontal reference lines on a chart are called axes. Usuallythe x axis is horizontal and the y axis vertical.
The x axis usually shows the independent variable. The independent variable isan array of values that are independent of the y axis values. A commonindependent variable is time (minutes, days, weeks, months).
The y axis usually shows the dependent variable. The dependent variable is anarray of values that correspond to the independent variable array.
For example:
If the independent variable is hours of the day ( 1 through 24), the dependentvariable could be a temperature reading taken each hour. So that you couldsee that at 10:00 the temperature was 67 degrees F.
In this case, the value of the y variable (temperature) depends on thecorresponding x variable (hour).
Displaying the Chart: The output from the Presentation Graphics program is sentto the display device with the GDDM routine ASREAD.
��23� CALL GDDM ('ASREAD',ATTYPE,ATTVAL,COUNT)
Terminating the Graphics Environment: FSTERM terminates the graphicsenvironment as it did in the sample GDDM program.
��27� CALL GDDM ('FSTERM')
��28� END
Chapter 2. API to graphics 2-13
Graphics API
The Syntax of Routines
Parameters that Supply Values to the ProgramAs you can see from the sample programs, both GDDM and Presentation Graphicsuse routines to perform graphics tasks. In many instances, the result of that taskdepends on the values of the routine’s parameters. For example, the GDDMroutine GSCOL used the integer number 2 for its parameter to set the current colorred.
The GSCOL routine has a single parameter:
GSCOL(color-code)
Some of the routines have parameter lists. The GSCHAR routine has a parameterlist:
GSCHAR(x,y,length,string)
The parameters in routines are always of a specific data type. Data types can be:
4-byte binary integer
Short floating point
Character string.
Some routines have a mixture of all three data types in their parameter list. InGSCHAR, for example, x and y are floating-point values, length is an integervalue, and string is a character string.
| Note: The manual GDDM Programming Reference shows the data types requiredfor each parameter value in the descriptions of the routines.
Parameters that Get Values from the ProgramSome routines have parameters that receive values from GDDM, rather thanpassing values to GDDM. These values are returned by the parameters. You canuse the values in returned parameters to do various things in your program. Forexample, you can use the type of keyboard response returned to the ASREADroutine to control which step of the program is performed next.
Like parameters that pass values to GDDM, parameters that receive values mustbe declared as variables of the correct data type.
Many routines that receive values from GDDM are query routines. Query routinesget current values from GDDM. For example, GSQCOL returns the current valueof the color attribute. You can use similar query routines to get the value of anattribute, or to discover device characteristics or picture dimensions.
The Names of the RoutinesGDDM routine names are 4- to 6-character mnemonics whose first two charactersare AS (input/output function), FS (program function), GS (graphic function), or DS(device function).
The other characters in the name represent the function of the routine (GSENDA,for example, is a routine that ends an area-fill). When the character Q follows thefirst two characters, the routine is a query function (GSQCOL, for example, sets anamed variable to the value of the current color attribute).
2-14 AS/400 GDDM Programming Guide
Graphics API
Presentation Graphics routine names have the same syntax as GDDM names,except that the first two characters of Presentation Graphics routine names arealways CH (chart), and no query functions are available with Presentation Graphicsroutines.
The Parts of a Typical ProgramYou probably saw similarities between the GDDM envelope program and thePresentation Graphics chart program shown earlier. Both of these programsfollowed the same steps:
1. Initialize graphics (with FSINIT) and declare variables.
2. Set attributes (the Presentation Graphics program did not).
3. Draw the picture (with calls to the appropriate routines).
4. Send the picture to be displayed (with ASREAD, in this case).
5. End graphics (with FSTERM).
The following chapters show you most of the functions of GDDM and PresentationGraphics routines. You should set up a program with the steps shown so that asyou learn about the routines you can experiment with them by inserting them intostep 3 of the preceding list of steps. (If you use Pascal, PL/I or any of the graphicssymbol sets described later, you will need the QGDDM library in your library list.)
Summary of This Chapter| GDDM and Presentation Graphics programs can be written in BASIC, COBOL/400,
Pascal, PL/I, and RPG/400 programming languages; the sample programs shownin this chapter were written in BASIC. They were designed to show you some ofthe concepts of GDDM and Presentation Graphics programs, their similarities anddifferences.
Programs that are much more complex are possible, of course. Here are someideas for using GDDM and Presentation Graphics routines:
| Programs that use data values from database files. Application programs that| use Presentation Graphics routines can be written to access database files and| produce business charts based on the data in the files. (The simple line chart| you saw earlier could have used data the program read from a database file.)
Programs that prompt for information. GDDM programs can be written that useDDS display files to allow responses to menus that feature graphics. Thevalues entered from the display can then be used to update a file or to providevalues for a Presentation Graphics chart.
Programs that show many pictures, one after another. Programs can bewritten that use the type of keyboard response to control which picture isshown next.
Programs that show many pictures at the same time. Presentation Graphicsprograms can be written that show more than one chart at a time, and GDDMhas routines that define the divisions of the screen and the amount of displayscreen space allocated to the picture. For example, one picture could showfour reduced-size charts using the same or different data. Also, you can designa company logo with GDDM and add a reduced or enlarged-size version of it tobusiness charts or other pictures.
Chapter 2. API to graphics 2-15
Graphics API
Programs that use dynamic variables. The variables in a GDDM orPresentation Graphics program can be defined and their values passed to theGDDM and Presentation Graphics routines. The values of those variables can
| be altered by user responses from the keyboard or by the values of data in| database files. For example, data that indicates profit could be represented on
a chart in green while loss values are shown in red. (Values less than n areconsidered loss, so the program would change the color attribute to red.)
You will find more ideas for uses of GDDM and Presentation Graphics applicationprograms in other chapters of this manual.
Note: Because of the power and the extent of the function available with OS/400Graphics, complex graphics programs may take longer to run than some ofyour other application programs. When you call one of these programs, theprocessing time required is evident by the length of time the input inhibitedlight on the device remains on. For more powerful models of the AS/400System, graphics processing takes considerably less time.
In the next chapter, you will learn about the GDDM routines. GDDM routines areversatile and varied and you will see how the routines can work for you. (It ispossible to skip to Chapter 4, “Using Presentation Graphics,” but to gain acomplete understanding of OS/400 Graphics, you should read the chapters insequence.)
2-16 AS/400 GDDM Programming Guide
Using GDDM
Chapter 3. Using GDDM
In Chapter 2, “The Application Program Interface to Graphics,” you learned thathigh-level language application programs can call GDDM routines to performgraphics functions.
You can use GDDM routines in programs (called graphics application programs) todraw pictures. You can add graphics to existing programs to enhance the usabilityof display screens, or you can write new application programs that make use of theimpact and visual appeal of color graphics for such things as management reportsand presentations. This chapter and Chapter 6, “Graphics Application ProgramExamples” show you pictures generated by GDDM and may give you some ideasfor uses of graphics application programs.
Some GDDM routines assign attributes that other GDDM routines use when theyare called. Other routines perform some sort of specific action, such as drawing aline or controlling some aspect of the graphics environment.
The first part of this chapter looks at the basic elements of pictures you can draw,as well as the routines you use to draw them and the attributes you can assignthem (to make them look the way you want them to look). You can use thesebasic elements as parts of a more complex picture. (The basic elements you usefor drawing pictures are called primitives.)
The second part of this chapter deals with GDDM control routines. You can usethese routines to handle things in the graphics environment such as picturedimensions and the devices you use.
The third part of this chapter describes support for the graphics data format file.The graphics data format (GDF) file is the output of a graphics program that theAS/400 System uses to build the data stream it sends to a device. The deviceinterprets the data stream and generates the picture. GDDM routines enable you
| to retrieve the graphics data, which you can then save in a database file or send to| another system.
The last part of this chapter is a summary of the information presented aboutGDDM.
The information that follows describes the functions of the GDDM routines.Routines use integer values, floating-point values, or character values for theirparameters; values that you can assign in your program. For a more detailed
| explanation of each routine, refer to the GDDM Programming Reference manual,which shows the syntax of each routine, and shows the data types that need to bedeclared for each routine parameter.
Copyright IBM Corp. 1991 3-1
Drawing Pictures
Drawing PicturesIn Chapter 2, “The Application Program Interface to Graphics,” you learned thatyou can specify the characteristics (such as color) for basic elements (such as linesand characters) of a picture. Those characteristics were called attributes. Thebasic elements of a drawing are called primitives.
Graphic Primitives and Their Attributes| Graphic primitives are the basic items of all OS/400 Graphics pictures. They can
be:
Lines Area-fills Image symbols Graphics symbols Markers.
Each type of primitive has specific attributes that can be assigned to it. In mostinstances, these attributes determine the way one type of primitive looks, but haveno effect on any other type of primitive. For example, line type and line widthattributes that make lines look the way they do have no effect on characters(graphics symbols).
When you specify an attribute for a primitive, every similar primitive is shown withthat attribute until you specify a different attribute. This is called the current modeof the attribute. For example, if heavy line is the current mode for the line widthattribute, every line drawn is heavy until the current mode is changed to light line.
The only attribute that affects all types of primitive is the color attribute, which isdiscussed next. (All other types of attribute are discussed with their associatedprimitives.)
Setting Color AttributesThere are two types of color attribute you can specify:
Color selection Color mixing
The color selection attribute determines the color of everything drawn in theprogram until another color is selected. The color mixing attribute determines whathappens when primitives of different colors overlap.
| Selecting a ColorYou may recall that the colors for different parts of the envelope picture inChapter 2, “The Application Program Interface to Graphics” were set by calling theGSCOL routine, which used an integer representing a specific color. This integer isthe code for the color.
3-2 AS/400 GDDM Programming Guide
Drawing Pictures
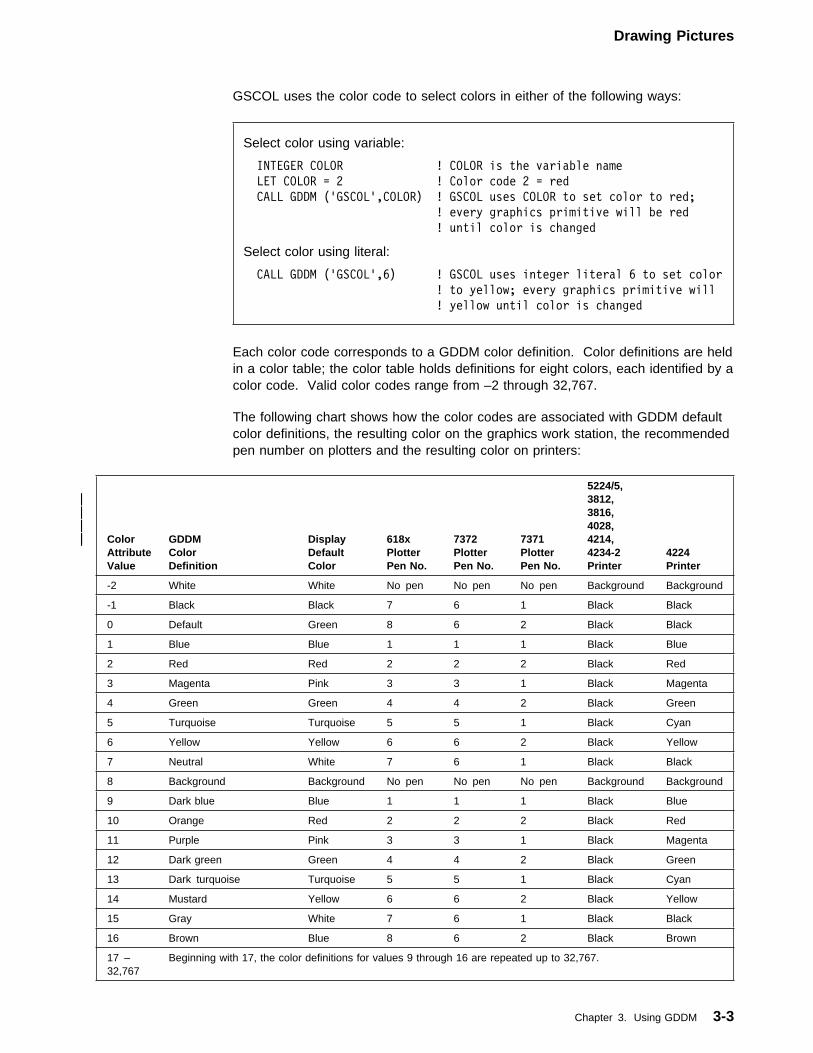
GSCOL uses the color code to select colors in either of the following ways:
Select color using variable:
INTEGER COLOR ! COLOR is the variable name
LET COLOR = 2 ! Color code 2 = red
CALL GDDM ('GSCOL',COLOR) ! GSCOL uses COLOR to set color to red;
! every graphics primitive will be red
! until color is changed
Select color using literal:
CALL GDDM ('GSCOL',6) ! GSCOL uses integer literal 6 to set color
! to yellow; every graphics primitive will
! yellow until color is changed
Each color code corresponds to a GDDM color definition. Color definitions are heldin a color table; the color table holds definitions for eight colors, each identified by acolor code. Valid color codes range from –2 through 32,767.
The following chart shows how the color codes are associated with GDDM defaultcolor definitions, the resulting color on the graphics work station, the recommendedpen number on plotters and the resulting color on printers:
ColorAttributeValue
GDDMColorDefinition
DisplayDefaultColor
| 618xPlotterPen No.
7372PlotterPen No.
7371PlotterPen No.
5224/5,| 3812,| 3816,| 4028,| 4214,
4234-2Printer
4224Printer
-2 White White No pen No pen No pen Background Background
-1 Black Black 7 6 1 Black Black
0 Default Green 8 6 2 Black Black
1 Blue Blue 1 1 1 Black Blue
2 Red Red 2 2 2 Black Red
3 Magenta Pink 3 3 1 Black Magenta
4 Green Green 4 4 2 Black Green
5 Turquoise Turquoise 5 5 1 Black Cyan
6 Yellow Yellow 6 6 2 Black Yellow
7 Neutral White 7 6 1 Black Black
8 Background Background No pen No pen No pen Background Background
9 Dark blue Blue 1 1 1 Black Blue
10 Orange Red 2 2 2 Black Red
11 Purple Pink 3 3 1 Black Magenta
12 Dark green Green 4 4 2 Black Green
13 Dark turquoise Turquoise 5 5 1 Black Cyan
14 Mustard Yellow 6 6 2 Black Yellow
15 Gray White 7 6 1 Black Black
16 Brown Blue 8 6 2 Black Brown
17 –32,767
Beginning with 17, the color definitions for values 9 through 16 are repeated up to 32,767.
Chapter 3. Using GDDM 3-3
Drawing Pictures
As an example, when your program uses GSCOL to select color code 6 from thedefault color table, GDDM uses yellow, which shows up as yellow on the display.The plotter, however, uses whatever color pen is in position 6 on the plotter. Withthe plotter, you can load the pens in any order so that color code 6 could produceany color.
This default color table is easy to use because the colors are the same each timeyou initialize graphics. For special applications, however, you can define your owncolor tables for the graphics work station. With your own color table, you canchoose eight colors from the total number of colors that are available for yourgraphics work station. The colors can be assigned to the color codes in anysequence.
Each picture constructed by a GDDM program and shown on the graphics workstation can use a maximum of eight colors; one program can produce manypictures, each using a different set of eight colors, but only eight colors can beused in each picture.
Seven colors out of the eight can be changed using the color table, but the eighth,black, cannot be changed.
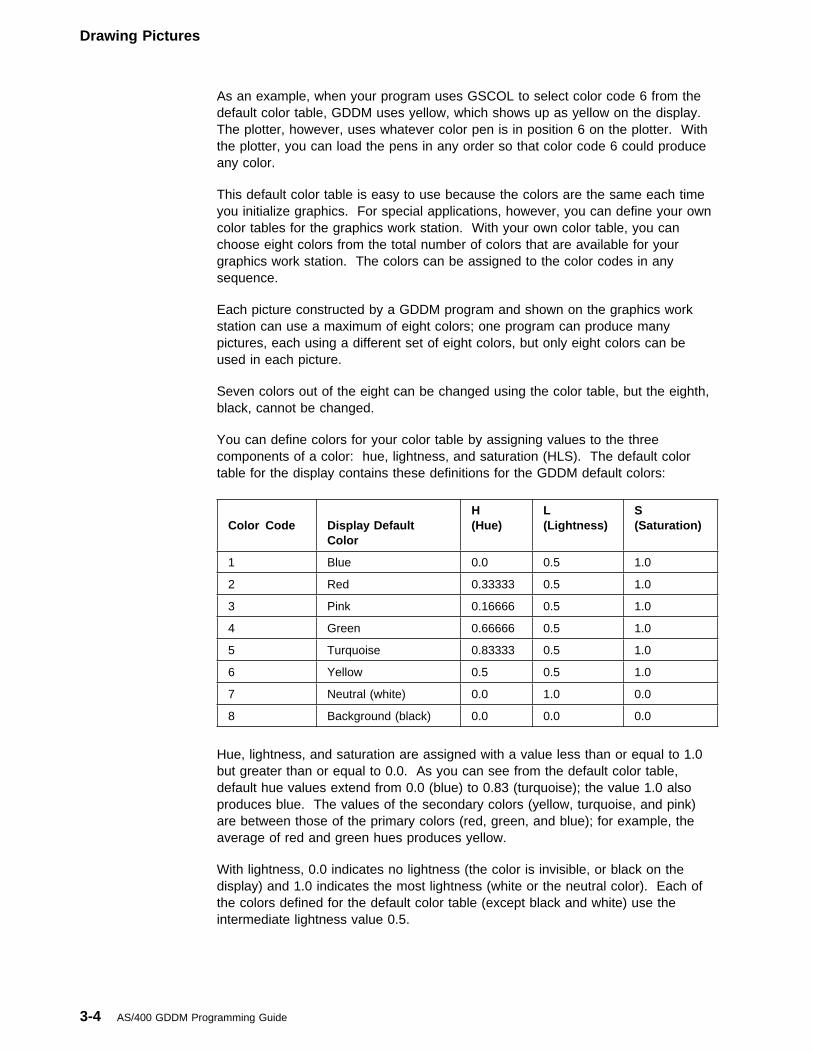
You can define colors for your color table by assigning values to the threecomponents of a color: hue, lightness, and saturation (HLS). The default colortable for the display contains these definitions for the GDDM default colors:
Hue, lightness, and saturation are assigned with a value less than or equal to 1.0but greater than or equal to 0.0. As you can see from the default color table,default hue values extend from 0.0 (blue) to 0.83 (turquoise); the value 1.0 alsoproduces blue. The values of the secondary colors (yellow, turquoise, and pink)are between those of the primary colors (red, green, and blue); for example, theaverage of red and green hues produces yellow.
With lightness, 0.0 indicates no lightness (the color is invisible, or black on thedisplay) and 1.0 indicates the most lightness (white or the neutral color). Each ofthe colors defined for the default color table (except black and white) use theintermediate lightness value 0.5.
Color Code
Display DefaultColor
H(Hue)
L(Lightness)
S(Saturation)
1 Blue 0.0 0.5 1.0
2 Red 0.33333 0.5 1.0
3 Pink 0.16666 0.5 1.0
4 Green 0.66666 0.5 1.0
5 Turquoise 0.83333 0.5 1.0
6 Yellow 0.5 0.5 1.0
7 Neutral (white) 0.0 1.0 0.0
8 Background (black) 0.0 0.0 0.0
3-4 AS/400 GDDM Programming Guide
Drawing Pictures
With saturation, 0.0 indicates no saturation and 1.0 indicates maximum saturation.The saturation of a color is a measure of how much the color is diluted by white; afully saturated color is at its brightest, while a color with no saturation is near gray.
The combination of the three HLS values defines color. The total number ofpossible colors as a result of HLS combinations depends on the type of graphicswork station that you are using.
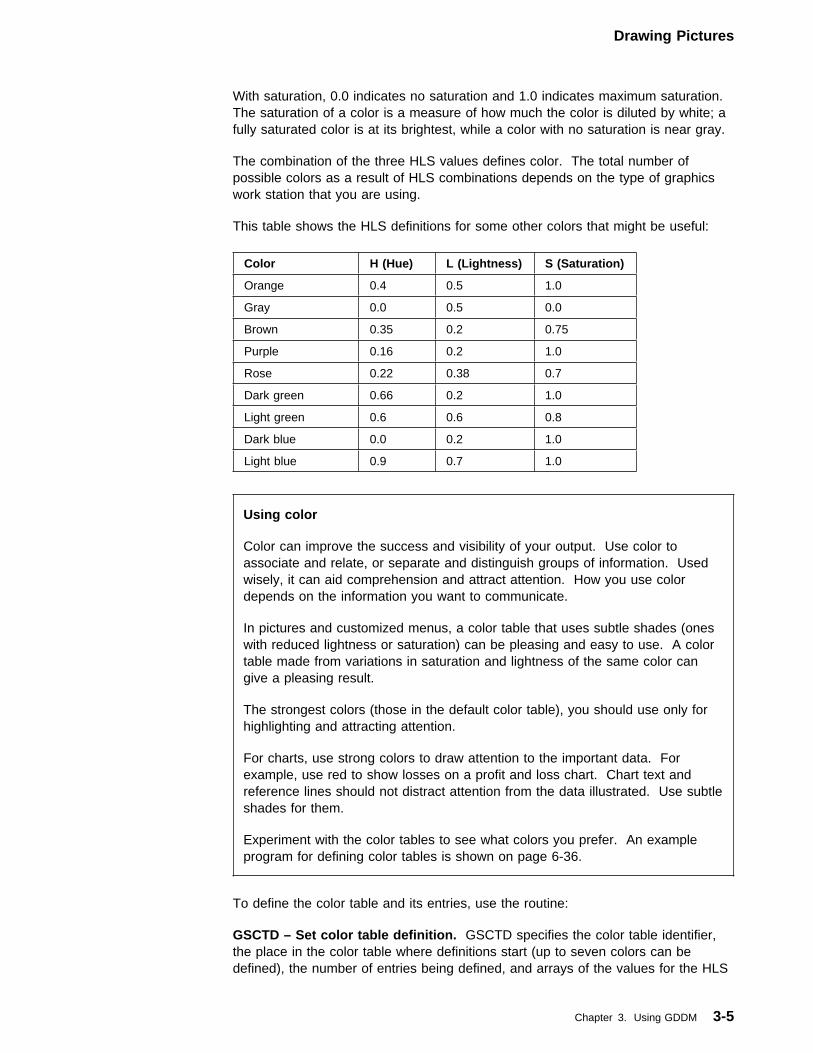
This table shows the HLS definitions for some other colors that might be useful:
Color H (Hue) L (Lightness) S (Saturation)
Orange 0.4 0.5 1.0
Gray 0.0 0.5 0.0
Brown 0.35 0.2 0.75
Purple 0.16 0.2 1.0
Rose 0.22 0.38 0.7
Dark green 0.66 0.2 1.0
Light green 0.6 0.6 0.8
Dark blue 0.0 0.2 1.0
Light blue 0.9 0.7 1.0
Using color
Color can improve the success and visibility of your output. Use color toassociate and relate, or separate and distinguish groups of information. Usedwisely, it can aid comprehension and attract attention. How you use colordepends on the information you want to communicate.
In pictures and customized menus, a color table that uses subtle shades (oneswith reduced lightness or saturation) can be pleasing and easy to use. A colortable made from variations in saturation and lightness of the same color cangive a pleasing result.
The strongest colors (those in the default color table), you should use only forhighlighting and attracting attention.
For charts, use strong colors to draw attention to the important data. Forexample, use red to show losses on a profit and loss chart. Chart text andreference lines should not distract attention from the data illustrated. Use subtleshades for them.
Experiment with the color tables to see what colors you prefer. An exampleprogram for defining color tables is shown on page 6-36.
To define the color table and its entries, use the routine:
GSCTD – Set color table definition. GSCTD specifies the color table identifier,the place in the color table where definitions start (up to seven colors can bedefined), the number of entries being defined, and arrays of the values for the HLS
Chapter 3. Using GDDM 3-5
Drawing Pictures
components. Selecting a color code in your program that has not been defined in acolor table results in the default color value.
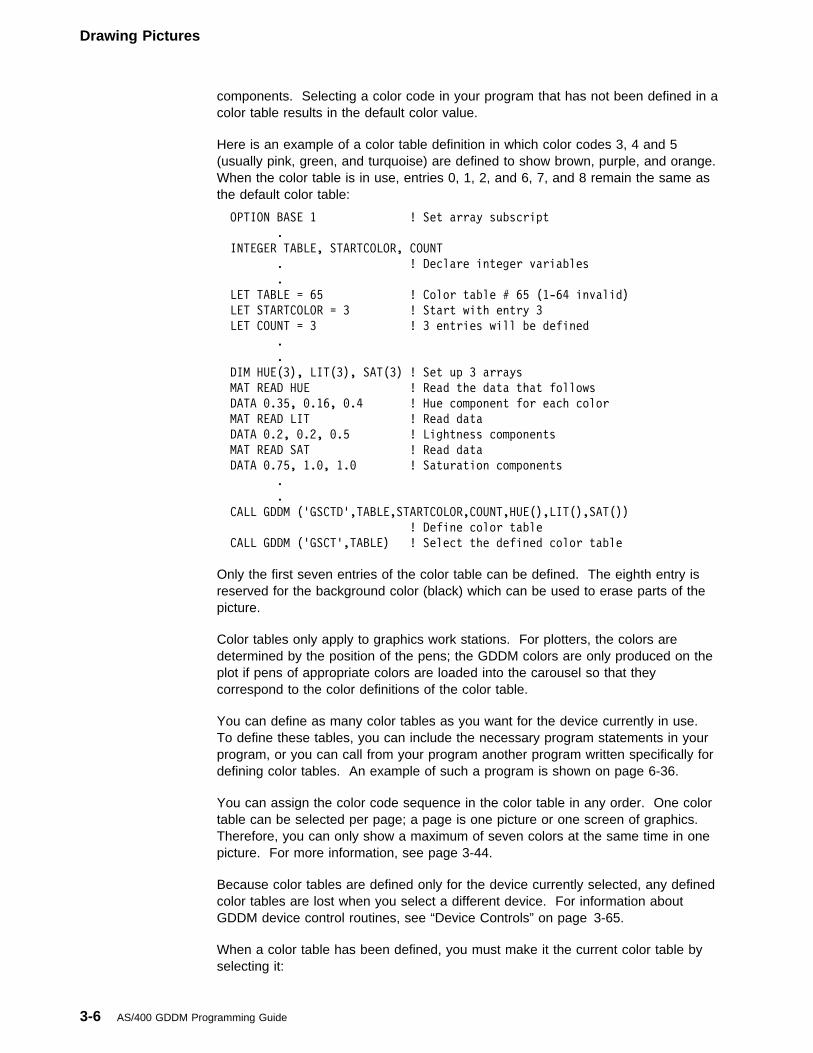
Here is an example of a color table definition in which color codes 3, 4 and 5(usually pink, green, and turquoise) are defined to show brown, purple, and orange.When the color table is in use, entries 0, 1, 2, and 6, 7, and 8 remain the same asthe default color table:
OPTION BASE 1 ! Set array subscript
.
INTEGER TABLE, STARTCOLOR, COUNT
. ! Declare integer variables
.
LET TABLE = 65 ! Color table # 65 (1-64 invalid)
LET STARTCOLOR = 3 ! Start with entry 3
LET COUNT = 3 ! 3 entries will be defined
.
.
DIM HUE(3), LIT(3), SAT(3) ! Set up 3 arrays
MAT READ HUE ! Read the data that follows
DATA �.35, �.16, �.4 ! Hue component for each color
MAT READ LIT ! Read data
DATA �.2, �.2, �.5 ! Lightness components
MAT READ SAT ! Read data
DATA �.75, 1.�, 1.� ! Saturation components
.
.
CALL GDDM ('GSCTD',TABLE,STARTCOLOR,COUNT,HUE(),LIT(),SAT())
! Define color table
CALL GDDM ('GSCT',TABLE) ! Select the defined color table
Only the first seven entries of the color table can be defined. The eighth entry isreserved for the background color (black) which can be used to erase parts of thepicture.
Color tables only apply to graphics work stations. For plotters, the colors aredetermined by the position of the pens; the GDDM colors are only produced on theplot if pens of appropriate colors are loaded into the carousel so that theycorrespond to the color definitions of the color table.
You can define as many color tables as you want for the device currently in use.To define these tables, you can include the necessary program statements in yourprogram, or you can call from your program another program written specifically fordefining color tables. An example of such a program is shown on page 6-36.
You can assign the color code sequence in the color table in any order. One colortable can be selected per page; a page is one picture or one screen of graphics.Therefore, you can only show a maximum of seven colors at the same time in onepicture. For more information, see page 3-44.
Because color tables are defined only for the device currently selected, any definedcolor tables are lost when you select a different device. For information aboutGDDM device control routines, see “Device Controls” on page 3-65.
When a color table has been defined, you must make it the current color table byselecting it:
3-6 AS/400 GDDM Programming Guide
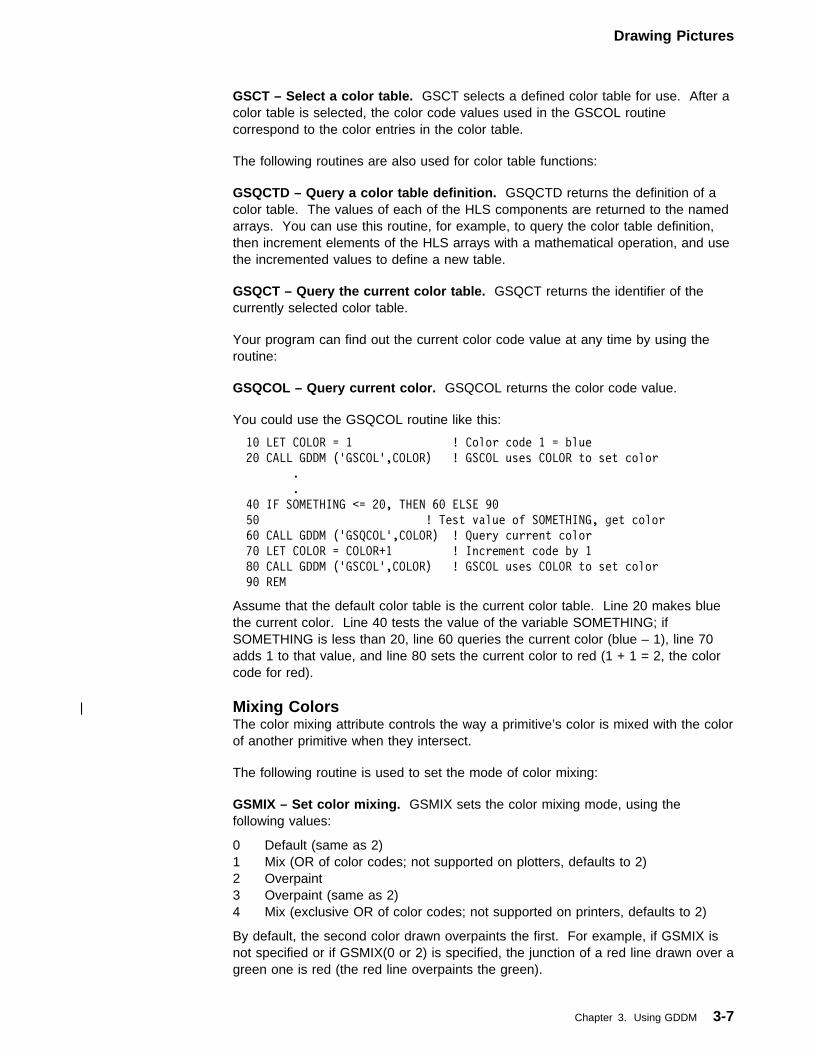
Drawing Pictures
GSCT – Select a color table. GSCT selects a defined color table for use. After acolor table is selected, the color code values used in the GSCOL routinecorrespond to the color entries in the color table.
The following routines are also used for color table functions:
GSQCTD – Query a color table definition. GSQCTD returns the definition of acolor table. The values of each of the HLS components are returned to the namedarrays. You can use this routine, for example, to query the color table definition,then increment elements of the HLS arrays with a mathematical operation, and usethe incremented values to define a new table.
GSQCT – Query the current color table. GSQCT returns the identifier of thecurrently selected color table.
Your program can find out the current color code value at any time by using theroutine:
GSQCOL – Query current color. GSQCOL returns the color code value.
You could use the GSQCOL routine like this:
1� LET COLOR = 1 ! Color code 1 = blue
2� CALL GDDM ('GSCOL',COLOR) ! GSCOL uses COLOR to set color
.
.
4� IF SOMETHING <= 2�, THEN 6� ELSE 9�
5� ! Test value of SOMETHING, get color
6� CALL GDDM ('GSQCOL',COLOR) ! Query current color
7� LET COLOR = COLOR+1 ! Increment code by 1
8� CALL GDDM ('GSCOL',COLOR) ! GSCOL uses COLOR to set color
9� REM
Assume that the default color table is the current color table. Line 20 makes bluethe current color. Line 40 tests the value of the variable SOMETHING; ifSOMETHING is less than 20, line 60 queries the current color (blue – 1), line 70adds 1 to that value, and line 80 sets the current color to red (1 + 1 = 2, the colorcode for red).
| Mixing ColorsThe color mixing attribute controls the way a primitive’s color is mixed with the colorof another primitive when they intersect.
The following routine is used to set the mode of color mixing:
GSMIX – Set color mixing. GSMIX sets the color mixing mode, using thefollowing values:
0 Default (same as 2)1 Mix (OR of color codes; not supported on plotters, defaults to 2)2 Overpaint3 Overpaint (same as 2)4 Mix (exclusive OR of color codes; not supported on printers, defaults to 2)
By default, the second color drawn overpaints the first. For example, if GSMIX isnot specified or if GSMIX(0 or 2) is specified, the junction of a red line drawn over agreen one is red (the red line overpaints the green).
Chapter 3. Using GDDM 3-7
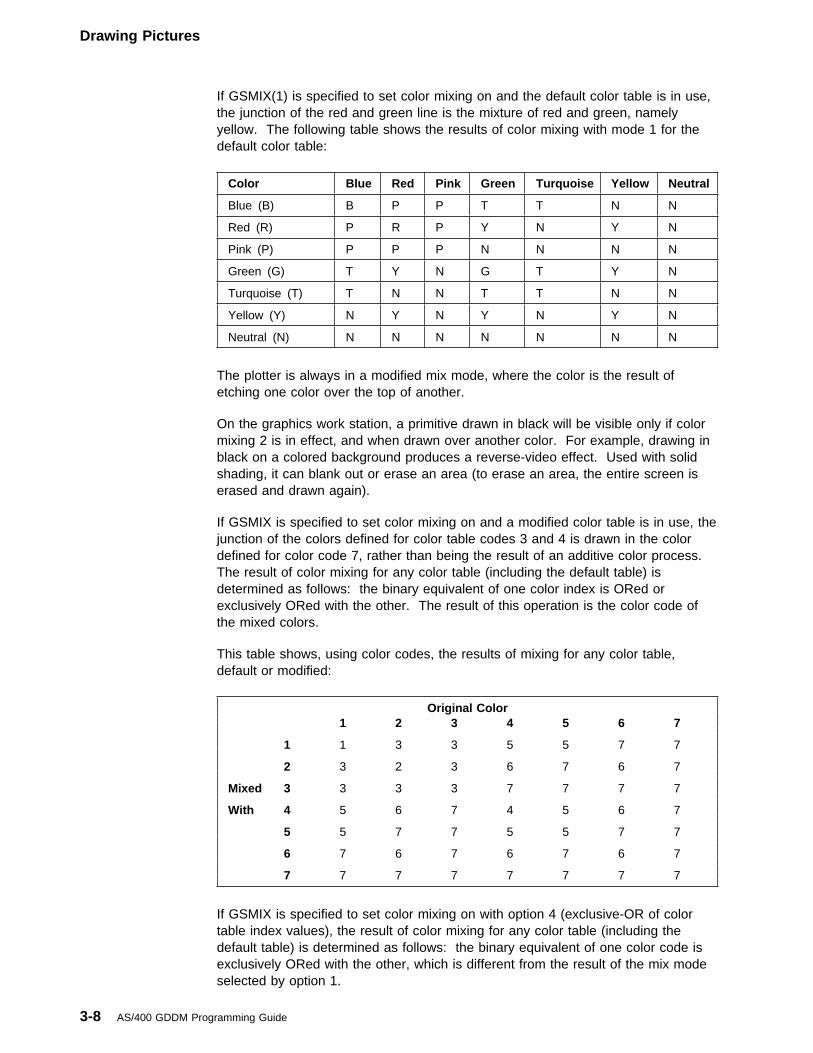
Drawing Pictures
If GSMIX(1) is specified to set color mixing on and the default color table is in use,the junction of the red and green line is the mixture of red and green, namelyyellow. The following table shows the results of color mixing with mode 1 for thedefault color table:
The plotter is always in a modified mix mode, where the color is the result ofetching one color over the top of another.
On the graphics work station, a primitive drawn in black will be visible only if colormixing 2 is in effect, and when drawn over another color. For example, drawing inblack on a colored background produces a reverse-video effect. Used with solidshading, it can blank out or erase an area (to erase an area, the entire screen iserased and drawn again).
If GSMIX is specified to set color mixing on and a modified color table is in use, thejunction of the colors defined for color table codes 3 and 4 is drawn in the colordefined for color code 7, rather than being the result of an additive color process.The result of color mixing for any color table (including the default table) isdetermined as follows: the binary equivalent of one color index is ORed orexclusively ORed with the other. The result of this operation is the color code ofthe mixed colors.
This table shows, using color codes, the results of mixing for any color table,default or modified:
If GSMIX is specified to set color mixing on with option 4 (exclusive-OR of colortable index values), the result of color mixing for any color table (including thedefault table) is determined as follows: the binary equivalent of one color code isexclusively ORed with the other, which is different from the result of the mix modeselected by option 1.
Color Blue Red Pink Green Turquoise Yellow Neutral
Blue (B) B P P T T N N
Red (R) P R P Y N Y N
Pink (P) P P P N N N N
Green (G) T Y N G T Y N
Turquoise (T) T N N T T N N
Yellow (Y) N Y N Y N Y N
Neutral (N) N N N N N N N
Original Color 1 2 3 4 5 6 7
1 1 3 3 5 5 7 7
2 3 2 3 6 7 6 7
Mixed 3 3 3 3 7 7 7 7
With 4 5 6 7 4 5 6 7
5 5 7 7 5 5 7 7
6 7 6 7 6 7 6 7
7 7 7 7 7 7 7 7
3-8 AS/400 GDDM Programming Guide
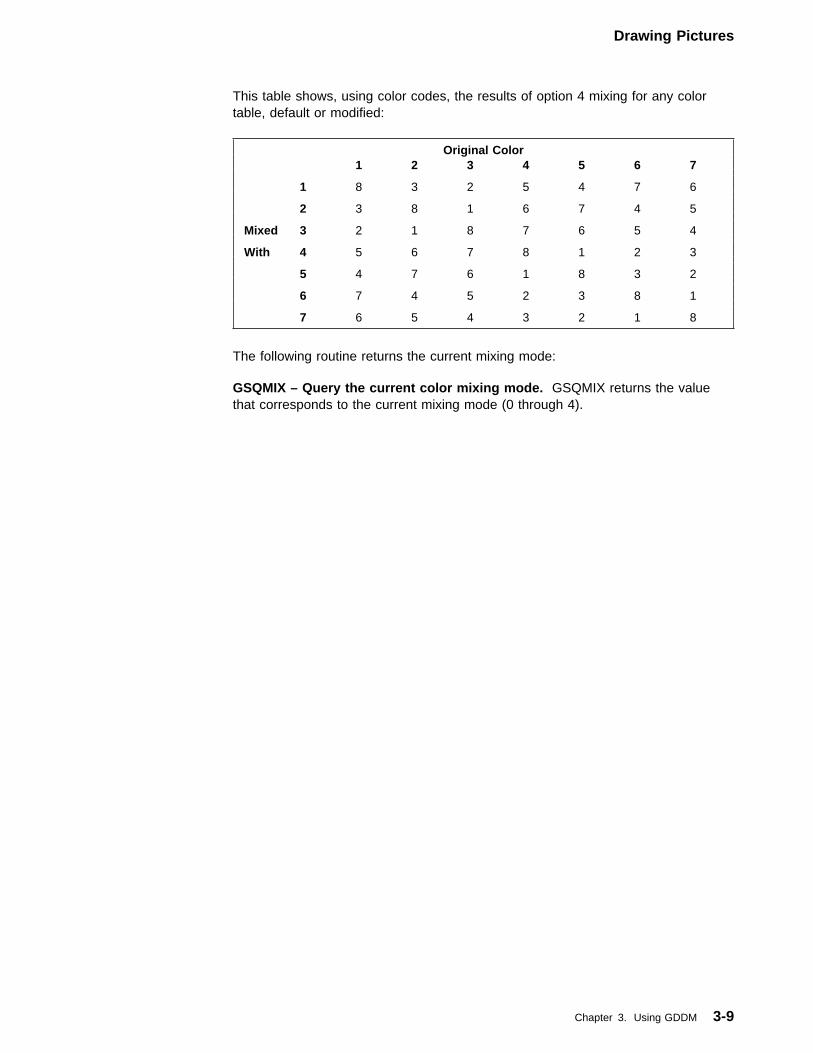
Drawing Pictures
This table shows, using color codes, the results of option 4 mixing for any colortable, default or modified:
The following routine returns the current mixing mode:
GSQMIX – Query the current color mixing mode. GSQMIX returns the valuethat corresponds to the current mixing mode (0 through 4).
Original Color 1 2 3 4 5 6 7
1 8 3 2 5 4 7 6
2 3 8 1 6 7 4 5
Mixed 3 2 1 8 7 6 5 4
With 4 5 6 7 8 1 2 3
5 4 7 6 1 8 3 2
6 7 4 5 2 3 8 1
7 6 5 4 3 2 1 8
Chapter 3. Using GDDM 3-9
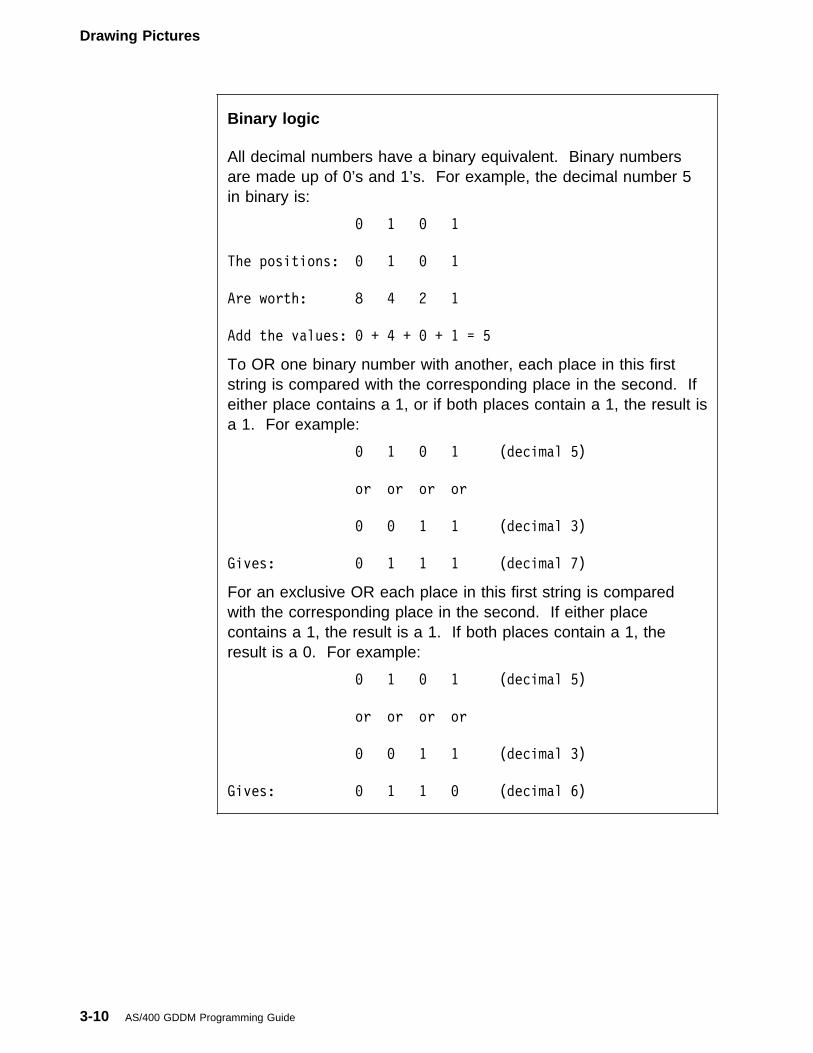
Drawing Pictures
Binary logic
All decimal numbers have a binary equivalent. Binary numbersare made up of 0’s and 1’s. For example, the decimal number 5in binary is:
� 1 � 1
The positions: � 1 � 1
Are worth: 8 4 2 1
Add the values: � + 4 + � + 1 = 5
To OR one binary number with another, each place in this firststring is compared with the corresponding place in the second. Ifeither place contains a 1, or if both places contain a 1, the result isa 1. For example:
� 1 � 1 (decimal 5)
or or or or
� � 1 1 (decimal 3)
Gives: � 1 1 1 (decimal 7)
For an exclusive OR each place in this first string is comparedwith the corresponding place in the second. If either placecontains a 1, the result is a 1. If both places contain a 1, theresult is a 0. For example:
� 1 � 1 (decimal 5)
or or or or
� � 1 1 (decimal 3)
Gives: � 1 1 � (decimal 6)
3-10 AS/400 GDDM Programming Guide
Drawing Pictures
The Current PositionBefore you start using GDDM routines to draw anything, you have to specify astarting point, which is called the current position. If you recall the envelopeprogram in Chapter 2, “The Application Program Interface to Graphics” the firstGDDM routine that used coordinates was the GSMOVE routine, which was used tospecify the starting point for the first line. When a line was drawn from the currentposition to new coordinates, the end point of the line became the new currentposition. To move the current position without drawing, GSMOVE was used again.GSMOVE usually has to be the first routine; otherwise the first thing you drawstarts at the lower left-hand corner.
| Setting the Current PositionYou can use the following routines for setting the current position:
GSMOVE – Set the current position. If no current position has been assigned byGSMOVE or another routine, the value used will be the smallest values of x and y.
Any of the drawing routines. Routines that draw primitives always leave thecurrent position at the end point of the primitive.
| Querying the Current PositionYou can use the following routine for querying the current position:
GSQCP – Query the current position. GSQCP returns the location of the currentposition, in x and y coordinates. A retrieved current position value can be passedto another GDDM routine. The following is an example:
CALL GDDM ('GSQCP',X,Y)
LET X=X+1�
CALL GDDM ('GSLINE',X,Y)
GSQCP places the x and y coordinate values into variables X and Y. A value of 10is added to X, then X and Y are used as values for GSLINE. The result is ahorizontal line (10 X-units long) positioned at Y.
| Querying the Cursor Position GSQCUR – Query the current cursor position. GSQCUR returns the location ofthe cursor position (in x and y coordinates) at the time of the most recent ASREAD.
An application program can use the values returned by GSQCUR for correlation ofthe position of the cursor with the x and y position of graphic items on the screen,or for option-selection by cursor position, rather than requiring the user of theprogram to key in the option name or number.
Chapter 3. Using GDDM 3-11
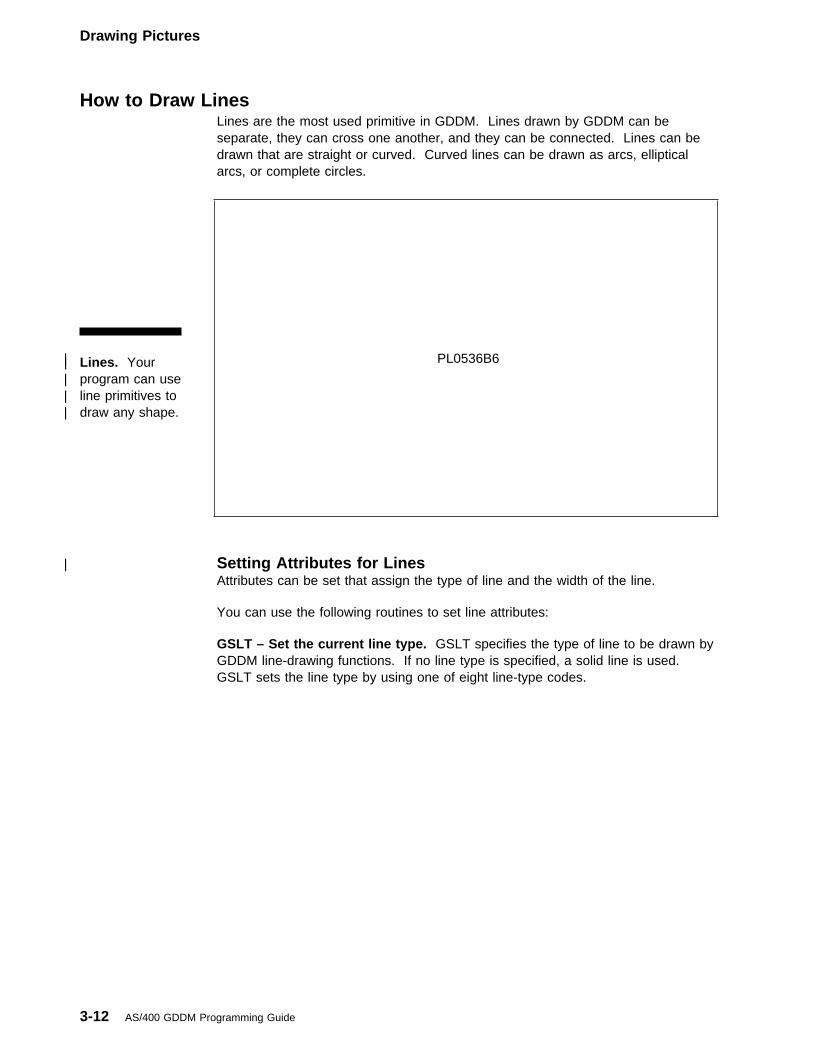
Drawing Pictures
How to Draw LinesLines are the most used primitive in GDDM. Lines drawn by GDDM can beseparate, they can cross one another, and they can be connected. Lines can bedrawn that are straight or curved. Curved lines can be drawn as arcs, ellipticalarcs, or complete circles.
| Lines. Your| program can use| line primitives to| draw any shape.
| PL0536B6
| Setting Attributes for LinesAttributes can be set that assign the type of line and the width of the line.
You can use the following routines to set line attributes:
GSLT – Set the current line type. GSLT specifies the type of line to be drawn byGDDM line-drawing functions. If no line type is specified, a solid line is used.GSLT sets the line type by using one of eight line-type codes.
3-12 AS/400 GDDM Programming Guide
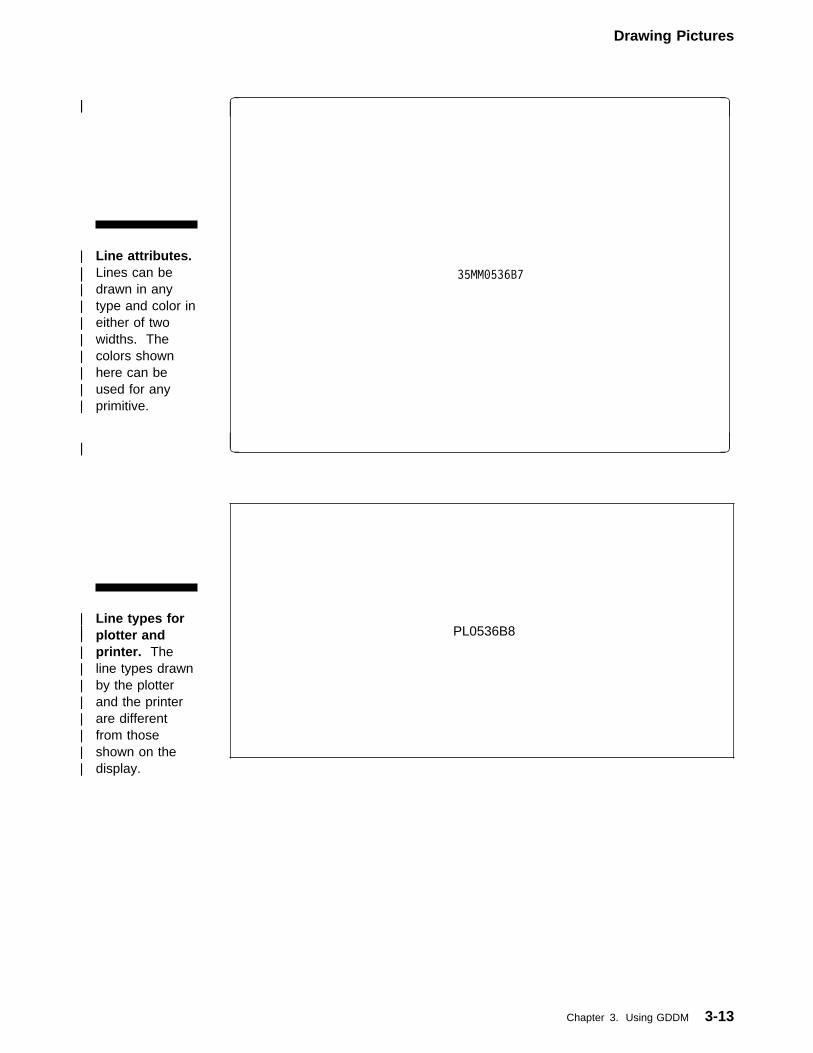
Drawing Pictures
| Line attributes.| Lines can be| drawn in any| type and color in| either of two| widths. The| colors shown| here can be| used for any| primitive.
| �|
| 35MM�536B7
| �| �
| Line types for| plotter and| printer. The| line types drawn| by the plotter| and the printer| are different| from those| shown on the| display.
| PL0536B8
Chapter 3. Using GDDM 3-13
Drawing Pictures
The following routines are also used for line primitives:
GSQLT – Query the current line type. GSQLT returns the value corresponding tothe current type of line and sets a variable to that value.
GSLW – Set the current line width. GSLW sets the width of the line to be drawnby GDDM line-drawing functions. There are two line widths: narrow (1) and wide(2). If no line width is specified, a narrow line width is used (GSLW(1)). For theplotter, this routine has no effect; you change the line width by using pens with alarger tip diameter.
Note: Wide lines are drawn slightly longer than narrow lines, so that junctions ofwide lines form perfect corners rather than notched corners. Therefore,lines drawn with very little open space between line end points might causethe lines to appear connected.
The IBM PC only supports line width 1.
GSQLW – Query the current line width. GSQLW returns the current line widthand sets the variable to that value.
GSFLW – Set the fractional line width. GSFLW specifies the width of the line tobe drawn by GDDM line-drawing functions. GSFLW performs the same function asGSLW, except that GSFLW uses a floating-point parameter instead of an integerparameter.
A line width multiplier of 1.0 represents the standard line width for the graphicswork station and for the printers. A fractional value of 0.0 through 1.0 draws anarrow line; a value of greater than 1 through 100 draws a wide line.
GSQFLW – Query the fractional line width. GSQFLW returns the current linewidth as a floating-point value.
| Drawing Straight Lines GSLINE – Draw a straight line. GSLINE draws a single straight line from thecurrent position to the end point specified by x and y.
GSPLNE – Draw a series of lines. GSPLNE draws a series of connected straightlines (a polyline) from the current position. GSPLNE performs many drawingoperations with one routine, and can therefore be more efficient than using a seriesof GSLINE routines.
3-14 AS/400 GDDM Programming Guide
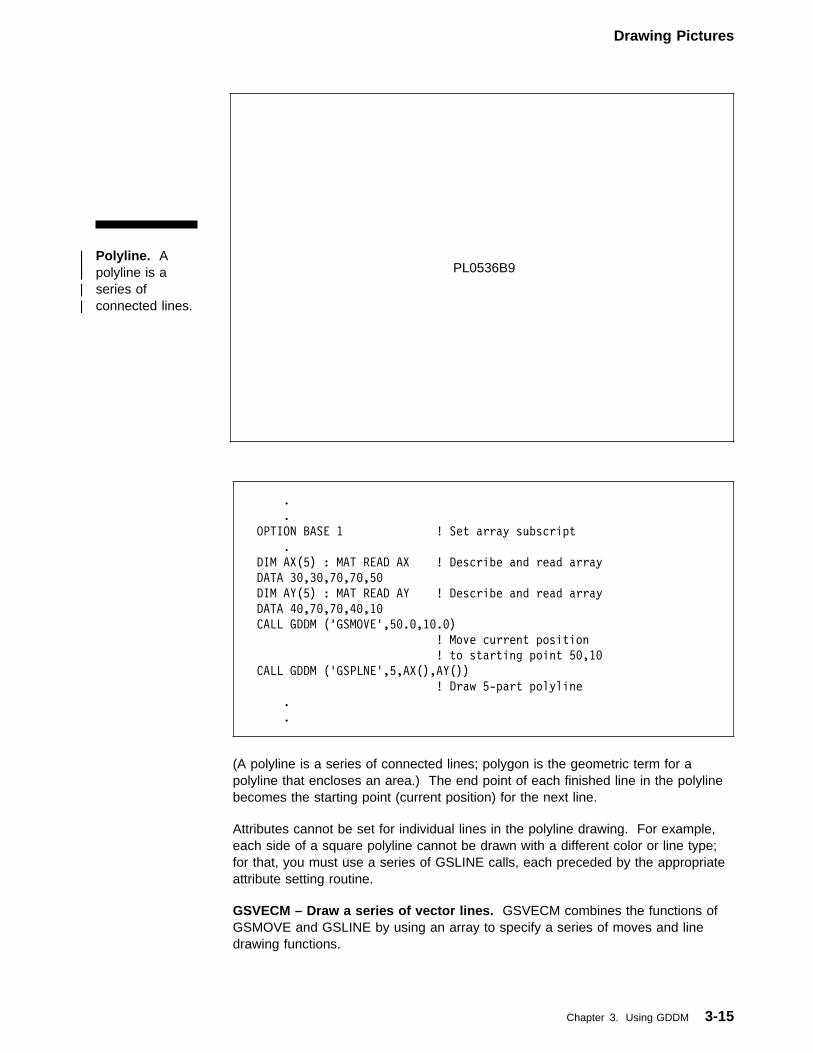
Drawing Pictures
| Polyline. A| polyline is a| series of| connected lines.
| PL0536B9
.
.
OPTION BASE 1 ! Set array subscript
.
DIM AX(5) : MAT READ AX ! Describe and read array
DATA 3�,3�,7�,7�,5�
DIM AY(5) : MAT READ AY ! Describe and read array
DATA 4�,7�,7�,4�,1�
CALL GDDM ('GSMOVE',5�.�,1�.�)
! Move current position
! to starting point 5�,1�
CALL GDDM ('GSPLNE',5,AX(),AY())
! Draw 5-part polyline
.
.
(A polyline is a series of connected lines; polygon is the geometric term for apolyline that encloses an area.) The end point of each finished line in the polylinebecomes the starting point (current position) for the next line.
Attributes cannot be set for individual lines in the polyline drawing. For example,each side of a square polyline cannot be drawn with a different color or line type;for that, you must use a series of GSLINE calls, each preceded by the appropriateattribute setting routine.
GSVECM – Draw a series of vector lines. GSVECM combines the functions ofGSMOVE and GSLINE by using an array to specify a series of moves and linedrawing functions.
Chapter 3. Using GDDM 3-15
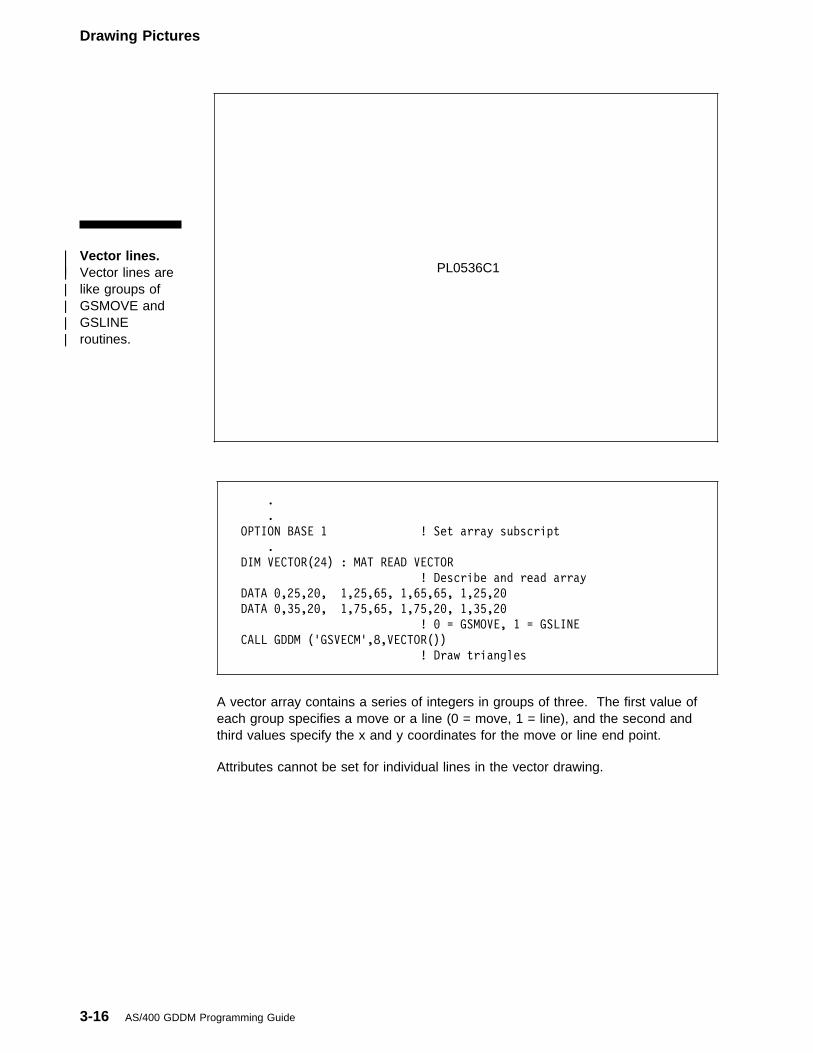
Drawing Pictures
| Vector lines.| Vector lines are| like groups of| GSMOVE and| GSLINE| routines.
| PL0536C1
.
.
OPTION BASE 1 ! Set array subscript
.
DIM VECTOR(24) : MAT READ VECTOR
! Describe and read array
DATA �,25,2�, 1,25,65, 1,65,65, 1,25,2�
DATA �,35,2�, 1,75,65, 1,75,2�, 1,35,2�
! � = GSMOVE, 1 = GSLINE
CALL GDDM ('GSVECM',8,VECTOR())
! Draw triangles
A vector array contains a series of integers in groups of three. The first value ofeach group specifies a move or a line (0 = move, 1 = line), and the second andthird values specify the x and y coordinates for the move or line end point.
Attributes cannot be set for individual lines in the vector drawing.
3-16 AS/400 GDDM Programming Guide
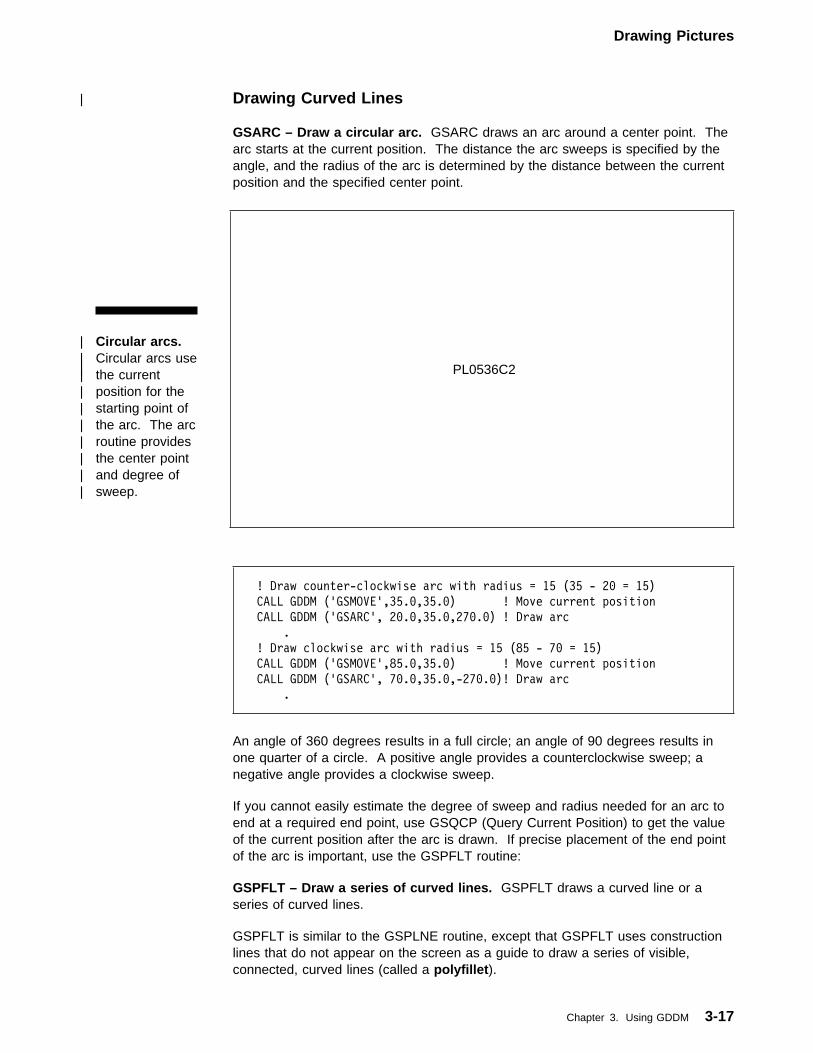
Drawing Pictures
| Drawing Curved Lines GSARC – Draw a circular arc. GSARC draws an arc around a center point. Thearc starts at the current position. The distance the arc sweeps is specified by theangle, and the radius of the arc is determined by the distance between the currentposition and the specified center point.
| Circular arcs.| Circular arcs use| the current| position for the| starting point of| the arc. The arc| routine provides| the center point| and degree of| sweep.
| PL0536C2
! Draw counter-clockwise arc with radius = 15 (35 - 2� = 15)
CALL GDDM ('GSMOVE',35.�,35.�) ! Move current position
CALL GDDM ('GSARC', 2�.�,35.�,27�.�) ! Draw arc
.
! Draw clockwise arc with radius = 15 (85 - 7� = 15)
CALL GDDM ('GSMOVE',85.�,35.�) ! Move current position
CALL GDDM ('GSARC', 7�.�,35.�,-27�.�)! Draw arc
.
An angle of 360 degrees results in a full circle; an angle of 90 degrees results inone quarter of a circle. A positive angle provides a counterclockwise sweep; anegative angle provides a clockwise sweep.
If you cannot easily estimate the degree of sweep and radius needed for an arc toend at a required end point, use GSQCP (Query Current Position) to get the valueof the current position after the arc is drawn. If precise placement of the end pointof the arc is important, use the GSPFLT routine:
GSPFLT – Draw a series of curved lines. GSPFLT draws a curved line or aseries of curved lines.
GSPFLT is similar to the GSPLNE routine, except that GSPFLT uses constructionlines that do not appear on the screen as a guide to draw a series of visible,connected, curved lines (called a polyfillet).
Chapter 3. Using GDDM 3-17
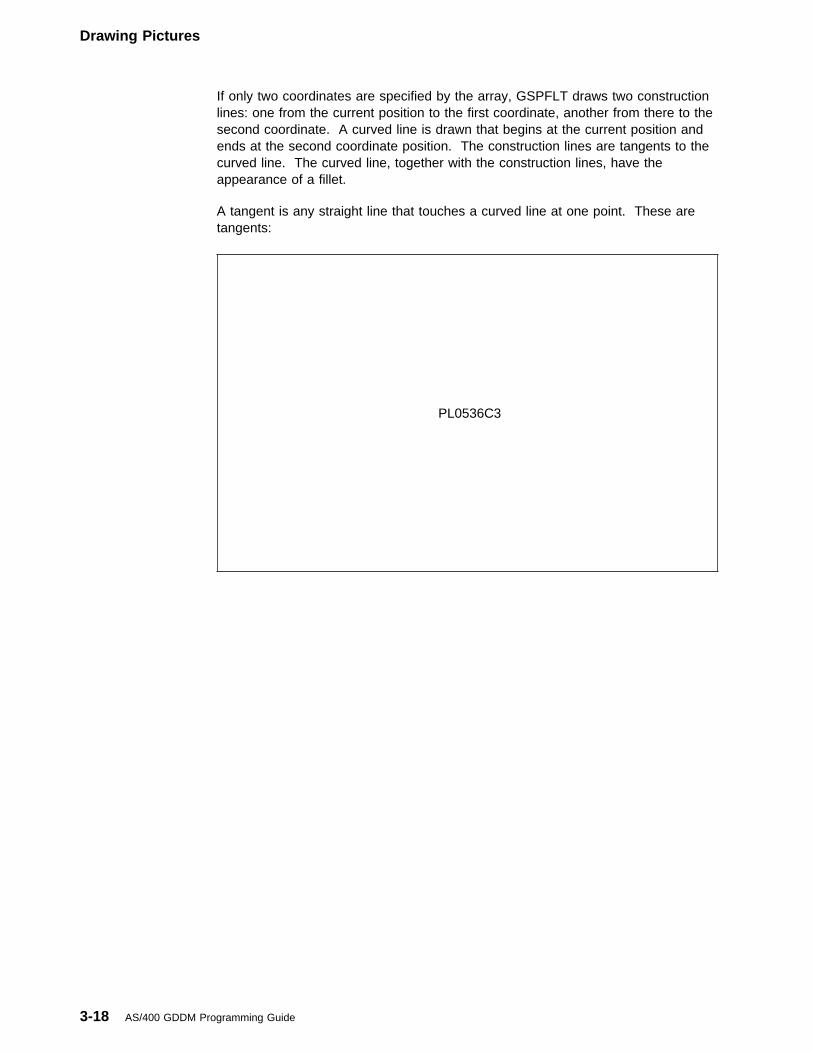
Drawing Pictures
If only two coordinates are specified by the array, GSPFLT draws two constructionlines: one from the current position to the first coordinate, another from there to thesecond coordinate. A curved line is drawn that begins at the current position andends at the second coordinate position. The construction lines are tangents to thecurved line. The curved line, together with the construction lines, have theappearance of a fillet.
A tangent is any straight line that touches a curved line at one point. These aretangents:
PL0536C3
3-18 AS/400 GDDM Programming Guide
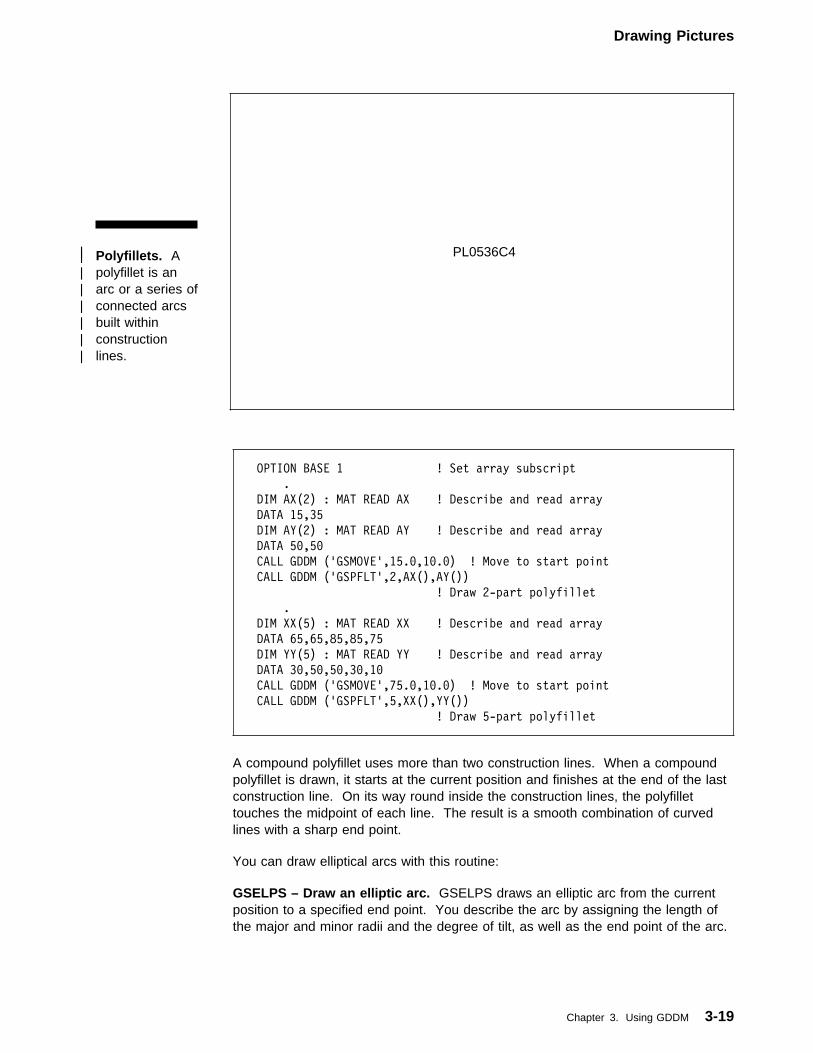
Drawing Pictures
| Polyfillets. A| polyfillet is an| arc or a series of| connected arcs| built within| construction| lines.
| PL0536C4
OPTION BASE 1 ! Set array subscript
.
DIM AX(2) : MAT READ AX ! Describe and read array
DATA 15,35
DIM AY(2) : MAT READ AY ! Describe and read array
DATA 5�,5�
CALL GDDM ('GSMOVE',15.�,1�.�) ! Move to start point
CALL GDDM ('GSPFLT',2,AX(),AY())
! Draw 2-part polyfillet
.
DIM XX(5) : MAT READ XX ! Describe and read array
DATA 65,65,85,85,75
DIM YY(5) : MAT READ YY ! Describe and read array
DATA 3�,5�,5�,3�,1�
CALL GDDM ('GSMOVE',75.�,1�.�) ! Move to start point
CALL GDDM ('GSPFLT',5,XX(),YY())
! Draw 5-part polyfillet
A compound polyfillet uses more than two construction lines. When a compoundpolyfillet is drawn, it starts at the current position and finishes at the end of the lastconstruction line. On its way round inside the construction lines, the polyfillettouches the midpoint of each line. The result is a smooth combination of curvedlines with a sharp end point.
You can draw elliptical arcs with this routine:
GSELPS – Draw an elliptic arc. GSELPS draws an elliptic arc from the currentposition to a specified end point. You describe the arc by assigning the length ofthe major and minor radii and the degree of tilt, as well as the end point of the arc.
Chapter 3. Using GDDM 3-19
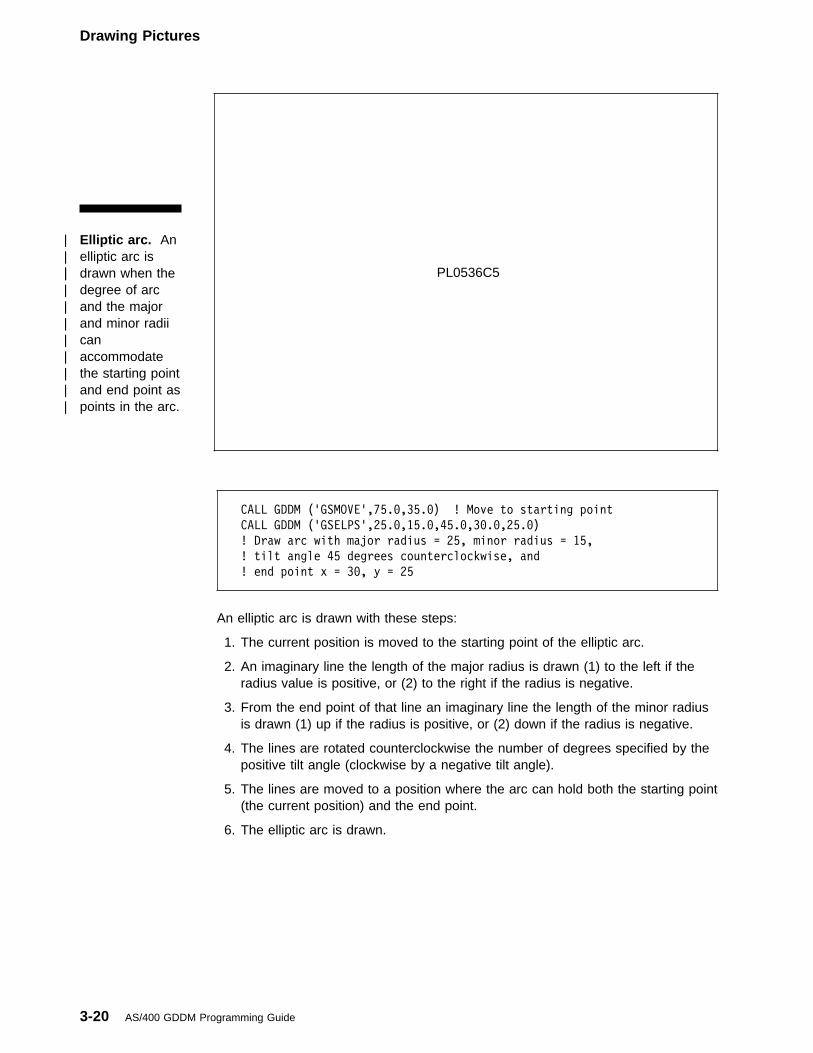
Drawing Pictures
| Elliptic arc. An| elliptic arc is| drawn when the| degree of arc| and the major| and minor radii| can| accommodate| the starting point| and end point as| points in the arc.
| PL0536C5
CALL GDDM ('GSMOVE',75.�,35.�) ! Move to starting point
CALL GDDM ('GSELPS',25.�,15.�,45.�,3�.�,25.�)
! Draw arc with major radius = 25, minor radius = 15,
! tilt angle 45 degrees counterclockwise, and
! end point x = 3�, y = 25
An elliptic arc is drawn with these steps:
1. The current position is moved to the starting point of the elliptic arc.
2. An imaginary line the length of the major radius is drawn (1) to the left if theradius value is positive, or (2) to the right if the radius is negative.
3. From the end point of that line an imaginary line the length of the minor radiusis drawn (1) up if the radius is positive, or (2) down if the radius is negative.
4. The lines are rotated counterclockwise the number of degrees specified by thepositive tilt angle (clockwise by a negative tilt angle).
5. The lines are moved to a position where the arc can hold both the starting point(the current position) and the end point.
6. The elliptic arc is drawn.
3-20 AS/400 GDDM Programming Guide
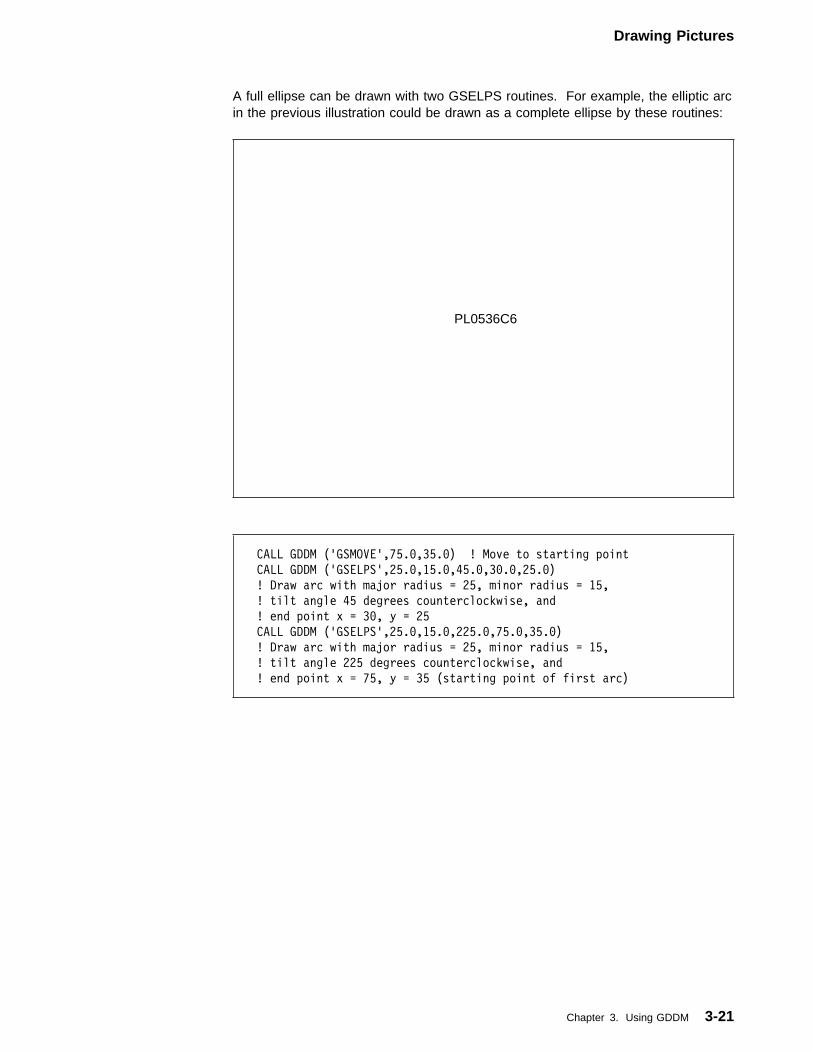
Drawing Pictures
A full ellipse can be drawn with two GSELPS routines. For example, the elliptic arcin the previous illustration could be drawn as a complete ellipse by these routines:
PL0536C6
CALL GDDM ('GSMOVE',75.�,35.�) ! Move to starting point
CALL GDDM ('GSELPS',25.�,15.�,45.�,3�.�,25.�)
! Draw arc with major radius = 25, minor radius = 15,
! tilt angle 45 degrees counterclockwise, and
! end point x = 3�, y = 25
CALL GDDM ('GSELPS',25.�,15.�,225.�,75.�,35.�)
! Draw arc with major radius = 25, minor radius = 15,
! tilt angle 225 degrees counterclockwise, and
! end point x = 75, y = 35 (starting point of first arc)
Chapter 3. Using GDDM 3-21
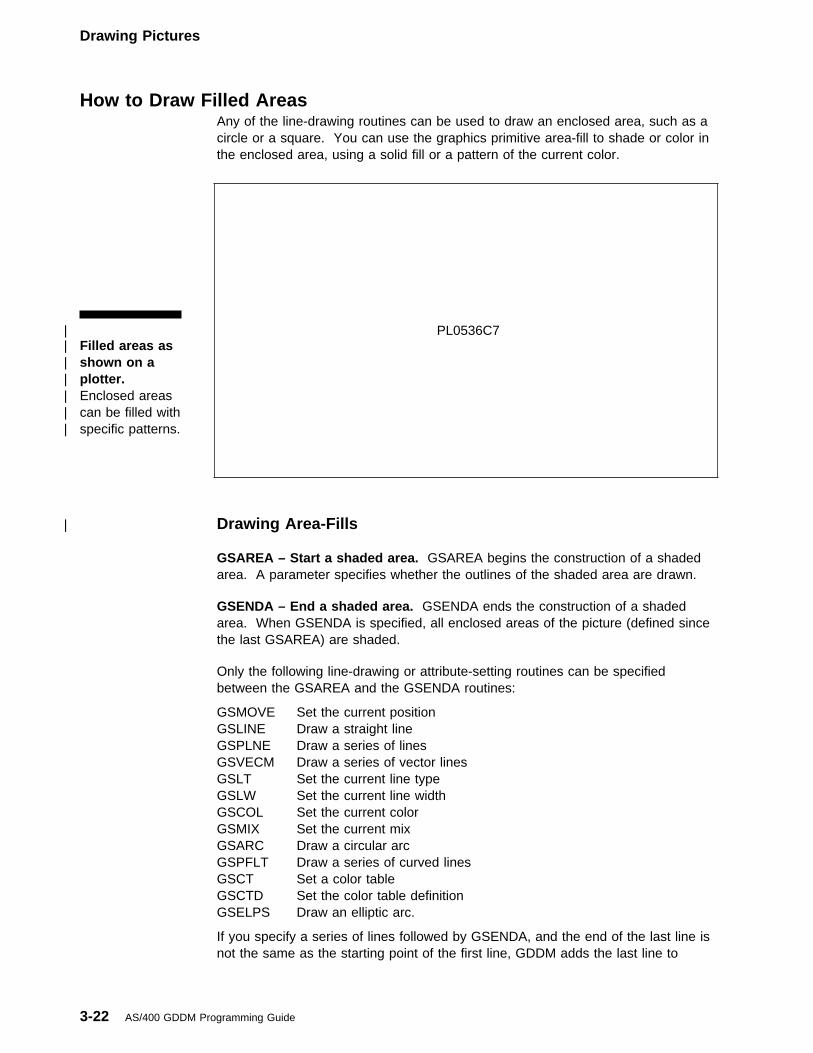
Drawing Pictures
How to Draw Filled AreasAny of the line-drawing routines can be used to draw an enclosed area, such as acircle or a square. You can use the graphics primitive area-fill to shade or color inthe enclosed area, using a solid fill or a pattern of the current color.
| Filled areas as| shown on a| plotter.| Enclosed areas| can be filled with| specific patterns.
| PL0536C7
| Drawing Area-Fills GSAREA – Start a shaded area. GSAREA begins the construction of a shadedarea. A parameter specifies whether the outlines of the shaded area are drawn.
GSENDA – End a shaded area. GSENDA ends the construction of a shadedarea. When GSENDA is specified, all enclosed areas of the picture (defined sincethe last GSAREA) are shaded.
Only the following line-drawing or attribute-setting routines can be specifiedbetween the GSAREA and the GSENDA routines:
GSMOVE Set the current positionGSLINE Draw a straight lineGSPLNE Draw a series of linesGSVECM Draw a series of vector linesGSLT Set the current line typeGSLW Set the current line widthGSCOL Set the current colorGSMIX Set the current mixGSARC Draw a circular arcGSPFLT Draw a series of curved linesGSCT Set a color tableGSCTD Set the color table definitionGSELPS Draw an elliptic arc.
If you specify a series of lines followed by GSENDA, and the end of the last line isnot the same as the starting point of the first line, GDDM adds the last line to
3-22 AS/400 GDDM Programming Guide
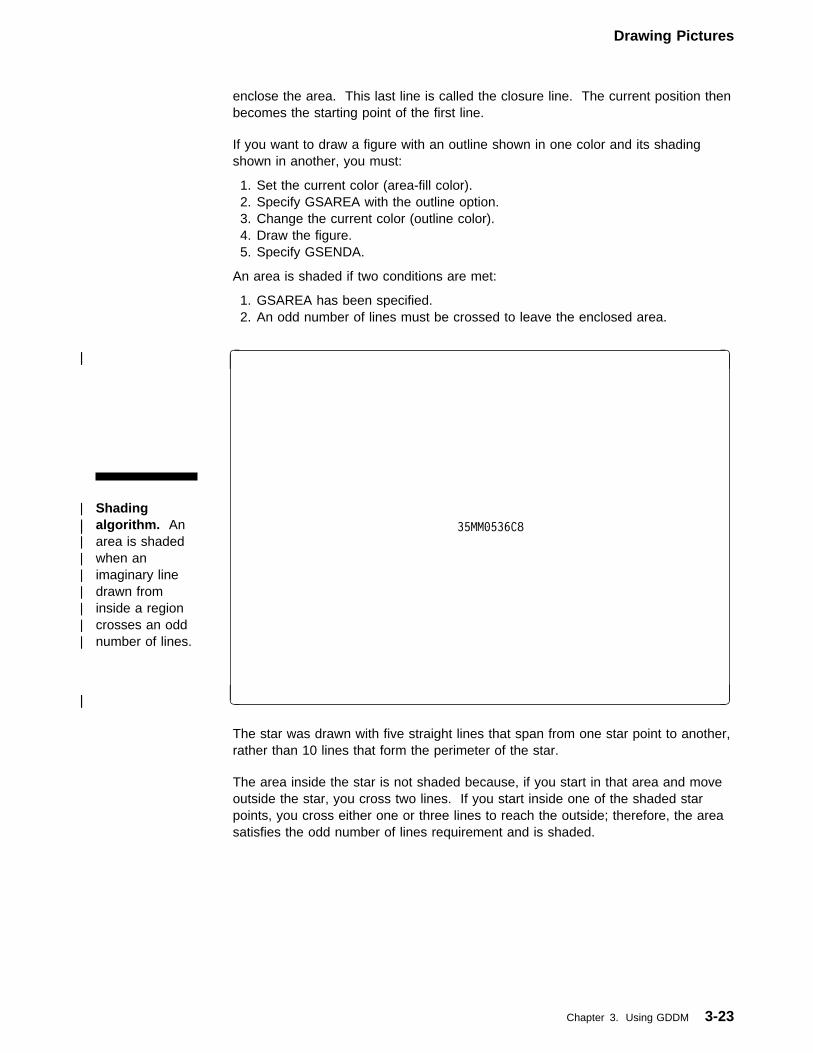
Drawing Pictures
enclose the area. This last line is called the closure line. The current position thenbecomes the starting point of the first line.
If you want to draw a figure with an outline shown in one color and its shadingshown in another, you must:
1. Set the current color (area-fill color).2. Specify GSAREA with the outline option.3. Change the current color (outline color).4. Draw the figure.
5. Specify GSENDA.
An area is shaded if two conditions are met:
1. GSAREA has been specified.2. An odd number of lines must be crossed to leave the enclosed area.
| Shading| algorithm. An| area is shaded| when an| imaginary line| drawn from| inside a region| crosses an odd| number of lines.
| �|
| 35MM�536C8
| �| �
The star was drawn with five straight lines that span from one star point to another,rather than 10 lines that form the perimeter of the star.
The area inside the star is not shaded because, if you start in that area and moveoutside the star, you cross two lines. If you start inside one of the shaded starpoints, you cross either one or three lines to reach the outside; therefore, the areasatisfies the odd number of lines requirement and is shaded.
Chapter 3. Using GDDM 3-23
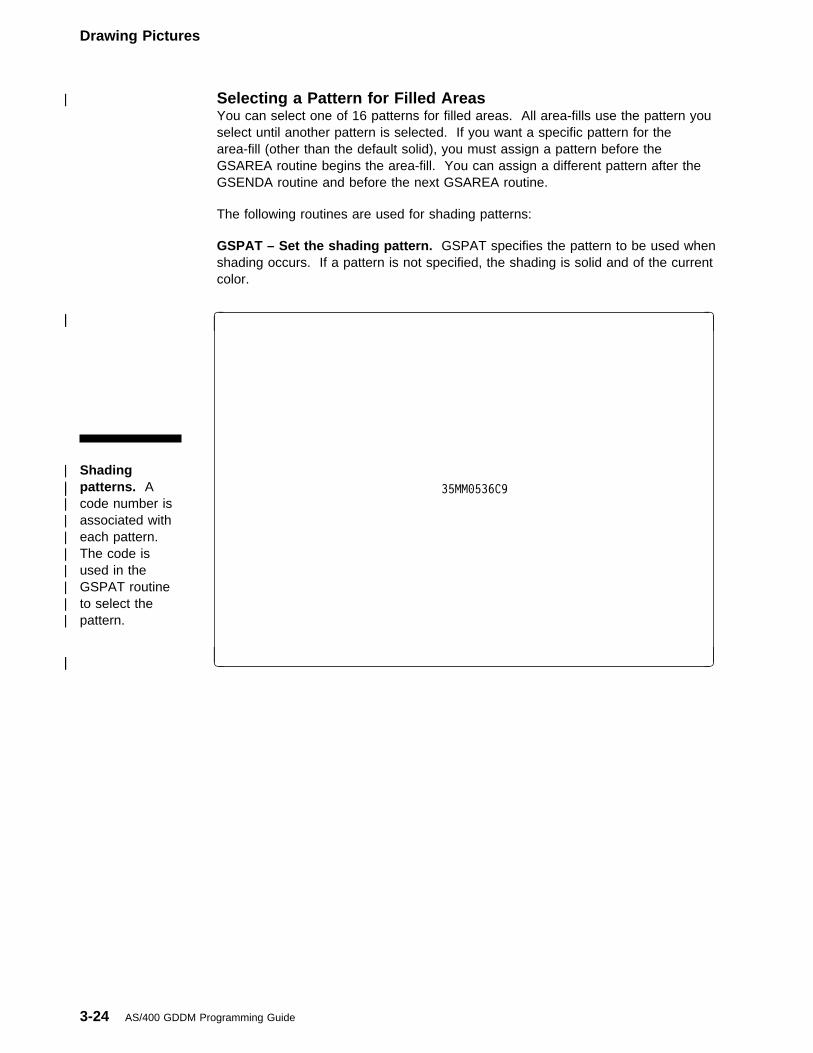
Drawing Pictures
| Selecting a Pattern for Filled AreasYou can select one of 16 patterns for filled areas. All area-fills use the pattern youselect until another pattern is selected. If you want a specific pattern for thearea-fill (other than the default solid), you must assign a pattern before theGSAREA routine begins the area-fill. You can assign a different pattern after theGSENDA routine and before the next GSAREA routine.
The following routines are used for shading patterns:
GSPAT – Set the shading pattern. GSPAT specifies the pattern to be used whenshading occurs. If a pattern is not specified, the shading is solid and of the currentcolor.
| Shading| patterns. A| code number is| associated with| each pattern.| The code is| used in the| GSPAT routine| to select the| pattern.
| �|
| 35MM�536C9
| �| �
3-24 AS/400 GDDM Programming Guide
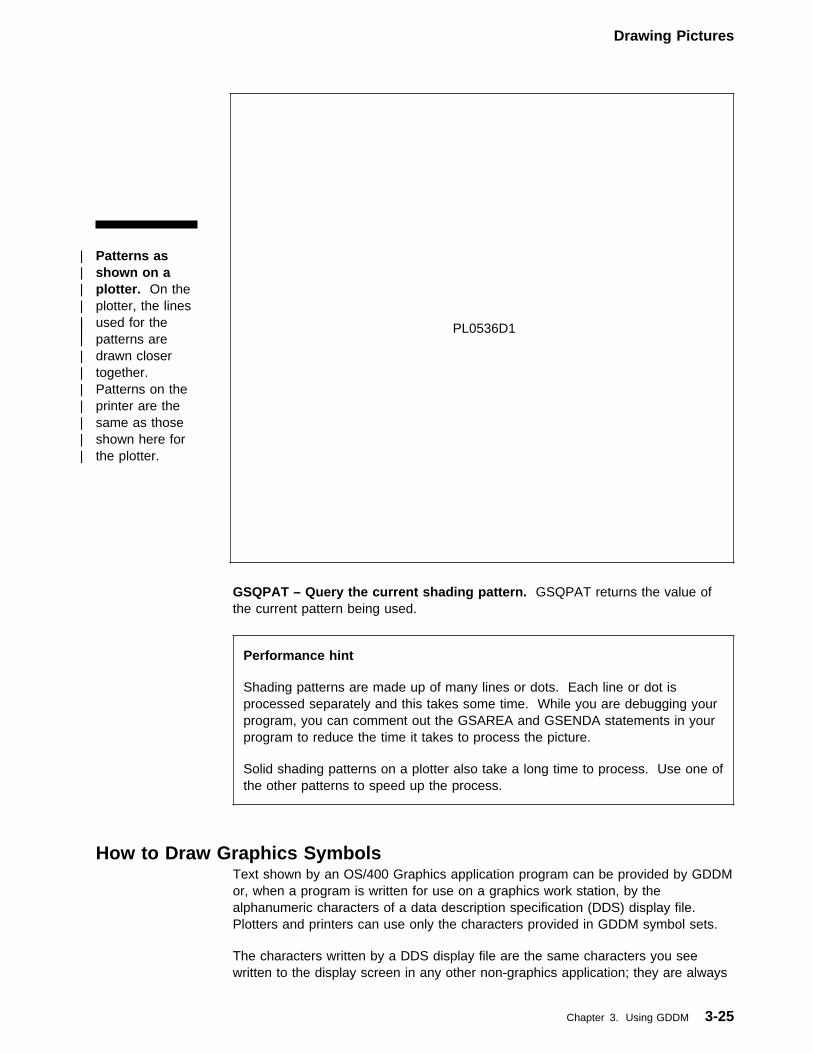
Drawing Pictures
| Patterns as| shown on a| plotter. On the| plotter, the lines| used for the| patterns are| drawn closer| together.| Patterns on the| printer are the| same as those| shown here for| the plotter.
| PL0536D1
GSQPAT – Query the current shading pattern. GSQPAT returns the value ofthe current pattern being used.
Performance hint
Shading patterns are made up of many lines or dots. Each line or dot isprocessed separately and this takes some time. While you are debugging yourprogram, you can comment out the GSAREA and GSENDA statements in yourprogram to reduce the time it takes to process the picture.
Solid shading patterns on a plotter also take a long time to process. Use one ofthe other patterns to speed up the process.
How to Draw Graphics SymbolsText shown by an OS/400 Graphics application program can be provided by GDDMor, when a program is written for use on a graphics work station, by thealphanumeric characters of a data description specification (DDS) display file.Plotters and printers can use only the characters provided in GDDM symbol sets.
The characters written by a DDS display file are the same characters you seewritten to the display screen in any other non-graphics application; they are always
Chapter 3. Using GDDM 3-25
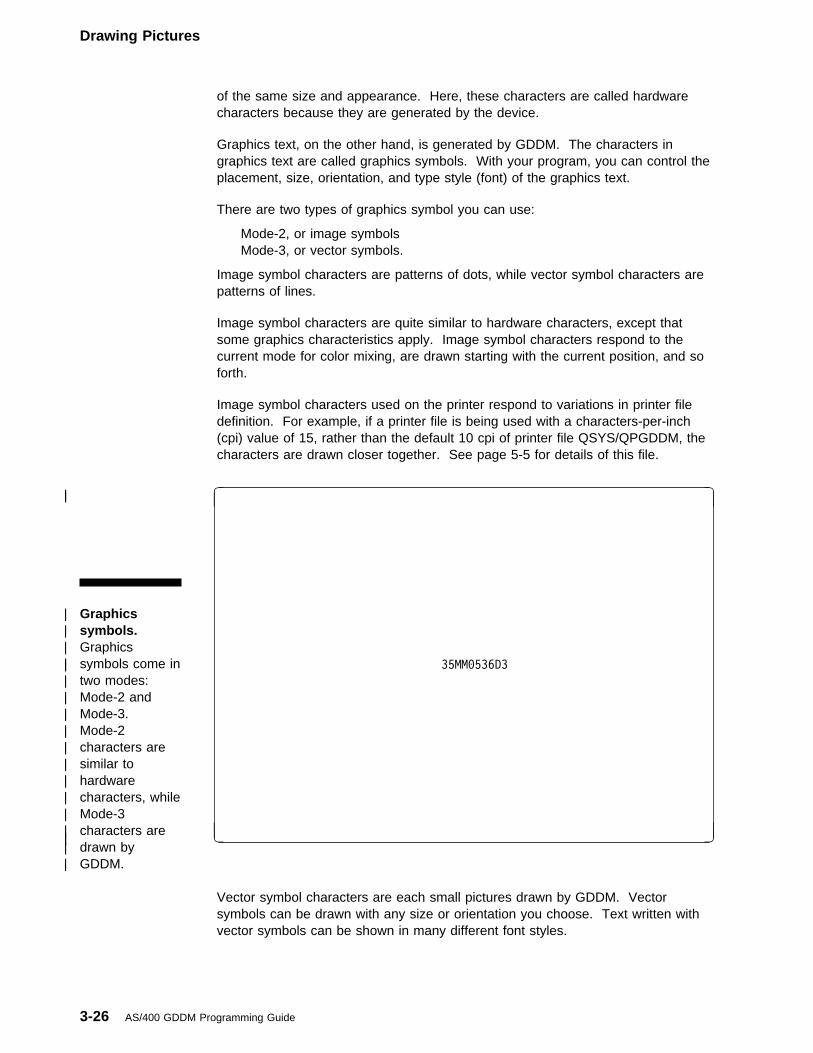
Drawing Pictures
of the same size and appearance. Here, these characters are called hardwarecharacters because they are generated by the device.
Graphics text, on the other hand, is generated by GDDM. The characters ingraphics text are called graphics symbols. With your program, you can control theplacement, size, orientation, and type style (font) of the graphics text.
There are two types of graphics symbol you can use:
Mode-2, or image symbolsMode-3, or vector symbols.
Image symbol characters are patterns of dots, while vector symbol characters arepatterns of lines.
Image symbol characters are quite similar to hardware characters, except thatsome graphics characteristics apply. Image symbol characters respond to thecurrent mode for color mixing, are drawn starting with the current position, and soforth.
Image symbol characters used on the printer respond to variations in printer filedefinition. For example, if a printer file is being used with a characters-per-inch(cpi) value of 15, rather than the default 10 cpi of printer file QSYS/QPGDDM, thecharacters are drawn closer together. See page 5-5 for details of this file.
| Graphics| symbols.| Graphics| symbols come in| two modes:| Mode-2 and| Mode-3.| Mode-2| characters are| similar to| hardware| characters, while| Mode-3| characters are| drawn by| GDDM.
| �|
| 35MM�536D3
| �| �
Vector symbol characters are each small pictures drawn by GDDM. Vectorsymbols can be drawn with any size or orientation you choose. Text written withvector symbols can be shown in many different font styles.
3-26 AS/400 GDDM Programming Guide
Drawing Pictures
| Vector symbol| font styles.| Vector symbols| can be drawn in| many different| styles.
| �|
| 35MM�536D4
| �| �
All graphics symbol sets (both image and vector) are stored in OS/400 object type*GSS. For more information on object management of the *GSS object type, see“OS/400 Graphics Symbol Sets” on page 5-7.
A graphics symbol set must be loaded from the *GSS object, then selected for usein your program as the current symbol set (more than one can be loaded). Themode of the graphics symbol set can be specified also; for mode-3 symbols,attributes can be assigned that determine the way the symbols are drawn.
Controlling Symbol SetsGraphics symbol sets that have been loaded apply only to the device your programis currently using; if the current device is closed by the DSCLS routine or isinitialized again by the DSRNIT routine, the symbol sets must be loaded again forthe new current device. Otherwise, the default symbol set is used. For informationabout device controls, see “Device Controls” on page 3-65.
The default symbol set depends on the type of application (GDDM or PresentationGraphics) and the device you are using. This table shows the symbol set used foreach type of application program and each device type.
Chapter 3. Using GDDM 3-27
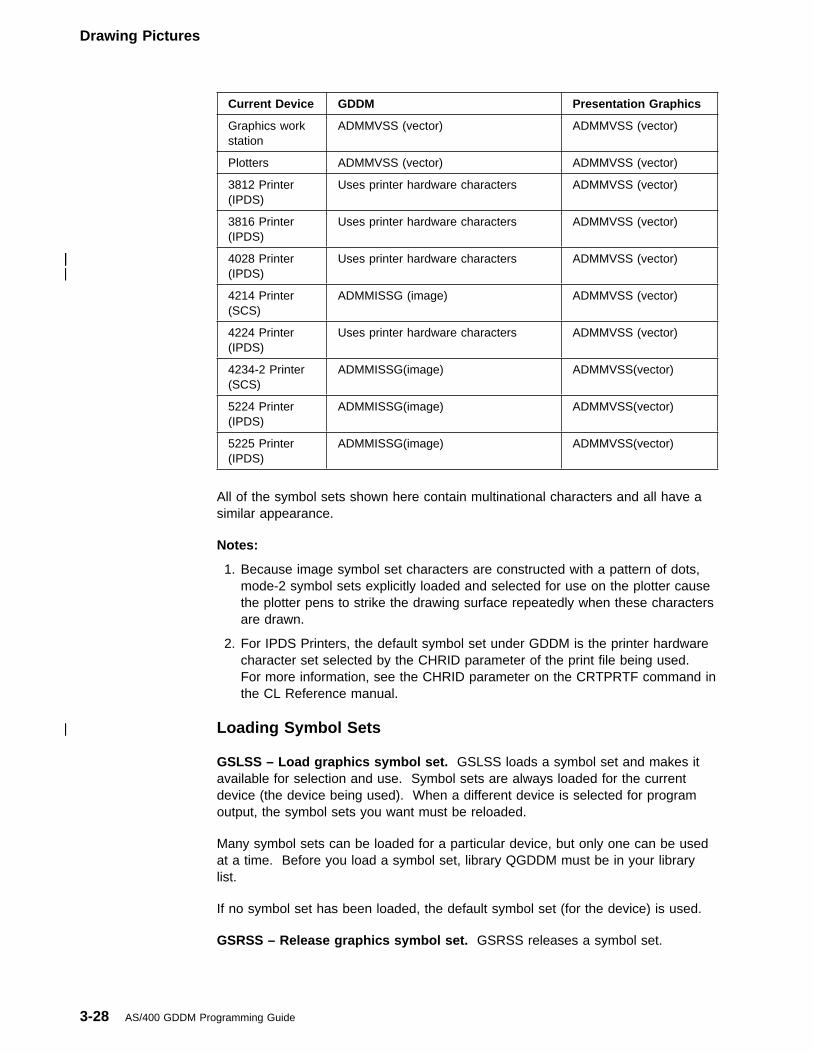
Drawing Pictures
All of the symbol sets shown here contain multinational characters and all have asimilar appearance.
Notes:
1. Because image symbol set characters are constructed with a pattern of dots,mode-2 symbol sets explicitly loaded and selected for use on the plotter causethe plotter pens to strike the drawing surface repeatedly when these charactersare drawn.
2. For IPDS Printers, the default symbol set under GDDM is the printer hardwarecharacter set selected by the CHRID parameter of the print file being used.For more information, see the CHRID parameter on the CRTPRTF command inthe CL Reference manual.
Current Device GDDM Presentation Graphics
Graphics workstation
ADMMVSS (vector) ADMMVSS (vector)
Plotters ADMMVSS (vector) ADMMVSS (vector)
3812 Printer(IPDS)
Uses printer hardware characters ADMMVSS (vector)
3816 Printer(IPDS)
Uses printer hardware characters ADMMVSS (vector)
| 4028 Printer| (IPDS)| Uses printer hardware characters| ADMMVSS (vector)
4214 Printer(SCS)
ADMMISSG (image) ADMMVSS (vector)
4224 Printer(IPDS)
Uses printer hardware characters ADMMVSS (vector)
4234-2 Printer(SCS)
ADMMISSG(image) ADMMVSS(vector)
5224 Printer(IPDS)
ADMMISSG(image) ADMMVSS(vector)
5225 Printer(IPDS)
ADMMISSG(image) ADMMVSS(vector)
| Loading Symbol Sets GSLSS – Load graphics symbol set. GSLSS loads a symbol set and makes itavailable for selection and use. Symbol sets are always loaded for the currentdevice (the device being used). When a different device is selected for programoutput, the symbol sets you want must be reloaded.
Many symbol sets can be loaded for a particular device, but only one can be usedat a time. Before you load a symbol set, library QGDDM must be in your librarylist.
If no symbol set has been loaded, the default symbol set (for the device) is used.
GSRSS – Release graphics symbol set. GSRSS releases a symbol set.
3-28 AS/400 GDDM Programming Guide
Drawing Pictures
GSQNSS – Query the number of loaded graphics symbol sets. GSQNSSreturns the number of symbol sets currently loaded for the device. This value canbe used as the symbol-set-to-query parameter in the GSQSS routine.
GSQSS – Query loaded graphics symbol sets. GSQSS returns informationabout all symbol sets that have been loaded by GSLSS.
For a list of the names of the available symbol sets, see “OS/400 Graphics SymbolSets” on page 5-7.
| Selecting a Character Mode GSCM – Set current character mode. GSCM sets the character mode forgraphics symbols drawn by the program. If no symbol sets have been loaded andselected, the program uses the default symbol set for the mode specified. If nomode is specified, the default symbol set for the device is used. For the plotter,setting the character mode to 2 has no effect unless a mode-2 symbol set hasbeen loaded and selected.
| Selecting the Current Symbol Set GSCS – Select a symbol set. GSCS selects a symbol set to be used as thecurrent symbol set. The symbol-set identifier must name a symbol set that hasbeen loaded from the *GSS object by the GSLSS routine.
If GSCM has not been used to specify a character mode, the default symbol set forthe device is used.
If GSCM specified character-mode 3, and a symbol set is not specified or has notbeen loaded or if GSCS(0) is selected, the default ADMMVSS symbol set is used.
GSQCS – Query the current symbol set. GSQCS returns the value of thecurrent symbol set.
| Drawing Graphics SymbolsGraphics symbols can be drawn in the form of character strings.
Graphics symbols are drawn with their lower left corner over the current position.After a character string has been drawn, the current position is the position after thelast character in the string.
The routines that draw graphics symbols of the current symbol set are:
GSCHAR – Draw a character string at a specified point. GSCHAR draws acharacter string at the position specified by x and y (instead of the current position).
GSCHAP – Draw a character string at the current position. GSCHAP draws acharacter string at the current position.
This routine is useful for continuing a character string at the point where a previouscharacter string or primitive ended. GSCHAP is equivalent to a GSQCP followedby a GSCHAR that uses the values of the current position returned to the GSQCProutine.
Chapter 3. Using GDDM 3-29
Drawing Pictures
Performance hint
Each mode-3 vector symbol is made up of many straight and curved lines.Each line is processed separately and the larger and more complex thecharacter, the longer it takes to process. While you are debugging yourprogram, you can comment out the GSCS statements in your program toreduce the time it takes to process the picture. The commented out statementsprevent loaded symbol sets being used; the default ones are used instead.
Complex symbol sets on a plotter also take a long time to process. Use one ofthe simpler ones to speed up the process.
Attributes for Graphics SymbolsGraphics symbol attributes determine the symbol set, size, angle, direction, andshear of graphics symbol characters used in a picture. Because graphics symbolsare drawn as small pictures, graphics symbol attributes have no effect on anyalphanumeric characters (hardware characters) shown by a DDS display file in thesame picture.
The graphics window (the coordinate system you specify) can have an effect on theattributes you specify for graphics symbols, especially vector symbols. If, forexample, your coordinate system is set so that 2 units in the y-direction equal 1 unitin the x-direction, a character box (discussed next) set as x=1, y=2 will appearsquare, and the other attributes that determine the look of the symbols will also beaffected.
Image symbols (mode-2) are similar in nature and appearance to hardwarecharacters; graphics symbol attributes have little effect on them, except for spacingand placement. Graphics symbol attributes have the most effect on vector symbols(mode-3).
For mode-2 and mode-3 characters in graphics printer files, variations in the cpi(characters-per-inch) setting of the graphics printer file being used affect thehorizontal spacing of characters in strings. For more information on graphicsprinter files, see “QPGDDM Printer File Considerations” on page 5-5.
Note: For both mode-2 and mode-3 characters, you must set the character modewith GSCM before any of the symbol-set attributes can have an effect ongraphics symbols.
| Setting the Graphics Symbol SizeFor vector symbols (mode-3), character size is determined by the attributes thatspecify the dimensions and coordinate system used by the program to positionprimitives on the screen (see “The Graphics Window” on page 3-53). Based onthat system, you can specify the size of mode-3 characters in units of x- andy-coordinate values.
The hardware cell size is the size of each non-graphics, alphanumeric character(hardware character) used by the device, and of each image symbol (mode-2).The characters written by a DDS display file appear in hardware cell size. Thehardware cell size for mode-2 graphics symbols on printers can vary with the
3-30 AS/400 GDDM Programming Guide
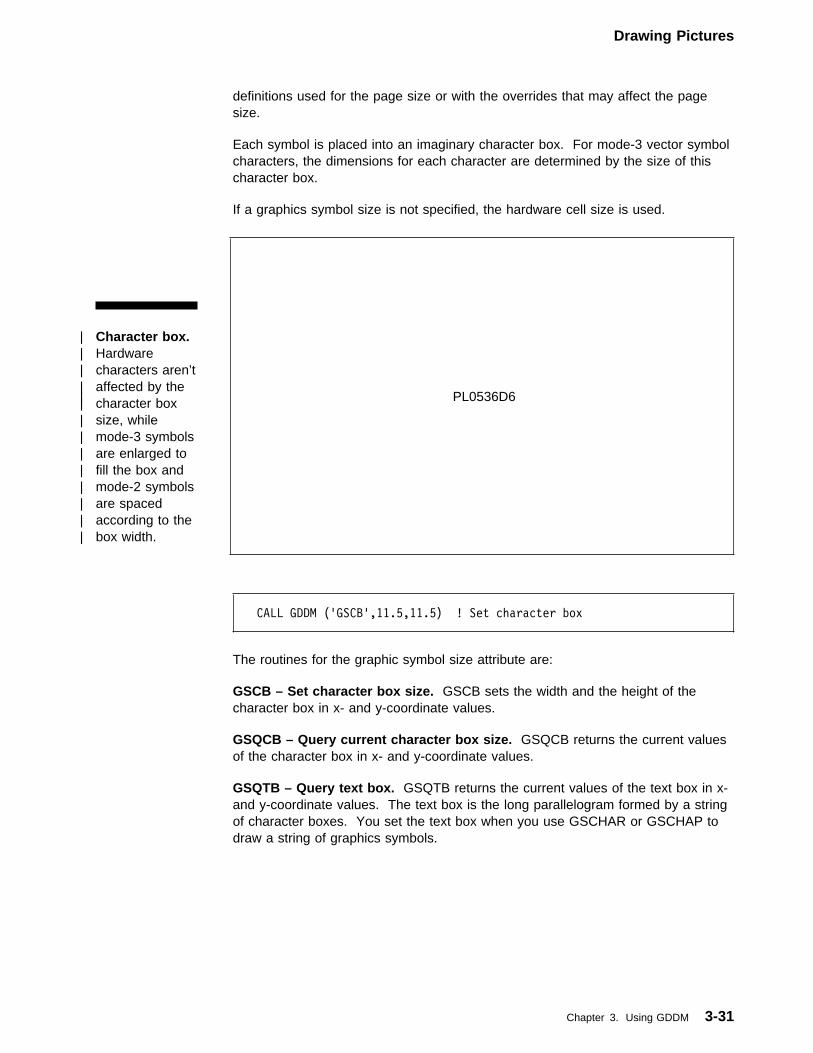
Drawing Pictures
definitions used for the page size or with the overrides that may affect the pagesize.
Each symbol is placed into an imaginary character box. For mode-3 vector symbolcharacters, the dimensions for each character are determined by the size of thischaracter box.
If a graphics symbol size is not specified, the hardware cell size is used.
| Character box.| Hardware| characters aren’t| affected by the| character box| size, while| mode-3 symbols| are enlarged to| fill the box and| mode-2 symbols| are spaced| according to the| box width.
| PL0536D6
CALL GDDM ('GSCB',11.5,11.5) ! Set character box
The routines for the graphic symbol size attribute are:
GSCB – Set character box size. GSCB sets the width and the height of thecharacter box in x- and y-coordinate values.
GSQCB – Query current character box size. GSQCB returns the current valuesof the character box in x- and y-coordinate values.
GSQTB – Query text box. GSQTB returns the current values of the text box in x-and y-coordinate values. The text box is the long parallelogram formed by a stringof character boxes. You set the text box when you use GSCHAR or GSCHAP todraw a string of graphics symbols.
Chapter 3. Using GDDM 3-31
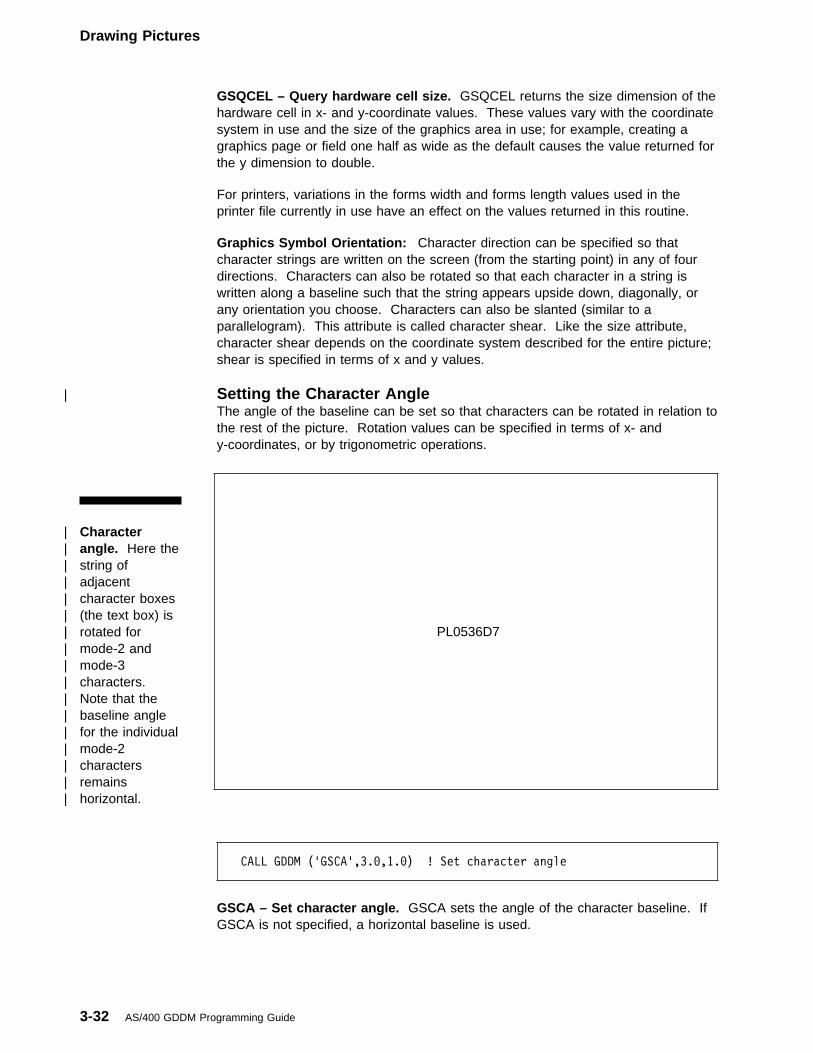
Drawing Pictures
GSQCEL – Query hardware cell size. GSQCEL returns the size dimension of thehardware cell in x- and y-coordinate values. These values vary with the coordinatesystem in use and the size of the graphics area in use; for example, creating agraphics page or field one half as wide as the default causes the value returned forthe y dimension to double.
For printers, variations in the forms width and forms length values used in theprinter file currently in use have an effect on the values returned in this routine.
Graphics Symbol Orientation: Character direction can be specified so thatcharacter strings are written on the screen (from the starting point) in any of fourdirections. Characters can also be rotated so that each character in a string iswritten along a baseline such that the string appears upside down, diagonally, orany orientation you choose. Characters can also be slanted (similar to aparallelogram). This attribute is called character shear. Like the size attribute,character shear depends on the coordinate system described for the entire picture;shear is specified in terms of x and y values.
| Setting the Character AngleThe angle of the baseline can be set so that characters can be rotated in relation tothe rest of the picture. Rotation values can be specified in terms of x- andy-coordinates, or by trigonometric operations.
| Character| angle. Here the| string of| adjacent| character boxes| (the text box) is| rotated for| mode-2 and| mode-3| characters.| Note that the| baseline angle| for the individual| mode-2| characters| remains| horizontal.
| PL0536D7
CALL GDDM ('GSCA',3.�,1.�) ! Set character angle
GSCA – Set character angle. GSCA sets the angle of the character baseline. IfGSCA is not specified, a horizontal baseline is used.
3-32 AS/400 GDDM Programming Guide
Drawing Pictures
If the coordinate system of the picture is such that x = y, then these three routinesproduce characters that are written on a 45-degree angle baseline:
CALL GDDM ('GSCA',1.�,1.�)
CALL GDDM ('GSCA',5.�,5.�)
CALL GDDM ('GSCA',12345.�,12345.�)
When x = y, a 45-degree baseline results. If you need a baseline of a specificangle that would be difficult to produce using the coordinate values of x and y, usethe sine and cosine values of the angle radian.
To find the angle in radians to set a character angle use this algorithm:
DEGREE = 37 !Character angle 37 degrees
RADIAN = DEGREE � (PI / 18�)
DX = COS(RADIAN) !COS = cosine of angle
DY = SIN(RADIAN) !SIN = sine of angle
CALL GDDM ('GSCA',DX,DY)
Either of the values can be negative. The amount of rotation of the charactersdepends on the coordinate system established for the picture; for more information,see “The Picture Space” on page 3-48 and “The Graphics Window” on page 3-53.
The following routine is used to query the current character angle:
GSQCA – Query current character angle. GSQCA returns the x and y valuesused for the current character baseline angle. If sine and cosine were used forsetting the angle, x and y are the radians.
| Setting the Character DirectionGraphics symbol direction is the orientation of an entire character string. You canspecify that the character strings are written from left to right (standard readingdirection), top to bottom, right to left, or bottom to top. The character boxes can betilted within the string by setting the character angle with the GSCA routine.
If a graphics symbol direction is not specified, character strings are drawn left toright.
Chapter 3. Using GDDM 3-33
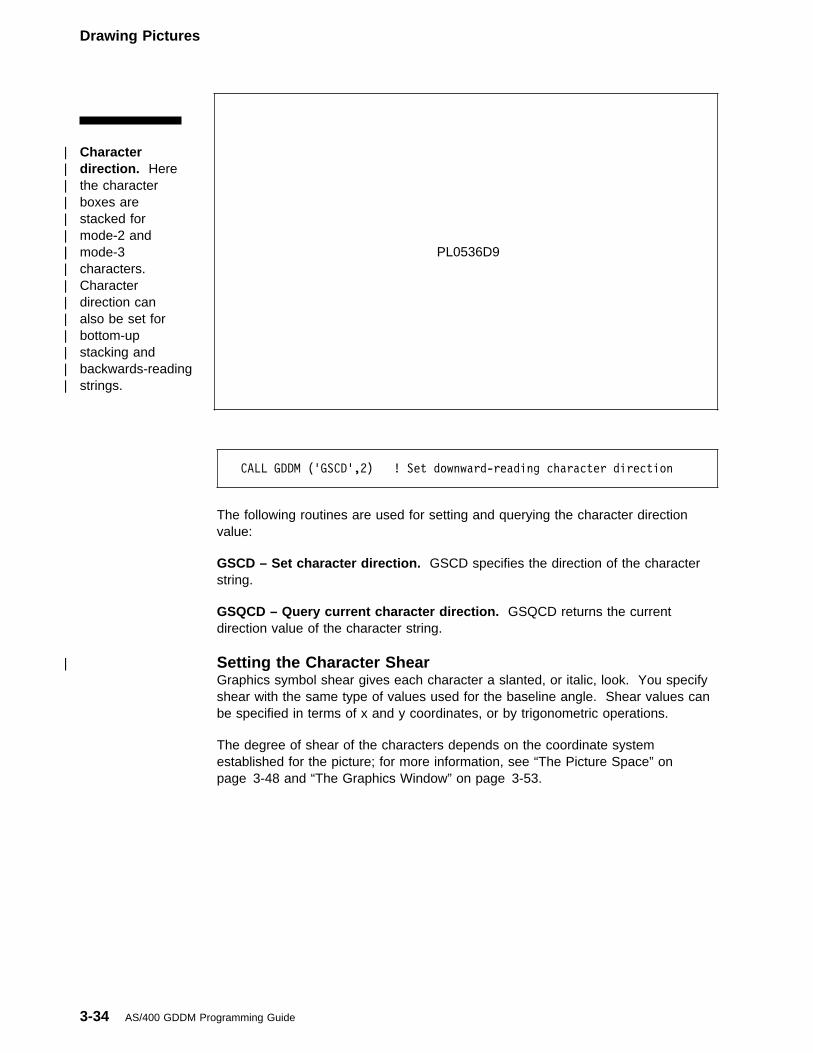
Drawing Pictures
| Character| direction. Here| the character| boxes are| stacked for| mode-2 and| mode-3| characters.| Character| direction can| also be set for| bottom-up| stacking and| backwards-reading| strings.
| PL0536D9
CALL GDDM ('GSCD',2) ! Set downward-reading character direction
The following routines are used for setting and querying the character directionvalue:
GSCD – Set character direction. GSCD specifies the direction of the characterstring.
GSQCD – Query current character direction. GSQCD returns the currentdirection value of the character string.
| Setting the Character ShearGraphics symbol shear gives each character a slanted, or italic, look. You specifyshear with the same type of values used for the baseline angle. Shear values canbe specified in terms of x and y coordinates, or by trigonometric operations.
The degree of shear of the characters depends on the coordinate systemestablished for the picture; for more information, see “The Picture Space” onpage 3-48 and “The Graphics Window” on page 3-53.
3-34 AS/400 GDDM Programming Guide
Drawing Pictures
| Character| shear. Mode-3| characters are| slanted by| character shear,| while mode-2| characters are| only affected by| the shift in| position.
| PL0536E1
CALL GDDM ('GSCH',1.�,1.�) ! Set positive shear
CALL GDDM ('GSCH',-1.�,1.�) ! Set negative shear
These routines are used for setting and querying character shear values:
GSCH – Set character shear. GSCH sets the angle of character shear. Thecharacters can slant to the left or the right, depending on the sign of one of theparameters used (right for positive or left for negative).
GSQCH – Query current character shear. GSQCH returns the values used toset the current angle of character shear.
Drawing Graphics ImagesAnother type of graphics primitive you can draw is the graphics image. A graphicsimage is a user-defined pattern of dots that can show a picture or symbol. You candefine a graphics image in your program and then use it anywhere in your picture.The graphics image pattern is defined by a character variable string that representsa bit pattern of 0’s and 1’s; each 1 sets the associated pixel on, and each 0 leavesthe associated pixel unchanged. The graphics image size is determined by thenumber of 0’s and 1’s (screen dots) that you include in the bit pattern.
Graphics images are drawn with the current color. You can draw multicolorgraphics images by drawing one part of the graphics image in one color, and therest of it in a different color (these separate parts have to be defined and called asseparate graphics images and then overlaid).
Chapter 3. Using GDDM 3-35
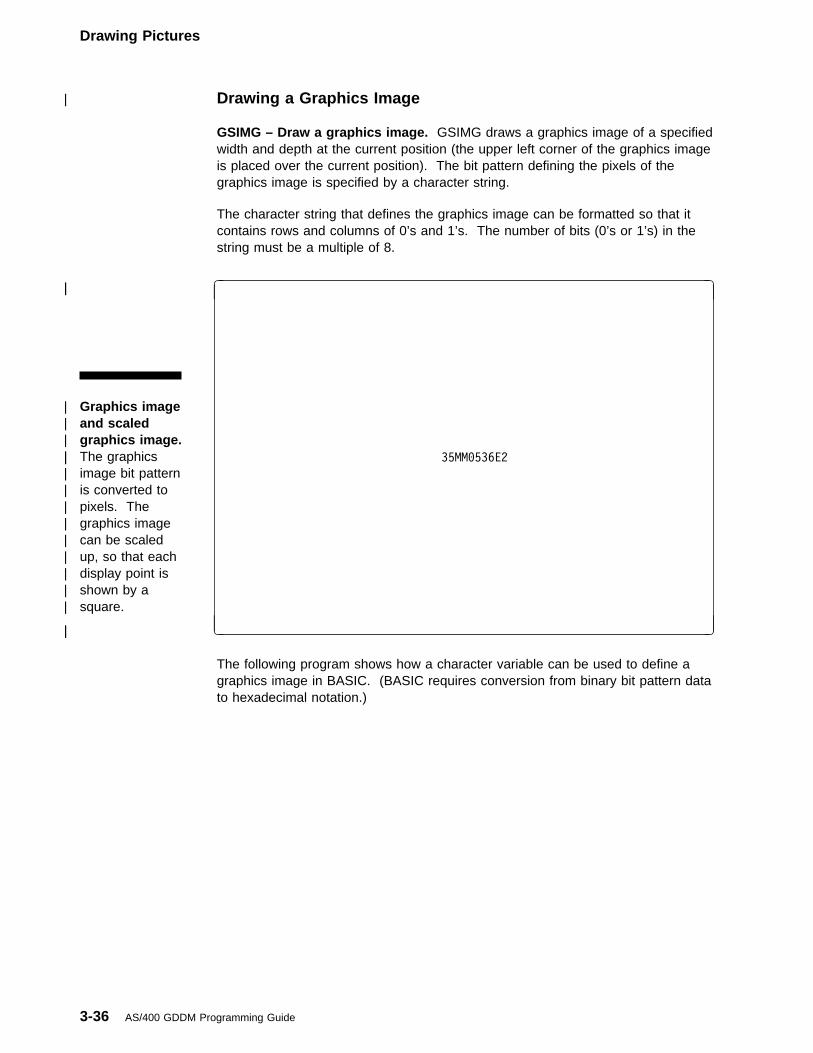
Drawing Pictures
| Drawing a Graphics Image GSIMG – Draw a graphics image. GSIMG draws a graphics image of a specifiedwidth and depth at the current position (the upper left corner of the graphics imageis placed over the current position). The bit pattern defining the pixels of thegraphics image is specified by a character string.
The character string that defines the graphics image can be formatted so that itcontains rows and columns of 0’s and 1’s. The number of bits (0’s or 1’s) in thestring must be a multiple of 8.
| Graphics image| and scaled| graphics image.| The graphics| image bit pattern| is converted to| pixels. The| graphics image| can be scaled| up, so that each| display point is| shown by a| square.
| �|
| 35MM�536E2
| �| �
The following program shows how a character variable can be used to define agraphics image in BASIC. (BASIC requires conversion from binary bit pattern datato hexadecimal notation.)
3-36 AS/400 GDDM Programming Guide
Drawing Pictures
���1� REM ����������������������������������������������
���2� REM INITIALIZE
���3� REM ����������������������������������������������
���4� CALL GDDM ('FSINIT')
���5� REM ����������������������������������������������
���6� REM SPECIFY IMAGE DATA
���7� REM ����������������������������������������������
���8� REM ����11111111����
���9� REM ���11������11���
��1�� REM ��11��������11��
��11� REM �11�111111���11� The bit pattern
��12� REM 11��11����11��11 consists of �'s and
��13� REM 11��11����11��11 1's. Each 1 illuminates
��14� REM 11��111111����11 a PEL with the current
��15� REM 11��11���11���11 color, while each
��16� REM 11��11����11��11 � leaves the display
��17� REM �11�11����11�11� point as it was.
��18� REM ��11��������11��
��19� REM ���11������11���
��2�� REM ����11111111����
��21� REM Convert the characters to hexadecimal as follows:
��22� REM ���� 1111 1111 ���� = HEX '� F F �' where ���� = HEX '�'
��23� REM ���1 1��� ���1 1��� = HEX '1 8 1 8' ���1 = HEX '1'
��24� REM ��11 ���� ���� 11�� = HEX '3 � � C' ��1� = HEX '2'
��25� REM �11� 1111 11�� �11� = HEX '6 F C 6' ��11 = HEX '3'
��26� REM 11�� 11�� ��11 ��11 = HEX 'C C 3 3' �1�� = HEX '4'
��27� REM 11�� 11�� ��11 ��11 = HEX 'C C 3 3' �1�1 = HEX '5'
��28� REM 11�� 1111 11�� ��11 = HEX 'C F C 3' �11� = HEX '6'
��29� REM 11�� 11�� �11� ��11 = HEX 'C C 6 3' �111 = HEX '7'
��3�� REM 11�� 11�� ��11 ��11 = HEX 'C C 3 3' 1��� = HEX '8'
��31� REM �11� 11�� ��11 �11� = HEX '6 C 3 6' 1��1 = HEX '9'
��32� REM ��11 ���� ���� 11�� = HEX '3 � � C' 1�1� = HEX 'A'
��33� REM ���1 1��� ���1 1��� = HEX '1 8 1 8' 1�11 = HEX 'B'
��34� REM ���� 1111 1111 ���� = HEX '� F F �' 11�� = HEX 'C'
��35� REM ���������������������������������������������� 11�1 = HEX 'D'
��36� REM DRAW IMAGE 111� = HEX 'E
��37� REM ���������������������������������������������� 1111 = HEX 'F'
��38� DIM IMG$�26 ! Image variable 1/2 hex string
��39� DIM X$�52 ! Hex string variable
��4�� X$='�FF�18183��C6FC6CC33CC33CFC3CC63CC336C363��C1818�FF�'
��41� IMG$=HEX$(X$) ! Convert back from hex to bits
��42� CALL GDDM ('GSMOVE',4�.�,6�.�) ! Move current position
��43� CALL GDDM ('GSIMG',�,16,13,26,IMG$)
��44� ! Draw graphics image with 16 PELs across, 13 display
��45� ! points down, 26 bytes of PELs ((16�13)/8 = total)
��46� CALL GDDM ('GSMOVE',5�.�,6�.�) ! Move current position
��47� CALL GDDM ('GSIMGS',�,16,13,26,IMG$,15.�,3�.�)
��48� ! Draw scaled graphics image with 16 PELs across,
��49� ! 13 PELs down, 26 bytes of PELs
��5�� ! ((16�13)/8 = total), scaled to 15 X-units for 3� Y-units.
��51� INTEGER ATTYPE,ATMOD,COUNT
��52� CALL GDDM ('ASREAD', ATTYPE,ATMOD,COUNT)
��53� CALL GDDM ('FSTERM')
��54� END
Chapter 3. Using GDDM 3-37
Drawing Pictures
| Drawing a Scaled Graphics Image GSIMGS – Draw a scaled graphics image. GSIMGS performs the same functionas GSIMG, except that you can specify an x and y range to enlarge the scale ofthe graphics image (in the current coordinate system); see “The Graphics Window”on page 3-53.
When the graphics image is scaled up, each PEL defined for the graphics image isrepresented on the picture by a square. Graphics images cannot be scaled to asize smaller than the defined GSIMG graphics image.
For examples of programs that draw graphics images in the other high-levellanguages, see Chapter 6, “Graphics Application Program Examples.”
How to Draw MarkersYou can use the graphics primitive marker to highlight points on charts or pictures.
| Markers. Ten| marker types are| available.
| �|
| 35MM�536E3 REVISED
| �| �
3-38 AS/400 GDDM Programming Guide
Drawing Pictures
| Loading Marker Symbol Sets GSLSS – Load graphics symbol set. GSLSS loads a marker symbol set andmakes it available for use.
Only one marker set may be loaded at one time for a particular device, and onceloaded, the marker set is automatically selected for use as the current marker set.
If no marker set has been loaded, the default marker set is used.
GSRSS – Release graphics symbol set. GSRSS releases a marker symbol set.
| Selecting a Marker GSMS – Select the marker symbol. GSMS specifies the marker symbol to beused. If a marker symbol is not specified, an x (cross) is used for the currentmarker symbol type.
GSQMS – Query the current marker symbol. GSQMS returns the value of thecurrent marker symbol.
| Drawing Markers GSMARK – Draw the marker symbol. GSMARK draws the current markersymbol, placing the center of the marker symbol at the coordinate specified by xand y.
GSMRKS – Draw a series of marker symbols. GSMRKS draws a series ofcurrent marker symbols at points specified by arrays of x- and y-coordinate values.
| Drawing Scaled Markers GSMSC – Set the marker symbol scale. GSMSC specifies the size of the markersymbol to be used. The marker symbol size is specified in units of the size usedfor the coordinate system in use for the picture. If a marker symbol scale is notspecified, the default marker size is used. Markers cannot be scaled to a size lessthan the default marker size.
GSQMSC – Query the current marker symbol scale. GSQMSC returns thevalue of the current marker symbol size.
Chapter 3. Using GDDM 3-39
Drawing Pictures
Drawing Pictures: SummaryThe part of this chapter you have just finished reading (the first part of Chapter 3,“Using GDDM”) showed you the GDDM primitives and their attributes used for allpictures (and charts, for Presentation Graphics) created by OS/400 Graphics.
You learned about the GDDM primitives, which are:
Lines Area-fills Graphics symbols Graphics images Markers
Lines define forms and shapes that, when enclosed, can be filled with patterns ofcolor by the area-fill. Graphics symbols come in two varieties, mode-2 imagesymbols and mode-3 vector symbols. Graphics symbols provide text for pictures.Graphics images allow you to define your own graphics image symbols, except thatthe graphics image you define cannot be used as text in a graphics symbol routine,and you must process the image each time you use it. Markers can be used tohighlight and pinpoint areas in a picture.
All of these primitives can have attributes assigned to them. All primitives have onecommon attribute, color, but most attributes are unique to a primitive. For example,a wide line-width attribute for line drawing routines has no effect on graphicsymbols. All attributes do, however, have a common characteristic: once anattribute is specified, it stays current and in use for all applicable routines until it ischanged. For example, when you set the color attribute to red, everything willshow up in red until the color attribute is changed. When you set the line type todotted line, every line will be drawn dotted until you change the attribute. Thischaracteristic of attributes is called the current mode.
The current mode characteristic also applies to the GDDM control routines that arediscussed in the next section, Controlling Graphics, where you will read about theGDDM routines you can use to control such things as:
Whether the graphics environment is initialized (whether the AS/400 System isexpecting calls to other GDDM or Presentation Graphics routines).
What actions are taken when an error occurs in the graphics program.
Which display device is the current one and when does the picture get sentthere.
Which of the pictures drawn by the program is shown.
How much of the screen is used to show the picture.
How much of the picture is shown.
The controls described next can be used for more versatile, more powerful OS/400Graphics programs.
3-40 AS/400 GDDM Programming Guide
Controlling Graphics
Controlling GraphicsIn the first part of this chapter, you learned that some GDDM routines specify whatis drawn on the picture and where it is drawn (primitives), and that others specifyhow those primitives should look (attributes).
This part of the chapter describes the GDDM routines that specify control functionsfor the graphics program and the control of devices. The program and the devicesand their characteristics are all part of the graphics environment.
Program ControlsProgram controls initialize and terminate the graphics environment and determinethe action taken when errors are encountered.
Graphics Environment ControlsThe graphics environment controls signal to the system whether it can expect callsto graphics routines.
| Initializing and Terminating the Graphics Environment FSINIT – Initialize the graphics environment. FSINIT initializes the graphicsenvironment. FSINIT must be the first GDDM routine called in the program.
FSTERM – Terminate the graphics environment. FSTERM terminates thegraphics environment. All storage used by the graphics environment is freed.FSTERM must be the last GDDM routine called in the program; if any other GDDMroutines follow the FSTERM routine, they are ignored unless they are preceded byan FSINIT routine.
FSRNIT – Reinitialize the graphics environment. FSRNIT reinitializes thegraphics environment. FSRNIT is equivalent to using the FSTERM routine followedby the FSINIT routine, except that the graphics environment retains the informationthat is available about the current device. For more information about devicecontrol routines, see “Device Controls” on page 3-65.
Error Handling ControlsRoutines are available in your graphics program for handling and querying errors.You can specify the error-handling program you want executed when an erroroccurs.
| Specifying an Error Handling Program FSEXIT – Specify an error exit program and threshold. You can use FSEXIT tospecify a program that performs error handling when an error is encountered with aroutine. The severity of the error must equal or exceed the severity threshold (alsospecified by FSEXIT). The error-handling program can be written to terminategraphics, or it can return control to the original program. Control is returned to theroutine that follows the routine that caused the error.
Chapter 3. Using GDDM 3-41
Controlling Graphics
For example, a program that is called after a user enters an invalid value (for aprogram that uses subfiles to prompt the user for values that are passed to GDDMroutines) is an error-handling program. The program processes the error byprompting the user for the correct value, then passes the corrected routine back tothe program, which resumes execution. You do not need to include error-checkingstatements in your program, use the error-checking capability of GDDM.
When a severity threshold is specified for FSEXIT but no error recovery program isspecified, an error that equals or exceeds the threshold causes message CPF8619to be issued. In that situation the MONMSG (Monitor Message) CL command canbe used to control error handling.
| Querying the Last Error FSQERR – Query last error. FSQERR returns information about the last GDDMerror. The information is placed into the named error record. The error record canbe up to 569 bytes long. If no error has occurred in the program, the defaultinformation is returned.
For more information on error handling, see “Error Recovery” on page 5-16.
Display ControlsDisplay controls send the picture or updates of the picture to the display station orthe plotter. (The destination depends upon the device control routine specified; formore information, see “Device Controls” on page 3-65 and Appendix A, “DevicesCompatible with the AS/400 System.”)
| Sending the Picture to a Device FSFRCE – Update the picture. FSFRCE sends to the device all changes that theprogram has made to the picture since the last ASREAD or FSFRCE routine.FSFRCE does not require a response from the device (unlike ASREAD).
FSFRCE updates the display and immediately returns to the program. BecauseFSFRCE does not require a response, program actions can change the picturebefore the operator of the program sees the updated display. FSFRCE is useful ina program just before an alphanumeric write/read operation where the graphicspicture should be overlaid by alphanumerics.
If the program erases parts of a picture that is being displayed, FSFRCE redrawsthe entire picture. If parts are being added, only the new parts are drawn. Onplotters, an FSFRCE or ASREAD causes everything within a graphics segment tobe drawn again. On printers, a page eject occurs after every FSFRCE or ASREADand everything within a graphics segment is drawn again).
ASREAD – Device input/output. ASREAD performs an FSFRCE update to thedisplay, then unlocks the work station keyboard and waits for operatoracknowledgement. The type of acknowledgement to the display is returned to theprogram (Enter key, F keys, or Clear key).
3-42 AS/400 GDDM Programming Guide
Controlling Graphics
You can use this returned value to alter the flow of control in your program. Forthe plotter and the printer, no user response is returned.
FSREST – Retransmit the picture. FSREST causes the picture to be deleted andcompletely redrawn the next time the ASREAD or FSFRCE routine is used.
For a program that sends the picture to the plotter or printer, ASREAD andFSFRCE provide identical function, but a low-severity error is issued for theASREAD routine.
Picture ControlsEvery program that uses GDDM primitive and attribute routines to draw a picturealso uses GDDM control routines to select the device used to display the picture,define the size of the picture, and the coordinate system in use. If the programcontains routines to construct several different pictures, GDDM picture controlroutines select which picture to show. If several pictures are shown at the sametime, GDDM picture control routines position them on the screen.
The simple programs in Chapter 2, “The Application Program Interface to Graphics”that drew the picture of the envelope and the line chart used all of these controls,but you did not see them in the program; the control routines assumed defaultvalues. Simple graphics programs have the following characteristics, which resultfrom default control values:
One picture is defined and shown per program.
A coordinate system of 0 through 100 is used for both the x and y ranges.
Both the x and the y ranges span the entire width and depth of the screen.
The entire screen is used to show the picture.
The picture is shown on the device that called the program.
If any of your programs will specify further controls for the picture, then you shouldunderstand the graphics hierarchy.
The graphics hierarchy comprises:
1. The device 2. The page3. The graphics field4. The picture space
5. The viewport6. The graphics window7. The graphics segment
The DeviceThe device is at the top of the hierarchy; it is the destination to which the output ofthe graphics program is sent. Valid destinations for pictures are:
| � IBM personal computer with work station function (WSF)| � IBM personal computer with work station emulation (WSE)
� 5292 Model 2� IBM personal computer with 5250 emulation� IBM 6180 Plotter
| � IBM 6182 Plotter| � IBM 6184 Plotter
Chapter 3. Using GDDM 3-43
Controlling Graphics
| � IBM 6185 Plotter| � IBM 6186-1 Plotter| � IBM 6186-2 Plotter
� IBM 7371 Plotter� IBM 7372 Plotter� IBM 4214 Printer� IBM 4234-2 Printer� IBM 5224 Printer� IBM 5225 Printer� IBM 3812 Printer� IBM 3816 Printer
| � IBM 4028 Printer� IBM 4224 Printer
Graphics output for a printer can be sent directly from the application program tothe printer or it can be placed onto an output queue as a spooled file. However, aspooled file created for one type of printer will generally be incompatible withanother type of printer. A program can send its output to any identified device.
Device control routines can be used to select an output device and to identifycharacteristics of the device to the program. For a description of device controlroutines, see “Device Controls” on page 3-65.
The PageSome graphics programs are written such that they use GDDM (or PresentationGraphics) routines to construct a picture, send the picture to a display station or aplotter, and then end. Other more complex programs construct several differentpictures; each of these pictures can be sent to a device one at a time, or they canbe sent to different devices, one at a time. The method GDDM uses to keep trackof these individual pictures is called the page.
Each picture created by a program is considered to be one page of information.Each page has a number assigned to it. A program can construct a picture for afirst page and then continue on to construct a completely different picture (a secondpage) without having sent the first page to a device. Even though the first picturehas not been displayed, its segments have been processed (constructed) and thepicture is stored in the system, waiting to be selected and sent to a device.(Segments for a page are discussed later.) Alternatively, a program can send eachpage to a device as soon as the picture has been processed.
The number assigned to a page when it is created identifies it in GDDM routineswhere a page is selected, cleared, deleted, and queried.
The program sends a page to a device when an ASREAD or FSFRCE routine isencountered:
If several different pictures (pages) have been constructed by the program, theASREAD or FSFRCE sends to the device the current page. The current pageis one that has been selected. To send one of the other pages to the device,the program selects that page. The newly-selected page is now the currentpage, and it is sent to the device as soon as an ASREAD or FSFRCE routineis encountered.
A page can be selected again and sent to the device, or the program can addmore graphics to it and then send it to the device. When a page is cleared, it
3-44 AS/400 GDDM Programming Guide
Controlling Graphics
still exists in the system, but all the attributes and picture characteristics definedfor it are now the default values.
A page that has been deleted ceases to exist. If the program deletes a pageand then later selects the number of the deleted page, the system creates anew current page with that identifier (with default attributes and picturecharacteristics).
An ASREAD or FSFRCE routine in a page sent to a printer causes a pageeject; that is, after the current page has printed, the printer positions a cleanform for the next print operation.
| An ASREAD or FSFRCE routine in a page sent to a plotter with form feed| enabled causes a page eject; after the current page has plotted, the plotter| loads a new sheet of paper for the next plot operation.
If a program that defines several pages is to send some of the pages to a differentdevice, the program must create pages specifically for that device. For example, aprogram that sends PICTURE1 to both a work station and a plotter, must createtwo pages. Each page contains all the same drawing routines, but each must beassociated with a particular device.
In the program, creating the page and the routines that draw the picture for thepage must follow the device control routines (described later). An ASREAD orFSFRCE sends the page to the current device. Then, to send the picture to adifferent device, the program must select that device as the current one and createa new page with the same drawing routines, followed by the ASREAD or FSFRCEto send that page to the device.
| Creating a Page FSPCRT – Create a page. FSPCRT assigns a number to the page. You can usethe number in other routines to select, query, or delete the page later in theprogram. The default page number is zero, which is assigned when the program isinitialized by FSINIT or reinitialized by FSRNIT.
A page is specified in terms of the physical rows and columns it uses on the device(the rows and columns are ignored for the plotter).
Chapter 3. Using GDDM 3-45
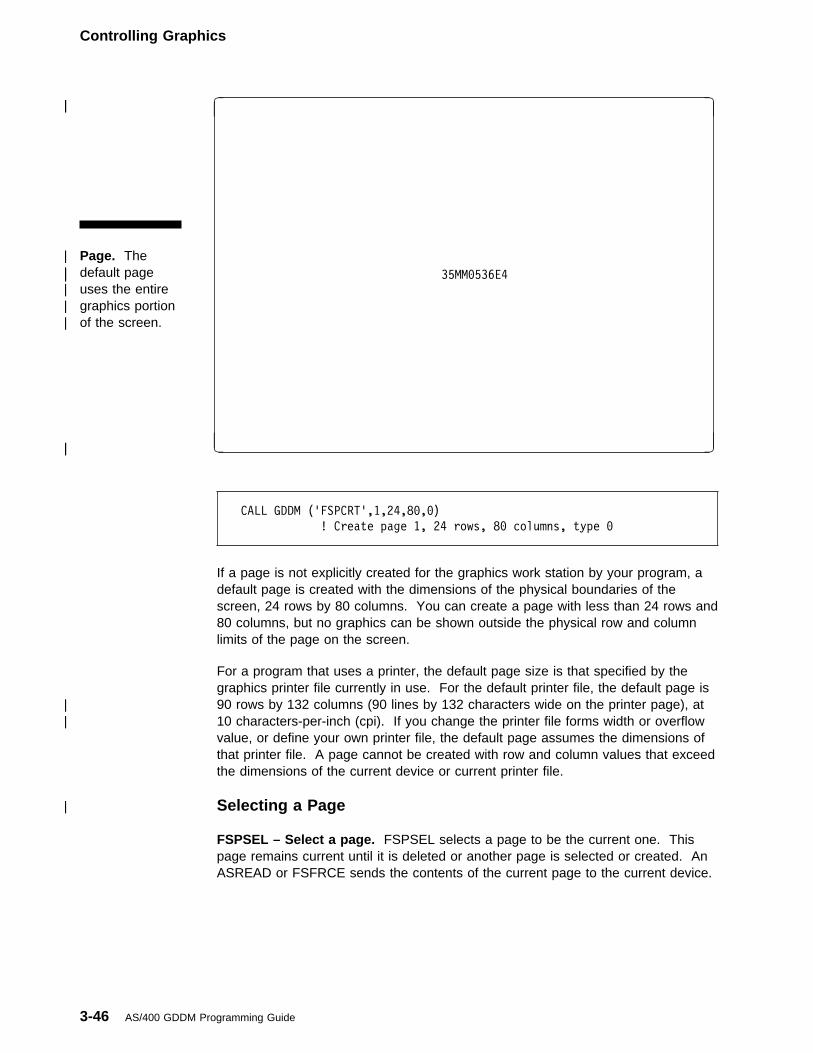
Controlling Graphics
| Page. The| default page| uses the entire| graphics portion| of the screen.
| �|
| 35MM�536E4
| �| �
CALL GDDM ('FSPCRT',1,24,8�,�)
! Create page 1, 24 rows, 8� columns, type �
If a page is not explicitly created for the graphics work station by your program, adefault page is created with the dimensions of the physical boundaries of thescreen, 24 rows by 80 columns. You can create a page with less than 24 rows and80 columns, but no graphics can be shown outside the physical row and columnlimits of the page on the screen.
For a program that uses a printer, the default page size is that specified by thegraphics printer file currently in use. For the default printer file, the default page is
| 90 rows by 132 columns (90 lines by 132 characters wide on the printer page), at| 10 characters-per-inch (cpi). If you change the printer file forms width or overflow
value, or define your own printer file, the default page assumes the dimensions ofthat printer file. A page cannot be created with row and column values that exceedthe dimensions of the current device or current printer file.
| Selecting a Page FSPSEL – Select a page. FSPSEL selects a page to be the current one. Thispage remains current until it is deleted or another page is selected or created. AnASREAD or FSFRCE sends the contents of the current page to the current device.
3-46 AS/400 GDDM Programming Guide
Controlling Graphics
| Clearing a Page FSPCLR – Clear the current page. FSPCLR clears all graphics fields from thecurrent page. The page exists as if it were being newly created; no graphics field,picture space, viewports, or graphics windows exist. (All of these other elements inthe graphics hierarchy are explained later.)
| Deleting a Page FSPDEL – Delete a page. When FSPDEL deletes a page, any graphics segmentsassociated with the page are also deleted. (Graphics segments are explainedlater.)
| Querying Page Information FSPQRY – Query the page. FSPQRY returns information about the specifiedpage, including default values if the page was created by default.
For the printer, the size of the page is returned. If FSPCRT has not been specifiedin the program, the default printer page is defined by the graphics printer file in use;however, the values returned to the FSPQRY routine may not match those of the
| current graphics printer file if a lines-per-inch (lpi) value other than 9 is specified.For more information on how the default page dimensions are calculated see“QPGDDM Printer File Considerations” on page 5-5.
FSQCPG – Query the current page. FSQCPG returns the number of the currentpage.
FSQUPG – Query a unique page number. FSQUPG returns the unique numberof an unused page. You can use this routine to avoid using a number that is beingused for an existing page; if you create a page with the number of another page,an error occurs.
The Graphics FieldYou can use the graphics field to define an area of the page where the program’spicture appears. The graphics field is specified by the position of its top left cornerand its depth and width, using row and column numbers.
Chapter 3. Using GDDM 3-47
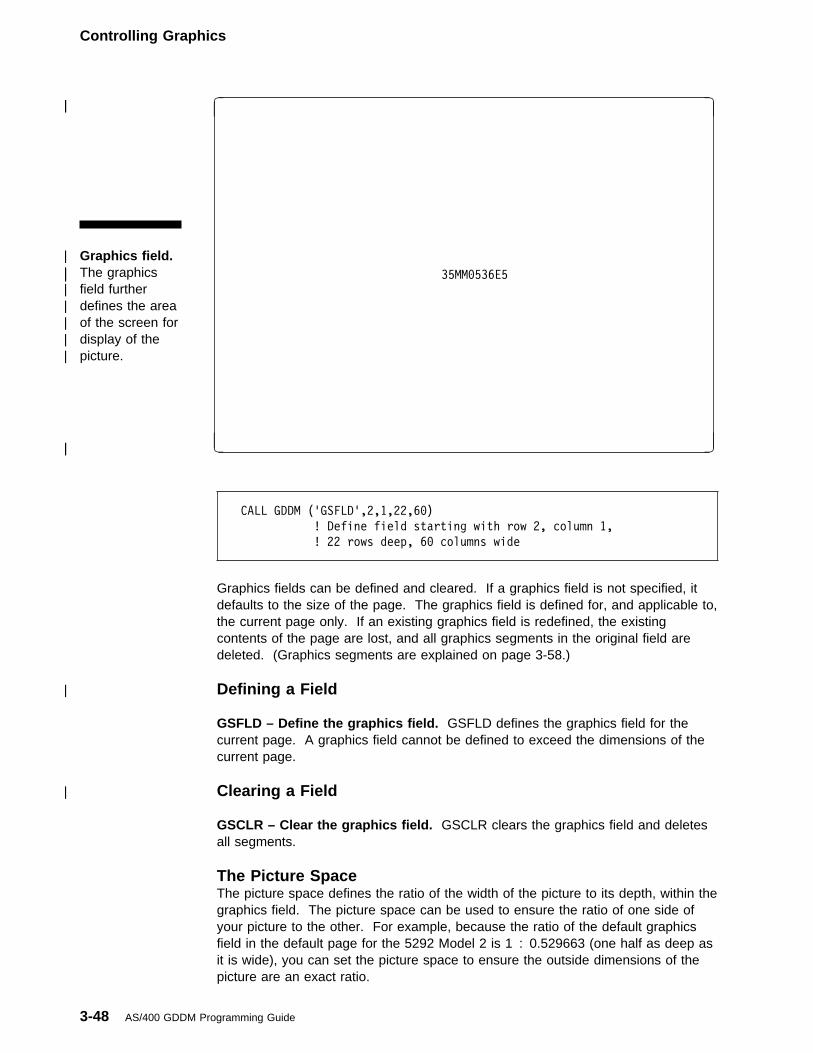
Controlling Graphics
| Graphics field.| The graphics| field further| defines the area| of the screen for| display of the| picture.
| �|
| 35MM�536E5
| �| �
CALL GDDM ('GSFLD',2,1,22,6�)
! Define field starting with row 2, column 1,
! 22 rows deep, 6� columns wide
Graphics fields can be defined and cleared. If a graphics field is not specified, itdefaults to the size of the page. The graphics field is defined for, and applicable to,the current page only. If an existing graphics field is redefined, the existingcontents of the page are lost, and all graphics segments in the original field aredeleted. (Graphics segments are explained on page 3-58.)
| Defining a Field GSFLD – Define the graphics field. GSFLD defines the graphics field for thecurrent page. A graphics field cannot be defined to exceed the dimensions of thecurrent page.
| Clearing a Field GSCLR – Clear the graphics field. GSCLR clears the graphics field and deletesall segments.
The Picture SpaceThe picture space defines the ratio of the width of the picture to its depth, within thegraphics field. The picture space can be used to ensure the ratio of one side ofyour picture to the other. For example, because the ratio of the default graphicsfield in the default page for the 5292 Model 2 is 1 : 0.529663 (one half as deep asit is wide), you can set the picture space to ensure the outside dimensions of thepicture are an exact ratio.
3-48 AS/400 GDDM Programming Guide
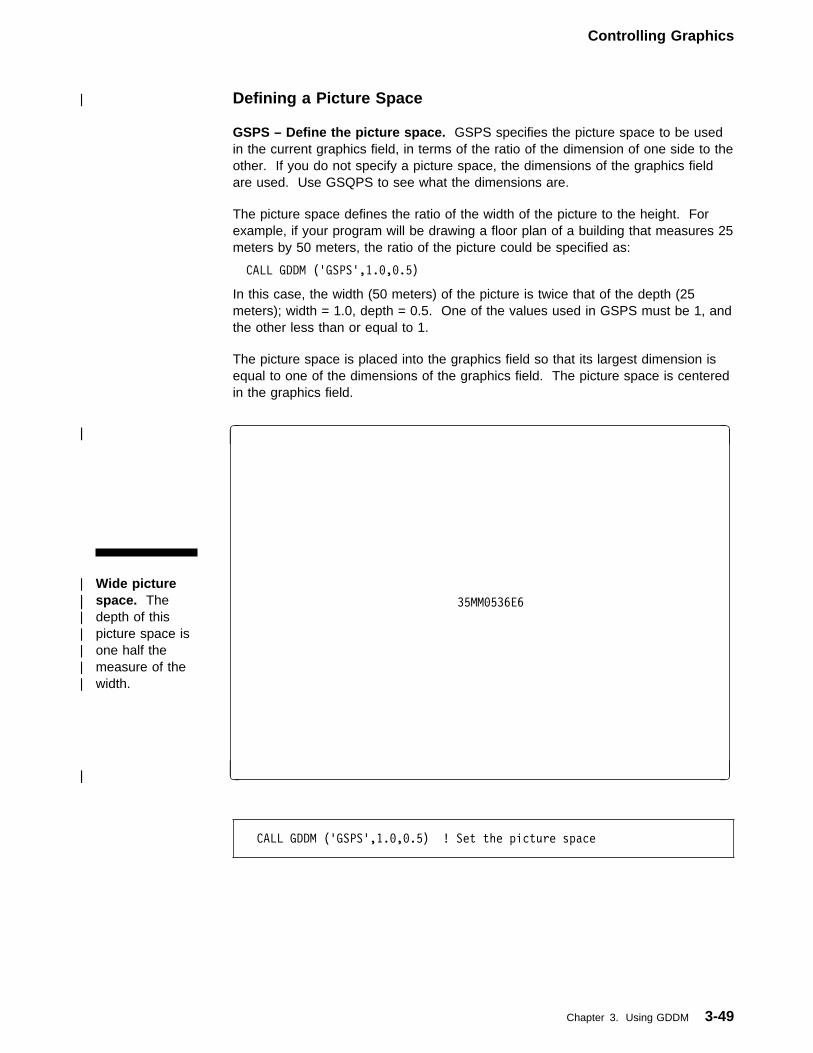
Controlling Graphics
| Defining a Picture Space GSPS – Define the picture space. GSPS specifies the picture space to be usedin the current graphics field, in terms of the ratio of the dimension of one side to theother. If you do not specify a picture space, the dimensions of the graphics fieldare used. Use GSQPS to see what the dimensions are.
The picture space defines the ratio of the width of the picture to the height. Forexample, if your program will be drawing a floor plan of a building that measures 25meters by 50 meters, the ratio of the picture could be specified as:
CALL GDDM ('GSPS',1.�,�.5)
In this case, the width (50 meters) of the picture is twice that of the depth (25meters); width = 1.0, depth = 0.5. One of the values used in GSPS must be 1, andthe other less than or equal to 1.
The picture space is placed into the graphics field so that its largest dimension isequal to one of the dimensions of the graphics field. The picture space is centeredin the graphics field.
| Wide picture| space. The| depth of this| picture space is| one half the| measure of the| width.
| �|
| 35MM�536E6
| �| �
CALL GDDM ('GSPS',1.�,�.5) ! Set the picture space
Chapter 3. Using GDDM 3-49
Controlling Graphics
| Square picture| space. The| depth of this| picture space| equals the width.
| �|
| 35MM�536E7
| �| �
CALL GDDM ('GSPS',1.�,1.�) ! Set the picture space
GSQPS – Query the picture space. GSQPS returns the value of the picturespace definition, in terms of the ratio of one side to the other.
The ViewportYou can use the viewport to show individual pictures in different parts of a singlepicture area. The graphics field and the picture space are elements in thehierarchy that define the location and dimensions on the page of the picture when itis displayed. Only one graphics field and picture space can be specified per page,but more than one viewport can be specified.
The picture space defines where on the graphics field the picture originates, as wellas the ratio of the picture’s dimensions. The viewport specifies where on thepicture space the picture is shown. If you do not specify a viewport, the entirepicture space is used.
A viewport does not have to be specified in your program unless you want to showtwo pictures at the same time. To do that, your program must:
1. Create a page for the current device.2. Specify a viewport for the graphics field and picture space (the graphics field
and the picture space can be defined or allowed to default), and then constructthe first picture.
3. Specify a new viewport, and construct the second picture.4. Send the page to the current device with ASREAD or FSFRCE.
3-50 AS/400 GDDM Programming Guide
Controlling Graphics
| Values used to| set the| viewport. The| viewport is| defined with| floating-point| values that| correspond to| the values used| to set the picture| space.
| �|
| 35MM�536E8
| �| �
Chapter 3. Using GDDM 3-51
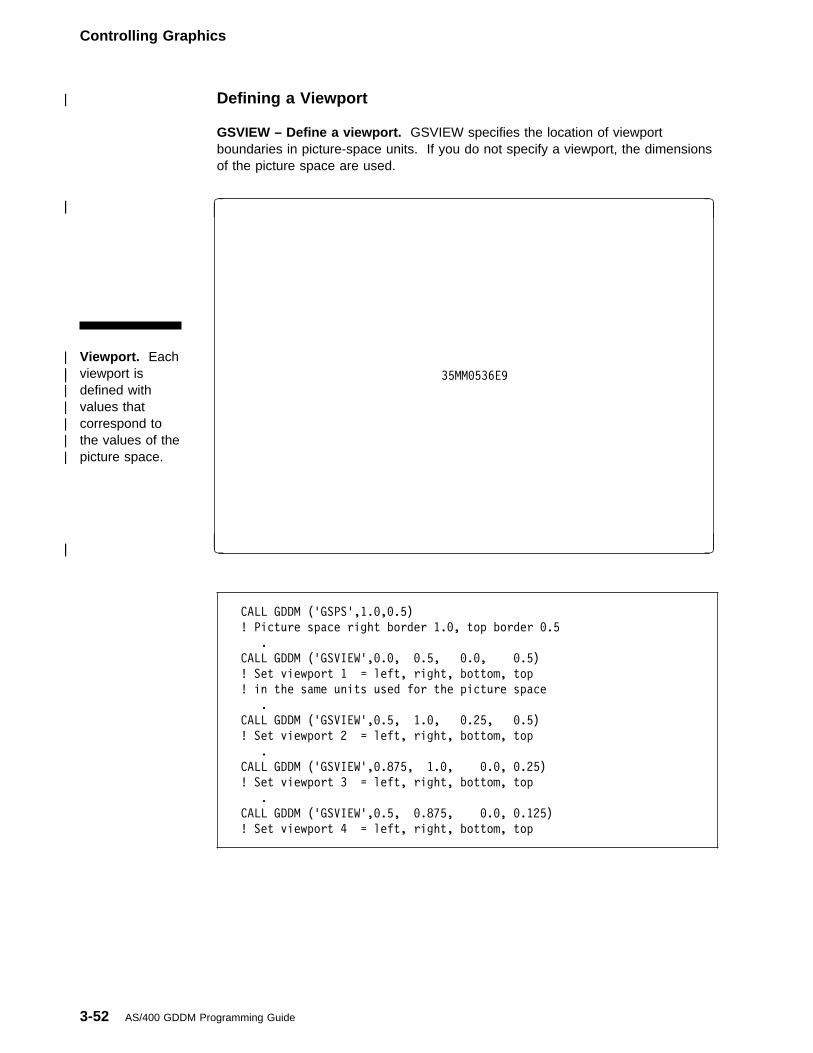
Controlling Graphics
| Defining a Viewport GSVIEW – Define a viewport. GSVIEW specifies the location of viewportboundaries in picture-space units. If you do not specify a viewport, the dimensionsof the picture space are used.
| Viewport. Each| viewport is| defined with| values that| correspond to| the values of the| picture space.
| �|
| 35MM�536E9
| �| �
CALL GDDM ('GSPS',1.�,�.5)
! Picture space right border 1.�, top border �.5
.
CALL GDDM ('GSVIEW',�.�, �.5, �.�, �.5)
! Set viewport 1 = left, right, bottom, top
! in the same units used for the picture space
.
CALL GDDM ('GSVIEW',�.5, 1.�, �.25, �.5)
! Set viewport 2 = left, right, bottom, top
.
CALL GDDM ('GSVIEW',�.875, 1.�, �.�, �.25)
! Set viewport 3 = left, right, bottom, top
.
CALL GDDM ('GSVIEW',�.5, �.875, �.�, �.125)
! Set viewport 4 = left, right, bottom, top
3-52 AS/400 GDDM Programming Guide
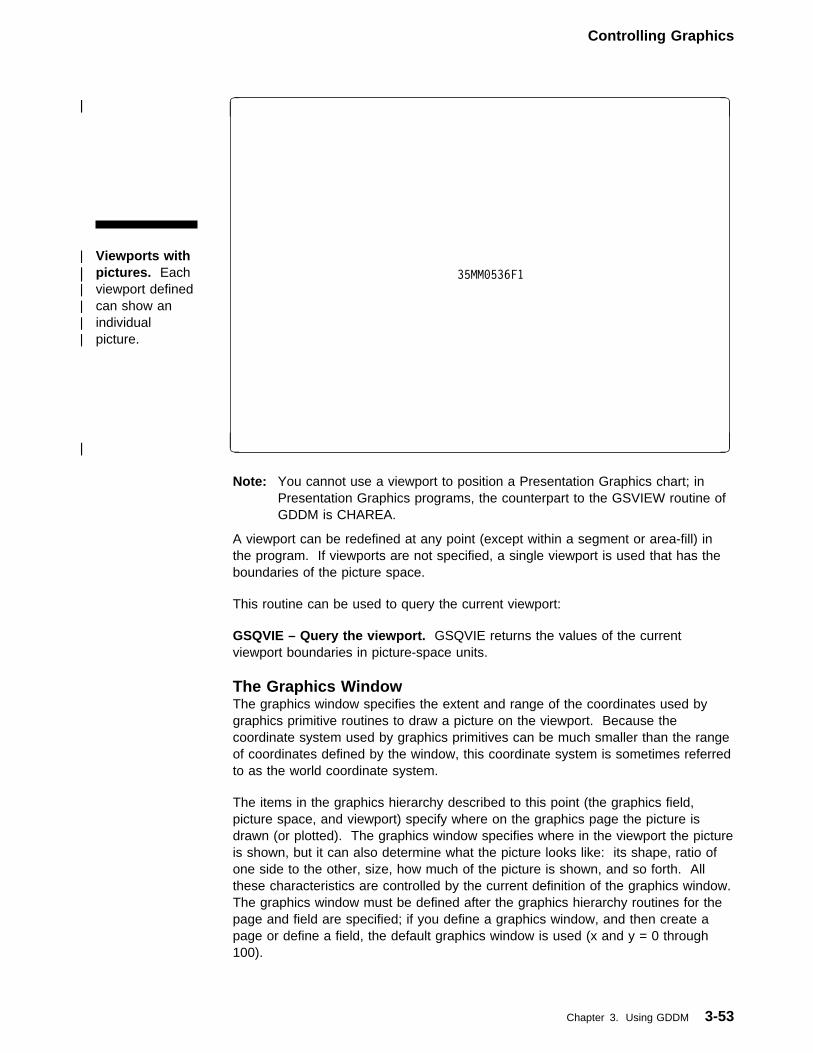
Controlling Graphics
| Viewports with| pictures. Each| viewport defined| can show an| individual| picture.
| �|
| 35MM�536F1
| �| �
Note: You cannot use a viewport to position a Presentation Graphics chart; inPresentation Graphics programs, the counterpart to the GSVIEW routine ofGDDM is CHAREA.
A viewport can be redefined at any point (except within a segment or area-fill) inthe program. If viewports are not specified, a single viewport is used that has theboundaries of the picture space.
This routine can be used to query the current viewport:
GSQVIE – Query the viewport. GSQVIE returns the values of the currentviewport boundaries in picture-space units.
The Graphics WindowThe graphics window specifies the extent and range of the coordinates used bygraphics primitive routines to draw a picture on the viewport. Because thecoordinate system used by graphics primitives can be much smaller than the rangeof coordinates defined by the window, this coordinate system is sometimes referredto as the world coordinate system.
The items in the graphics hierarchy described to this point (the graphics field,picture space, and viewport) specify where on the graphics page the picture isdrawn (or plotted). The graphics window specifies where in the viewport the pictureis shown, but it can also determine what the picture looks like: its shape, ratio ofone side to the other, size, how much of the picture is shown, and so forth. Allthese characteristics are controlled by the current definition of the graphics window.The graphics window must be defined after the graphics hierarchy routines for thepage and field are specified; if you define a graphics window, and then create apage or define a field, the default graphics window is used (x and y = 0 through100).
Chapter 3. Using GDDM 3-53
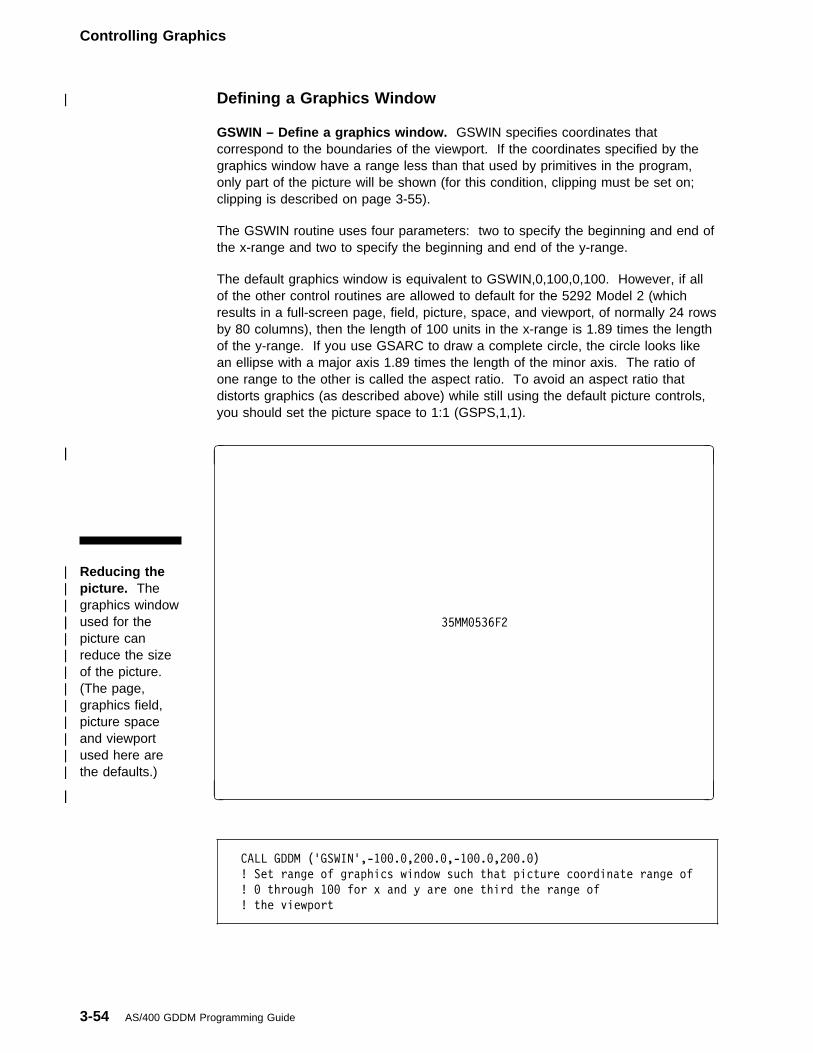
Controlling Graphics
| Defining a Graphics Window GSWIN – Define a graphics window. GSWIN specifies coordinates thatcorrespond to the boundaries of the viewport. If the coordinates specified by thegraphics window have a range less than that used by primitives in the program,only part of the picture will be shown (for this condition, clipping must be set on;clipping is described on page 3-55).
The GSWIN routine uses four parameters: two to specify the beginning and end ofthe x-range and two to specify the beginning and end of the y-range.
The default graphics window is equivalent to GSWIN,0,100,0,100. However, if allof the other control routines are allowed to default for the 5292 Model 2 (whichresults in a full-screen page, field, picture, space, and viewport, of normally 24 rowsby 80 columns), then the length of 100 units in the x-range is 1.89 times the lengthof the y-range. If you use GSARC to draw a complete circle, the circle looks likean ellipse with a major axis 1.89 times the length of the minor axis. The ratio ofone range to the other is called the aspect ratio. To avoid an aspect ratio thatdistorts graphics (as described above) while still using the default picture controls,you should set the picture space to 1:1 (GSPS,1,1).
| Reducing the| picture. The| graphics window| used for the| picture can| reduce the size| of the picture.| (The page,| graphics field,| picture space| and viewport| used here are| the defaults.)
| �|
| 35MM�536F2
| �| �
CALL GDDM ('GSWIN',-1��.�,2��.�,-1��.�,2��.�)
! Set range of graphics window such that picture coordinate range of
! � through 1�� for x and y are one third the range of
! the viewport
3-54 AS/400 GDDM Programming Guide
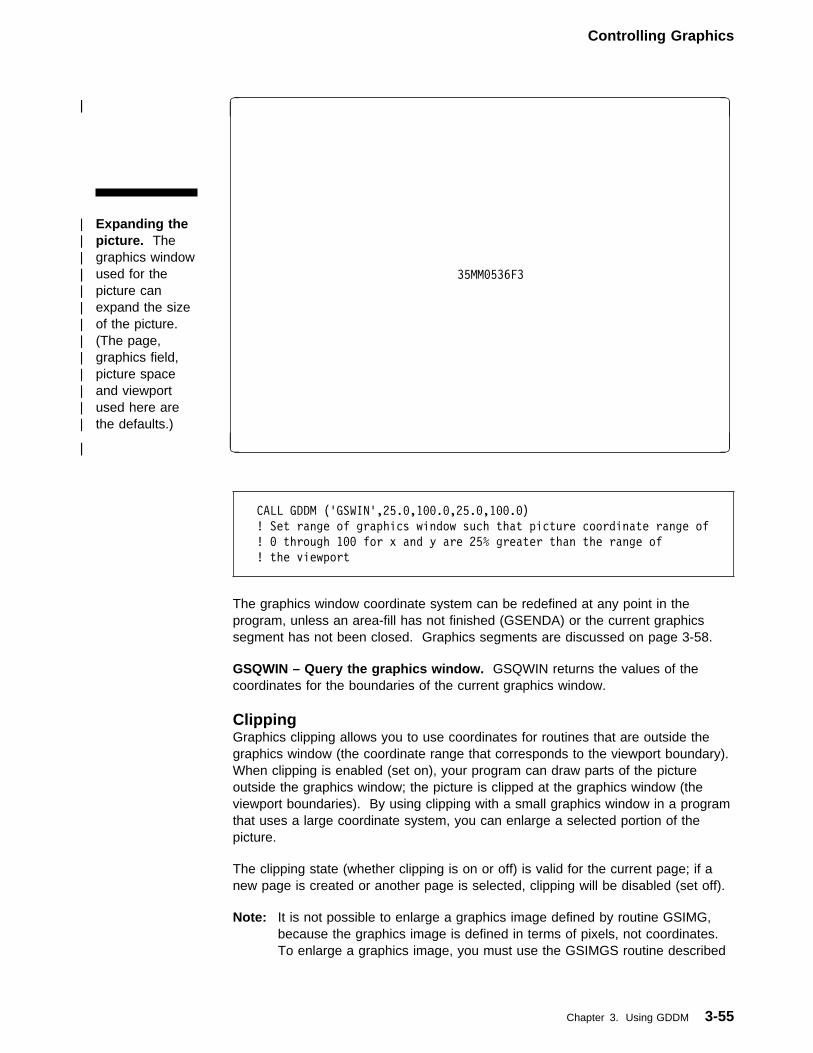
Controlling Graphics
| Expanding the| picture. The| graphics window| used for the| picture can| expand the size| of the picture.| (The page,| graphics field,| picture space| and viewport| used here are| the defaults.)
| �|
| 35MM�536F3
| �| �
CALL GDDM ('GSWIN',25.�,1��.�,25.�,1��.�)
! Set range of graphics window such that picture coordinate range of
! � through 1�� for x and y are 25% greater than the range of
! the viewport
The graphics window coordinate system can be redefined at any point in theprogram, unless an area-fill has not finished (GSENDA) or the current graphicssegment has not been closed. Graphics segments are discussed on page 3-58.
GSQWIN – Query the graphics window. GSQWIN returns the values of thecoordinates for the boundaries of the current graphics window.
ClippingGraphics clipping allows you to use coordinates for routines that are outside thegraphics window (the coordinate range that corresponds to the viewport boundary).When clipping is enabled (set on), your program can draw parts of the pictureoutside the graphics window; the picture is clipped at the graphics window (theviewport boundaries). By using clipping with a small graphics window in a programthat uses a large coordinate system, you can enlarge a selected portion of thepicture.
The clipping state (whether clipping is on or off) is valid for the current page; if anew page is created or another page is selected, clipping will be disabled (set off).
Note: It is not possible to enlarge a graphics image defined by routine GSIMG,because the graphics image is defined in terms of pixels, not coordinates.To enlarge a graphics image, you must use the GSIMGS routine described
Chapter 3. Using GDDM 3-55
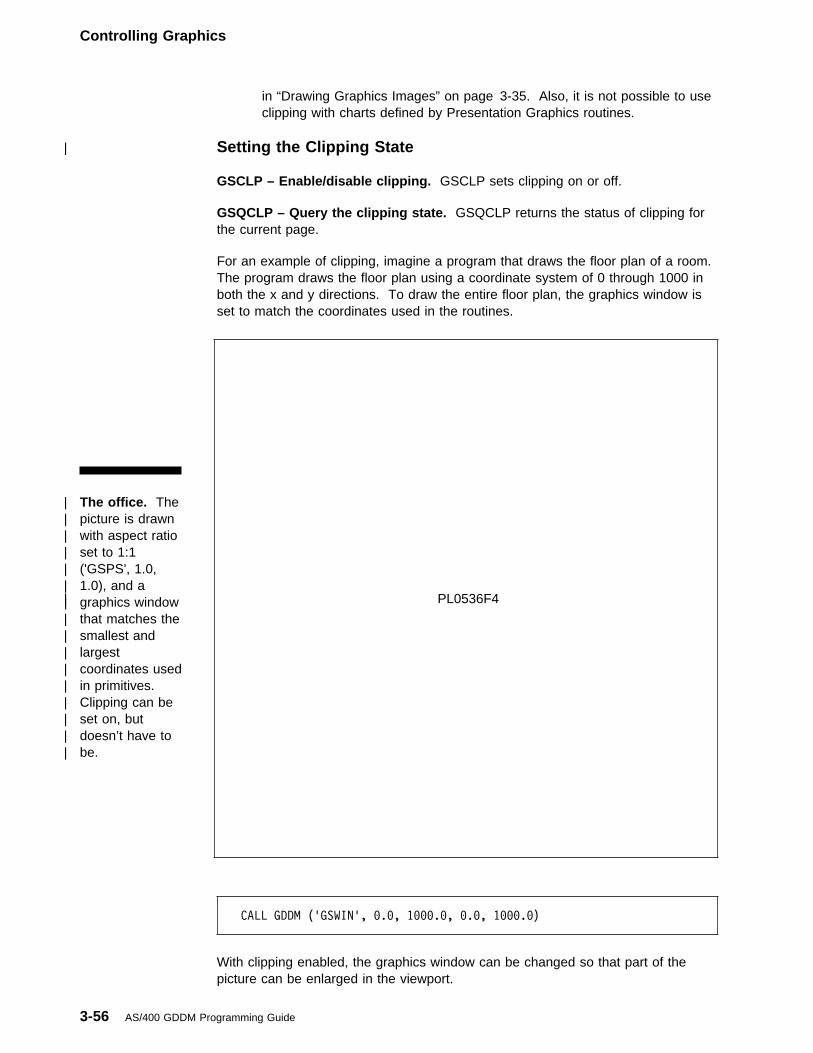
Controlling Graphics
in “Drawing Graphics Images” on page 3-35. Also, it is not possible to useclipping with charts defined by Presentation Graphics routines.
| Setting the Clipping State GSCLP – Enable/disable clipping. GSCLP sets clipping on or off.
GSQCLP – Query the clipping state. GSQCLP returns the status of clipping forthe current page.
For an example of clipping, imagine a program that draws the floor plan of a room.The program draws the floor plan using a coordinate system of 0 through 1000 inboth the x and y directions. To draw the entire floor plan, the graphics window isset to match the coordinates used in the routines.
| The office. The| picture is drawn| with aspect ratio| set to 1:1| ('GSPS', 1.0,| 1.0), and a| graphics window| that matches the| smallest and| largest| coordinates used| in primitives.| Clipping can be| set on, but| doesn’t have to| be.
| PL0536F4
CALL GDDM ('GSWIN', �.�, 1���.�, �.�, 1���.�)
With clipping enabled, the graphics window can be changed so that part of thepicture can be enlarged in the viewport.
3-56 AS/400 GDDM Programming Guide
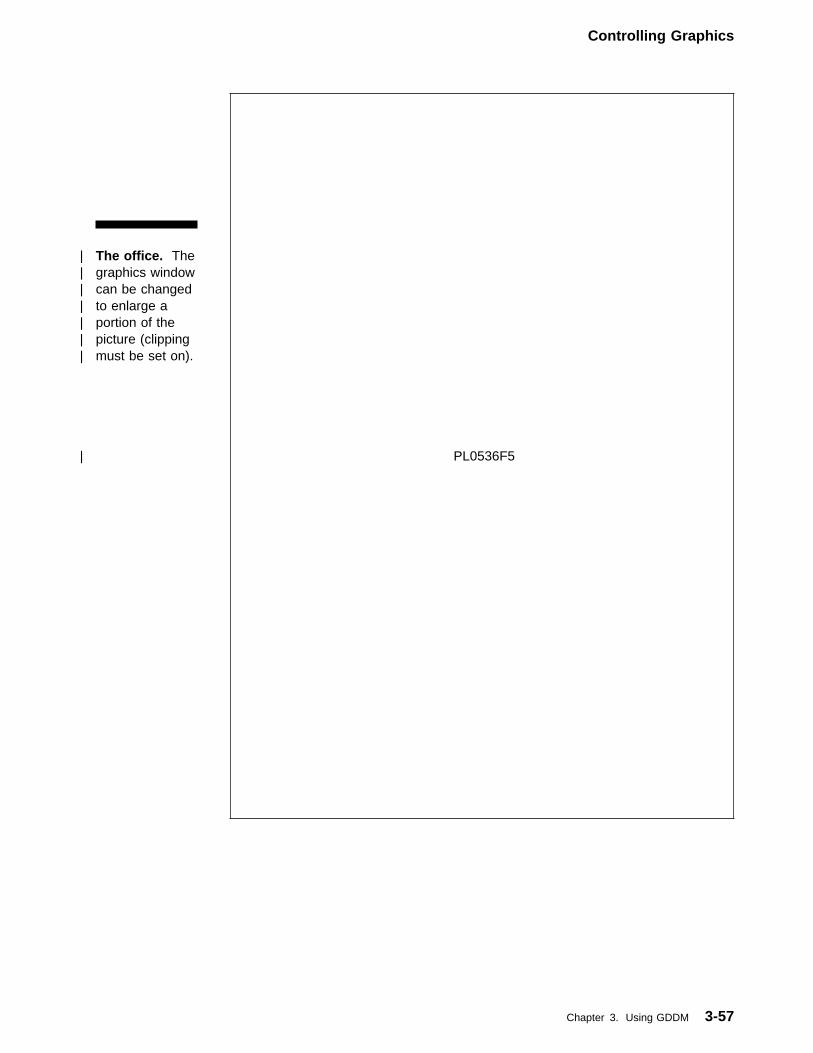
Controlling Graphics
| The office. The| graphics window| can be changed| to enlarge a| portion of the| picture (clipping| must be set on).
| PL0536F5
Chapter 3. Using GDDM 3-57
Controlling Graphics
The Graphics SegmentThe graphics segment groups logically-related primitives and their attributes.
Like pages, graphics segments are assigned numbers, and can be created anddeleted. Unlike pages, they cannot be changed once they have been created andclosed.
When a graphics segment is created, each attribute for primitives is set to itsdefault value.
Graphics segments can be useful when you want part of the picture to be erased atsome point after being drawn, or when you want only part of the picture to beupdated. You can put your entire picture into one graphics segment, or you canput parts of your picture into several of them.
Graphics segments are associated with a specific page. They can be opened,closed, deleted, or queried.
| Creating a Graphics Segment GSSEG – Create a graphics segment. GSSEG opens a graphics segment withthe specified identifier. Identifier 32767 is reserved and cannot be used.
When a graphics segment is opened, all attributes are given default values;opening a new graphics segment might be easier than resetting each individualattribute. The graphics window and viewport cannot be changed while the graphicssegment is current.
Note: You cannot explicitly open a graphics segment when you are drawing aPresentation Graphics chart in a picture space; Presentation Graphicsmanages them implicitly.
| Closing a Graphics Segment GSSCLS – Close a graphics segment. GSSCLS closes the current graphicssegment. The current graphics segment must be closed before a new one isopened; once closed, it cannot be reopened.
| Deleting a Graphics Segment GSSDEL – Delete a graphics segment. GSSDEL deletes the identified graphicssegment. When the graphics segment is deleted, the parts of the picture that weredrawn in the graphics segment are erased from the picture the next time anASREAD or FSFRCE routine sends the picture to a device.
3-58 AS/400 GDDM Programming Guide
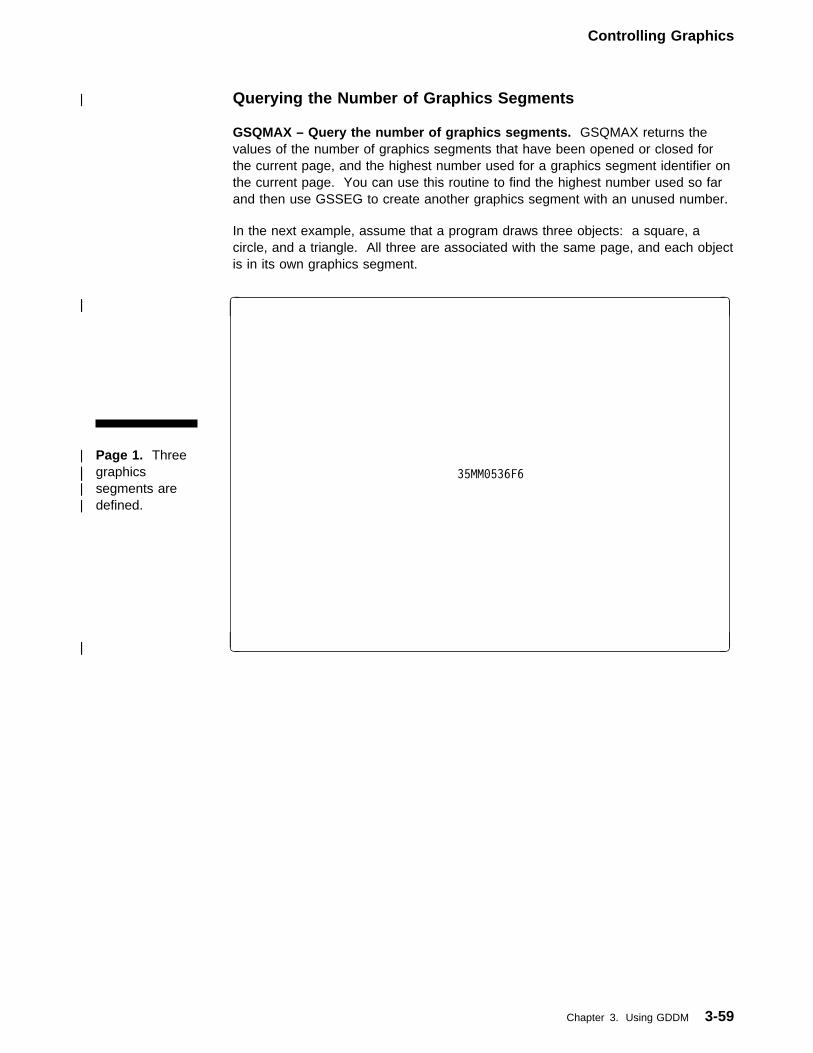
Controlling Graphics
| Querying the Number of Graphics Segments GSQMAX – Query the number of graphics segments. GSQMAX returns thevalues of the number of graphics segments that have been opened or closed forthe current page, and the highest number used for a graphics segment identifier onthe current page. You can use this routine to find the highest number used so farand then use GSSEG to create another graphics segment with an unused number.
In the next example, assume that a program draws three objects: a square, acircle, and a triangle. All three are associated with the same page, and each objectis in its own graphics segment.
| Page 1. Three| graphics| segments are| defined.
| �|
| 35MM�536F6
| �| �
Chapter 3. Using GDDM 3-59
Controlling Graphics
CALL GDDM ('FSPCRT',1,�,�,�)
! Create page 1, using default depth, width, type
CALL GDDM ('GSSEG',1)
! Create graphics segment 1 for the picture of the square
.
(GDDM sets attributes for and draws first object, the square)
.
.
CALL GDDM ('GSSCLS')
! Close the current graphics segment (number 1)
CALL GDDM ('GSSEG',2)
! Create graphics segment 2, (resets all attributes for primitives)
.
(GDDM sets attributes for and draws second object, circle)
.
.
CALL GDDM ('GSSCLS')
! Close the current graphics segment (number 2)
CALL GDDM ('GSSEG',3)
! Create graphics segment 3, (resets all attributes for primitives)
.
(GDDM sets attributes for and draws third object, triangle)
.
.
CALL GDDM ('GSSCLS')
! Close the current graphics segment (number 3)
CALL GDDM ('ASREAD',ATTYPE,ATTMOD,COUNT)
! Sends picture containing square, circle, and triangle
! to the display
3-60 AS/400 GDDM Programming Guide
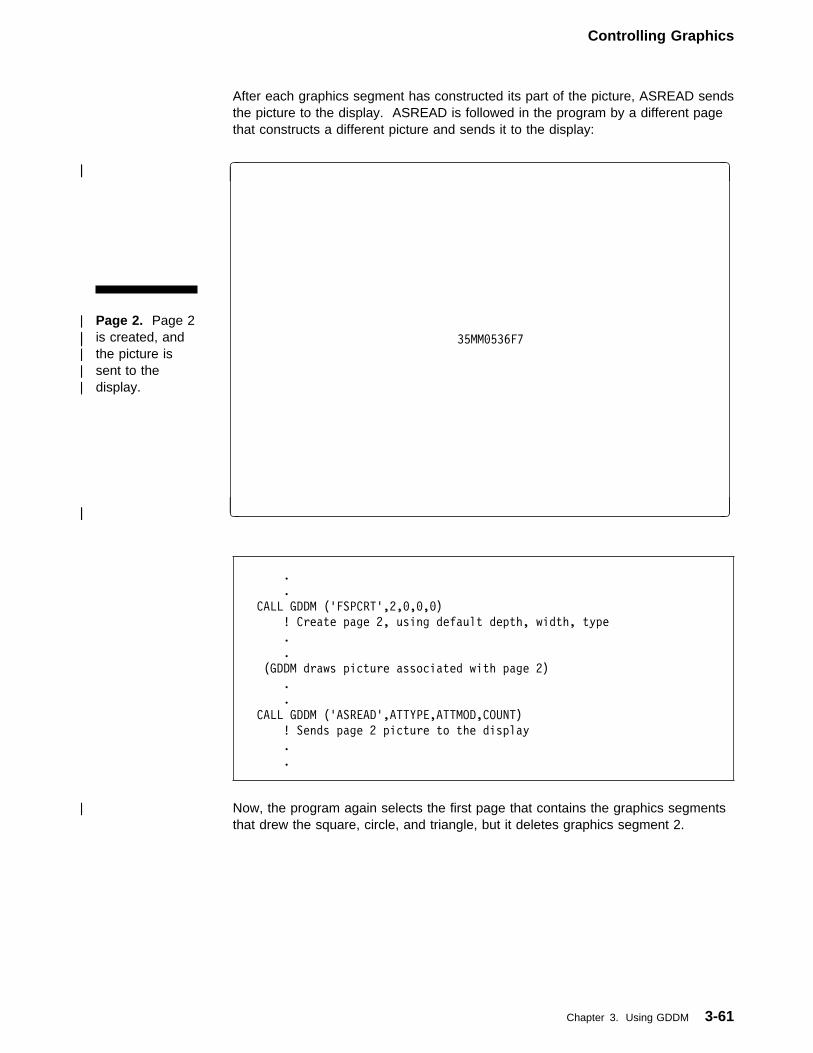
Controlling Graphics
After each graphics segment has constructed its part of the picture, ASREAD sendsthe picture to the display. ASREAD is followed in the program by a different pagethat constructs a different picture and sends it to the display:
| Page 2. Page 2| is created, and| the picture is| sent to the| display.
| �|
| 35MM�536F7
| �| �
.
.
CALL GDDM ('FSPCRT',2,�,�,�)
! Create page 2, using default depth, width, type
.
.
(GDDM draws picture associated with page 2)
.
.
CALL GDDM ('ASREAD',ATTYPE,ATTMOD,COUNT)
! Sends page 2 picture to the display
.
.
| Now, the program again selects the first page that contains the graphics segmentsthat drew the square, circle, and triangle, but it deletes graphics segment 2.
Chapter 3. Using GDDM 3-61
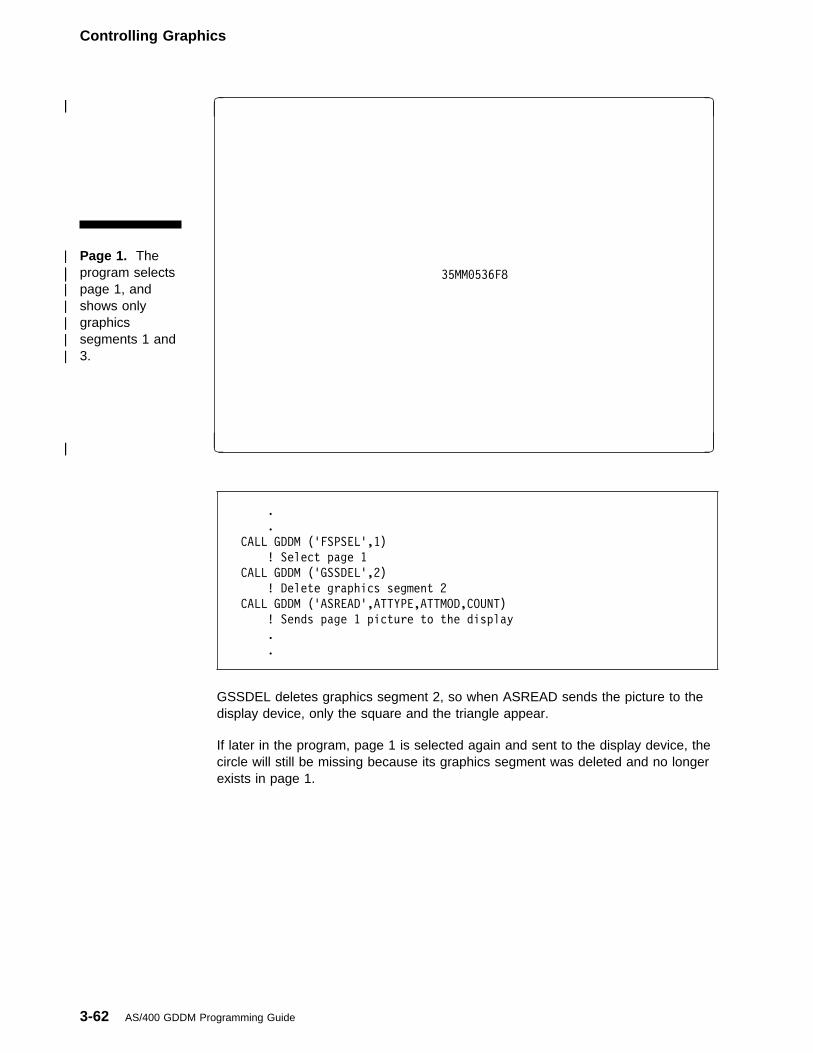
Controlling Graphics
| Page 1. The| program selects| page 1, and| shows only| graphics| segments 1 and| 3.
| �|
| 35MM�536F8
| �| �
.
.
CALL GDDM ('FSPSEL',1)
! Select page 1
CALL GDDM ('GSSDEL',2)
! Delete graphics segment 2
CALL GDDM ('ASREAD',ATTYPE,ATTMOD,COUNT)
! Sends page 1 picture to the display
.
.
GSSDEL deletes graphics segment 2, so when ASREAD sends the picture to thedisplay device, only the square and the triangle appear.
If later in the program, page 1 is selected again and sent to the display device, thecircle will still be missing because its graphics segment was deleted and no longerexists in page 1.
3-62 AS/400 GDDM Programming Guide
Controlling Graphics
Retained and Temporary DataGraphics data associated with a graphics segment is called retained data, eventhough graphics segments cannot be reopened like a page can. When you do notopen a graphics segment in your program, all elements of a picture constructed byGDDM routines are considered to be temporary data. Temporary data differs fromretained data (data associated with a graphics segment) in that it is lost after anASREAD sends that page to the display, or when one of the following routines isencountered in the program:
FSFRCE FSREST FSPCRT FSPSEL GSCLR
Also, temporary data cannot be saved with a graphics data format (GDF) file. GDFfiles are described on page 3-68.
If the program that drew the office floor plan was written so that all parts of thepicture were associated with a graphics segment except for the labels, the labelswould appear as part of the picture only when the graphics page is the current oneat the time of the ASREAD. The labels were defined outside a graphics segment,so they are temporary data.
Chapter 3. Using GDDM 3-63
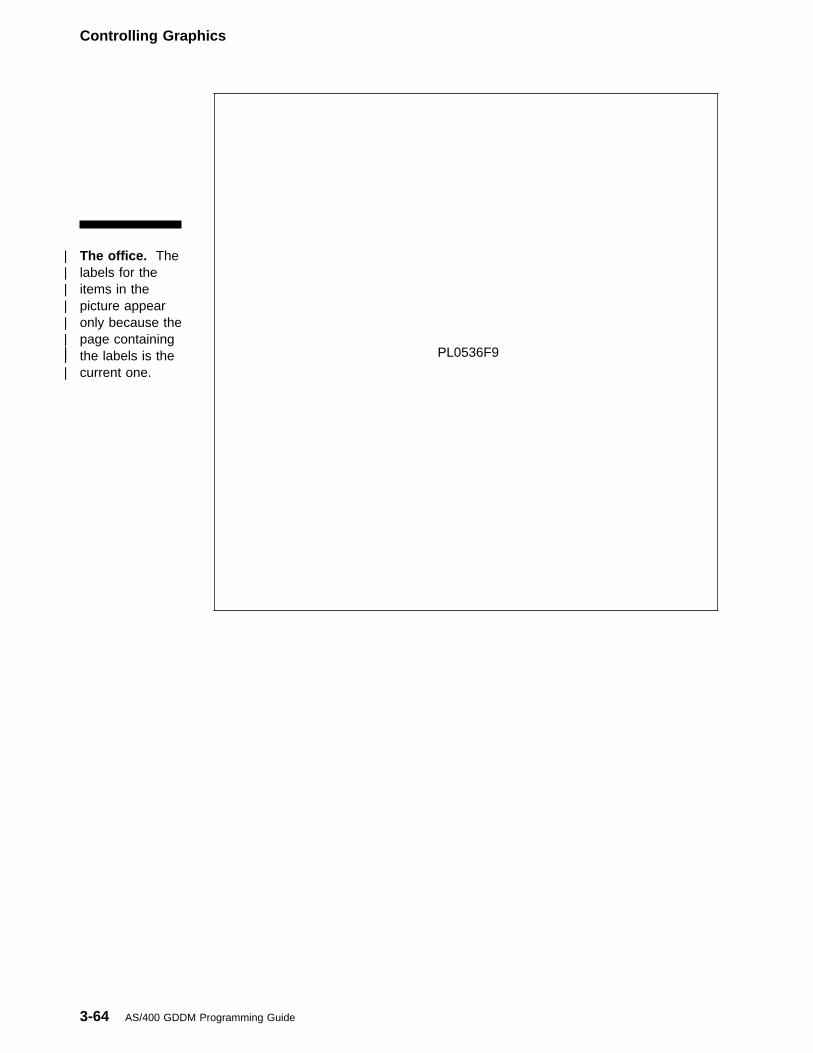
Controlling Graphics
| The office. The| labels for the| items in the| picture appear| only because the| page containing| the labels is the| current one.
| PL0536F9
3-64 AS/400 GDDM Programming Guide
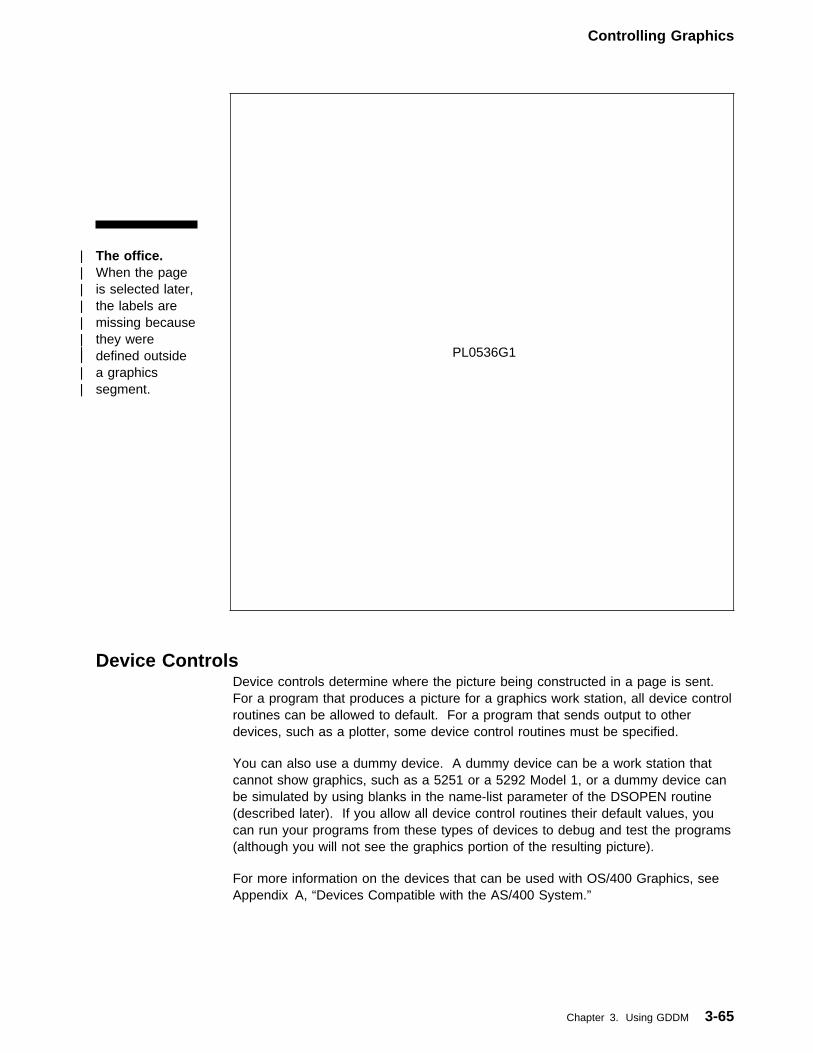
Controlling Graphics
| The office.| When the page| is selected later,| the labels are| missing because| they were| defined outside| a graphics| segment.
| PL0536G1
Device ControlsDevice controls determine where the picture being constructed in a page is sent.For a program that produces a picture for a graphics work station, all device controlroutines can be allowed to default. For a program that sends output to otherdevices, such as a plotter, some device control routines must be specified.
You can also use a dummy device. A dummy device can be a work station thatcannot show graphics, such as a 5251 or a 5292 Model 1, or a dummy device canbe simulated by using blanks in the name-list parameter of the DSOPEN routine(described later). If you allow all device control routines their default values, youcan run your programs from these types of devices to debug and test the programs(although you will not see the graphics portion of the resulting picture).
For more information on the devices that can be used with OS/400 Graphics, seeAppendix A, “Devices Compatible with the AS/400 System.”
Chapter 3. Using GDDM 3-65
Controlling Graphics
| Opening and Closing DevicesYou can use the following routines to identify and define or to eliminate a device:
DSOPEN – Open a device. DSOPEN makes a device known to the program. Adevice that is not the default device must be opened by DSOPEN to be identified tothe program as a valid destination for program output. To be used by the program,a device that has been opened with DSOPEN must be activated by DSUSE. Onlyone device can be active (current) at one time. If a device is in use, a DSDROProutine must be used to deactivate that device before DSUSE activates anotherthat has been opened with DSOPEN.
The default device is the work station from which the program was called.
DSCLS – Close a device. DSCLS closes the device and releases all resourcesdefined for it (including storage-displacing items, such as pages, symbol sets, andcolor tables).
After a device has been closed, it cannot be used again unless it is reopened withDSOPEN. If DSUSE is specified with the identifier of the closed device, an erroroccurs. To suspend the use of a device temporarily, use the DSDROP routine.
DSQUID – Query a unique device identifier. DSQUID returns the value of thenext available unused device identifier.
DSQUID can be specified to return the value of the next unused device identifier,and this value can then be passed to the DSOPEN routine to avoid conflicts withother device identifiers.
DSRNIT – Reinitialize a device. DSRNIT reinitializes a device to the status it hadafter it was opened. DSRNIT is equivalent to specifying a DSCLS followed by aDSOPEN.
| Using DevicesTo be used by the program, the previously-opened device must be activated byDSUSE. If a device is in use (except for the default device), a DSDROP routinemust be used to deactivate it before DSUSE activates another. Only one devicecan be active at a time.
The following routines control the device usage:
DSUSE – Specify device usage. DSUSE activates the device for usage. Thedevice must have already been opened by DSOPEN.
DSDROP – Discontinue device usage. DSDROP specifies that the device is nolonger the current device. None of the resources for the device are released(pages and symbol sets). The device can be restored to use by a DSUSE routine.
DSQUSE – Query device usage. DSQUSE returns the identifier of the currentdevice. Additional information about the current device can be returned by theFSQDEV routine (described in the next section).
3-66 AS/400 GDDM Programming Guide
Controlling Graphics
| Querying the Device CharacteristicsThe following routines can be used in a program to retrieve device information:
DSQDEV – Query specific device characteristics. DSQDEV returns informationabout the specified device. The information is the same as that specified when thedevice was opened, or is information about the default device.
FSQDEV – Query device characteristics. FSQDEV returns information about thecurrent device. The device identifier of the current device can be returned by theDSQUSE routine.
| Sounding the Device AlarmYou can specify that the program sounds the alarm on the current device (it mustbe a graphics work station) when the current page is sent to the screen for display.
FSALRM – Sound the device alarm. FSALRM sounds the device alarm when anASREAD or FSFRCE routine is encountered. The alarm can be used to alert theuser when the current page is displayed.
Controlling Graphics: SummaryThe part of this chapter you have just finished reading (the second section ofChapter 3, “Using GDDM”) showed you the GDDM routines you can use to control:
The program, including the graphics environment and error-handling
Displaying the picture
The characteristics of the items in the graphics hierarchy
The devices used by the graphics program.
The program must initialize the graphics environment before any graphics routinescan be called. You can add statements in your program to control the handling oferrors that occur in the program. In your program you can control the point atwhich the current page is sent to the current device.
You can use the items in the graphics hierarchy to control the placement and lookof the picture when it is sent to the device. The page is the unit of display that issent to the device, and its size can be defined. The graphics field further definesthe size of the picture on the page, and the picture space sets the ratio of one sideof the picture to the other in the graphics field. The viewports define which parts ofthe picture space are used for pictures, and the graphics window determines (withclipping) how much of the picture is shown in the viewport. Graphics segmentsgroup together primitives in the program that can be later deleted from the page.
Device control routines can be used to select which device is the current one.More information about the device control routines can be found in Appendix A,“Devices Compatible with the AS/400 System.”
The next section, “Using Graphics Data Format Files,” shows you how the graphicsdata format file can be used to capture an OS/400 Graphics picture. The capturedpicture can be displayed on the AS/400 System or sent to another system fordisplay, without running the program that generated the picture.
Chapter 3. Using GDDM 3-67
Using GDF Files
Using Graphics Data Format FilesWhen your application program uses GDDM routines to draw a picture, an internalgraphics data format file is generated. It is this graphics data that the AS/400System converts to a data stream appropriate for interpretation by the graphicswork station (or an associated device), or by a work station printer capable ofgraphics.
GDDM can capture the graphics data format (GDF) file. The GDF can be:
| Saved in a database file. The GDF can be retrieved from the database file and| displayed or plotted at any time. This saves the processing time necessary to
generate the picture each time the program is run.
Sent to another system or device for interpretation. The GDDM programproduct on the System/370 family of data processing equipment can interpretGDF, and software is available or can be written for interpreting GDF with othersystems.
Produced on the System/370 or System/36 (from BGU) families, or from theAS/400 Business Graphics Utility, interpreted by the AS/400 System and theresulting chart or picture produced on an AS/400 graphics-capable device.
The limitations for using GDF are that the picture held as a GDF cannot be alteredor changed (the program must be changed and executed to generate a new GDF),and that the transition from program output to GDF to picture can sometimeschange the look of the picture (its aspect ratio, for example), and charactersgenerated by a display file cannot be included in the GDF; only the graphics portionof the picture is saved.
Before you retrieve the GDF, you must specify that the output of the program willbe sent to a dummy device (for more information about dummy device support, see“Non-Graphics Devices” on page A-12).
| Retrieving Graphics Data GSGETS – Start retrieving graphics data. GSGETS identifies the graphicssegments of the current page whose graphics data will be captured.
GSGET – Retrieve graphics data. GSGET puts the graphics data into a variable| in your program. The GDF can then be written by the program to a database file.
GSGETE – End retrieving graphics data. GSGETE ends the retrieval operationstarted by GSGETS. For a program that retrieves the GDF for one page and thenterminates, GSGETE can be omitted.
| Drawing a Picture with a Graphics Data Format File GSPUT – Draw data from a graphics data format file. GSPUT converts theGDF back to a picture that can be displayed or plotted.
The GDF routines work together. After the GDDM (or Presentation Graphics)routines have been processed for a program using dummy device support, theGSGETS routine identifies the graphics segments of the current page whosegraphics data will be captured. Presentation Graphics manages its own graphicssegments, so GSGETS should specify that they all are to be retrieved.
3-68 AS/400 GDDM Programming Guide
Using GDF Files
GSGET retrieves the graphics data. If the buffer (the program variable) is largeenough to contain the entire GDF, the length value of the GDF is returned in aparameter of GSGETS. If the buffer is not large enough, you can use GSGET in a
| loop that writes the graphics data from the buffer to a database file and checks the| data length each time through the loop. When the data length is zero, the loop can
end. For example:
���1� CALL GDDM ('FSINIT') ! Initialize GDDM
���2� OPTION BASE 1 ! Set subscript base
���3� REM ������������ Dummy device routines ����������������������
���4� INTEGER PLST ! Declare integer
���5� DIM PLST(1) : PLST(1) = � ! Dimension, assign value
���6� DIM NLST$(1) : NLST$(1) = ' ' ! Dimension, assign value
���7� CALL GDDM ('DSOPEN',2,1,'5292M2 ',�,PLST(),1,NLST$(1))
���8� ! Open device 2 of family 1 named 5292M2, using no processing
���9� ! options in the PLST and dummy device name ' ' in the NLST$
��1�� CALL GDDM ('DSUSE',1,2) ! Use device 2 as current dev
��11� REM ������������ Open file and graphics segment �������������������
��12� OPEN #1�: "NAME=GDF,LIB=YOURLIB,FORMAT", OUTPUT ! Open file
��13� CALL GDDM('GSSEG',1) ! Open graphics segment (if not PGR)
.
(Execute graphics program)
.
��53� CALL GDDM('GSSCLS') ! Close graphics segment
��54� REM ������������� Retrieve graphics data ��������������������
��55� INTEGER GDFL, BUFLENG ! Declare integers
��56� DIM ARRAY(1): INTEGER ARRAY ! Declare array
��57� DIM BUFF$�255 ! Dimension char variable
��58� BUFLENG = 255 ! Set buffer length
��59� ARRAY(1) = � ! Set element 1
��6�� CALL GDDM('GSGETS',1,ARRAY()) ! Start GDF retrieve
��61� LOOP: CALL GDDM('GSGET',BUFLENG,BUFF$,GDFL)
��62� IF GDFL > � THEN WRITE #1�, USING 63�: BUFF$ ELSE GOTO 65�
��63� FORM C 255
��64� GOTO LOOP
��65� CALL GDDM ('FSTERM') ! Terminate GDDM
��66� STOP ! Stop execution
��67� END ! End BASIC program
BASIC programs are limited to character variables of a maximum 255 bytes.Because the input buffer is a character variable, the GDF has a record length of255. Therefore, the file being used to hold the GDF should have a record length of255 also.
GSGETE ends the capture of the graphics data. In a program that captures thegraphics data, no ASREAD routine is necessary. There is no GSGETE in thisprogram as only one page is being retrieved (the default page, graphics segment1).
GSPUT is used in a different program to draw the graphics data saved earlier:
���1� CALL GDDM ('FSINIT') ! Initialize GDDM
���2� OPTION BASE 1
���3� INTEGER ATTYPE,ATMOD,COUNT,CTL,LENG,VSTRING
���4� DIM BUFF$�255
���5� REM �������������� Open file ����������������������������������
���6� OPEN #1�: "NAME=GDF,LIB=yourlib,FORMAT", INPUT
���7� REM ���������� Set picture characteristics ����������������������
Chapter 3. Using GDDM 3-69
Using GDF Files
���8� READ #1�, USING 1��: ORD$,LNG$,TYPE,XLO,XHI,YLO,YHI
���9� ! Read the first record of the GDF
��1�� FORM C 1,C 1,B 2,B 2,B 2,B 2,B 2
��11� ! Set format to 1-byte character and 2-byte binary
��12� CALL GDDM('GSWIN',XLO,XHI,YLO,YHI)
��13� ! Set picture space to picture space used in GDF
��14� XD = ABS(XHI - XLO): YD = ABS(YHI - YLO)
��15� IF XD <= YD THEN CALL GDDM('GSPS',XD/YD,1.�) ELSE CALL GDDM('GS&
&PS',1.�,YD/XD)
��16� REM ����������� Put records from GDF ��������������������
��17� CTL = 2 : LENG = 255
��18� REREAD #1�, USING 21�: BUFF$ ! Read file again
��19� LOOP: CALL GDDM('GSPUT',CTL,LENG,BUFF$) ! Put GDF
��2�� READ #1�, USING 21�: BUFF$ EOF 24� ! until empty
��21� FORM C 255
��22� GOTO LOOP
��23� REM ������ Send picture to display and terminate ����������������
��24� CALL GDDM ('ASREAD',ATTYPE,ATMOD,COUNT) ! Display picture
��25� CALL GDDM ('FSTERM') ! Terminate
��26� STOP ! Stop execution
��27� END ! End BASIC program
The program reads the first record of the GDF and uses the graphics windowvalues found there to set the current graphics window and picture space (the GDFsets its own graphics window using x and y coordinates that can be as high as32,767).
GSPUT draws the graphics data and when an ASREAD or FSFRCE routine isencountered, the picture is sent to the display device.
More information about the GDF routines and the format of GDF files can be found| in the GDDM Programming Reference manual. The following example shows a
400-byte record contained within a small GDF file:
3-70 AS/400 GDDM Programming Guide
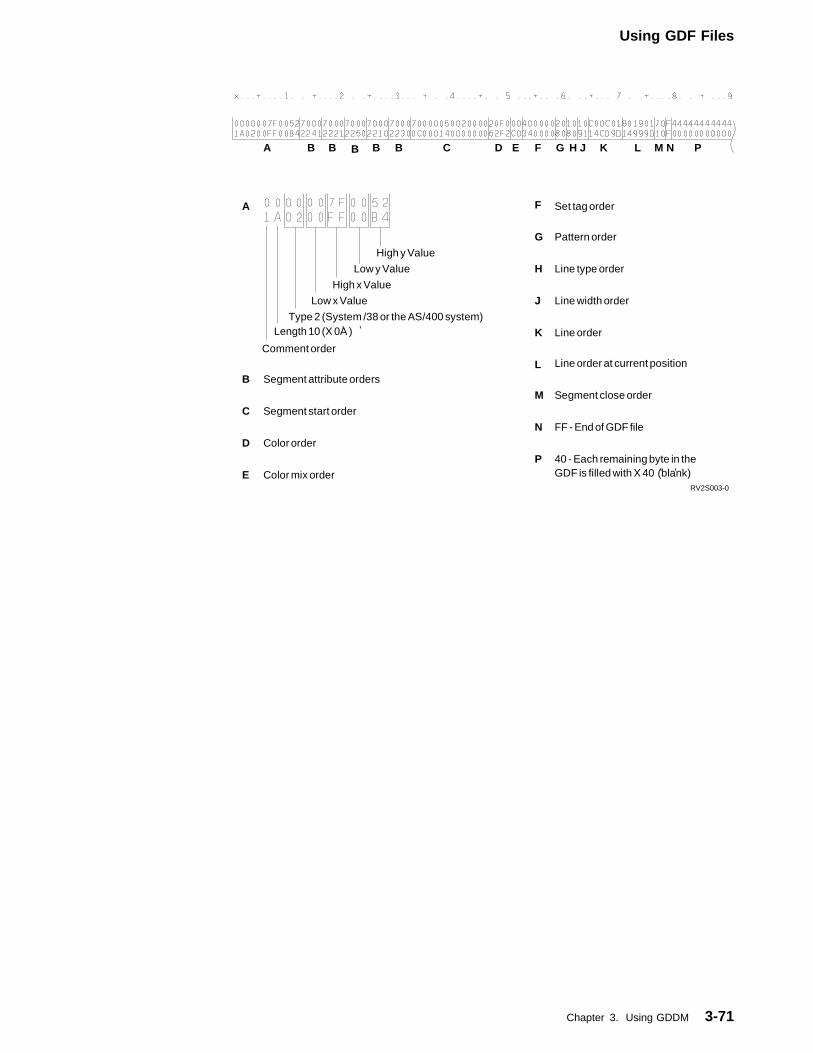
Using GDF Files
Comment order
High y Value
Low y Value
High x Value
Low x Value
Type 2 (System /38 or the AS/400 system)
A
B
J
K
L
M
N
P
Segment attribute orders
Color order
Color mix order
Set tag order
Pattern order
Line type order
Line width order
Line order
Line order at current position
Segment close order
FF - End of GDF file
Segment start order
40 - Each remaining byte in theGDF is filled with X 40 (blank)
A B B B B B J K L M N P
C
D
E
F
G
H
C D E F G H
Length 10 (X 0A ) ’
’
’
’RV2S003-0
Chapter 3. Using GDDM 3-71
Summary
Summary of This ChapterIn Chapter 2, “The Application Program Interface to Graphics,” the simple programthat drew the envelope introduced you to the basic ideas of GDDM: routines arecalled from application programs written in high-level languages to build a picture.When the picture is built, the program sends it to a device.
Chapter 3, “Using GDDM,” showed you more of the capabilities of GDDM routines.Specifically, the topics presented in this chapter were:
Drawing picturesThe first part of the chapter showed the GDDM routines you can use in applicationprograms to define pictures. There are two types of GDDM routines:
Primitives – the basic elements of a picture, such as lines and graphic symbols
Attributes – characteristics that can be assigned to primitives, such as linewidth or type
Controlling graphicsThe second part of the chapter showed the GDDM control routines you can use tomanage the graphics program, picture, and the devices it uses.
Program control routines enable you to initialize and end the graphics environment,handle errors, set characteristics for and manage the pictures, and send theprogram output to a device.
Device control routines allow your program to select devices that receive programoutput, and to specify characteristics for those devices.
Using graphics data format filesThe last part of the chapter showed the use of GDF (graphic data format) fileroutines in saving the output of a GDDM (or Presentation Graphics) program forlater display on the AS/400 System or another system.
At this point you should experiment with GDDM routines in simple programs to gaina better understanding of them, and to get ideas for application programs that usethem.
Chapter 6, “Graphics Application Program Examples,” shows some examples ofcomplete programs; you can copy those programs and experiment with them, andperhaps use them as a basis for your own programs.
Here are some points to remember:
1. The QGDDM library contains the GDDM routines. If you use a graphics symbolset other than the default set, or if you use the Pascal or PL/I high-levellanguage to write your programs, QGDDM must be in your library list; QGDDMcontains the entry point tables for Pascal and PL/I. (The other languages,
| BASIC, COBOL/400, and RPG/400, use a slightly different type of CALLinterface, and do not require the library. For more information on thedifferences between languages with respect to graphics programming, seeChapter 5, “OS/400 Programming Considerations.”)
2. FSINIT must be specified before any calls to other GDDM routines areperformed by your program.
3-72 AS/400 GDDM Programming Guide
Summary
3. All the items in the graphics hierarchy can be allowed to default; however, youcan specify GSPS(1,1) for a picture space with an aspect ratio of 1:1 to ensurethat dimensions in the x range equal to those in the y range. Otherwise,squares will look like rectangles and circles will look like ovals, and so forth.
If all items in the graphics hierarchy are allowed to default, the range of thegraphics window is 0 through 100 in both the x and y ranges, and the viewportis the entire page. Unless clipping is enabled, a routine that positions aprimitive outside this range will produce unpredictable results.
4. Data types must be declared according to the high-level language being used.
| For more detailed information about each routine, refer to the GDDM Programming| Reference manual.
Chapter 3. Using GDDM 3-73
Summary
3-74 AS/400 GDDM Programming Guide
Using Presentation Graphics
Chapter 4. Using Presentation Graphics
The Presentation Graphics program that drew the line chart in Chapter 2, “TheApplication Program Interface to Graphics,” used many of the same routines andprogram statements as the GDDM envelope program. In fact, the PresentationGraphics program used only one graphics routine that is not described inChapter 3, “Using GDDM,” and that routine is CHPLOT, which is a PresentationGraphics routine used to draw line charts or scatter plots.
Presentation Graphics routines like CHPLOT take data and convert it to a picture.You can use charts to show large amounts of data in a picture that provides anequally large amount of information, but take much less time to comprehend.
Presentation Graphics routines enable you to write programs that convert your real,online data on the AS/400 System into charts. These charts can be used topresent an idea to an audience (in hard-copy form), or to make your data easier tounderstand (in work station display form).
| Note: A similar product is the IBM AS/400 Business Graphics Utility licensed| program product, program number 5738-DS1. The AS/400 Business
Graphics Utility (BGU) offers a menu-driven, interactive method of definingbusiness graphics similar to the graphics constructed by Presentation
| Graphics routines. For more information, refer to the BGU User’s Guide| and Reference manual.
The first part of this chapter introduces the types of chart that you can construct,and shows differences between the types of data and chart format that you canuse.
The second part of this chapter shows you the Presentation Graphics routines youcan use, in the order they might appear in a typical program.
Understanding Presentation Graphics RoutinesThe chart shown in “Drawing a Simple Chart with Presentation Graphics Routines”on page 2-11 was a line chart that used two lines to represent data. Each point onthe lines showed the relationship of one value (on one axis) to another (on theother). When each point was in position, lines were drawn to connect each point tothe next, which resulted in a series of connected lines, considered as one line.Each line represented an entity called a data group. Each data group showed arelationship to the other data group, as well as a relationship to each axis. (Incharts, each line, bar, pie, and so forth that represents a data group is called achart component.)
Copyright IBM Corp. 1991 4-1
Using Presentation Graphics
| Simple line| chart. The line| chart was drawn| by a BASIC| program that| used defaults for| all Presentation| Graphics chart| features. This| illustration shows| the chart as| produced on the| 5292 Model 2.
| �|
| 35MM�536G3
| �| �
The chart condensed the information from the data groups (the data groups werethe arrays passed to the CHPLOT routine) into a compact and understandableformat. All of the chart formats available through Presentation Graphics can beused to transform data group values into charts. However, different types of datarequire different types of chart.
The first part of this section shows you chart formats that are available withPresentation Graphics routines, and offers some ideas on the use of each type ofchart.
| This chapter shows charts produced on the IBM personal computer with work| station function (WSF) and the IBM 6180 Plotter. A chart looks different depending
on the device it is sent to. For example, when default chart features are used,Presentation Graphics puts more intervals on the axis scale and changes theaspect ratio for the chart area if the chart is shown on the plotter.
This illustration shows the simple line chart on the plotter. nameit symbol=artnotext='PL0536G4'.
4-2 AS/400 GDDM Programming Guide
Using Presentation Graphics
35MM0536G3
When differences in the chart can result from switching devices, the description of| the routine will explain the effect. Refer to the description of CHCGRD on page| 4-16 for information on how to avoid these differences.
Chapter 4. Using Presentation Graphics 4-3
Chart Types
Chart TypesThese are the types of chart available:
Line charts; see page 4-4Scatter plots; see page 4-5Surface charts; see page 4-6Bar charts; see page 4-7Histograms; see page 4-9Pie charts; see page 4-10Venn diagrams; see page 4-11
Line ChartsLine charts can be used to show change occurring over time. Line charts canrepresent increases, decreases, trends, and general fluctuations of quantity.
| Line chart. The| chart represents| data as lines.
| PL0536G5
Each plotted point is shown by a marker; the plotted points are connected to form acontinuous line. Each line is assigned a different color. Options exist to convertthe sharp corners of the line to a more gentle curve (called line curving), or tosuppress the display of the lines that connect the points. This is called a scatterplot and is described next.
4-4 AS/400 GDDM Programming Guide
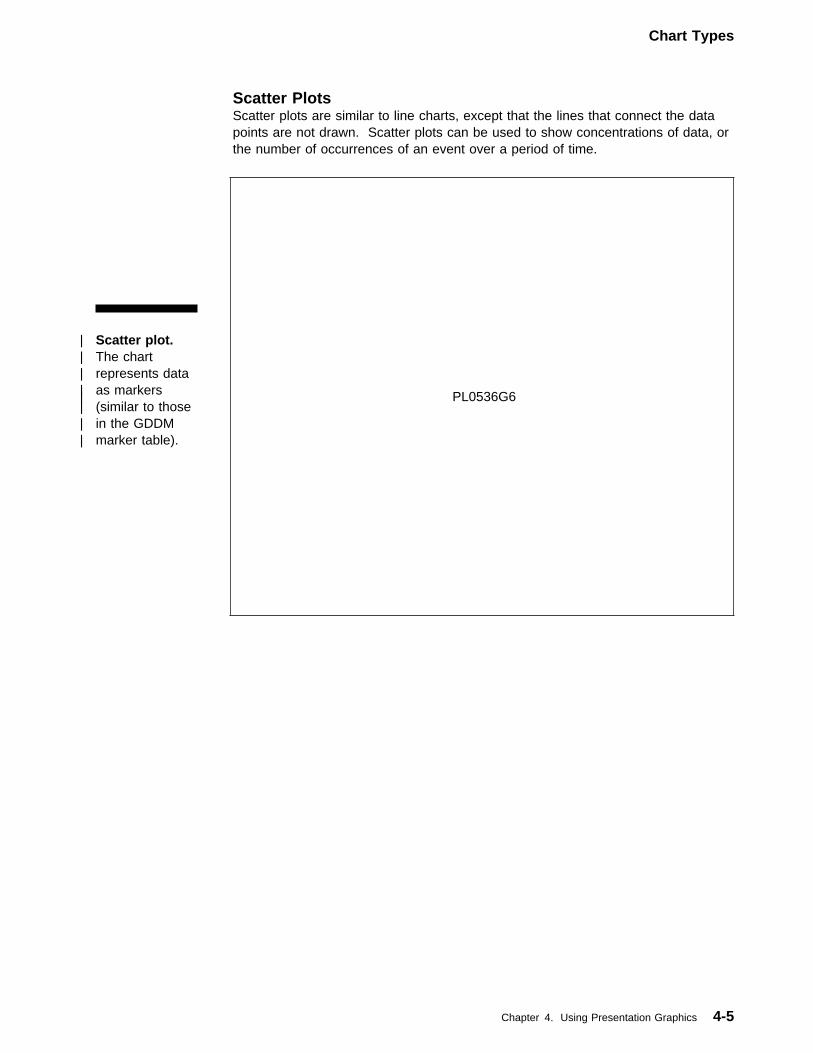
Chart Types
Scatter PlotsScatter plots are similar to line charts, except that the lines that connect the datapoints are not drawn. Scatter plots can be used to show concentrations of data, orthe number of occurrences of an event over a period of time.
| Scatter plot.| The chart| represents data| as markers| (similar to those| in the GDDM| marker table).
| PL0536G6
Chapter 4. Using Presentation Graphics 4-5
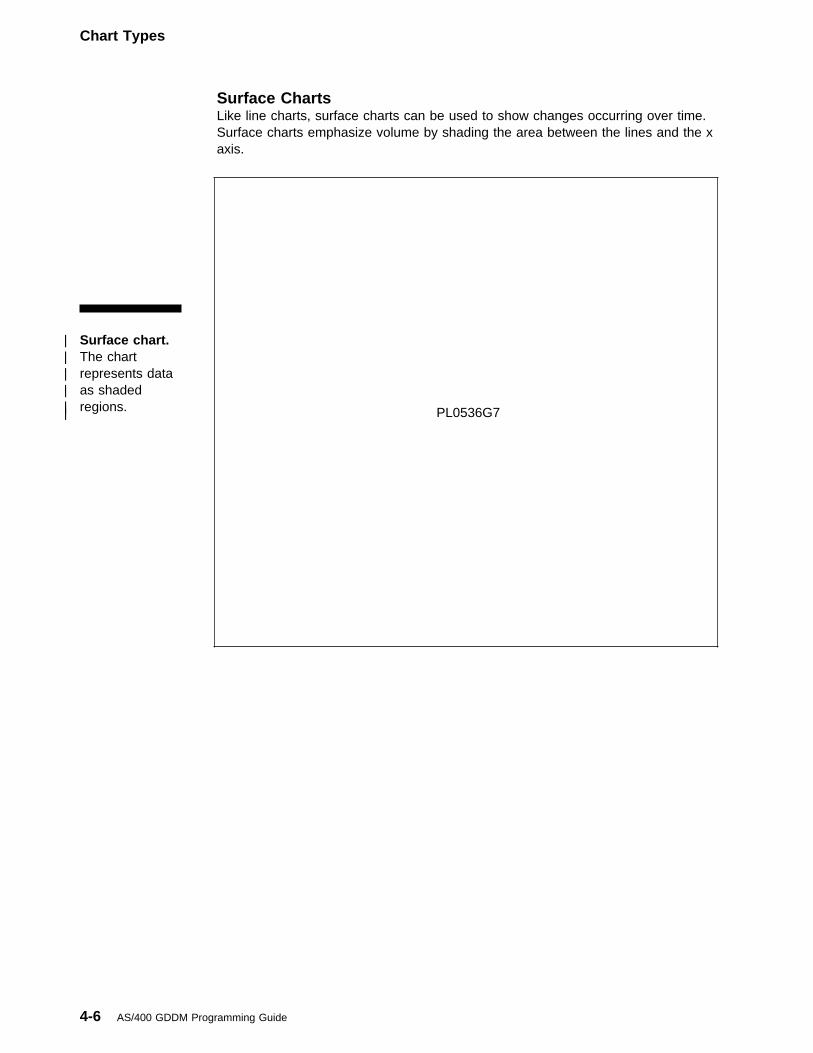
Chart Types
Surface ChartsLike line charts, surface charts can be used to show changes occurring over time.Surface charts emphasize volume by shading the area between the lines and the xaxis.
| Surface chart.| The chart| represents data| as shaded| regions.| PL0536G7
4-6 AS/400 GDDM Programming Guide
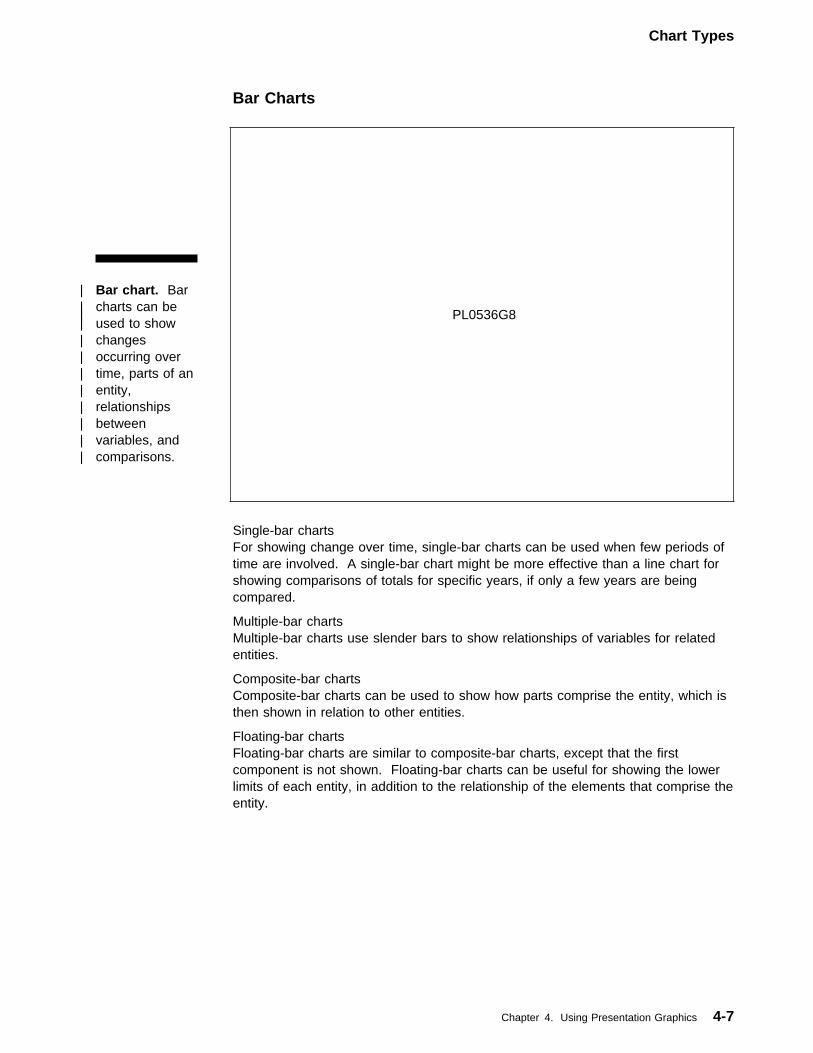
Chart Types
Bar Charts
| Bar chart. Bar| charts can be| used to show| changes| occurring over| time, parts of an| entity,| relationships| between| variables, and| comparisons.
| PL0536G8
Single-bar chartsFor showing change over time, single-bar charts can be used when few periods oftime are involved. A single-bar chart might be more effective than a line chart forshowing comparisons of totals for specific years, if only a few years are beingcompared.
Multiple-bar chartsMultiple-bar charts use slender bars to show relationships of variables for relatedentities.
Composite-bar chartsComposite-bar charts can be used to show how parts comprise the entity, which isthen shown in relation to other entities.
Floating-bar chartsFloating-bar charts are similar to composite-bar charts, except that the firstcomponent is not shown. Floating-bar charts can be useful for showing the lowerlimits of each entity, in addition to the relationship of the elements that comprise theentity.
Chapter 4. Using Presentation Graphics 4-7
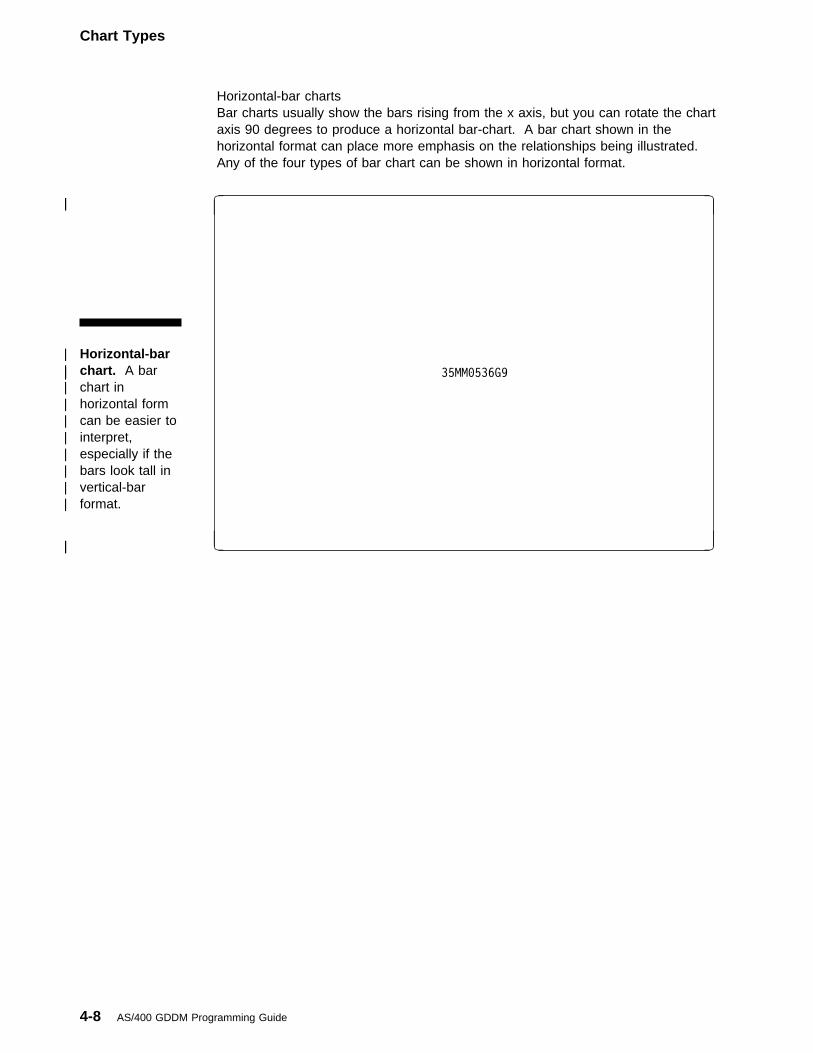
Chart Types
Horizontal-bar chartsBar charts usually show the bars rising from the x axis, but you can rotate the chartaxis 90 degrees to produce a horizontal bar-chart. A bar chart shown in thehorizontal format can place more emphasis on the relationships being illustrated.Any of the four types of bar chart can be shown in horizontal format.
| Horizontal-bar| chart. A bar| chart in| horizontal form| can be easier to| interpret,| especially if the| bars look tall in| vertical-bar| format.
| �|
| 35MM�536G9
| �| �
4-8 AS/400 GDDM Programming Guide
Chart Types
HistogramsHistograms are similar to bar charts, except that the width of the bar is significant.Each bar represents a variable quantity (relative to the y axis) charted over a rangeindicated by the width of the bar (on the x axis). If there is more than onecomponent, each is stacked on the first.
| Histogram. The| chart represents| data with both| the height of the| bar and the| width.
| PL0536H1
Chapter 4. Using Presentation Graphics 4-9
Chart Types
Pie ChartsPie charts are used to indicate the relative size of the elements of an entity,particularly when attention should be drawn to one of the elements. Pie charts areuseful for showing percentages.
| Pie Chart. Data| is represented| by the size of| the pie sectors| or slices.
| PL0536H2
You can move one or more slices of a pie chart out from the center of the pie.This is called exploding a pie chart.
4-10 AS/400 GDDM Programming Guide
Chart Types
Venn DiagramsVenn diagrams are used to show the logical relationship between the overlappingelements of two entities, or populations.
| Venn Diagram.| Data is| represented by| the area of each| circle and by the| area of the| overlapping| region.
| PL0536H3
Chapter 4. Using Presentation Graphics 4-11
Chart Types
Using Charts to Show DataThe previous section showed you the various chart formats Presentation Graphicsoffers you. This section gives you some ideas on which chart format is best foryour data, and how to improve the appearance and usability of the chart.
Selecting a Chart TypeSome groups of data can be shown with two or three different types of chartformat. For example, this table shows information that can be represented byseveral types of chart:
1. If you wanted to construct a chart that shows that overall costs increased, youcould use a line chart.
2. If you wanted to show that heating costs rose more rapidly than telephone orutility costs, you could use a three-component surface chart.
3. If you wanted to show that heating costs were greater than the other costs, youcould use a composite-bar chart (one bar for heating cost and one each fortelephone and utility costs).
4. If you wanted to show the percentages of heat, telephone, and utilities thatmake up the total for each year, you could use three pie charts.
5. If you wanted only to convert all the information from table format to chartformat, you could use a multiple-bar chart, one that shows three bars for eachyear.
You can see from this that many different options are available for charting one setof data.
The most important thing to remember about representing data from tables withcharts is this: you should know what information you want to emphasize beforeyou select a chart format to use. Try to find a short sentence that describes theinformation to be shown on your chart:
Sales are up this quarter
The Western Region increased its productivity by 25%
The trend in housing-starts forecasts a good year for builders.
Consider using the descriptive sentence as the main title for your chart. That way,those who interpret the chart have little chance of misunderstanding it.
Year 1984 1985 1986 Total
Heat 375 410 600 1385
Telephone 280 325 410 1015
Utilities 200 270 360 830
Totals 855 1005 1370 3230
4-12 AS/400 GDDM Programming Guide
Program Structure
Drawing Charts with Presentation Graphics RoutinesPresentation Graphics routine names are 4- to 6-character mnemonics whose firsttwo characters are CH (short for chart). The rest of the characters in the namerepresent the function of the routine (CHNOTE, for example, is a routine that writesa note).
Some Presentation Graphics routines specify attributes for axes. Because twoaxes exist (the x axis and the y axis), Presentation Graphics uses the thirdcharacter of these routine names to select which of the two axes the attributeshould affect. For example, the Presentation Graphics routine CHXSET specifiescharacteristics of the x axis while CHYSET specifies them for the y axis.
Most Presentation Graphics routines have parameters that define the function inmore detail. Parameters can be constants or they can be variables with valuesassigned to them. Parameter values can be 4-byte binary integers, shortfloating-point numbers, or character strings.
The Structure of Presentation Graphics ProgramsPresentation Graphics programs use a sequence of operations to construct charts:
1. Control operations 2. Chart definition 3. Chart drawing4. More control operations
Control OperationsIn Chapter 2, “The Application Program Interface to Graphics,” you learned that forboth the GDDM envelope program and the Presentation Graphics chart, the GDDMroutine FSINIT was used to initialize the graphics environment. All PresentationGraphics programs must begin with a call to FSINIT.
You can specify other GDDM control routines for your Presentation Graphicsprogram, or you can take the default values. You could, for example:
Specify an error-handling subroutine with FSEXIT
Define a specific page with FSPCRT
Manage symbol sets for use by the program
Manage tables for colors, line types, markers, and shading patterns for use bythe program
Open, select, and close devices; the device control routines were discussed in“Device Controls” on page 3-65.
Some GDDM control routines that you cannot use are:
Picture spaces (GSPS)Graphics segments (GSSEG)Viewports (GSVIEW; for Presentation Graphics, use CHAREA routine)Graphics windows (GSWIN).
Presentation Graphics defines these items implicitly in the graphics hierarchy.
If you need to return to the GDDM environment to add GDDM-described features tothe Presentation Graphics described picture, use the CHTERM routine.
Chapter 4. Using Presentation Graphics 4-13
Program Structure
For a list of GDDM routines that can be used in the Presentation Graphics| environment, refer to the GDDM Programming Reference manual.
Chart DefinitionOnce the initial control routines have been specified, you can use routines thatdefine the appearance of the chart. You can define:
Chart layout, including:
What size the chart will be and where it will be placedWhat size the margins will beWhether the chart will be framed in a boxWhat size and spacing the characters will have.
Chart features and their attributes, including:
The heading and what it will look likeThe axes and what they will look likeWhat the components of the chart will look likeWhat other things will be added to the chart and what they will look like,such as: A legend Chart notes
Chart DrawingWhen you have defined your chart in the program with any of the chart layout andattribute routines, you can specify a single chart-drawing routine that constructs thechart (it is not displayed until an ASREAD or FSFRCE routine sends it to an outputdevice).
The chart-drawing routine you use depends on the type of chart you want.
What You Can Do in a Program and WhereAfter you have specified the chart control routines, you define the chart withroutines that specify the chart layout and attributes. After that, you call a chartdrawing routine to draw the chart.
The two parts of the program (chart definition and chart drawing) are called state-1and state-2.
State-1 is the mode the program is in before the chart is constructed, and state-2 isthe mode of the program after the chart is constructed.
Once the chart is drawn, you can add more features, such as chart notes andadditional reference lines. However, some things you might try to add will not havean effect because the chart itself has already been constructed (but you will get amessage). For example, there would be no point in specifying an axis range of 0through 100 after the already-constructed chart used a range of 0 through 50.
4-14 AS/400 GDDM Programming Guide
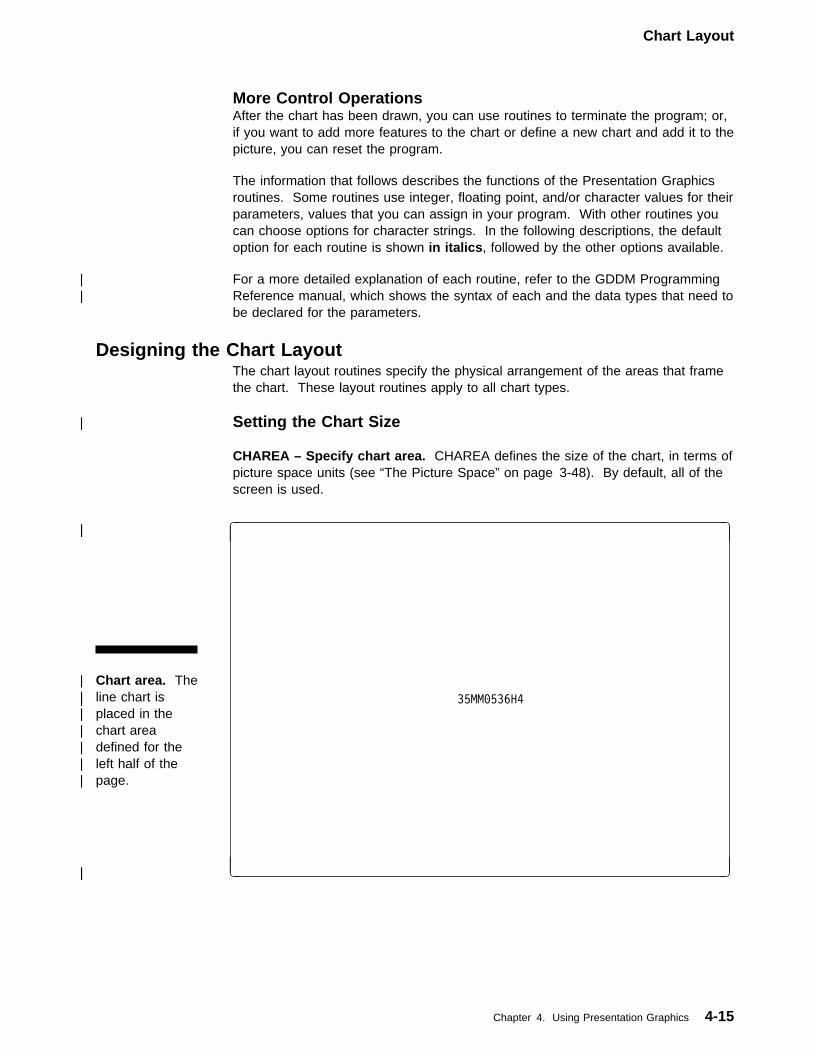
Chart Layout
More Control OperationsAfter the chart has been drawn, you can use routines to terminate the program; or,if you want to add more features to the chart or define a new chart and add it to thepicture, you can reset the program.
The information that follows describes the functions of the Presentation Graphicsroutines. Some routines use integer, floating point, and/or character values for theirparameters, values that you can assign in your program. With other routines youcan choose options for character strings. In the following descriptions, the defaultoption for each routine is shown in italics, followed by the other options available.
| For a more detailed explanation of each routine, refer to the GDDM Programming| Reference manual, which shows the syntax of each and the data types that need to
be declared for the parameters.
Designing the Chart LayoutThe chart layout routines specify the physical arrangement of the areas that framethe chart. These layout routines apply to all chart types.
| Setting the Chart Size CHAREA – Specify chart area. CHAREA defines the size of the chart, in terms ofpicture space units (see “The Picture Space” on page 3-48). By default, all of thescreen is used.
| Chart area. The| line chart is| placed in the| chart area| defined for the| left half of the| page.
| �|
| 35MM�536H4
| �| �
Chapter 4. Using Presentation Graphics 4-15
Chart Layout
! Define a chart area for the left half of the page
.
CALL GDDM ('GSQPS', WIDTH, DEPTH)
! Query picture space
LET LEFT = �.�
! Left boundary = left margin
LET RIGHT = �.5 � WIDTH
! Right boundary = halfway point
LET BOTTOM = �.�
! Bottom boundary = lower margin
LET TOP = DEPTH
! Top boundary = upper margin
CALL GDDM ('CHAREA',LEFT,RIGHT,BOTTOM,TOP)
! Sets chart area to left half of screen
.
.
(Other Presentation Graphics routines to define
and draw a chart in the defined chart area)
When you use CHAREA to divide the picture space and then draw a chart, youcould reset (CHSTRT) or reinitialize (CHRNIT) Presentation Graphics then useCHAREA to define the other part of the picture space and draw another chart.Alternatively, you could use the CHTERM routine to terminate PresentationGraphics then use GDDM routines to define a viewport and draw a GDDM pictureor text there. Note that a viewport (specified by GSVIEW) does for GDDM whatCHAREA does for Presentation Graphics. Also, if the GDDM routines precede thePresentation Graphics routines, you must close any opened segments before usingPresentation Graphics routines.
| Setting the Character Size CHCGRD – Set character spacing/size. CHCGRD specifies the basic characterbox size for all chart text (headings, labels, and notes), and the chart margins (withthe CHVMAR and CHHMAR routines described next). CHCGRD specifies this sizeby giving the number of rows and columns of character boxes needed to fill theentire chart area.
Each routine used to specify attributes for an element of chart text also specifies amultiplier value. The basic character size is multiplied by that value to enlarge ordecrease character size. CHCGRD is similar to GDDM routine GSCB, except thatthe character-box size for Presentation Graphics also determines the size of thechart, the spacing of chart features, and so forth. (GSCB is ignored whilePresentation Graphics is initialized.)
By default, the size of the hardware character grid is used. For graphics workstations, the default character grid is 24 rows by 80 columns. In some instances, achart drawn on a plotter or a printer looks different from the same chart shown onthe display, because the default character grid used for the plotter differs from thatused for the graphics work station (the default character grid for the plotter varieswith the orientation of the paper and the paper size; the default character grid forthe printer varies with the row/column dimensions for the printer file being used).To avoid the difference, set the character grid to 24 rows by 80 columns.
4-16 AS/400 GDDM Programming Guide
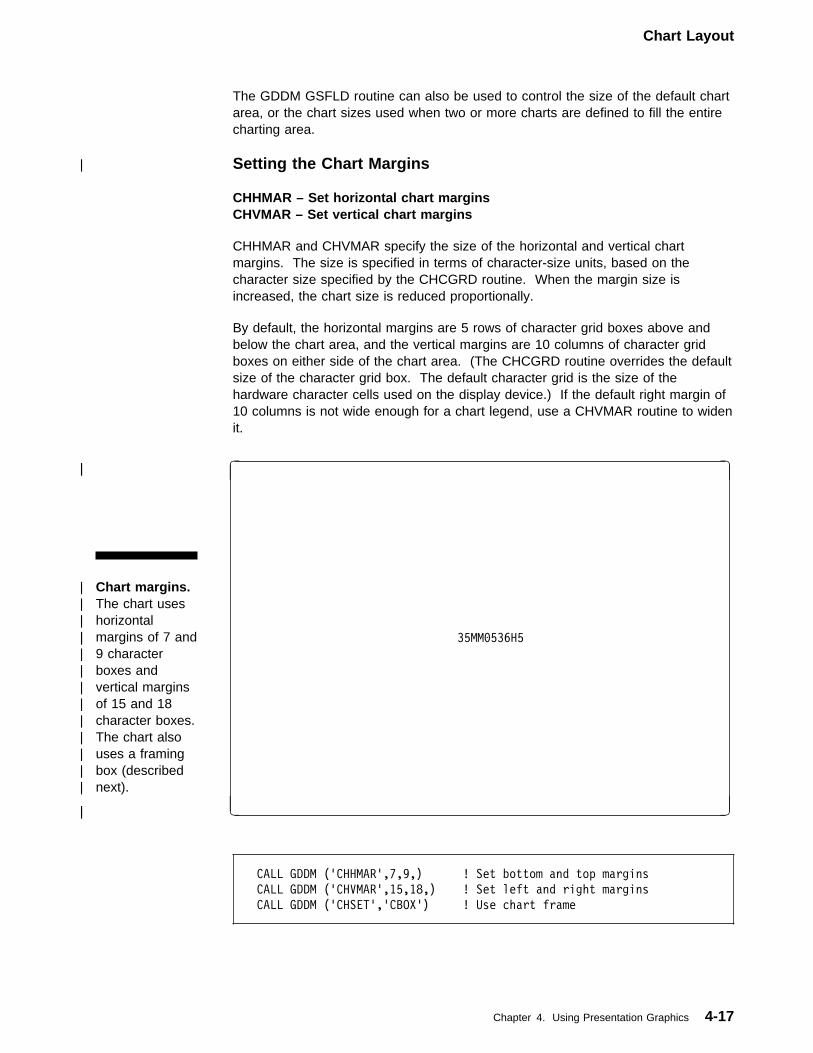
Chart Layout
The GDDM GSFLD routine can also be used to control the size of the default chartarea, or the chart sizes used when two or more charts are defined to fill the entirecharting area.
| Setting the Chart Margins CHHMAR – Set horizontal chart marginsCHVMAR – Set vertical chart margins
CHHMAR and CHVMAR specify the size of the horizontal and vertical chartmargins. The size is specified in terms of character-size units, based on thecharacter size specified by the CHCGRD routine. When the margin size isincreased, the chart size is reduced proportionally.
By default, the horizontal margins are 5 rows of character grid boxes above andbelow the chart area, and the vertical margins are 10 columns of character gridboxes on either side of the chart area. (The CHCGRD routine overrides the defaultsize of the character grid box. The default character grid is the size of thehardware character cells used on the display device.) If the default right margin of10 columns is not wide enough for a chart legend, use a CHVMAR routine to widenit.
| Chart margins.| The chart uses| horizontal| margins of 7 and| 9 character| boxes and| vertical margins| of 15 and 18| character boxes.| The chart also| uses a framing| box (described| next).
| �|
| 35MM�536H5
| �| �
CALL GDDM ('CHHMAR',7,9,) ! Set bottom and top margins
CALL GDDM ('CHVMAR',15,18,) ! Set left and right margins
CALL GDDM ('CHSET','CBOX') ! Use chart frame
Chapter 4. Using Presentation Graphics 4-17
Chart Layout
| Enclosing the Chart in a Frame CHSET – Specify chart options. CHSET (NCBOX|CBOX|CBACK) specifieswhether a framing box is constructed around the chart construction area.
Use the CBOX parameter to draw a framing box around the chart. By default, color7 is used (white for a graphics work station color table, and the highest pen numberfor the plotters). Use the CHBATT routine (described next) to set attributes for theframing box.
Use the CBACK parameter to have the entire background shaded with a solidcolor. By default, the color is the same as that specified for the frame. UseCHBATT (described next) for a different color. CBACK should not be used forVenn diagrams because it suppresses drawing the population circles. If you useCHAREA to set a chart area, the background and the chart frame are sized to fitthe chart area and margins.
By default, the framing box and background shading are not drawn.
Performance hint
Specifying a background for your chart is nearly equivalent to a complete pageof area-fill. This will substantially increase the time it takes to process and plotyour chart.
| Setting the Frame Attributes CHBATT – Set framing box attributes. CHBATT specifies attributes for theframing box produced by CHSET (CBOX) or attributes for the chart backgroundproduced by CHSET (CBACK). The attributes are color, line-width and line-type ofthe frame, and the color of the background.
By default, the frame and background are color 7. The default frame is drawn witha solid, narrow line.
Adding Chart FeaturesOther Presentation Graphics routines add features that increase the usability of thechart. You can use these routines to control:
Chart headingsReference lines (including axes and axis text)
Chart legends Chart notes
Routines for these chart features (except chart notes) do not have to be specified inany particular order in the program, but they should precede the chart-drawingroutine (state-1). Chart notes can be added only in state-2. For information onstate-1 and state-2, see page 4-14.
4-18 AS/400 GDDM Programming Guide
Chart Layout
Writing Chart HeadingsThe chart heading is usually placed at the top of the chart, but it can be placed atthe bottom. You can left or right-justify the heading, but it is centered by default.The heading can be more than one line; secondary lines in the heading are alsoleft- or right-justified or centered.
| Writing the Chart Heading CHHEAD – Heading text. CHHEAD specifies the string of characters that is thechart heading. Chart headings can be more than one line long, but cannot exceed132 characters.
If you want a multiple-line heading, use a semicolon (;) as the line break characterin the heading. The second line of the heading is then centered below the first line.The semicolon must be counted as a character in the heading even though it doesnot appear. If you want a semicolon as a character in the heading, use a pair ofthem (;;). The two semicolons put the single semicolon into the heading, but theydo not cause a line break. To put more space between the top of the chart areaand the heading, move the heading down by including a semicolon as the firstcharacter in the heading string.
No default heading character strings exist. If you use CHHEAD to specify aheading, but do not use CHHATT to select attributes or CHSET to position theheading, the heading is drawn centered at the top of the chart, in standard-sizecharacters of the default color. The CHSET and CHHATT routines are describednext.
| Suppressing the Chart Heading CHSET – Specify chart options. CHSET (HEADING|NOHEADING) allows orsuppresses the heading specified by CHHEAD.
| Setting the Heading Attributes CHHATT – Heading text attributes. CHHATT specifies the color, character mode,symbol set (one loaded by the GSLSS routine), and character-size multiplier usedfor the heading. If character-mode 2 is specified, the default symbol set is used,and the character-size multiplier serves only to set the spacing of the characters inthe heading.
If CHHATT is not specified, the heading is shown with the default color and iswritten in the default character set with standard-size characters. The default coloris number 0 (the same as number 4) for the display and the pen in position 1 forthe plotter.
Chapter 4. Using Presentation Graphics 4-19
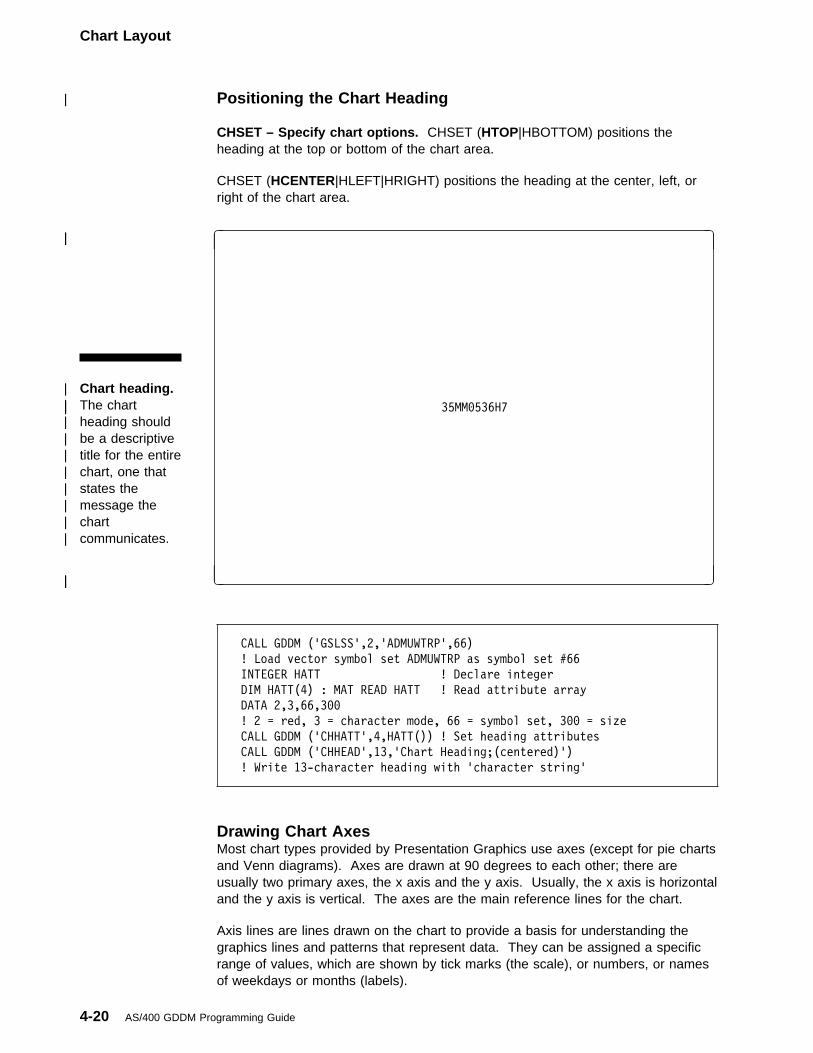
Chart Layout
| Positioning the Chart Heading CHSET – Specify chart options. CHSET (HTOP|HBOTTOM) positions theheading at the top or bottom of the chart area.
CHSET (HCENTER|HLEFT|HRIGHT) positions the heading at the center, left, orright of the chart area.
| Chart heading.| The chart| heading should| be a descriptive| title for the entire| chart, one that| states the| message the| chart| communicates.
| �|
| 35MM�536H7
| �| �
CALL GDDM ('GSLSS',2,'ADMUWTRP',66)
! Load vector symbol set ADMUWTRP as symbol set #66
INTEGER HATT ! Declare integer
DIM HATT(4) : MAT READ HATT ! Read attribute array
DATA 2,3,66,3��
! 2 = red, 3 = character mode, 66 = symbol set, 3�� = size
CALL GDDM ('CHHATT',4,HATT()) ! Set heading attributes
CALL GDDM ('CHHEAD',13,'Chart Heading;(centered)')
! Write 13-character heading with 'character string'
Drawing Chart AxesMost chart types provided by Presentation Graphics use axes (except for pie chartsand Venn diagrams). Axes are drawn at 90 degrees to each other; there areusually two primary axes, the x axis and the y axis. Usually, the x axis is horizontaland the y axis is vertical. The axes are the main reference lines for the chart.
Axis lines are lines drawn on the chart to provide a basis for understanding thegraphics lines and patterns that represent data. They can be assigned a specificrange of values, which are shown by tick marks (the scale), or numbers, or namesof weekdays or months (labels).
4-20 AS/400 GDDM Programming Guide
Chart Layout
The x axis most often represents the independent variable, and the y axisrepresents the dependent variable. The independent variable represents theframe-of-reference of the chart. Nothing associated with the chart can change theprogression of the independent variable. For some chart types, the independentvariable is usually time: hours, days, weeks, for example. For other chart types,the independent variable represents a related group, such as a group of cargotransporters that has as its elements ships, planes, trucks, and trains.
The dependent variable is the range of data values being used to construct thechart. The dependent variable is the dynamic element of the chart; each value ofthe dependent variable corresponds to some value in the independent variable. Inother words, the dependent variable depends upon the independent variable (suchas a specific day of the week) for it to have any meaning.
| Drawing or Suppressing the Chart Axes CHXSET – x-axis characteristicCHYSET – y-axis characteristics
CHXSET or CHYSET (AXIS|NOAXIS) specifies whether the axis line is drawnwhen the chart is constructed. NOAXIS suppresses only the x- or y-axis line, notthe tick marks, title and labels. You must use CHXSET or CHYSET (PLAIN) tosuppress the tick marks for an axis and CHXSET or CHYSET (NOLAB) to suppressthe labels for an axis. CHXTTL and CHYTTL are used to specify axis titles; theirabsence suppresses the axis titles.
To suppress both axes and their associated tick marks and labels, use the CHSET(NDRAW) parameter (described next). You can use CHDRAX to draw thesuppressed axes tick marks, and labels in state-2.
CHSET – Specify chart options. CHSET (IDRAW|DRAW|NDRAW) specifieswhen the axes and their associated tick marks and labels are drawn on the chart.You can specify that the axes are drawn before the data components are drawn(the default IDRAW), so that if any part of the component interferes with an axis,the axis is obscured. If necessary, the axes can be drawn each time a componentis drawn, so that the axes overlay the components (DRAW), or the axes can besuppressed altogether (NDRAW). If the axes are suppressed, they can be drawnlater (in state-2) by the CHDRAX routine (described next).
Chapter 4. Using Presentation Graphics 4-21
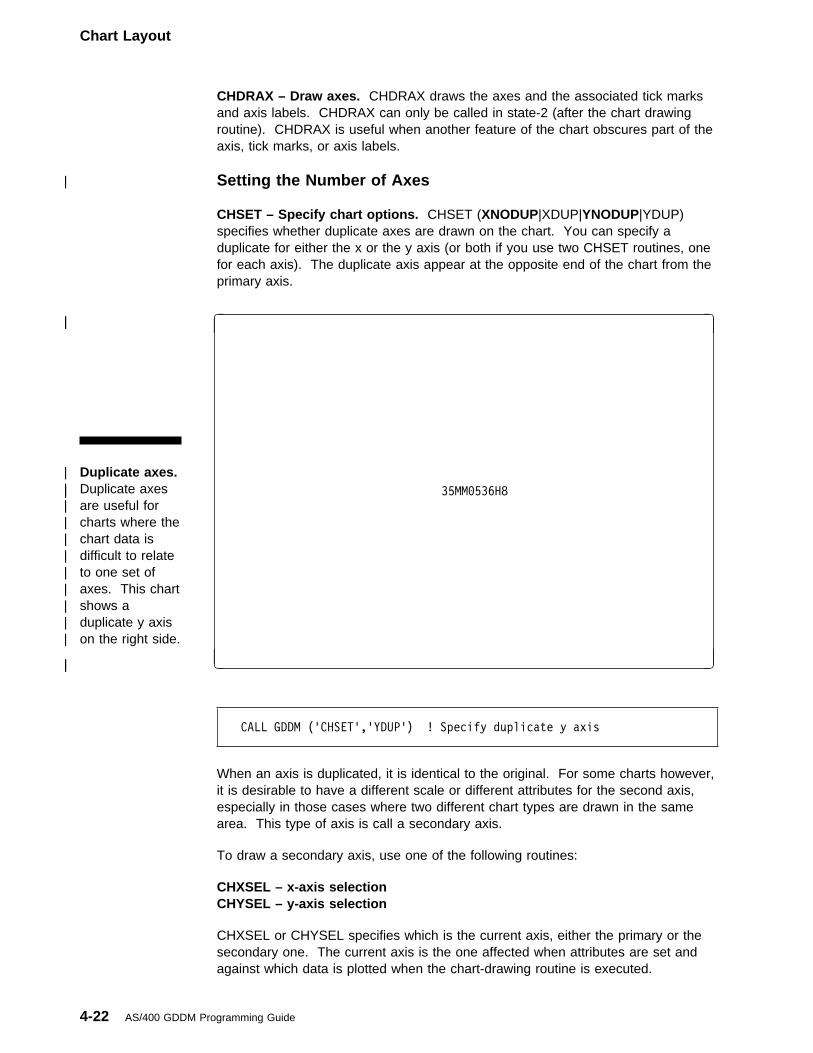
Chart Layout
CHDRAX – Draw axes. CHDRAX draws the axes and the associated tick marksand axis labels. CHDRAX can only be called in state-2 (after the chart drawingroutine). CHDRAX is useful when another feature of the chart obscures part of theaxis, tick marks, or axis labels.
| Setting the Number of Axes CHSET – Specify chart options. CHSET (XNODUP|XDUP|YNODUP|YDUP)specifies whether duplicate axes are drawn on the chart. You can specify aduplicate for either the x or the y axis (or both if you use two CHSET routines, onefor each axis). The duplicate axis appear at the opposite end of the chart from theprimary axis.
| Duplicate axes.| Duplicate axes| are useful for| charts where the| chart data is| difficult to relate| to one set of| axes. This chart| shows a| duplicate y axis| on the right side.
| �|
| 35MM�536H8
| �| �
CALL GDDM ('CHSET','YDUP') ! Specify duplicate y axis
When an axis is duplicated, it is identical to the original. For some charts however,it is desirable to have a different scale or different attributes for the second axis,especially in those cases where two different chart types are drawn in the samearea. This type of axis is call a secondary axis.
To draw a secondary axis, use one of the following routines:
CHXSEL – x-axis selectionCHYSEL – y-axis selection
CHXSEL or CHYSEL specifies which is the current axis, either the primary or thesecondary one. The current axis is the one affected when attributes are set andagainst which data is plotted when the chart-drawing routine is executed.
4-22 AS/400 GDDM Programming Guide
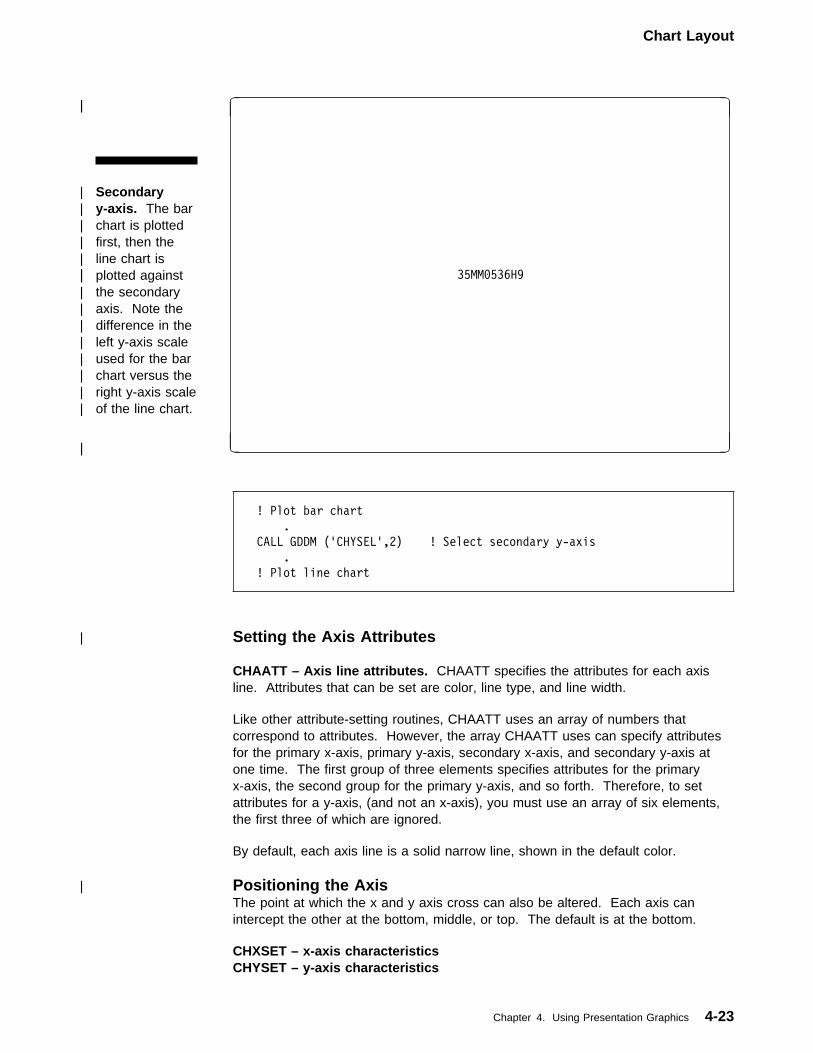
Chart Layout
| Secondary| y-axis. The bar| chart is plotted| first, then the| line chart is| plotted against| the secondary| axis. Note the| difference in the| left y-axis scale| used for the bar| chart versus the| right y-axis scale| of the line chart.
| �|
| 35MM�536H9
| �| �
! Plot bar chart
.
CALL GDDM ('CHYSEL',2) ! Select secondary y-axis
.
! Plot line chart
| Setting the Axis Attributes CHAATT – Axis line attributes. CHAATT specifies the attributes for each axisline. Attributes that can be set are color, line type, and line width.
Like other attribute-setting routines, CHAATT uses an array of numbers thatcorrespond to attributes. However, the array CHAATT uses can specify attributesfor the primary x-axis, primary y-axis, secondary x-axis, and secondary y-axis atone time. The first group of three elements specifies attributes for the primaryx-axis, the second group for the primary y-axis, and so forth. Therefore, to setattributes for a y-axis, (and not an x-axis), you must use an array of six elements,the first three of which are ignored.
By default, each axis line is a solid narrow line, shown in the default color.
| Positioning the AxisThe point at which the x and y axis cross can also be altered. Each axis canintercept the other at the bottom, middle, or top. The default is at the bottom.
CHXSET – x-axis characteristicsCHYSET – y-axis characteristics
Chapter 4. Using Presentation Graphics 4-23
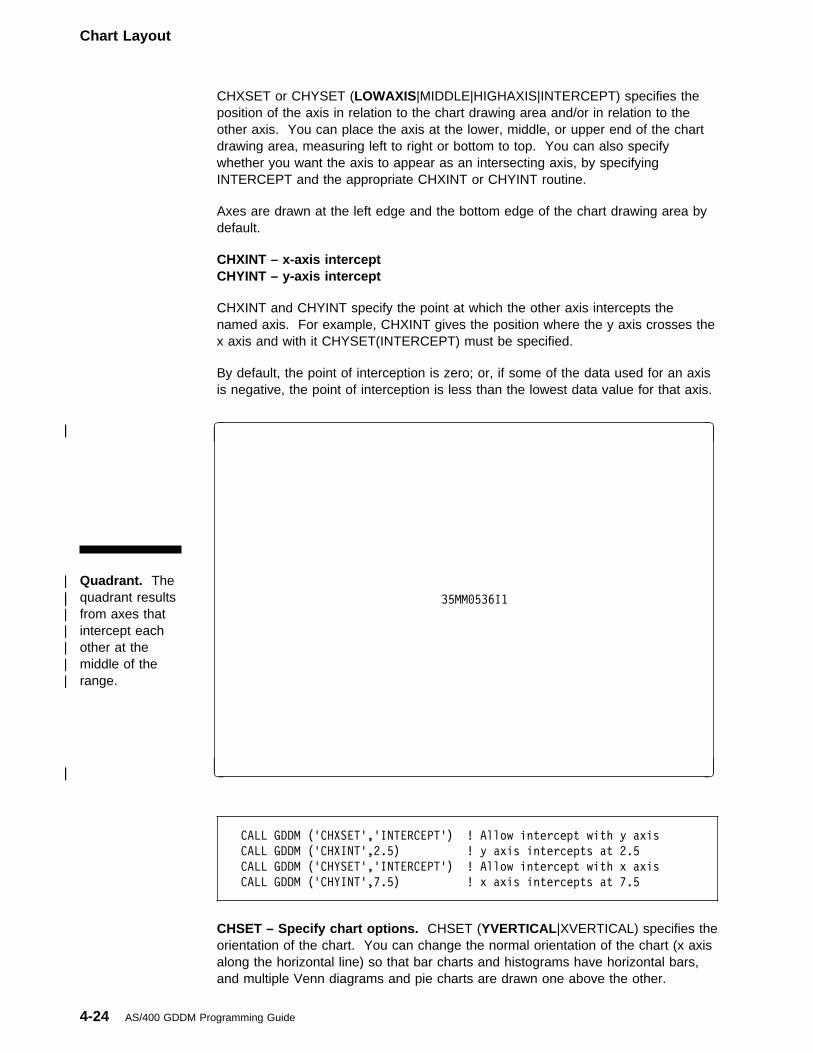
Chart Layout
CHXSET or CHYSET (LOWAXIS|MIDDLE|HIGHAXIS|INTERCEPT) specifies theposition of the axis in relation to the chart drawing area and/or in relation to theother axis. You can place the axis at the lower, middle, or upper end of the chartdrawing area, measuring left to right or bottom to top. You can also specifywhether you want the axis to appear as an intersecting axis, by specifyingINTERCEPT and the appropriate CHXINT or CHYINT routine.
Axes are drawn at the left edge and the bottom edge of the chart drawing area bydefault.
CHXINT – x-axis interceptCHYINT – y-axis intercept
CHXINT and CHYINT specify the point at which the other axis intercepts thenamed axis. For example, CHXINT gives the position where the y axis crosses thex axis and with it CHYSET(INTERCEPT) must be specified.
By default, the point of interception is zero; or, if some of the data used for an axisis negative, the point of interception is less than the lowest data value for that axis.
| Quadrant. The| quadrant results| from axes that| intercept each| other at the| middle of the| range.
| �|
| 35MM�536I1
| �| �
CALL GDDM ('CHXSET','INTERCEPT') ! Allow intercept with y axis
CALL GDDM ('CHXINT',2.5) ! y axis intercepts at 2.5
CALL GDDM ('CHYSET','INTERCEPT') ! Allow intercept with x axis
CALL GDDM ('CHYINT',7.5) ! x axis intercepts at 7.5
CHSET – Specify chart options. CHSET (YVERTICAL|XVERTICAL) specifies theorientation of the chart. You can change the normal orientation of the chart (x axisalong the horizontal line) so that bar charts and histograms have horizontal bars,and multiple Venn diagrams and pie charts are drawn one above the other.
4-24 AS/400 GDDM Programming Guide
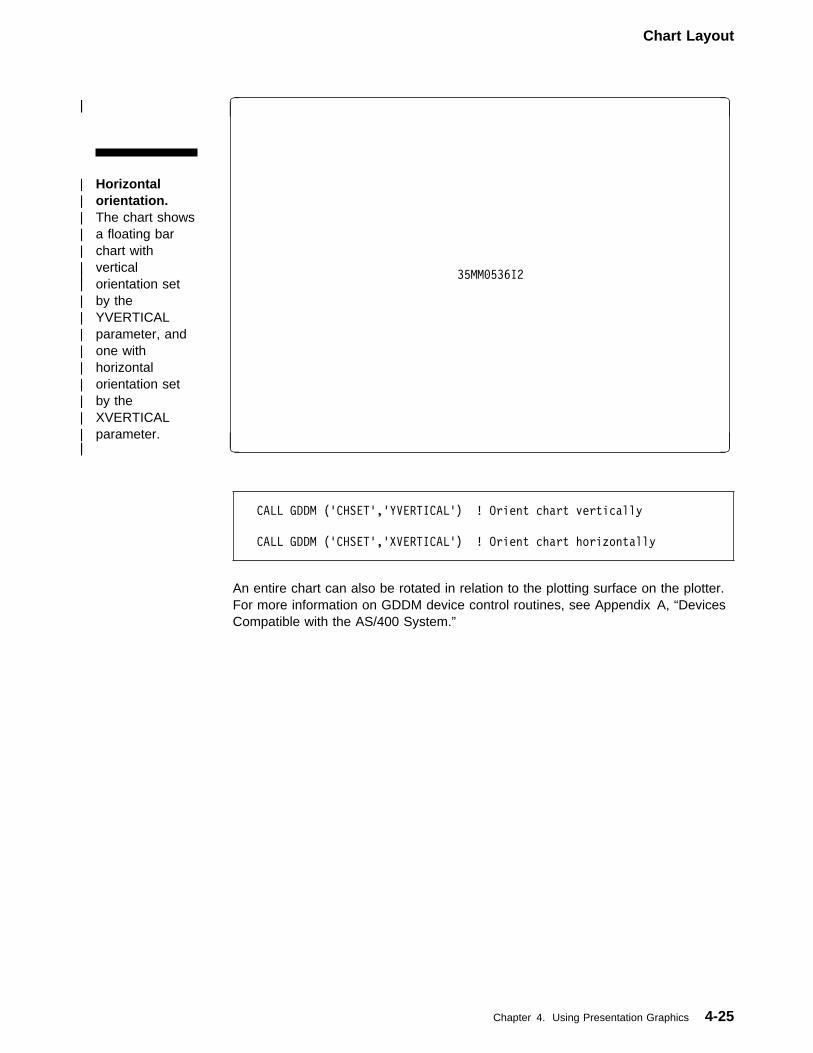
Chart Layout
| Horizontal| orientation.| The chart shows| a floating bar| chart with| vertical| orientation set| by the| YVERTICAL| parameter, and| one with| horizontal| orientation set| by the| XVERTICAL| parameter.
| �|
| 35MM�536I2
| �| �
CALL GDDM ('CHSET','YVERTICAL') ! Orient chart vertically
CALL GDDM ('CHSET','XVERTICAL') ! Orient chart horizontally
An entire chart can also be rotated in relation to the plotting surface on the plotter.For more information on GDDM device control routines, see Appendix A, “DevicesCompatible with the AS/400 System.”
Chapter 4. Using Presentation Graphics 4-25
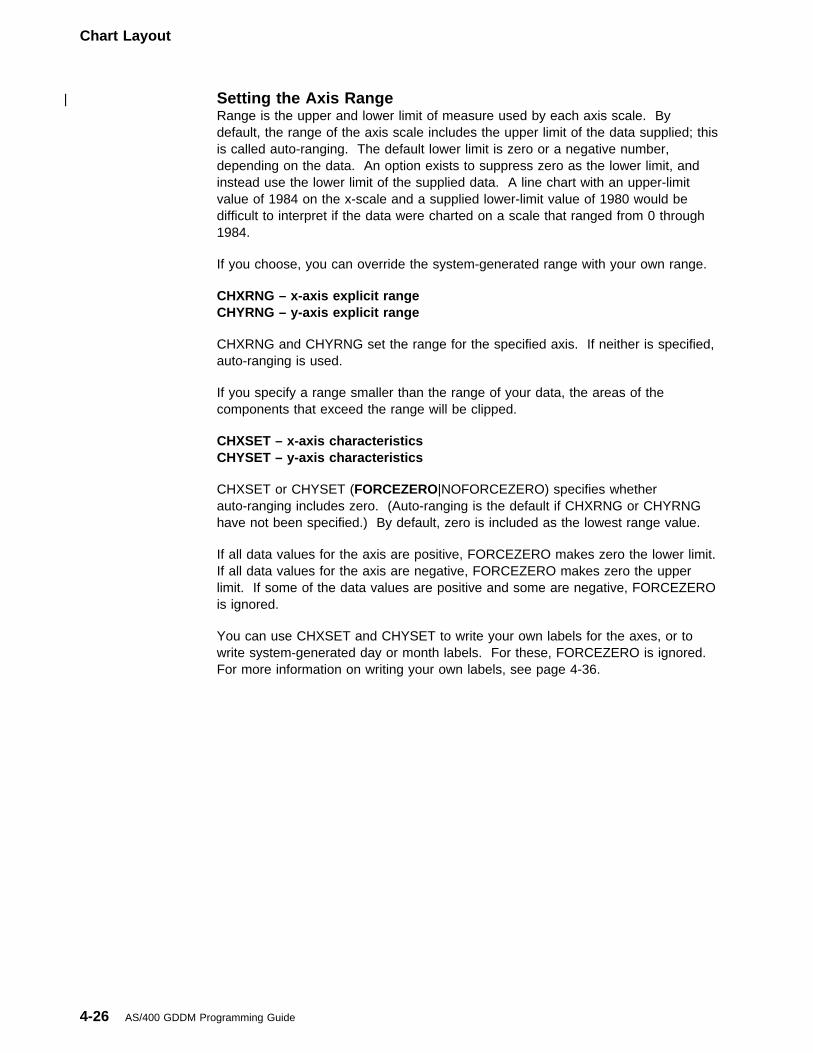
Chart Layout
| Setting the Axis RangeRange is the upper and lower limit of measure used by each axis scale. Bydefault, the range of the axis scale includes the upper limit of the data supplied; thisis called auto-ranging. The default lower limit is zero or a negative number,depending on the data. An option exists to suppress zero as the lower limit, andinstead use the lower limit of the supplied data. A line chart with an upper-limitvalue of 1984 on the x-scale and a supplied lower-limit value of 1980 would bedifficult to interpret if the data were charted on a scale that ranged from 0 through1984.
If you choose, you can override the system-generated range with your own range.
CHXRNG – x-axis explicit rangeCHYRNG – y-axis explicit range
CHXRNG and CHYRNG set the range for the specified axis. If neither is specified,auto-ranging is used.
If you specify a range smaller than the range of your data, the areas of thecomponents that exceed the range will be clipped.
CHXSET – x-axis characteristicsCHYSET – y-axis characteristics
CHXSET or CHYSET (FORCEZERO|NOFORCEZERO) specifies whetherauto-ranging includes zero. (Auto-ranging is the default if CHXRNG or CHYRNGhave not been specified.) By default, zero is included as the lowest range value.
If all data values for the axis are positive, FORCEZERO makes zero the lower limit.If all data values for the axis are negative, FORCEZERO makes zero the upperlimit. If some of the data values are positive and some are negative, FORCEZEROis ignored.
You can use CHXSET and CHYSET to write your own labels for the axes, or towrite system-generated day or month labels. For these, FORCEZERO is ignored.For more information on writing your own labels, see page 4-36.
4-26 AS/400 GDDM Programming Guide
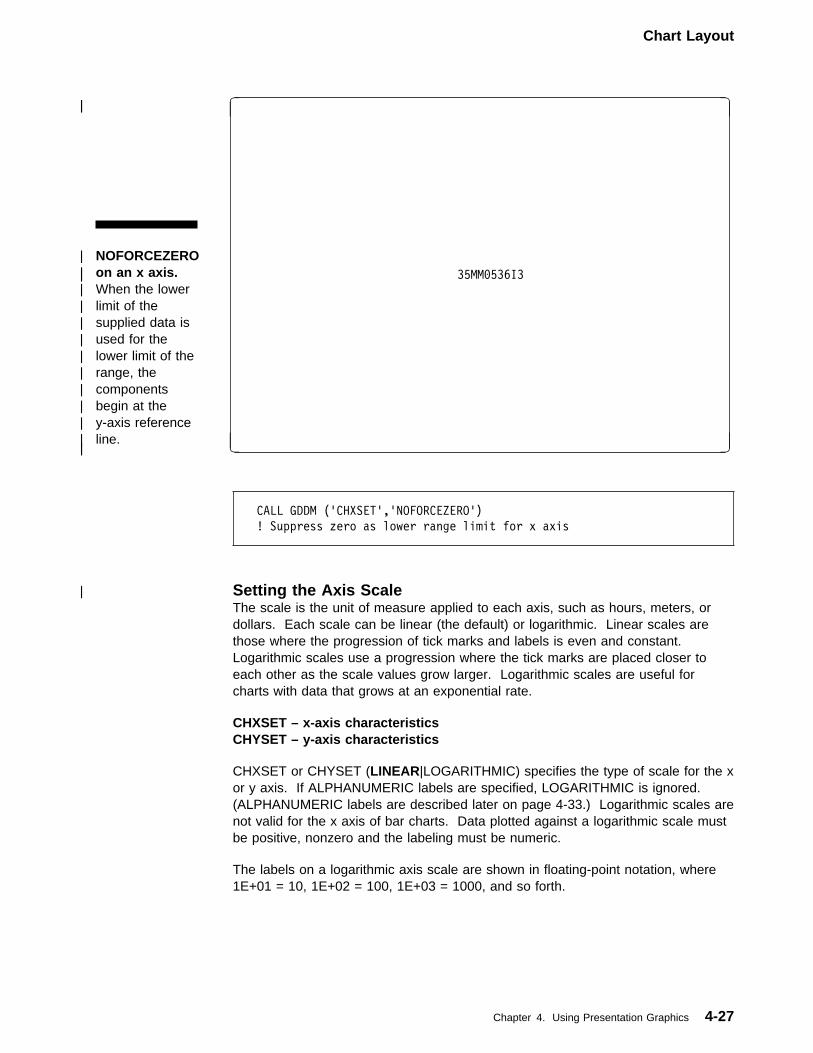
Chart Layout
| NOFORCEZERO| on an x axis.| When the lower| limit of the| supplied data is| used for the| lower limit of the| range, the| components| begin at the| y-axis reference| line.
| �|
| 35MM�536I3
| �| �
CALL GDDM ('CHXSET','NOFORCEZERO')
! Suppress zero as lower range limit for x axis
| Setting the Axis ScaleThe scale is the unit of measure applied to each axis, such as hours, meters, ordollars. Each scale can be linear (the default) or logarithmic. Linear scales arethose where the progression of tick marks and labels is even and constant.Logarithmic scales use a progression where the tick marks are placed closer toeach other as the scale values grow larger. Logarithmic scales are useful forcharts with data that grows at an exponential rate.
CHXSET – x-axis characteristicsCHYSET – y-axis characteristics
CHXSET or CHYSET (LINEAR|LOGARITHMIC) specifies the type of scale for the xor y axis. If ALPHANUMERIC labels are specified, LOGARITHMIC is ignored.(ALPHANUMERIC labels are described later on page 4-33.) Logarithmic scales arenot valid for the x axis of bar charts. Data plotted against a logarithmic scale mustbe positive, nonzero and the labeling must be numeric.
The labels on a logarithmic axis scale are shown in floating-point notation, where1E+01 = 10, 1E+02 = 100, 1E+03 = 1000, and so forth.
Chapter 4. Using Presentation Graphics 4-27
Chart Layout
| Logarithmic| scale. The y| axis shown is a| logarithmic| scale. Tick| marks have| been added with| the CHYTIC| routine (see| page 4-28).
| �|
| 35MM�536I4
| �| �
CALL GDDM ('CHXSET','LOGARITHMIC') ! Use log scale
CALL GDDM ('CHYTIC',1�.�,�.�) ! Set tick mark interval
| Drawing the Axis Tick MarksTick marks show intermediate values on the axes. Tick marks along each axis canmake a chart much easier to interpret, by showing more points of reference.
CHXTIC – x-axis tick mark intervalCHYTIC – y-axis tick mark interval
CHXTIC and CHYTIC set the level of incrementing between major tick marks, andspecify the number of minor tick marks to place between each pair of major tickmarks.
If neither is specified, the interval on a linear scale is 1, 2, or 5 multiplied by apower of 10, according to the auto-ranging values. The interval on a logarithmicscale is each power of 10: 1, 10, 100, 1000, and so forth.
4-28 AS/400 GDDM Programming Guide
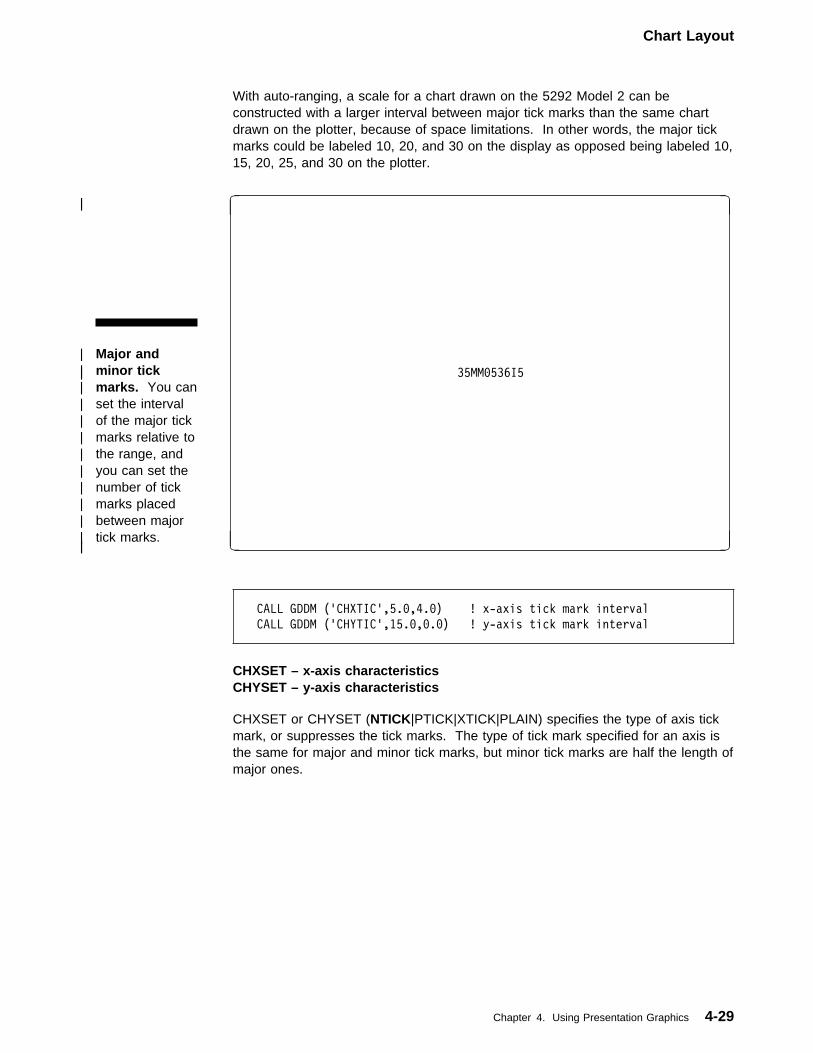
Chart Layout
With auto-ranging, a scale for a chart drawn on the 5292 Model 2 can beconstructed with a larger interval between major tick marks than the same chartdrawn on the plotter, because of space limitations. In other words, the major tickmarks could be labeled 10, 20, and 30 on the display as opposed being labeled 10,15, 20, 25, and 30 on the plotter.
| Major and| minor tick| marks. You can| set the interval| of the major tick| marks relative to| the range, and| you can set the| number of tick| marks placed| between major| tick marks.
| �|
| 35MM�536I5
| �| �
CALL GDDM ('CHXTIC',5.�,4.�) ! x-axis tick mark interval
CALL GDDM ('CHYTIC',15.�,�.�) ! y-axis tick mark interval
CHXSET – x-axis characteristicsCHYSET – y-axis characteristics
CHXSET or CHYSET (NTICK|PTICK|XTICK|PLAIN) specifies the type of axis tickmark, or suppresses the tick marks. The type of tick mark specified for an axis isthe same for major and minor tick marks, but minor tick marks are half the length ofmajor ones.
Chapter 4. Using Presentation Graphics 4-29
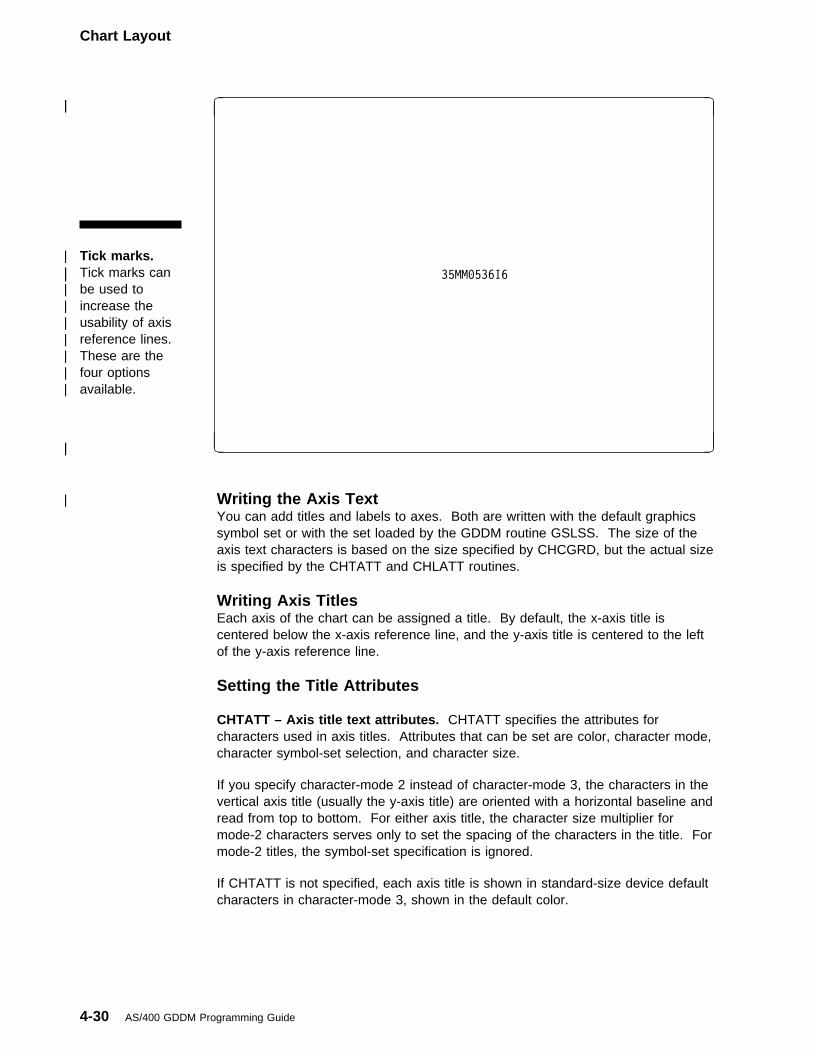
Chart Layout
| Tick marks.| Tick marks can| be used to| increase the| usability of axis| reference lines.| These are the| four options| available.
| �|
| 35MM�536I6
| �| �
| Writing the Axis TextYou can add titles and labels to axes. Both are written with the default graphicssymbol set or with the set loaded by the GDDM routine GSLSS. The size of theaxis text characters is based on the size specified by CHCGRD, but the actual sizeis specified by the CHTATT and CHLATT routines.
Writing Axis TitlesEach axis of the chart can be assigned a title. By default, the x-axis title iscentered below the x-axis reference line, and the y-axis title is centered to the leftof the y-axis reference line.
Setting the Title Attributes CHTATT – Axis title text attributes. CHTATT specifies the attributes forcharacters used in axis titles. Attributes that can be set are color, character mode,character symbol-set selection, and character size.
If you specify character-mode 2 instead of character-mode 3, the characters in thevertical axis title (usually the y-axis title) are oriented with a horizontal baseline andread from top to bottom. For either axis title, the character size multiplier formode-2 characters serves only to set the spacing of the characters in the title. Formode-2 titles, the symbol-set specification is ignored.
If CHTATT is not specified, each axis title is shown in standard-size device defaultcharacters in character-mode 3, shown in the default color.
4-30 AS/400 GDDM Programming Guide
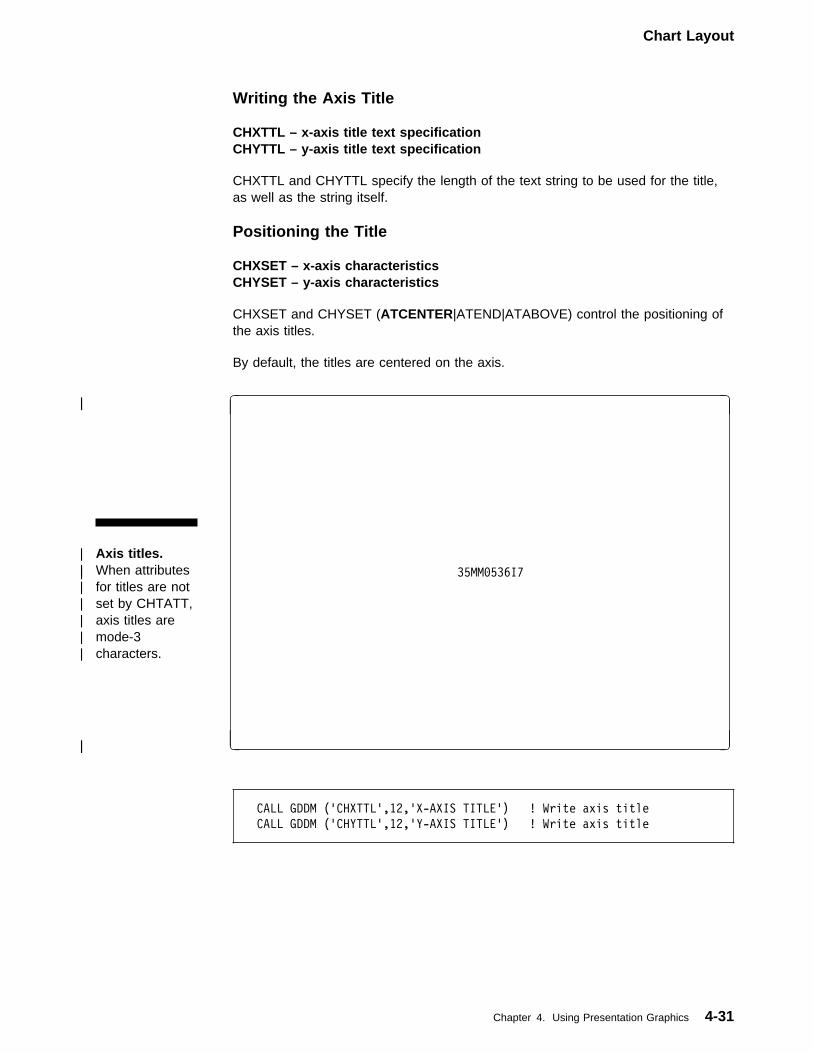
Chart Layout
Writing the Axis Title CHXTTL – x-axis title text specificationCHYTTL – y-axis title text specification
CHXTTL and CHYTTL specify the length of the text string to be used for the title,as well as the string itself.
Positioning the Title CHXSET – x-axis characteristicsCHYSET – y-axis characteristics
CHXSET and CHYSET (ATCENTER|ATEND|ATABOVE) control the positioning ofthe axis titles.
By default, the titles are centered on the axis.
| Axis titles.| When attributes| for titles are not| set by CHTATT,| axis titles are| mode-3| characters.
| �|
| 35MM�536I7
| �| �
CALL GDDM ('CHXTTL',12,'X-AXIS TITLE') ! Write axis title
CALL GDDM ('CHYTTL',12,'Y-AXIS TITLE') ! Write axis title
Chapter 4. Using Presentation Graphics 4-31
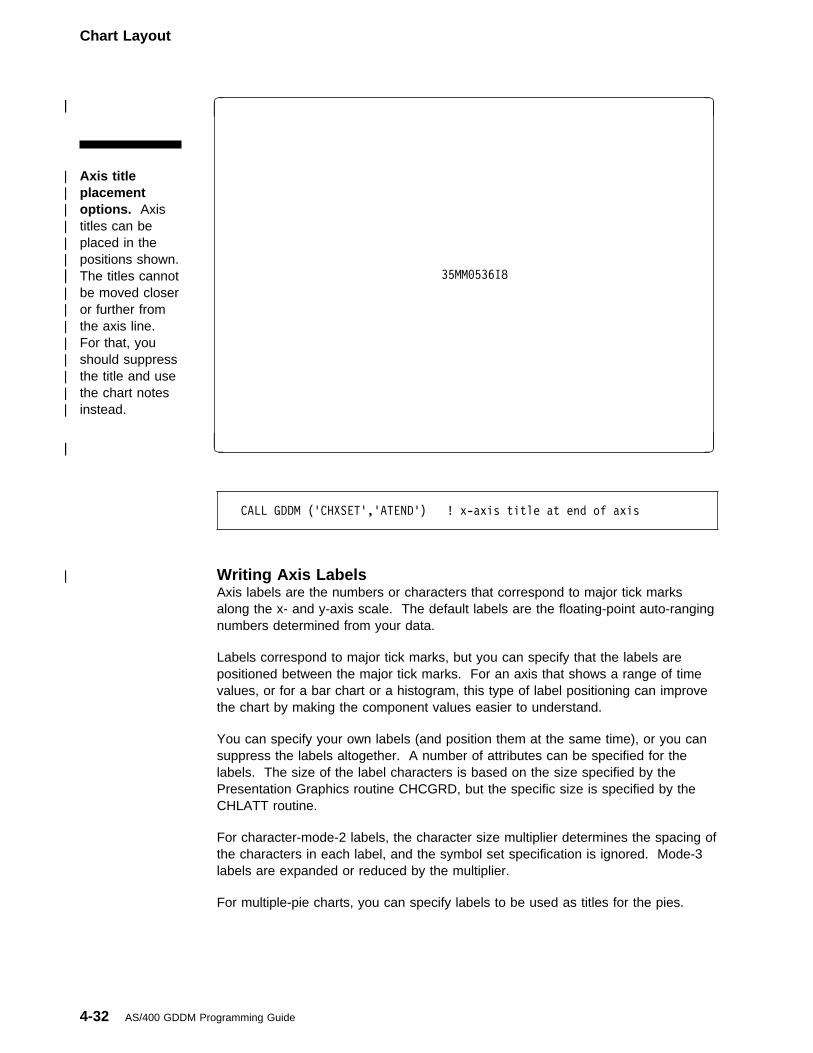
Chart Layout
| Axis title| placement| options. Axis| titles can be| placed in the| positions shown.| The titles cannot| be moved closer| or further from| the axis line.| For that, you| should suppress| the title and use| the chart notes| instead.
| �|
| 35MM�536I8
| �| �
CALL GDDM ('CHXSET','ATEND') ! x-axis title at end of axis
| Writing Axis LabelsAxis labels are the numbers or characters that correspond to major tick marksalong the x- and y-axis scale. The default labels are the floating-point auto-rangingnumbers determined from your data.
Labels correspond to major tick marks, but you can specify that the labels arepositioned between the major tick marks. For an axis that shows a range of timevalues, or for a bar chart or a histogram, this type of label positioning can improvethe chart by making the component values easier to understand.
You can specify your own labels (and position them at the same time), or you cansuppress the labels altogether. A number of attributes can be specified for thelabels. The size of the label characters is based on the size specified by thePresentation Graphics routine CHCGRD, but the specific size is specified by theCHLATT routine.
For character-mode-2 labels, the character size multiplier determines the spacing ofthe characters in each label, and the symbol set specification is ignored. Mode-3labels are expanded or reduced by the multiplier.
For multiple-pie charts, you can specify labels to be used as titles for the pies.
4-32 AS/400 GDDM Programming Guide
Chart Layout
Setting Label Attributes CHLATT – Axis label text attributes. CHLATT specifies the attributes forcharacters used in axis labels and titles for individual pies on multiple pie charts.CHLATT affects both x- and y-axis labels. Attributes that can be set for labels arecolor, character mode, character symbol-set selection, character size, rotation, andheight/width multiplier.
If CHLATT is not specified, each label uses unrotated, standard-size device defaultcharacters of the default color.
Use CHXLAT and CHYLAT to specify label text attributes for individual axes.
Setting Individual Axis Label Attributes CHXLAT – x-axis label attributesCHYLAT – y-axis label attributes
CHXLAT and CHYLAT specify the attributes for characters used in labels on theaxes. Attributes that can be set are color, character mode, character symbol-setselection, character size, rotation, and height/width multiplier.
Use CHLATT if you want both sets of axis labels to look the same.
Positioning the Labels CHXSET – x-axis characteristicsCHYSET – y-axis characteristics
CHXSET or CHYSET (LABADJACENT|LABMIDDLE|NOLAB) specifies the positionof the labels for the axes. The labels can be placed next to the tick marks(LABADJACENT), they can be placed between the tick marks (LABMIDDLE), orthey can be suppressed (NOLAB).
Blanking the Label Area CHSET – Specify chart options. CHSET (NBLABEL|BLABEL) specifies whetherthe areas where axis labels are positioned are blanked.
When the area is blanked, no other display feature can occupy the label text box(text boxes are explained on page 3-31). When the area is not blanked, the labelscan overpaint the component. Label blanking does not apply to plotters.
By default, the areas are not blanked.
Specifying the Type of Label CHXSET – x-axis characteristicsCHYSET – y-axis characteristics
CHXSET or CHYSET (NUMERIC|DATE|ALPHANUMERIC) specifies the type oflabel for the axis. You can request that numeric labels are generated automatically,that date labels are used as specified by CHXMTH, CHYMTH, CHXDAY, or
Chapter 4. Using Presentation Graphics 4-33
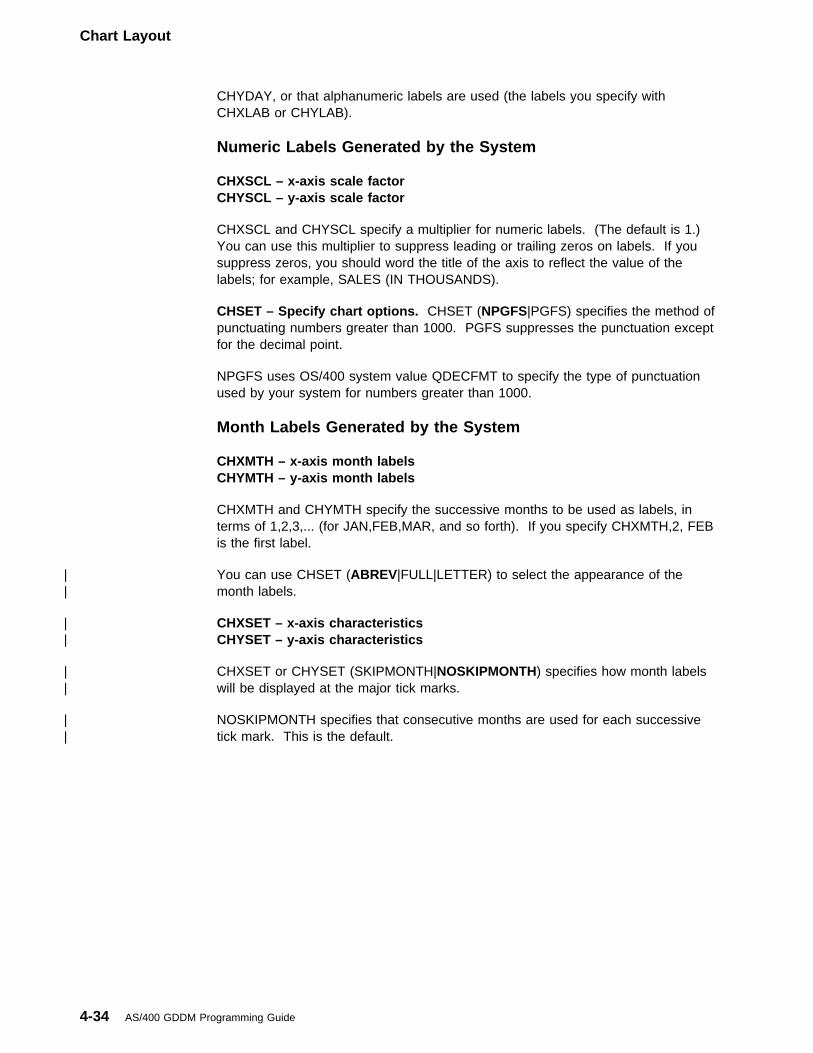
Chart Layout
CHYDAY, or that alphanumeric labels are used (the labels you specify withCHXLAB or CHYLAB).
Numeric Labels Generated by the System CHXSCL – x-axis scale factorCHYSCL – y-axis scale factor
CHXSCL and CHYSCL specify a multiplier for numeric labels. (The default is 1.)You can use this multiplier to suppress leading or trailing zeros on labels. If yousuppress zeros, you should word the title of the axis to reflect the value of thelabels; for example, SALES (IN THOUSANDS).
CHSET – Specify chart options. CHSET (NPGFS|PGFS) specifies the method ofpunctuating numbers greater than 1000. PGFS suppresses the punctuation exceptfor the decimal point.
NPGFS uses OS/400 system value QDECFMT to specify the type of punctuationused by your system for numbers greater than 1000.
Month Labels Generated by the System CHXMTH – x-axis month labelsCHYMTH – y-axis month labels
CHXMTH and CHYMTH specify the successive months to be used as labels, interms of 1,2,3,... (for JAN,FEB,MAR, and so forth). If you specify CHXMTH,2, FEBis the first label.
| You can use CHSET (ABREV|FULL|LETTER) to select the appearance of the| month labels.
| CHXSET – x-axis characteristics| CHYSET – y-axis characteristics
| CHXSET or CHYSET (SKIPMONTH|NOSKIPMONTH) specifies how month labels| will be displayed at the major tick marks.
| NOSKIPMONTH specifies that consecutive months are used for each successive| tick mark. This is the default.
4-34 AS/400 GDDM Programming Guide
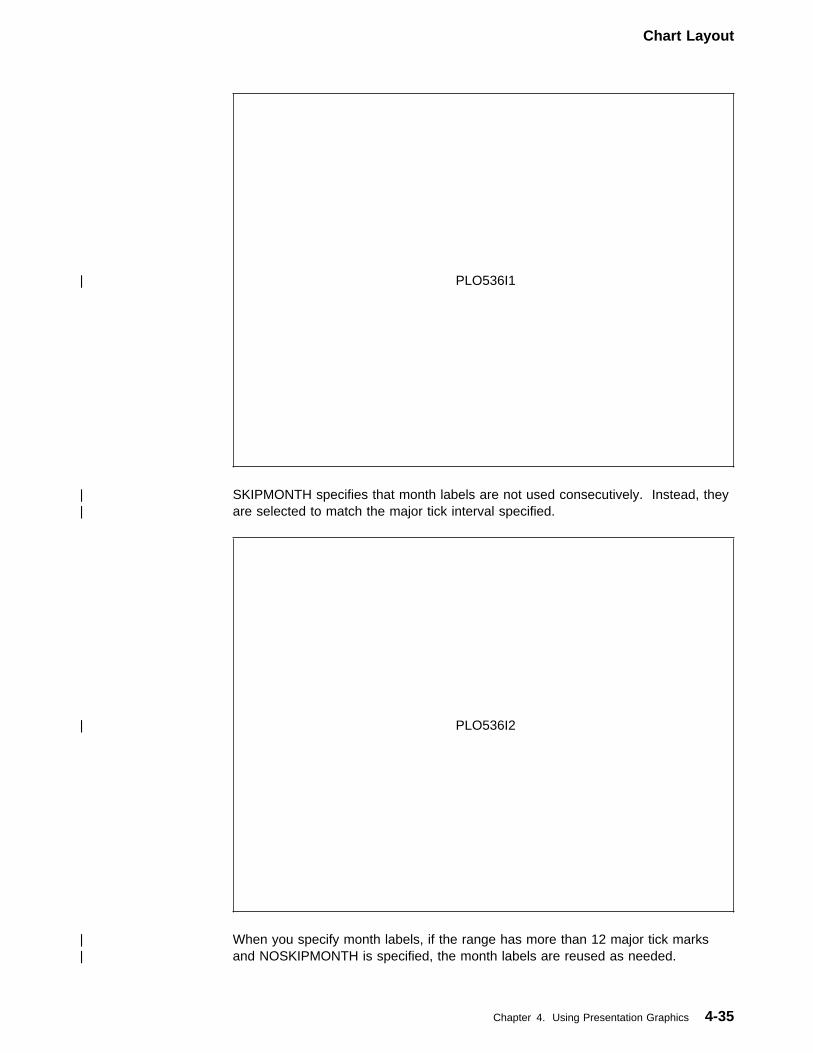
Chart Layout
| PLO536I1
| SKIPMONTH specifies that month labels are not used consecutively. Instead, they| are selected to match the major tick interval specified.
| PLO536I2
| When you specify month labels, if the range has more than 12 major tick marks| and NOSKIPMONTH is specified, the month labels are reused as needed.
Chapter 4. Using Presentation Graphics 4-35
Chart Layout
Day Labels Generated by the System CHXDAY – x-axis day labelsCHYDAY – y-axis day labels
CHXDAY and CHYDAY specify the successive days to be used as labels, in termsof 1,2,3,... (for MON,TUE,WED and so forth). If you specify CHXDAY,2, TUE is thefirst label. Consecutive days follow for each major tick mark.
You can use CHSET (ABREV|FULL|LETTER) to select the appearance of the daylabels.
When you specify day labels, specify CHXTIC or CHYTIC,1 for the labels tocorrespond one for one to the major tick marks in the range. If the range has morethan seven major tick marks, the day labels are reused as needed.
CHSET – Specify chart options. CHSET (ABREV|FULL|LETTER) specifies theform of axis labels supplied by the CHXMTH, CHYMTH, CHXDAY, and CHYDAYroutines. The names can appear in 3-character abbreviations, the full names, orthe first letter of the name.
Your Own Labels CHXLAB – x-axis label text specificationCHYLAB – y-axis label text specification
CHXLAB and CHYLAB specify the number of labels to be used, the length of thetext string to be used for the label, and the label text itself.
When you specify your own labels, you should make sure that the range (specifiedby auto-ranging or by CHXRNG and CHYRNG) for the axis matches the number oflabels you have supplied. For example, if you provide seven labels for a range thathas five major tick marks, the last two of your labels are ignored. If you provideeight labels for a range that has 10 major tick marks, the first two of your labels arereused for the ninth and tenth tick marks. Use CHXRNG and CHYRNG to set therange, and use CHXTIC and CHYTIC to set the interval for the tick marks.
4-36 AS/400 GDDM Programming Guide
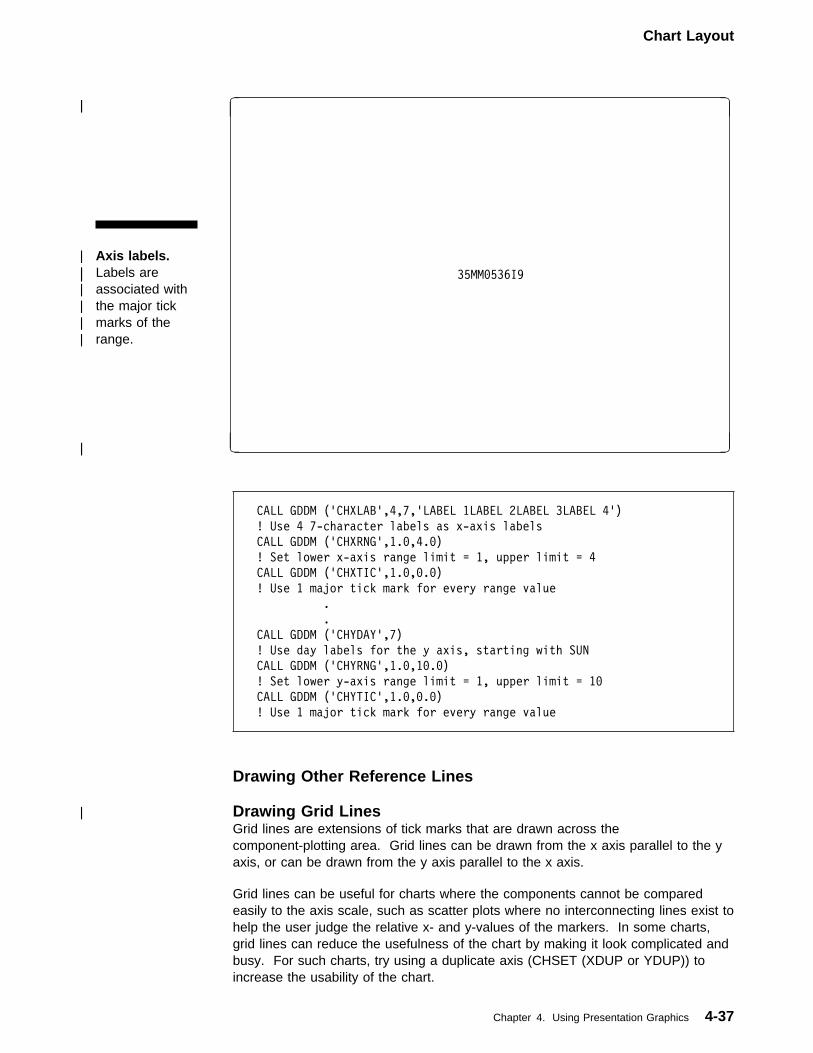
Chart Layout
| Axis labels.| Labels are| associated with| the major tick| marks of the| range.
| �|
| 35MM�536I9
| �| �
CALL GDDM ('CHXLAB',4,7,'LABEL 1LABEL 2LABEL 3LABEL 4')
! Use 4 7-character labels as x-axis labels
CALL GDDM ('CHXRNG',1.�,4.�)
! Set lower x-axis range limit = 1, upper limit = 4
CALL GDDM ('CHXTIC',1.�,�.�)
! Use 1 major tick mark for every range value
.
.
CALL GDDM ('CHYDAY',7)
! Use day labels for the y axis, starting with SUN
CALL GDDM ('CHYRNG',1.�,1�.�)
! Set lower y-axis range limit = 1, upper limit = 1�
CALL GDDM ('CHYTIC',1.�,�.�)
! Use 1 major tick mark for every range value
Drawing Other Reference Lines
| Drawing Grid LinesGrid lines are extensions of tick marks that are drawn across thecomponent-plotting area. Grid lines can be drawn from the x axis parallel to the yaxis, or can be drawn from the y axis parallel to the x axis.
Grid lines can be useful for charts where the components cannot be comparedeasily to the axis scale, such as scatter plots where no interconnecting lines exist tohelp the user judge the relative x- and y-values of the markers. In some charts,grid lines can reduce the usefulness of the chart by making it look complicated andbusy. For such charts, try using a duplicate axis (CHSET (XDUP or YDUP)) toincrease the usability of the chart.
Chapter 4. Using Presentation Graphics 4-37
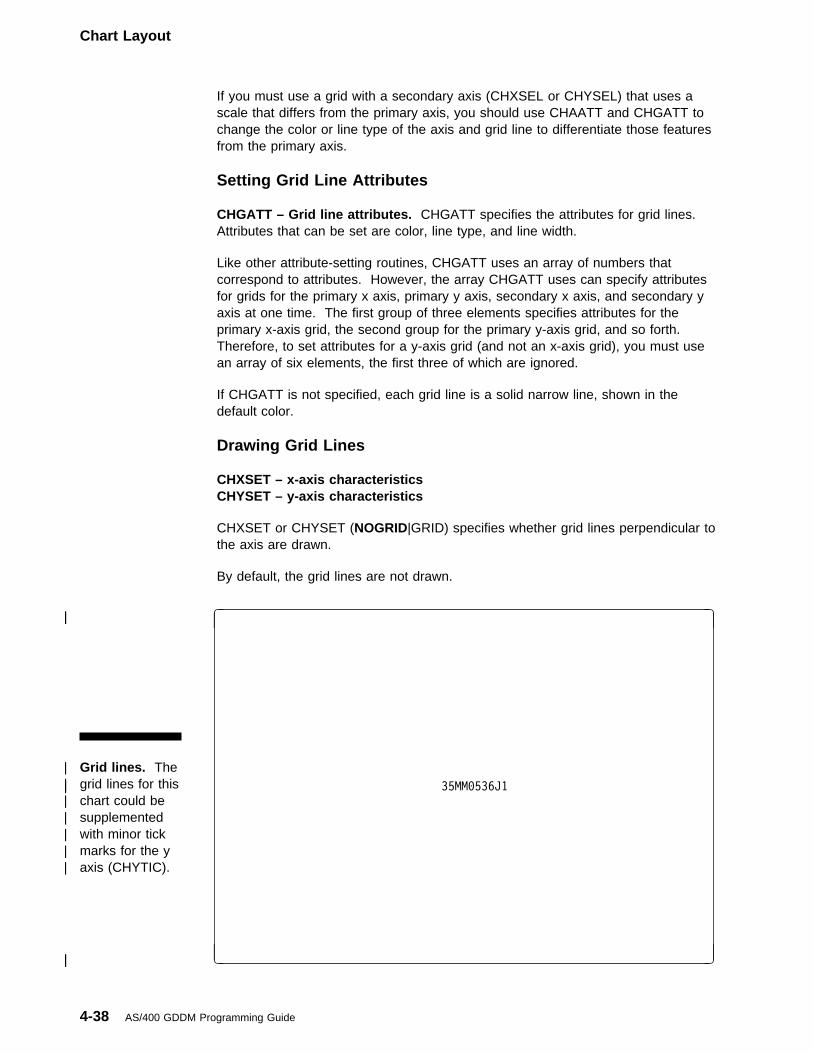
Chart Layout
If you must use a grid with a secondary axis (CHXSEL or CHYSEL) that uses ascale that differs from the primary axis, you should use CHAATT and CHGATT tochange the color or line type of the axis and grid line to differentiate those featuresfrom the primary axis.
Setting Grid Line Attributes CHGATT – Grid line attributes. CHGATT specifies the attributes for grid lines.Attributes that can be set are color, line type, and line width.
Like other attribute-setting routines, CHGATT uses an array of numbers thatcorrespond to attributes. However, the array CHGATT uses can specify attributesfor grids for the primary x axis, primary y axis, secondary x axis, and secondary yaxis at one time. The first group of three elements specifies attributes for theprimary x-axis grid, the second group for the primary y-axis grid, and so forth.Therefore, to set attributes for a y-axis grid (and not an x-axis grid), you must usean array of six elements, the first three of which are ignored.
If CHGATT is not specified, each grid line is a solid narrow line, shown in thedefault color.
Drawing Grid Lines CHXSET – x-axis characteristicsCHYSET – y-axis characteristics
CHXSET or CHYSET (NOGRID|GRID) specifies whether grid lines perpendicular tothe axis are drawn.
By default, the grid lines are not drawn.
| Grid lines. The| grid lines for this| chart could be| supplemented| with minor tick| marks for the y| axis (CHYTIC).
| �|
| 35MM�536J1
| �| �
4-38 AS/400 GDDM Programming Guide
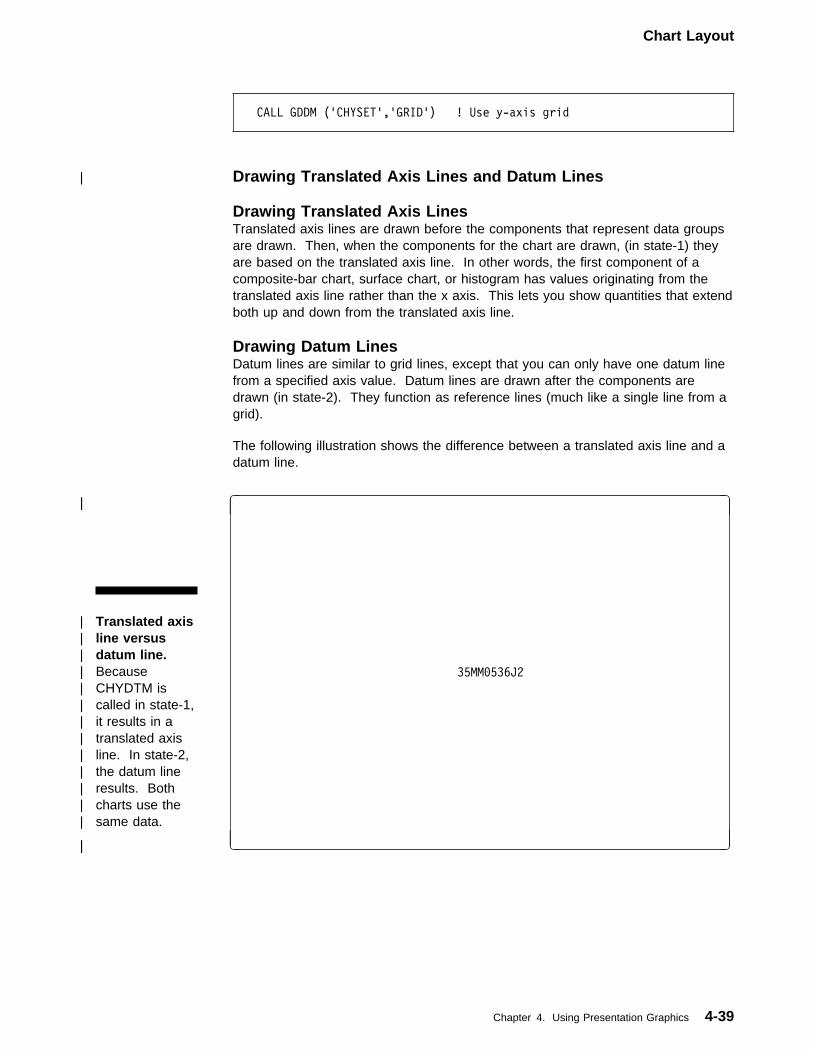
Chart Layout
CALL GDDM ('CHYSET','GRID') ! Use y-axis grid
| Drawing Translated Axis Lines and Datum Lines
Drawing Translated Axis LinesTranslated axis lines are drawn before the components that represent data groupsare drawn. Then, when the components for the chart are drawn, (in state-1) theyare based on the translated axis line. In other words, the first component of acomposite-bar chart, surface chart, or histogram has values originating from thetranslated axis line rather than the x axis. This lets you show quantities that extendboth up and down from the translated axis line.
Drawing Datum LinesDatum lines are similar to grid lines, except that you can only have one datum linefrom a specified axis value. Datum lines are drawn after the components aredrawn (in state-2). They function as reference lines (much like a single line from agrid).
The following illustration shows the difference between a translated axis line and adatum line.
| Translated axis| line versus| datum line.| Because| CHYDTM is| called in state-1,| it results in a| translated axis| line. In state-2,| the datum line| results. Both| charts use the| same data.
| �|
| 35MM�536J2
| �| �
Chapter 4. Using Presentation Graphics 4-39
Chart Layout
! State-1
CALL GDDM ('CHYDTM',25.�)
! Draw y-axis translated axis line from y=25 scale value
! ----(Chart-drawing routine)----
! State-2
.
.
! State-1
! ----(Chart-drawing routine)----
! State-2
CALL GDDM ('CHYDTM',25.�)
! Draw y-axis datum line from y=25 scale value
Setting Translated Axis Line or Datum Line Attributes CHDATT – Datum line attributes. CHDATT specifies the attributes for translatedaxis and datum lines. Attributes that can be set are color, line type, and line width.
If CHDATT is not specified, each line is a solid narrow line, shown in the defaultcolor.
Drawing Translated Axis Line or Datum Line CHXDTM – x-datum lineCHYDTM – y-datum line
CHXDTM and CHYDTM specify a point from which a translated axis line or datumline is drawn. For example, CHYDTM(10) draws a line that corresponds to thevalue 10. The line is drawn parallel to the x axis.
If CHXDTM or CHYDTM is specified before the chart is drawn (state-1), theresulting line is a translated axis line. If CHXDTM or CHYDTM is specified after thechart is drawn (state-2), the resulting line is a datum line.
Drawing Chart LegendsChart legends provide a means of identifying the components shown on the chart.The legend matches the legend key label of the component with an identifyingcharacteristic of the component, such as color, marker, or pattern. This identifyingcharacteristic is called the key; it is the name or value associated with thecomponent or the component key.
Legends can be placed anywhere on the chart, and a number of attributes can beassigned to specify the appearance of the legend.
| Drawing or Suppressing the Legend CHSET – Specify chart options. CHSET (LEGEND|NOLEGEND) specifies that alegend is to be constructed (LEGEND). CHSET (NOLEGEND) suppresses thelegend.
For a program in which multiple calls to a chart-drawing routine are used to drawseparate chart components, CHSET (NOLEGEND) suppresses the legend for each
4-40 AS/400 GDDM Programming Guide
Chart Layout
of the chart-drawing routines. Then, to draw a legend that includes legend keysand labels for each of the chart components, specify CHSET (LEGEND) before thelast call to the chart-drawing routine.
CHSET – Specify chart options. For pie charts, CHSET (PIEKEY|SPIDER)specifies whether a legend should be drawn (PIEKEY) or, if labels are to surroundthe pie, whether each is connected to the associated pie slice with a spider tag(SPIDER).
| Positioning the Legend CHKEYP – Legend position. CHKEYP specifies the orientation of the legend(vertical or horizontal), and its position in a margin.
The default is a vertical legend centered in the right margin.
CHKOFF – Legend offsets. CHKOFF specifies the final position of a vertical orhorizontal legend. The legend is based on the position specified by the CHKEYProutine, and moved a positive or negative number of character units to its finalposition.
By default, no offsets are applied.
CHKMAX – Maximum legend width/height. CHKMAX specifies the maximumheight of a vertical legend, or the maximum width of a horizontal legend.
By default, the maximum dimensions for either legend orientation is limited by thedimension of the chart area.
CHSET – Specify chart options. CHSET (KNORMAL|KREVERSED) specifiesthe order of items listed in the legend. The normal order (KNORMAL) is for the firstentry to be listed at the bottom of the legend and the last entry at the top.KREVERSED reverses that order. If the legend is horizontal, KNORMAL lists thefirst entry to the left.
| Blanking the Legend Area CHSET – Specify chart options. CHSET (NBKEY|BKEY) specifies whether anarea is blanked or not blanked before the legend is drawn in that area. (On aplotter, this option has no effect.)
By default, the legend area is not blanked.
Chapter 4. Using Presentation Graphics 4-41
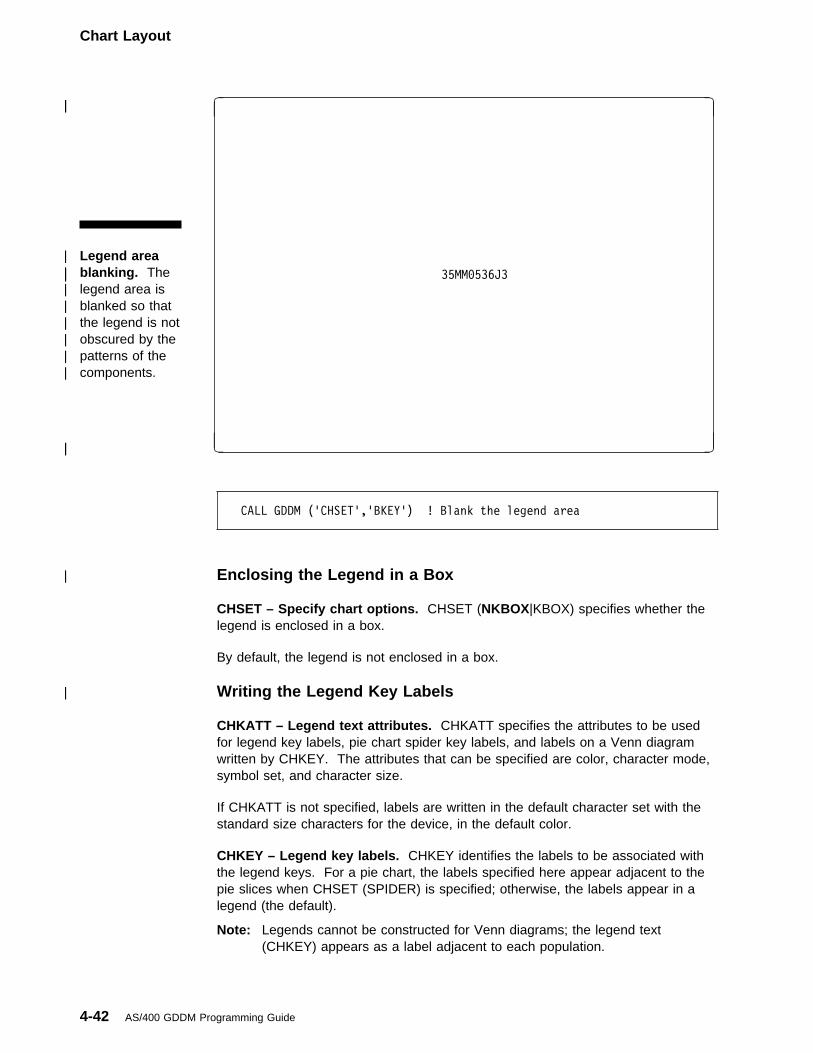
Chart Layout
| Legend area| blanking. The| legend area is| blanked so that| the legend is not| obscured by the| patterns of the| components.
| �|
| 35MM�536J3
| �| �
CALL GDDM ('CHSET','BKEY') ! Blank the legend area
| Enclosing the Legend in a Box CHSET – Specify chart options. CHSET (NKBOX|KBOX) specifies whether thelegend is enclosed in a box.
By default, the legend is not enclosed in a box.
| Writing the Legend Key Labels CHKATT – Legend text attributes. CHKATT specifies the attributes to be usedfor legend key labels, pie chart spider key labels, and labels on a Venn diagramwritten by CHKEY. The attributes that can be specified are color, character mode,symbol set, and character size.
If CHKATT is not specified, labels are written in the default character set with thestandard size characters for the device, in the default color.
CHKEY – Legend key labels. CHKEY identifies the labels to be associated withthe legend keys. For a pie chart, the labels specified here appear adjacent to thepie slices when CHSET (SPIDER) is specified; otherwise, the labels appear in alegend (the default).
Note: Legends cannot be constructed for Venn diagrams; the legend text(CHKEY) appears as a label adjacent to each population.
4-42 AS/400 GDDM Programming Guide
Chart Layout
Writing Chart NotesChart notes are character strings that are positioned anywhere on a chart to explainor identify an aspect of the chart. You can write as many notes on your chart asyou want. You can write a note, then select new attributes and write a differentnote elsewhere on the chart. Notes are written with the graphics symbol set loadedby the GDDM routine GSLSS. The size of the label characters is based on thesize specified by the Presentation Graphics routine CHCGRD, but the specific sizeis specified by the CHNATT routine.
When you use notes, be careful that they add to, not detract from, the simplicityand usefulness of the chart.
Chart notes can be written only in state-2. (State-2 is any point after the chartdrawing routine is executed.)
| Setting Attributes for Notes CHNATT – Specify text attributes for notes. CHNATT specifies the attributes tobe used by notes. The attributes that can be specified are color, character mode,symbol set, character size, rotation, and height/width multiplier.
If CHNATT is not specified, notes are shown in the default color, and are writtenunrotated in the default mode-3 character set with the standard size characters forthe device.
| Blanking the Note Area CHSET – Specify chart options. CHSET (NBNOTE|BNOTE) specifies whetheran area is blanked or not blanked before the note is written in that area. (On aplotter, this option has no effect.)
| Enclosing the Note in a Box CHSET – Specify chart options. CHSET (NONBOX|NBOX) specifies whether thenote is enclosed in a box.
| Writing the Note CHNOFF – Specify offsets for CHNOTE. CHNOFF specifies the position of anote.
CHNOTE – Write a character string at a designated location. CHNOTE writes anote at a position specified by CHNOFF.
You can use a semicolon (;) as a line-break character to generate multiple linenotes. To include a semicolon as part of a note, use two semicolons (;;).
The CHNOTE routine has three parameters:
The base position of the noteThe number of characters in the noteThe note text itself
Chapter 4. Using Presentation Graphics 4-43
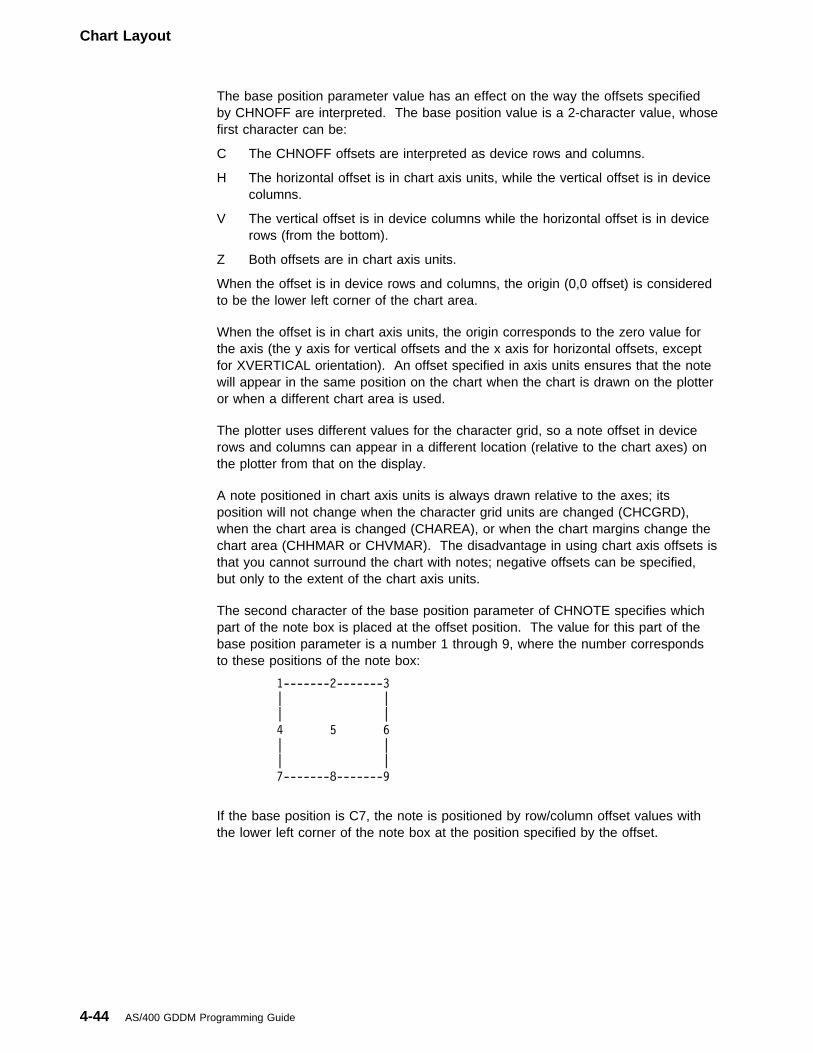
Chart Layout
The base position parameter value has an effect on the way the offsets specifiedby CHNOFF are interpreted. The base position value is a 2-character value, whosefirst character can be:
C The CHNOFF offsets are interpreted as device rows and columns.
H The horizontal offset is in chart axis units, while the vertical offset is in devicecolumns.
V The vertical offset is in device columns while the horizontal offset is in devicerows (from the bottom).
Z Both offsets are in chart axis units.
When the offset is in device rows and columns, the origin (0,0 offset) is consideredto be the lower left corner of the chart area.
When the offset is in chart axis units, the origin corresponds to the zero value forthe axis (the y axis for vertical offsets and the x axis for horizontal offsets, exceptfor XVERTICAL orientation). An offset specified in axis units ensures that the notewill appear in the same position on the chart when the chart is drawn on the plotteror when a different chart area is used.
The plotter uses different values for the character grid, so a note offset in devicerows and columns can appear in a different location (relative to the chart axes) onthe plotter from that on the display.
A note positioned in chart axis units is always drawn relative to the axes; itsposition will not change when the character grid units are changed (CHCGRD),when the chart area is changed (CHAREA), or when the chart margins change thechart area (CHHMAR or CHVMAR). The disadvantage in using chart axis offsets isthat you cannot surround the chart with notes; negative offsets can be specified,but only to the extent of the chart axis units.
The second character of the base position parameter of CHNOTE specifies whichpart of the note box is placed at the offset position. The value for this part of thebase position parameter is a number 1 through 9, where the number correspondsto these positions of the note box:
1-------2-------3
| |
| |
4 5 6
| |
| |
7-------8-------9
If the base position is C7, the note is positioned by row/column offset values withthe lower left corner of the note box at the position specified by the offset.
4-44 AS/400 GDDM Programming Guide
Chart Layout
| Chart notes.| The chart notes| in red use an| offset of 0,0 (the| left margin is| increased to 15| to preserve the| y-axis scale for| this illustration).| The C1 note| offset in device| units appears| despite having a| base position| that should place| it outside the| chart area.
| �|
| 35MM�536J4
| �| �
! For the red chart notes:
CALL GDDM ('CHYRNG',-45.�,3�.�)
CALL GDDM ('CHXRNG',�.�,12.�)
INTEGER NATT ! Declare integer
DIM NATT(2) : MAT READ NATT ! Read note array
DATA 2,2
! 2 = red, 2 = character mode
CALL GDDM ('CHNATT',2,NATT()) ! Set note attributes
CALL GDDM ('CHNOFF',�.�,�.�) ! Set note position
CALL GDDM ('CHNOTE','C1',18,'C1 NOTE;OFFSET �,�')
CALL GDDM ('CHNOTE','H1',18,'H1 NOTE;OFFSET �,�')
CALL GDDM ('CHNOTE','V1',18,'V1 NOTE;OFFSET �,�')
CALL GDDM ('CHNOTE','Z1',18,'Z1 NOTE;OFFSET �,�')
Designing the Chart Layout: SummaryThe part you have just finished reading showed you how to set up the layout for achart. In setting up this layout you can specify the following features:
Chart size, which also depends on the size of the chart character grid and chartmargins
Chart frame or background
Chart heading
Chart reference lines (except for pie charts and Venn diagrams), including:
Axes, with tick marks, labels that correspond to tick marks, and the axistitle
Grid lines
Chapter 4. Using Presentation Graphics 4-45
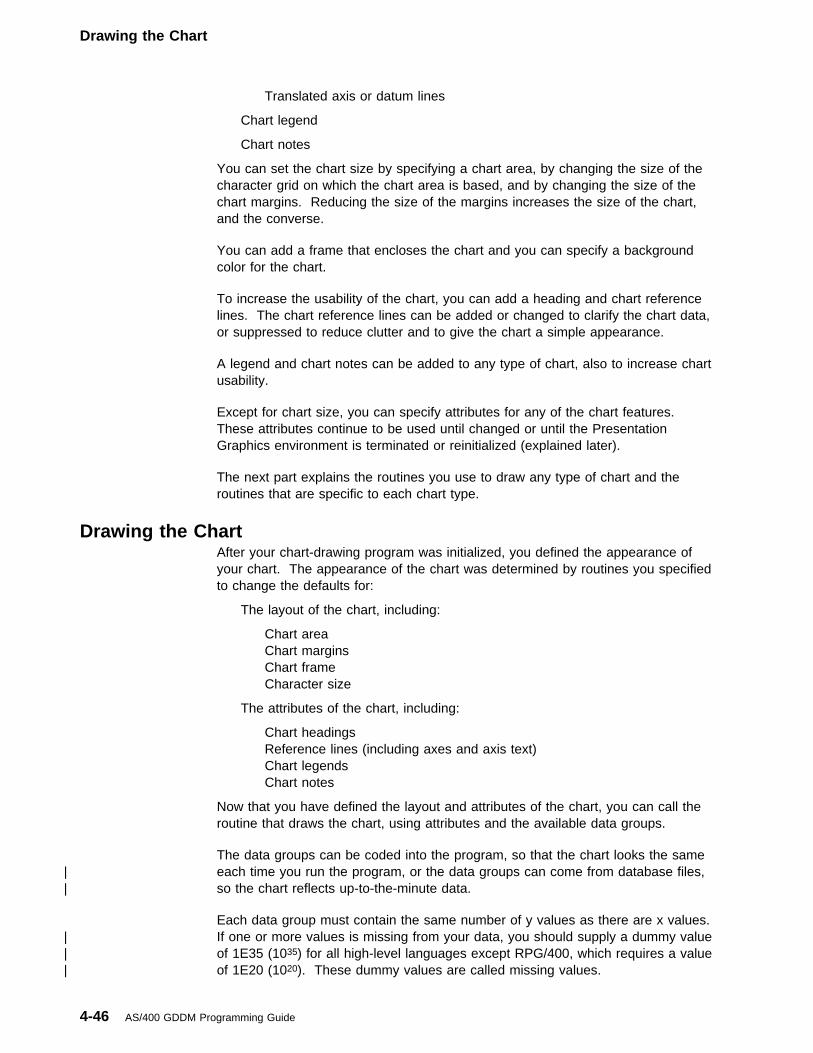
Drawing the Chart
Translated axis or datum lines
Chart legend
Chart notes
You can set the chart size by specifying a chart area, by changing the size of thecharacter grid on which the chart area is based, and by changing the size of thechart margins. Reducing the size of the margins increases the size of the chart,and the converse.
You can add a frame that encloses the chart and you can specify a backgroundcolor for the chart.
To increase the usability of the chart, you can add a heading and chart referencelines. The chart reference lines can be added or changed to clarify the chart data,or suppressed to reduce clutter and to give the chart a simple appearance.
A legend and chart notes can be added to any type of chart, also to increase chartusability.
Except for chart size, you can specify attributes for any of the chart features.These attributes continue to be used until changed or until the PresentationGraphics environment is terminated or reinitialized (explained later).
The next part explains the routines you use to draw any type of chart and theroutines that are specific to each chart type.
Drawing the ChartAfter your chart-drawing program was initialized, you defined the appearance ofyour chart. The appearance of the chart was determined by routines you specifiedto change the defaults for:
The layout of the chart, including:
Chart area Chart margins Chart frame Character size
The attributes of the chart, including:
Chart headingsReference lines (including axes and axis text)
Chart legends Chart notes
Now that you have defined the layout and attributes of the chart, you can call theroutine that draws the chart, using attributes and the available data groups.
The data groups can be coded into the program, so that the chart looks the same| each time you run the program, or the data groups can come from database files,| so the chart reflects up-to-the-minute data.
Each data group must contain the same number of y values as there are x values.| If one or more values is missing from your data, you should supply a dummy value| of 1E35 (1035) for all high-level languages except RPG/400, which requires a value| of 1E20 (1020). These dummy values are called missing values.
4-46 AS/400 GDDM Programming Guide
Drawing the Chart
Note: Missing values are not supported for Venn diagrams.
Using Component AttributesIf your chart represents more than one data group, you need to differentiate thegroups. For example, a line chart that shows three lines, all of the same line typeand color would be very difficult to understand. Therefore, various componentattributes can be assigned to distinguish one data group from another.
When a multiple component chart is drawn, some types of component attribute areselected from a table. These attributes are:
Color Line type Shading pattern Marker type
Tables contain entries that determine the order the attributes are assigned. Forexample, a color attribute table could contain entries in this order: red, yellow,blue, and the default color. If the chart had three components, the first would bered, the second yellow, and the third blue. If the chart had five components, thefourth would be the default color and the fifth would be red (the table entries arereused in order). Note that the GDDM routines GSCOL, GSLW, GSPAT, andGSMARK are not used for Presentation Graphics.
The component attributes are discussed with each chart type.
Some of the following charts are pictures as produced on the display and some areplots as produced on the IBM 6180 Plotter. For those, the accompanying programsinclude the device routines necessary to send the picture to the plotter. For moreinformation on device routines, see Appendix A, “Devices Compatible with theAS/400 System.”
Drawing Line Charts
| Setting the Color Selection Order CHCOL – Set component color. CHCOL sets the color of the lines, by defining atable that holds the number of colors and the order of their selection.
If CHCOL is not specified, the sequence of colors in the default color table is used.The default color table is the GDDM color table which is either the default colortable for the current page or a color table modified for use in the current page.
| Setting the Line Type Selection Order CHLT – Set component line type. CHLT sets the line type of the components bydefining a table that holds the number of line types and the order of their selection.
If CHLT is not used, all components are drawn with the line type defaulted to orspecified for entry 0 of the line type table. The default line type table shown for thediscussion of the GSLT routine in Chapter 3, “Using GDDM” shows the order ofselection. The components are differentiated by their colors and marker types.
Chapter 4. Using Presentation Graphics 4-47
Drawing the Chart
| Setting the Line Width CHLW – Set component line width. CHLW sets the line width of the componentsby defining a table that holds the multiplication factor to be applied to the defaultline width.
If CHLW is not used, all components are drawn with the standard line width for thedevice.
| Setting the Marker Type Selection Order CHMARK – Set component marker. CHMARK sets the type of marker used byeach of the components by defining a table that holds the number of markers andthe order of their selection.
If CHMARK is not specified, the sequence of markers in the default marker table isused. The default marker table shown for the discussion of the GSMARK routine inChapter 3, “Using GDDM” shows the order of selection.
| Suppressing the Markers CHSET – Specify chart options. CHSET (NOMARKERS) suppresses themarkers.
| Setting the Line Curve CHSET – Specify chart options. CHSET(CURVE) draws the components withline curving; the degree of line curving is specified by the CHFINE routine. IfCHSET(CURVE) is specified, the default value of CHFINE is 10.
A curved line is more attractive than one with straight lines connecting data points,but the curved line can be misleading on a chart where a high degree of accuracyis needed. Presentation Graphics passes the curved line through the data points,but does not interpolate the true values that lie between data points; therefore,values on the curved line between data points can be inaccurate.
CHFINE – Set line curving smoothness. CHFINE sets the degree of curvesmoothness of the components. The higher the number specified for CHFINE, thesmoother the curve drawn by CHSET(CURVE).
By default, the degree of smoothness is 10. A number higher than 10 might notadd any noticeable degree of smoothness to the curve but it could greatly increasethe time needed by the system to process and draw the chart.
| Writing Data Values| | CHSET – Specify chart options. CHSET(NOVALUES|VALUES) controls how| values are displayed. CHSET(VALUES) writes the data value represented by each| data point adjacent to the data point. CHSET(NOVALUES) indicates that no data| values are displayed for the data points.
| CHSET(BVALUES) blanks the areas where data values are written. When the area| is blanked, no other display feature can occupy the data value text box. When the| area is not blanked (NBVALUES), the values can overpaint the component.
4-48 AS/400 GDDM Programming Guide
Drawing the Chart
| CHVCHR – Number of data value characters. CHVCHR sets the number of| characters to be used for showing data values on a line chart. The value text| attributes are controlled by CHVATT.
| Up to 15 characters can be used, but some of the 15 characters from one data| value would probably overwrite those for the next data point.
| By default, the true value represented by the data point is used, up to 9 character| positions.
| CHSET – Specify chart options. CHSET(NPGFS|PGFS) specifies the method of| punctuating numbers greater than 1000 displayed on the chart. PGFS suppresses| the punctuation except for the decimal point. NPGFS uses OS/400 system value| QDECFMT to specify the type of punctuation used for numbers greater than 1000| by your system.
| CHVATT – Value text attributes. CHVATT specifies the attributes for value text.| Value text is used to show individual values for data points on a line chart.| Attributes that can be set are color, and character font, size, and rotation.
| If CHVATT is not specified, each data value is shown in standard-size default| characters, in the default color, in the default 0 rotation.
| Drawing the Chart CHPLOT – Draw a line graph or a scatter plot. CHPLOT draws the line chart.Parameters in the CHPLOT routine specify the number of components to be drawn,the number of data points in each component, and the arrays used for the datagroups the components are drawn to represent.
This is a line chart produced on a plotter:
Chapter 4. Using Presentation Graphics 4-49
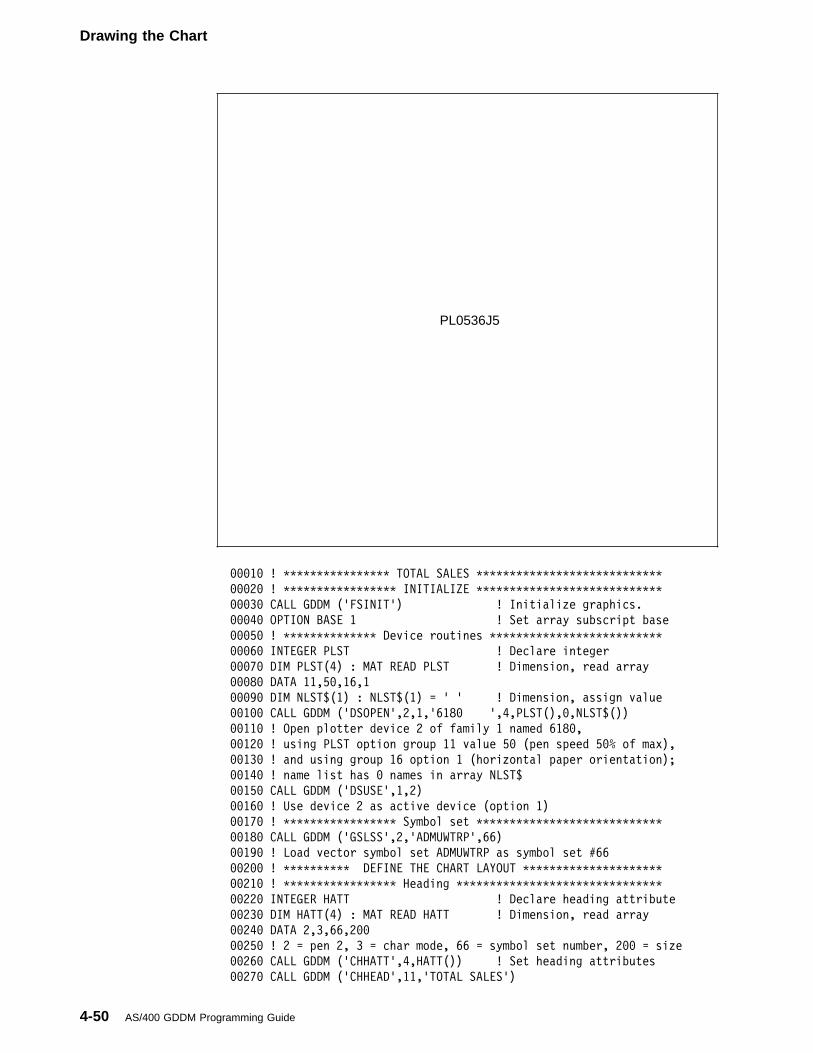
Drawing the Chart
PL0536J5
���1� ! ���������������� TOTAL SALES ����������������������������
���2� ! ����������������� INITIALIZE ����������������������������
���3� CALL GDDM ('FSINIT') ! Initialize graphics.
���4� OPTION BASE 1 ! Set array subscript base
���5� ! �������������� Device routines ��������������������������
���6� INTEGER PLST ! Declare integer
���7� DIM PLST(4) : MAT READ PLST ! Dimension, read array
���8� DATA 11,5�,16,1
���9� DIM NLST$(1) : NLST$(1) = ' ' ! Dimension, assign value
��1�� CALL GDDM ('DSOPEN',2,1,'618� ',4,PLST(),�,NLST$())
��11� ! Open plotter device 2 of family 1 named 618�,
��12� ! using PLST option group 11 value 5� (pen speed 5�% of max),
��13� ! and using group 16 option 1 (horizontal paper orientation);
��14� ! name list has � names in array NLST$
��15� CALL GDDM ('DSUSE',1,2)
��16� ! Use device 2 as active device (option 1)
��17� ! ����������������� Symbol set ����������������������������
��18� CALL GDDM ('GSLSS',2,'ADMUWTRP',66)
��19� ! Load vector symbol set ADMUWTRP as symbol set #66
��2�� ! ���������� DEFINE THE CHART LAYOUT ���������������������
��21� ! ����������������� Heading �������������������������������
��22� INTEGER HATT ! Declare heading attribute
��23� DIM HATT(4) : MAT READ HATT ! Dimension, read array
��24� DATA 2,3,66,2��
��25� ! 2 = pen 2, 3 = char mode, 66 = symbol set number, 2�� = size
��26� CALL GDDM ('CHHATT',4,HATT()) ! Set heading attributes
��27� CALL GDDM ('CHHEAD',11,'TOTAL SALES')
4-50 AS/400 GDDM Programming Guide
Drawing the Chart
��28� ! Write 11-character heading with 'character string'
��29� ! ����������������� Axis ����������������������������������
��3�� CALL GDDM ('CHXTTL',5,'MONTH') ! Write 5-character x title
��31� CALL GDDM ('CHYTTL',23,'UNITS SOLD IN THOUSANDS') ! y title
��32� CALL GDDM ('CHXMTH',1) ! Month labels begin with JAN
��33� CALL GDDM ('CHXSET','NOFORCEZERO') ! Label JAN starts at y axis
��34� ! ����������������� Legend ��������������������������������
��35� CALL GDDM ('CHSET','KBOX') ! Put legend inside box.
��36� CALL GDDM ('CHKEYP','H','B','C')
��37� ! Legend position horizontal, bottom, centered
��38� CALL GDDM ('CHKEY',2,7,'Group AGroup B')
��39� ! Write two 7-character legend key labels using 'string'
| ��4�� ! ��������� Set attributes for Line Chart �����������������
| ��41� INTEGER VATT ! Declare value attributes
| ��42� DIM VATT(6) : MAT READ VATT ! Dimension, read array
| ��43� DATA 3,3,�,1��,1��,9���
| ��44� ! 3 = pen 3, 3 = char mode, � = default symbol set
| ��45� ! 1�� = default char size, 1�� = default height/width multiplier
| ��46� ! 9��� = 9� degree rotation
| ��47� CALL GDDM('CHSET','VALUES') ! Draw value labels
| ��48� CALL GDDM('CHVATT',6,VATT()) ! Set value label attributes
| ��49� CALL GDDM ('CHSET','CURVE') ! Smooth the plotted lines
| ��5�� ! ��������� Specify data for Line Chart �������������������
| ��51� DIM MONTHS(12) : MAT READ MONTHS ! Array for x axis
| ��52� DATA 1, 2, 3, 4, 5, 6, 7, 8, 9,1�,11,12
| ��53� DIM SALES(24) : MAT READ SALES ! Array for y axis
| ��54� DATA 5,6,8,11,14,19,13,1�,11,9,7,6
| ��55� DATA 13,12,14,19,2�,27,25,17,17,14,13,12
| ��56� ! ��������������� DRAW LINE CHART ��������������������������
| ��57� CALL GDDM ('CHPLOT',2,12,MONTHS(),SALES())
| ��58� ! Draw chart with 2 components (lines), 12 data points per line
| ��59� ! ��������������� SEND TO DEVICE ���������������������������
| ��6�� CALL GDDM ('FSFRCE') ! Send to device
| ��61� ! ����������������� TERMINATE �����������������������������
| ��62� CALL GDDM ('FSTERM') ! Terminate graphics
| ��63� END ! End BASIC program
Drawing Scatter Plots
| Setting the Color Selection Order CHCOL – Set component color. CHCOL sets the color of the markers, bydefining a table that holds the number of colors and the order of their selection.
If CHCOL is not specified, the sequence of colors in the default color table is used.The default color table is the GDDM color table which is either the default colortable for the current page or a color table modified for use in the current page.
| Setting the Marker Type Selection Order CHMARK – Set component marker. CHMARK sets the type of marker used byeach of the components, by defining a table that holds the number of markers andthe order of their selection.
Chapter 4. Using Presentation Graphics 4-51
Drawing the Chart
If CHMARK is not specified, the sequence of markers in the default marker table isused. The default marker table shown for the discussion of the GSMRKS routine inChapter 3, “Using GDDM” shows the order of selection.
| Writing Data Values| | CHSET – Specify chart options. CHSET(NOVALUES|VALUES) controls how| values are displayed. CHSET(VALUES) writes the data value represented by each| data point adjacent to the data point. CHSET(NOVALUES) indicates that no data| values are displayed for the data points.
| CHSET(BVALUES) blanks the areas where data values are written. When the area| is blanked, no other display feature can occupy the data value text box. When the| area is not blanked (NBVALUES), the values can overpaint the component.
| CHVCHR – Number of data value characters. CHVCHR sets the number of| characters to be used for showing data values on a scatter plot. The value text| attributes are controlled by CHVATT.
| Up to 15 characters can be used, but some of the 15 characters from one data| value would probably overwrite those for the next data point.
| By default, the true value represented by the data point is used, up to 9 character| positions.
| CHSET – Specify chart options. CHSET(NPGFS|PGFS) specifies the method of| punctuating numbers greater than 1000 displayed on the chart. PGFS suppresses| the punctuation except for the decimal point. NPGFS uses OS/400 system value| QDECFMT to specify the type of punctuation used for numbers greater than 1000| by your system.
| CHVATT – Value text attributes. CHVATT specifies the attributes for value text.| Value text is used to show individual values for data points on a scatter plot.| Attributes that can be set are color, and character font, size, and rotation.
| If CHVATT is not specified, each data value is shown in standard-size device| default characters, in the default color, in the default 0 rotation.
| Drawing the Scatter Plot CHSET – Specify chart options. CHSET (NOLINES) suppresses theinterconnecting lines between points of a line chart, resulting in scatter plot.
CHPLOT – Draw a line graph or a scatter plot. CHPLOT draws the scatter plot.Parameters in the CHPLOT routine specify the number of components to be drawn,the number of data points in each component, and the arrays used for the datagroups the components are drawn to represent.
The next chart is a scatter plot produced on the display. For this chart, alogarithmic scale is used for the y axis, and the axis is duplicated.
4-52 AS/400 GDDM Programming Guide
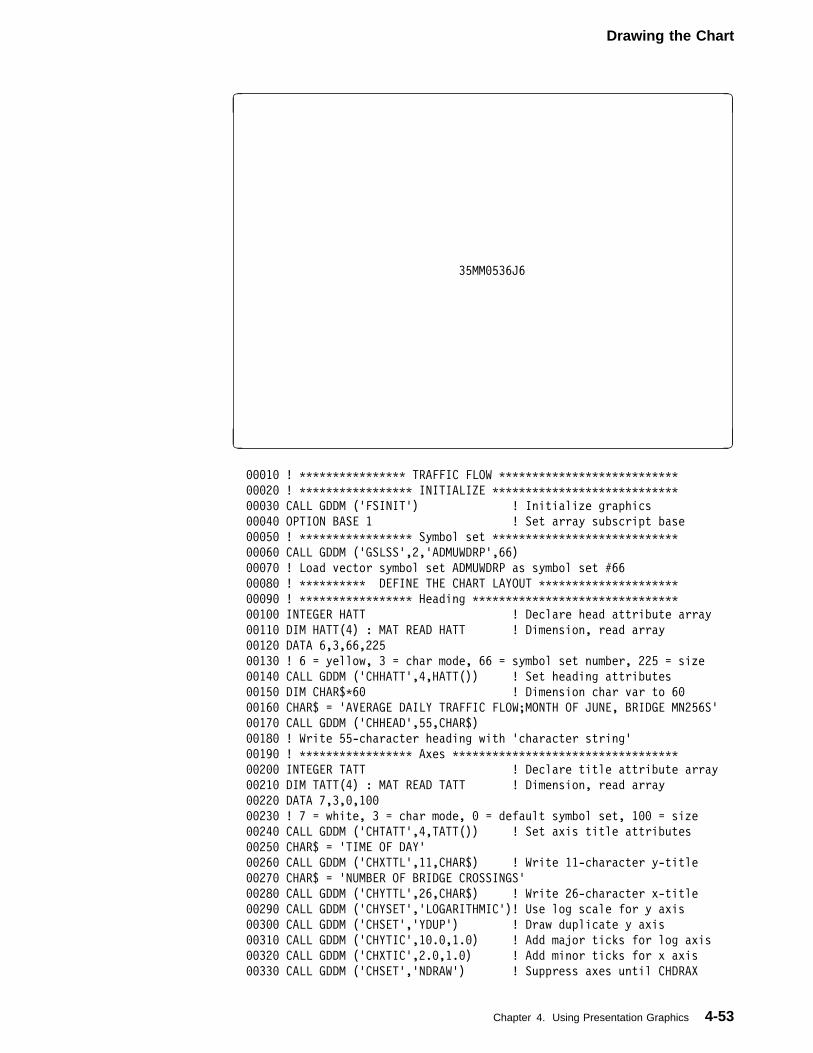
Drawing the Chart
�
35MM�536J6
� �
���1� ! ���������������� TRAFFIC FLOW ���������������������������
���2� ! ����������������� INITIALIZE ����������������������������
���3� CALL GDDM ('FSINIT') ! Initialize graphics
���4� OPTION BASE 1 ! Set array subscript base
���5� ! ����������������� Symbol set ����������������������������
���6� CALL GDDM ('GSLSS',2,'ADMUWDRP',66)
���7� ! Load vector symbol set ADMUWDRP as symbol set #66
���8� ! ���������� DEFINE THE CHART LAYOUT ���������������������
���9� ! ����������������� Heading �������������������������������
��1�� INTEGER HATT ! Declare head attribute array
��11� DIM HATT(4) : MAT READ HATT ! Dimension, read array
��12� DATA 6,3,66,225
��13� ! 6 = yellow, 3 = char mode, 66 = symbol set number, 225 = size
��14� CALL GDDM ('CHHATT',4,HATT()) ! Set heading attributes
��15� DIM CHAR$�6� ! Dimension char var to 6�
��16� CHAR$ = 'AVERAGE DAILY TRAFFIC FLOW;MONTH OF JUNE, BRIDGE MN256S'
��17� CALL GDDM ('CHHEAD',55,CHAR$)
��18� ! Write 55-character heading with 'character string'
��19� ! ����������������� Axes ����������������������������������
��2�� INTEGER TATT ! Declare title attribute array
��21� DIM TATT(4) : MAT READ TATT ! Dimension, read array
��22� DATA 7,3,�,1��
��23� ! 7 = white, 3 = char mode, � = default symbol set, 1�� = size
��24� CALL GDDM ('CHTATT',4,TATT()) ! Set axis title attributes
��25� CHAR$ = 'TIME OF DAY'
��26� CALL GDDM ('CHXTTL',11,CHAR$) ! Write 11-character y-title
��27� CHAR$ = 'NUMBER OF BRIDGE CROSSINGS'
��28� CALL GDDM ('CHYTTL',26,CHAR$) ! Write 26-character x-title
��29� CALL GDDM ('CHYSET','LOGARITHMIC')! Use log scale for y axis
��3�� CALL GDDM ('CHSET','YDUP') ! Draw duplicate y axis
��31� CALL GDDM ('CHYTIC',1�.�,1.�) ! Add major ticks for log axis
��32� CALL GDDM ('CHXTIC',2.�,1.�) ! Add minor ticks for x axis
��33� CALL GDDM ('CHSET','NDRAW') ! Suppress axes until CHDRAX
Chapter 4. Using Presentation Graphics 4-53
Drawing the Chart
��34� ! ���������������� Legend ���������������������������������
��35� CALL GDDM ('CHKEYP','H','B','C') ! Position legend
��36� ! 'H' = horizontal, 'B' = bottom, 'C' = centered
��37� CHAR$ = ' TRUCKS AUTOMOBILESMOTORCYCLES BICYCLES '
��38� CALL GDDM ('CHKEY',4,11,CHAR$)
��39� ! Write four 11-character legend key labels using 'string'
��4�� CALL GDDM ('CHSET','KBOX') ! Enclose legend in box
��41� ! ��������� Specify data for Scatter Plot �����������������
��42� DIM TIMES(24) : MAT READ TIMES ! Array for x axis
��43� DATA 1, 2, 3, 4, 5, 6, 7, 8, 9, 1�, 11, 12
��44� DATA 13, 14, 15, 16, 17, 18, 19, 2�, 21, 22, 23, 24
��45� DIM TRAFFIC(96) : MAT READ TRAFFIC ! Array for y axis
��46� DATA 5, 6, 4, 9, 12, 18, 33, 3�, 37, 34, 23, 15
��47� DATA 37, 34, 33, 32, 3�, 12, 1�, 1�, 9, 11, 6, 4
��48� DATA 2�, 13, 14, 31, 48,189,24�,254,237,184,195,215
��49� DATA 219,184,173,23�,266,189,11�,14�,132, 84, 74, 35
��5�� DATA 3, 2, 1, 4, 8, 1�, 33, 21, 1�, 9, 5, 15
��51� DATA 19, 4, 7, 3�, 27, 14, 1�, 12, 17, 13, 9, 5
��52� DATA 1, 1, 1, 1, 2, 1�, 15, 18, 1�, 12, 13, 15
��53� DATA 19, 14, 17, 16, 22, 17, 14, 13, 1�, 3, 2, 3
��54� ! ��������������� DRAW SCATTER PLOT ������������������������
��55� CALL GDDM ('CHSET','NOLINES') ! Suppress lines
��56� CALL GDDM ('CHPLOT',4,24,TIMES(),TRAFFIC())! Draw scatter plot
��57� CALL GDDM ('CHDRAX') ! Draw axes
��58� ! ��������������� Send to display ��������������������������
��59� INTEGER ATTYPE,ATMOD,COUNT
��6�� CALL GDDM ('ASREAD',ATTYPE,ATMOD,COUNT) ! Send to display
��61� ! ����������������� TERMINATE �����������������������������
��62� CALL GDDM ('FSTERM') ! Terminate graphics
��63� END ! End BASIC program
Drawing Surface Charts
| Setting the Component Color Selection Order CHCOL – Set component color. CHCOL sets the color of the components, bydefining a table that holds the number of colors and the order of their selection.
If CHCOL is not specified, the sequence of colors in the default color table is used.The default color table is the GDDM color table which is either the default colortable for the current page or a color table modified for use in the current page.
| Setting the Line Curve CHSET – Specify chart options. CHSET (CURVE) draws the components withline curving; the degree of line curving is specified by the CHFINE routine. IfCHSET(CURVE) is specified, the default value of CHFINE is 10.
A curved line is more attractive than one with straight lines connecting data points,but the curved line can be misleading on a chart where a high degree of accuracyis needed. Presentation Graphics passes the curved line through the data points,but does not interpolate the true values that lie between data points; therefore,values on the curved line between data points can be inaccurate.
4-54 AS/400 GDDM Programming Guide
Drawing the Chart
CHFINE – Set line curving smoothness. CHFINE sets the degree of curvesmoothness of the components.
By default, the degree of smoothness is 10. A number higher than 10 might notadd any noticeable degree of smoothness to the curve but will substantiallyincrease the time needed by the system to process and draw the chart.
| Writing Data Values| | CHSET – Specify chart options. CHSET(NOVALUES|VALUES) controls how| values are displayed. CHSET(VALUES) writes the data value represented by each| data point adjacent to the data point. CHSET(NOVALUES) indicates that no data| values are displayed for the data points.
| CHSET(BVALUES) blanks the areas where data values are written. When the area| is blanked, no other display feature can occupy the data value text box. When the| area is not blanked (NBVALUES), the values can overpaint the component.
| CHVCHR – Number of data value characters. CHVCHR sets the number of| characters to be used for showing data values on a surface chart. The value text| attributes are controlled by CHVATT.
| Up to 15 characters can be used, but some of the 15 characters from one data| value would probably overwrite those for the next data point.
| By default, the true value represented by the data point is used, up to 9 character| positions.
| CHSET – Specify chart options. CHSET(NPGFS|PGFS) specifies the method of| punctuating numbers greater than 1000 displayed on the chart. PGFS suppresses| the punctuation except for the decimal point. NPGFS uses OS/400 system value| QDECFMT to specify the type of punctuation used for numbers greater than 1000| by your system.
| CHVATT – Value text attributes. CHVATT specifies the attributes for value text.| Value text is used to show individual values for data points on a surface chart.| Attributes that can be set are color, and character font, size, and rotation.
| If CHVATT is not specified, each data value is shown in standard-size device| default characters, in the default color, in the default 0 rotation.
| Setting the Shading Attributes CHPAT – Set component shading pattern. CHPAT sets the type of pattern usedby shaded components, by defining a table that holds the number of patterns andthe order of their selection.
If CHPAT is not specified, the sequence of patterns in the default pattern table isused. The default pattern table shown for the discussion of the GSPAT routine inChapter 3, “Using GDDM” shows the order of selection.
CHSET – Specify chart options. CHSET (INFILL) suppresses the shading of thefirst component, which results in a floating surface chart. Floating surface chartsare described on page 4-60.
Chapter 4. Using Presentation Graphics 4-55
Drawing the Chart
CHSET (NOFILL) suppresses the shading of all the components, which results in aline chart.
| Setting the Type of Shading to be Performed| | CHSET – Specify chart options. CHSET(NOMOUNTAIN|MOUNTAIN) specifies| whether mountain range shading or normal shading is to be performed.
| Normal shading (CHSET(NOMOUNTAIN)) is performed in the following manner:
| � The first component is shaded from the x-axis (or state 1 y datum line, if any).| This line is called the reference line or the shading reference line.
| � Every other component is shaded from the previous component's data line.
| In cases in which the components overlap one another, a mixing mode of 'OR' is| used.
| Mountain range shading (CHSET(MOUNTAIN)) is performed in the following| manner:
| � The last component is shaded from the x-axis (or state 1 y datum line, if any).
| � Every other component is shaded, in reverse order, also from the x-axis (or y| datum line, if any), and NOT from the previous component's data line, as in the| case of normal shading.
| Mountain range shading always uses the default mix mode of overpaint, except for| hardcopy devices, which use a modified mix mode (color is the result of etching| one color over the top of another).
| If relative data is used (CHSET(RELATIVE)), there will be no difference between| mountain range shading and normal shading.
| Setting the Type of Data to be Shown CHSET – Specify chart options. CHSET (ABSOLUTE) shows the data asabsolute data.
CHSET (RELATIVE) shows the data as relative data.
Data for surface charts can be shown as either absolute data or as relative data.
Absolute data (the default) is shown where the upper boundary of the shadedregion shows the true values of the y-data for that component.
Relative data is shown where the upper boundary of a component shows the sumof its own y-values added to those of the components shown below it. The truey-value of the component can be seen be comparing the thickness of its shadedregion with the y-axis scale.
4-56 AS/400 GDDM Programming Guide
Drawing the Chart
| Absolute| versus relative| data. The| picture shows| two surface| charts whose| data groups are| identical, but the| method of| showing the data| differs. Note the| difference in the| scale range| used for the two| charts.
| �|
| 35MM�536J7
| �| �
Chapter 4. Using Presentation Graphics 4-57
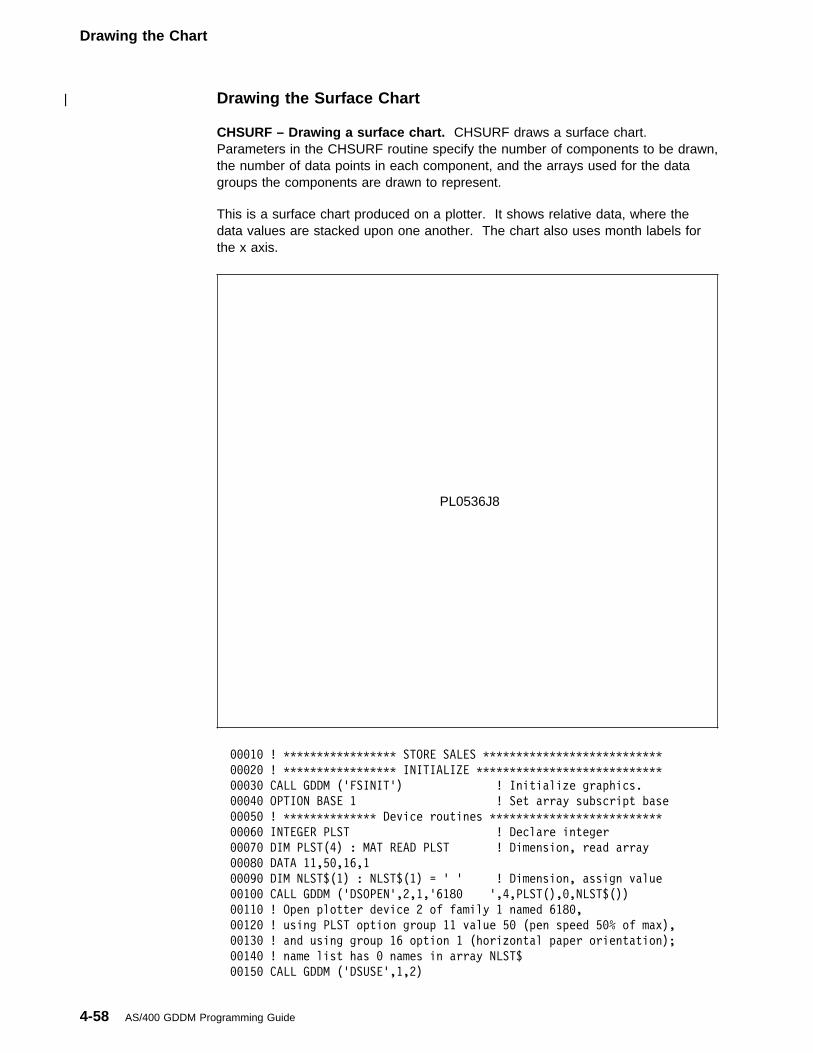
Drawing the Chart
| Drawing the Surface Chart CHSURF – Drawing a surface chart. CHSURF draws a surface chart.Parameters in the CHSURF routine specify the number of components to be drawn,the number of data points in each component, and the arrays used for the datagroups the components are drawn to represent.
This is a surface chart produced on a plotter. It shows relative data, where thedata values are stacked upon one another. The chart also uses month labels forthe x axis.
PL0536J8
���1� ! ����������������� STORE SALES ���������������������������
���2� ! ����������������� INITIALIZE ����������������������������
���3� CALL GDDM ('FSINIT') ! Initialize graphics.
���4� OPTION BASE 1 ! Set array subscript base
���5� ! �������������� Device routines ��������������������������
���6� INTEGER PLST ! Declare integer
���7� DIM PLST(4) : MAT READ PLST ! Dimension, read array
���8� DATA 11,5�,16,1
���9� DIM NLST$(1) : NLST$(1) = ' ' ! Dimension, assign value
��1�� CALL GDDM ('DSOPEN',2,1,'618� ',4,PLST(),�,NLST$())
��11� ! Open plotter device 2 of family 1 named 618�,
��12� ! using PLST option group 11 value 5� (pen speed 5�% of max),
��13� ! and using group 16 option 1 (horizontal paper orientation);
��14� ! name list has � names in array NLST$
��15� CALL GDDM ('DSUSE',1,2)
4-58 AS/400 GDDM Programming Guide
Drawing the Chart
��16� ! Use device 2 as active device (option 1)
��17� ! ����������������� Symbol set ����������������������������
��18� CALL GDDM ('GSLSS',2,'ADMUWTIP',66)
��19� ! Load vector symbol set ADMUWTIP as symbol set #66
��2�� CALL GDDM ('GSLSS',2,'ADMUVCRP',67)
��21� ! Load vector symbol set ADMUVCRP as symbol set #67
��22� ! ���������� DEFINE THE CHART LAYOUT ���������������������
��23� ! ����������������� Heading �������������������������������
��24� INTEGER HATT ! Declare heading attribute
��25� DIM HATT(4) : MAT READ HATT ! Dimension, read array
��26� DATA 5,3,66,225
��27� ! 5 = pen 5, 3 = char mode, 66 = symbol set number, 225 = size
��28� CALL GDDM ('CHHATT',4,HATT()) ! Set heading attributes
��29� CALL GDDM ('CHHEAD',2�,'GROSS SALES FOR 1983')
��3�� ! Write 2�-character heading with 'character string'
��31� ! �������������������� Axes �������������������������������
��32� INTEGER TATT ! Declare axis title attribute
��33� DIM TATT(4) : MAT READ TATT ! Dimension, read array
��34� DATA 2,3,67,1��
��35� ! 2 = pen 2, 3 = char mode, 67 = symbol set number, 1�� = size
��36� CALL GDDM ('CHTATT',4,TATT()) ! Set title attributes
��37� CALL GDDM ('CHXTTL',5,'MONTH') ! Write 5-character x-title
��38� CALL GDDM ('CHYTTL',25,'SALES VOLUME IN THOUSANDS') ! y-title
��39� CALL GDDM ('CHXMTH',1) ! Month labels begin with JAN
��4�� CALL GDDM ('CHXSET','NOFORCEZERO') ! Label JAN starts at y axis
��41� ! �������������������� Legend �����������������������������
��42� CALL GDDM ('CHSET','KBOX') ! Enclose legend in box
��43� CALL GDDM ('CHKEYP','H','B','C')
��44� ! Position legend H = horizontal, B = bottom, C = centered
��45� CALL GDDM ('CHKEY',3,6,'ValleyUptownSuburb')
��46� ! Write three 6-character legend key labels using 'string'
��47� ! ��������� Set attributes for Surface Chart ���������������
| ��48� INTEGER VATT ! Declare value attributes
| ��49� DIM VATT(6) : MAT READ VATT ! Dimension, read array
| ��5�� DATA 1,3,�,1��,1��,�
| ��51� ! 1 = pen 1, 3 = char mode, � = default symbol set
| ��52� ! 1�� = default char size, 1�� = default height/width multiplier
| ��53� ! � = default rotation (� degrees)
| ��54� CALL GDDM('CHSET','VALUES') ! Draw value labels
| ��55� CALL GDDM('CHVATT',6,VATT()) ! Set value label attributes
| ��56� CALL GDDM ('CHSET','CURVE') ! Smooth the plotted lines
| ��57� ! ��������� Specify data for Surface Chart �����������������
| ��58� DIM MONTHS(12) : MAT READ MONTHS
| ��59� DATA 1,2,3,4,5,6,7,8,9,1�,11,12
| ��6�� DIM SALES(36) : MAT READ SALES
| ��61� DATA 1�,12,16,16,15,17,18,23,2�,19,24,3�
| ��62� DATA 15,16,18,19,2�,2�,19,25,26,32,38,42
| ��63� DATA 17,18,2�,2�,23,24,32,3�,32,34,4�,43
| ��64� CALL GDDM ('CHSET','RELATIVE') ! Show relative data
| ��65� ! ��������������� DRAW SURFACE CHART �����������������������
| ��66� CALL GDDM ('CHSURF',3,12,MONTHS(),SALES())
| ��67� ! Draw chart with 3 components (areas), 12 data points per line
| ��68� ! ��������������� Send to display ��������������������������
| ��69� CALL GDDM ('FSFRCE') ! Send to display
| ��7�� ! ����������������� TERMINATE �����������������������������
| ��71� CALL GDDM ('FSTERM') ! Terminate graphics
| ��72� END ! End BASIC program
Chapter 4. Using Presentation Graphics 4-59
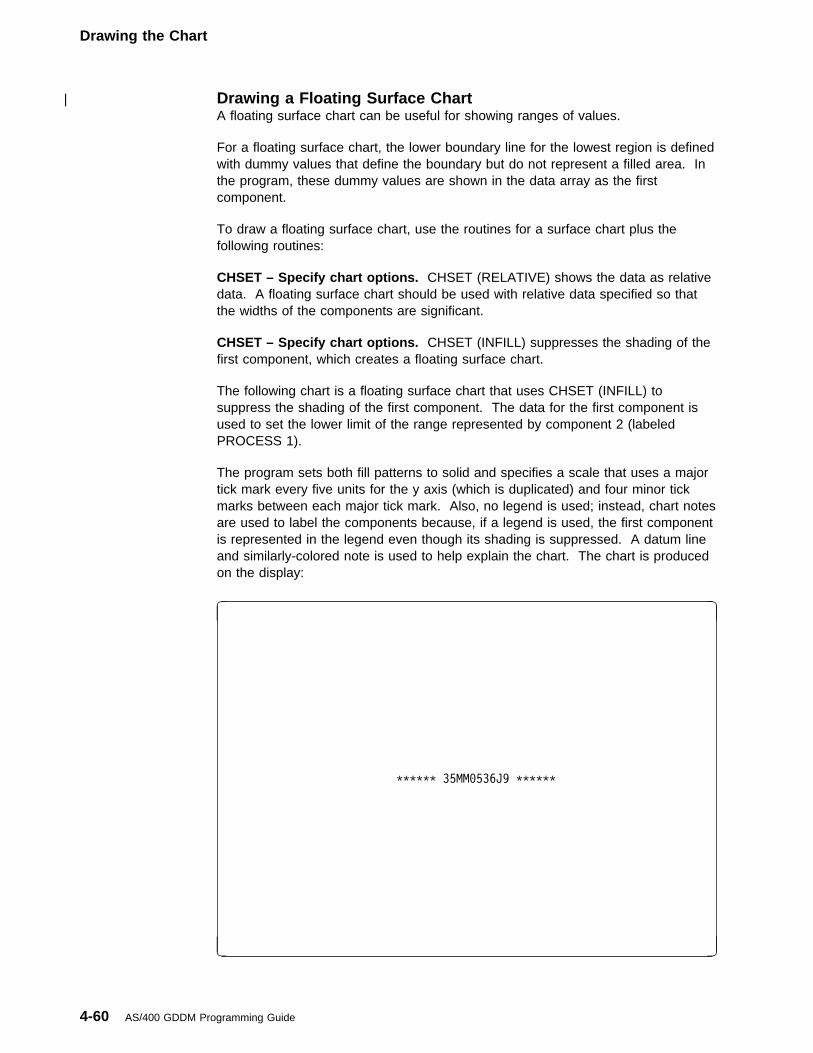
Drawing the Chart
| Drawing a Floating Surface ChartA floating surface chart can be useful for showing ranges of values.
For a floating surface chart, the lower boundary line for the lowest region is definedwith dummy values that define the boundary but do not represent a filled area. Inthe program, these dummy values are shown in the data array as the firstcomponent.
To draw a floating surface chart, use the routines for a surface chart plus thefollowing routines:
CHSET – Specify chart options. CHSET (RELATIVE) shows the data as relativedata. A floating surface chart should be used with relative data specified so thatthe widths of the components are significant.
CHSET – Specify chart options. CHSET (INFILL) suppresses the shading of thefirst component, which creates a floating surface chart.
The following chart is a floating surface chart that uses CHSET (INFILL) tosuppress the shading of the first component. The data for the first component isused to set the lower limit of the range represented by component 2 (labeledPROCESS 1).
The program sets both fill patterns to solid and specifies a scale that uses a majortick mark every five units for the y axis (which is duplicated) and four minor tickmarks between each major tick mark. Also, no legend is used; instead, chart notesare used to label the components because, if a legend is used, the first componentis represented in the legend even though its shading is suppressed. A datum lineand similarly-colored note is used to help explain the chart. The chart is producedon the display:
�
������ 35MM�536J9 ������
� �
4-60 AS/400 GDDM Programming Guide
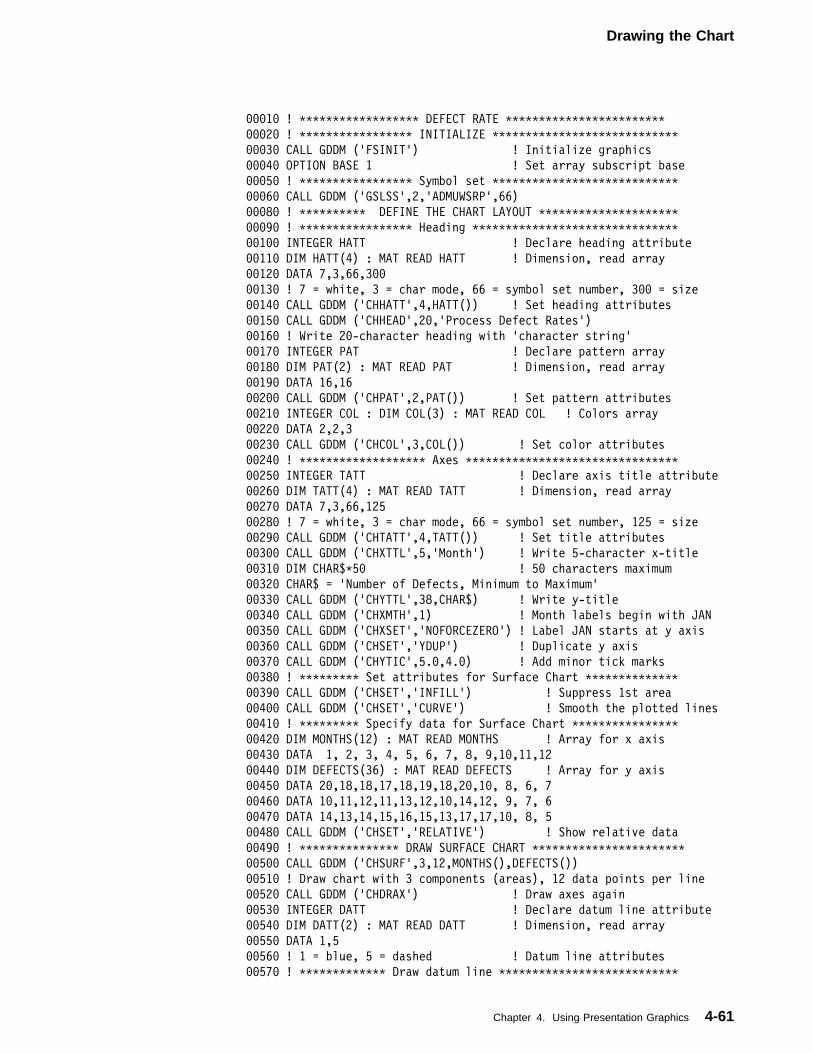
Drawing the Chart
���1� ! ������������������ DEFECT RATE ������������������������
���2� ! ����������������� INITIALIZE ����������������������������
���3� CALL GDDM ('FSINIT') ! Initialize graphics
���4� OPTION BASE 1 ! Set array subscript base
���5� ! ����������������� Symbol set ����������������������������
���6� CALL GDDM ('GSLSS',2,'ADMUWSRP',66)
���8� ! ���������� DEFINE THE CHART LAYOUT ���������������������
���9� ! ����������������� Heading �������������������������������
��1�� INTEGER HATT ! Declare heading attribute
��11� DIM HATT(4) : MAT READ HATT ! Dimension, read array
��12� DATA 7,3,66,3��
��13� ! 7 = white, 3 = char mode, 66 = symbol set number, 3�� = size
��14� CALL GDDM ('CHHATT',4,HATT()) ! Set heading attributes
��15� CALL GDDM ('CHHEAD',2�,'Process Defect Rates')
��16� ! Write 2�-character heading with 'character string'
��17� INTEGER PAT ! Declare pattern array
��18� DIM PAT(2) : MAT READ PAT ! Dimension, read array
��19� DATA 16,16
��2�� CALL GDDM ('CHPAT',2,PAT()) ! Set pattern attributes
��21� INTEGER COL : DIM COL(3) : MAT READ COL ! Colors array
��22� DATA 2,2,3
��23� CALL GDDM ('CHCOL',3,COL()) ! Set color attributes
��24� ! ������������������� Axes ��������������������������������
��25� INTEGER TATT ! Declare axis title attribute
��26� DIM TATT(4) : MAT READ TATT ! Dimension, read array
��27� DATA 7,3,66,125
��28� ! 7 = white, 3 = char mode, 66 = symbol set number, 125 = size
��29� CALL GDDM ('CHTATT',4,TATT()) ! Set title attributes
��3�� CALL GDDM ('CHXTTL',5,'Month') ! Write 5-character x-title
��31� DIM CHAR$�5� ! 5� characters maximum
��32� CHAR$ = 'Number of Defects, Minimum to Maximum'
��33� CALL GDDM ('CHYTTL',38,CHAR$) ! Write y-title
��34� CALL GDDM ('CHXMTH',1) ! Month labels begin with JAN
��35� CALL GDDM ('CHXSET','NOFORCEZERO') ! Label JAN starts at y axis
��36� CALL GDDM ('CHSET','YDUP') ! Duplicate y axis
��37� CALL GDDM ('CHYTIC',5.�,4.�) ! Add minor tick marks
��38� ! ��������� Set attributes for Surface Chart ��������������
��39� CALL GDDM ('CHSET','INFILL') ! Suppress 1st area
��4�� CALL GDDM ('CHSET','CURVE') ! Smooth the plotted lines
��41� ! ��������� Specify data for Surface Chart ����������������
��42� DIM MONTHS(12) : MAT READ MONTHS ! Array for x axis
��43� DATA 1, 2, 3, 4, 5, 6, 7, 8, 9,1�,11,12
��44� DIM DEFECTS(36) : MAT READ DEFECTS ! Array for y axis
��45� DATA 2�,18,18,17,18,19,18,2�,1�, 8, 6, 7
��46� DATA 1�,11,12,11,13,12,1�,14,12, 9, 7, 6
��47� DATA 14,13,14,15,16,15,13,17,17,1�, 8, 5
��48� CALL GDDM ('CHSET','RELATIVE') ! Show relative data
��49� ! ��������������� DRAW SURFACE CHART �����������������������
��5�� CALL GDDM ('CHSURF',3,12,MONTHS(),DEFECTS())
��51� ! Draw chart with 3 components (areas), 12 data points per line
��52� CALL GDDM ('CHDRAX') ! Draw axes again
��53� INTEGER DATT ! Declare datum line attribute
��54� DIM DATT(2) : MAT READ DATT ! Dimension, read array
��55� DATA 1,5
��56� ! 1 = blue, 5 = dashed ! Datum line attributes
��57� ! ������������� Draw datum line ���������������������������
Chapter 4. Using Presentation Graphics 4-61
Drawing the Chart
��58� CALL GDDM ('CHDATT',2,DATT()) ! Set datum attributes
��59� CALL GDDM ('CHXDTM',8.�) ! Draw datum line from X
��6�� ! ������������� Write chart notes �������������������������
��61� INTEGER NATT ! Declare integer variable
��62� DIM NATT(2) : MAT READ NATT ! Dimension, read array
��63� DATA 1,2
��64� ! 1 = blue, 2 = char mode ! Note attributes
��65� CALL GDDM ('CHNATT',2,NATT()) ! Set note attributes
��66� CALL GDDM ('CHSET','NBOX') ! Enclose note in box
��67� CALL GDDM ('CHSET','BNOTE') ! Blank note area
��68� CALL GDDM ('CHNOFF',4.5,3.5) ! Position note
��69� CHAR$ = 'IMPLEMENTED QUALITY;AWARENESS PROGRAM 8/1'
��7�� CALL GDDM ('CHNOTE','Z7',41,CHAR$)! Write note
��71� NATT(1) = 2 ! Note color red
��72� CALL GDDM ('CHNATT',2,NATT()) ! Set note attributes
��73� CALL GDDM ('CHNOFF',2.�,2�.�) ! Position note
��74� CALL GDDM ('CHNOTE','Z7',9,'PROCESS 1')
��75� NATT(1) = 3 ! Note color pink
��76� CALL GDDM ('CHNATT',2,NATT()) ! Set note attributes
��77� CALL GDDM ('CHNOFF',2.�,31.�) ! Position note
��78� CALL GDDM ('CHNOTE','Z7',9,'PROCESS 2') ! Write note
��79� ! ��������������� Send to display ��������������������������
��8�� INTEGER ATTYPE,ATMOD,COUNT ! Declare integers
��81� CALL GDDM ('ASREAD',ATTYPE,ATMOD,COUNT) ! Send to display
��83� CALL GDDM ('FSTERM') ! Terminate graphics
��84� END ! End BASIC program
Drawing Bar Charts
| Setting the Component Color Selection Order CHCOL – Set component color. CHCOL sets the color of the components, bydefining a table that holds the number of colors and the order of their selection.
If CHCOL is not specified, the sequence of colors in the default color table is used.The default color table is, in this case, the GDDM color table which is either thedefault color table for the current page or a color table modified for use in thecurrent page.
| Setting the Bar Attributes CHPAT – Set component shading pattern. CHPAT sets the type of pattern usedby shaded components, by defining a table that holds the number of patterns andthe order of their selection.
If CHPAT is not specified, the sequence of patterns in the default pattern table isused. The default pattern table shown for the discussion of the GSPAT routine inChapter 3, “Using GDDM” shows the order of selection.
CHSET – Specify chart options. CHSET (NOFILL) suppresses the shading ofbars.
4-62 AS/400 GDDM Programming Guide
Drawing the Chart
| Writing Bar Values CHSET – Specify chart options. CHSET (NOVALUES|VALUES|CVALUES)controls how values are displayed. CHSET(VALUES) writes the data valuerepresented by each bar adjacent to the bar. CHSET(NOVALUES) indicates thatno data values are displayed on the bars.
CHSET(CVALUES) controls how values are displayed on the bars. Use it followedby CHSET(VINSIDE|VONTOP) to display the values inside (VINSIDE) or above(VONTOP) the bars.
CHSET (BVALUES) blanks the areas where bar values are written. When the areais blanked, no other display feature can occupy the bar value text box. When thearea is not blanked (NBVALUES), the values can overpaint the component.
CHVCHR – Number of data value characters. CHVCHR sets the number ofcharacters to be used for showing bar values on a bar chart. The value textattributes are controlled by CHVATT.
Up to 15 characters can be used, but some of the 15 characters from one barvalue would probably overwrite those for the next bar (for character-mode 2), orwould be too small to read (for character-mode 3).
By default, the true value represented by the bar is used, up to 9 characterpositions. The picture of the single-bar chart shown later has bar values 2characters long.
CHSET – Specify chart options. CHSET (NPGFS|PGFS) specifies the method ofpunctuating numbers greater than 1000 displayed on the chart. PGFS suppressesthe punctuation except for the decimal point. NPGFS uses OS/400 system valueQDECFMT to specify the type of punctuation used for numbers greater than 1000by your system.
CHVATT – Value text attributes. CHVATT specifies the attributes for value text.| Value text is used to show individual values for bars on a bar chart. Attributes that| can be set are color, and character font, size, and rotation.
| If CHVATT is not specified, each bar value is shown in standard-size device default| characters, in the default color, with the default rotation.
| Setting the Bar Spacing CHGAP – Spacing between bars. CHGAP sets the distance between the bars ina bar chart. By default, the distance is one-half the width of each individual bar. Anegative value gives overlapping bars.
| Drawing the Bar Chart CHBAR – Draw a bar chart. CHBAR draws a bar chart. Parameters in theCHBAR routine specify the number of components to be drawn, the number of barsin each component, and the array used for the dependent variables (the heights ofthe bars).
Chapter 4. Using Presentation Graphics 4-63
Drawing the Chart
The following chart is an example of a single-bar chart produced on the display.The chart is oriented horizontally, and it uses an invisible grid to suppress the xaxis (which is vertical) and to overpaint the chart components to increase theusability of the chart. The tick marks for the axes are suppressed to enhance thesimple appearance of the chart.
�
������ 35MM�536K1 ������
� �
���1� ! ������������������ MILEAGE ������������������������������
���2� ! ����������������� INITIALIZE ����������������������������
���3� CALL GDDM ('FSINIT') ! Initialize graphics
���4� OPTION BASE 1 ! Set array subscript base
���5� ! ����������������� Symbol set ����������������������������
���6� CALL GDDM ('GSLSS',2,'ADMUWCRP',66)
���7� ! Load vector symbol set ADMUWCRP as symbol set #66
���8� CALL GDDM ('GSLSS',2,'ADMUVTIP',67)
���9� ! Load vector symbol set ADMUVTIP as symbol set #67
��1�� ! ���������� DEFINE THE CHART LAYOUT ���������������������
��11� CALL GDDM ('CHSET','XVERTICAL') ! Horizontal format
��12� INTEGER HATT ! Declare heading attribute
��13� DIM HATT(4) : MAT READ HATT ! Dimension, read array
��14� DATA 6,3,66,275
��15� ! 6 = yellow, 3 = char mode, 66 = symbol set number, 275 = size
��16� CALL GDDM ('CHHATT',4,HATT()) ! Set heading attributes
��17� CALL GDDM ('CHHEAD',16,'MILEAGE PER YEAR')
��18� ! Write 16-character heading with 'character string'
��19� ! ������������������� Axes ��������������������������������
��2�� CALL GDDM ('CHSET','NDRAW') ! Suppress axes/grid until CHDRAX
��21� CALL GDDM ('CHXSET','PLAIN') ! Suppress x-axis tick marks
��22� CALL GDDM ('CHYSET','PLAIN') ! Suppress y-axis tick marks
��23� CALL GDDM ('CHYRNG',�.�,22.�) ! Set specific range for y axis
��24� INTEGER TATT ! Declare axis title attribute
��25� DIM TATT(4) : MAT READ TATT ! Dimension, read array
4-64 AS/400 GDDM Programming Guide
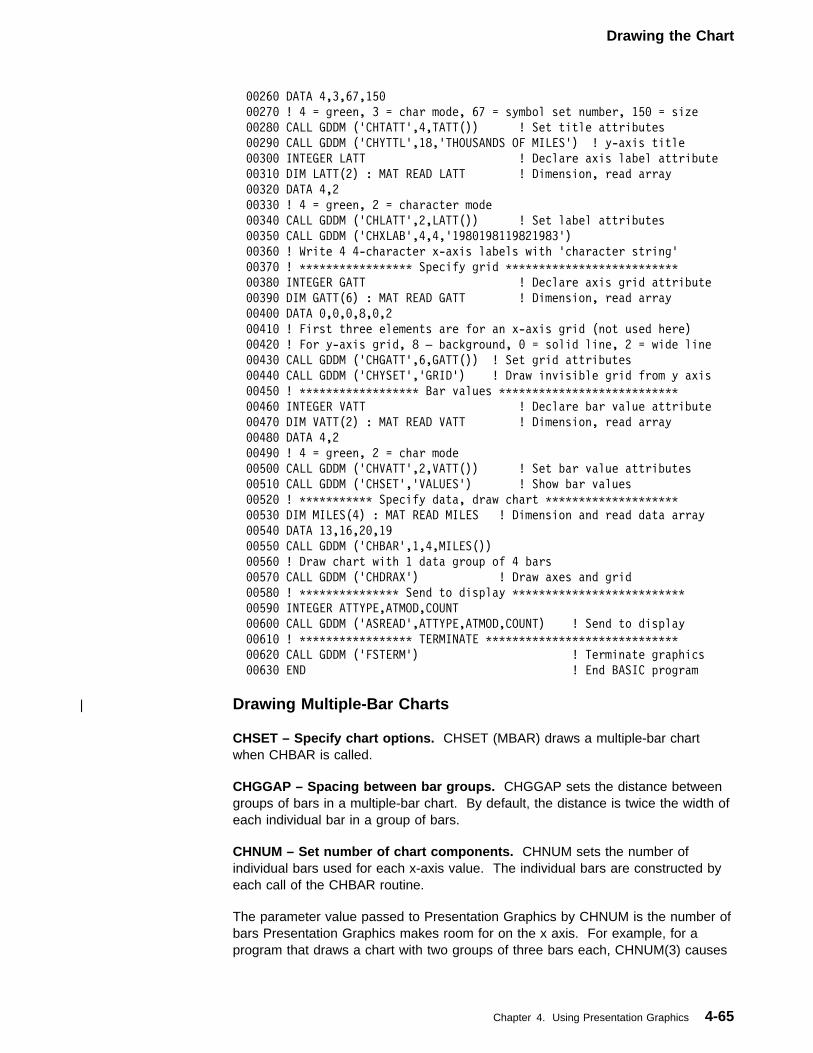
Drawing the Chart
��26� DATA 4,3,67,15�
��27� ! 4 = green, 3 = char mode, 67 = symbol set number, 15� = size
��28� CALL GDDM ('CHTATT',4,TATT()) ! Set title attributes
��29� CALL GDDM ('CHYTTL',18,'THOUSANDS OF MILES') ! y-axis title
��3�� INTEGER LATT ! Declare axis label attribute
��31� DIM LATT(2) : MAT READ LATT ! Dimension, read array
��32� DATA 4,2
��33� ! 4 = green, 2 = character mode
��34� CALL GDDM ('CHLATT',2,LATT()) ! Set label attributes
��35� CALL GDDM ('CHXLAB',4,4,'198�198119821983')
��36� ! Write 4 4-character x-axis labels with 'character string'
��37� ! ����������������� Specify grid ��������������������������
��38� INTEGER GATT ! Declare axis grid attribute
��39� DIM GATT(6) : MAT READ GATT ! Dimension, read array
��4�� DATA �,�,�,8,�,2
��41� ! First three elements are for an x-axis grid (not used here)
��42� ! For y-axis grid, 8 – background, � = solid line, 2 = wide line
��43� CALL GDDM ('CHGATT',6,GATT()) ! Set grid attributes
��44� CALL GDDM ('CHYSET','GRID') ! Draw invisible grid from y axis
��45� ! ������������������ Bar values ���������������������������
��46� INTEGER VATT ! Declare bar value attribute
��47� DIM VATT(2) : MAT READ VATT ! Dimension, read array
��48� DATA 4,2
��49� ! 4 = green, 2 = char mode
��5�� CALL GDDM ('CHVATT',2,VATT()) ! Set bar value attributes
��51� CALL GDDM ('CHSET','VALUES') ! Show bar values
��52� ! ����������� Specify data, draw chart ��������������������
��53� DIM MILES(4) : MAT READ MILES ! Dimension and read data array
��54� DATA 13,16,2�,19
��55� CALL GDDM ('CHBAR',1,4,MILES())
��56� ! Draw chart with 1 data group of 4 bars
��57� CALL GDDM ('CHDRAX') ! Draw axes and grid
��58� ! ��������������� Send to display ��������������������������
��59� INTEGER ATTYPE,ATMOD,COUNT
��6�� CALL GDDM ('ASREAD',ATTYPE,ATMOD,COUNT) ! Send to display
��61� ! ����������������� TERMINATE �����������������������������
��62� CALL GDDM ('FSTERM') ! Terminate graphics
��63� END ! End BASIC program
| Drawing Multiple-Bar Charts CHSET – Specify chart options. CHSET (MBAR) draws a multiple-bar chartwhen CHBAR is called.
CHGGAP – Spacing between bar groups. CHGGAP sets the distance betweengroups of bars in a multiple-bar chart. By default, the distance is twice the width ofeach individual bar in a group of bars.
CHNUM – Set number of chart components. CHNUM sets the number ofindividual bars used for each x-axis value. The individual bars are constructed byeach call of the CHBAR routine.
The parameter value passed to Presentation Graphics by CHNUM is the number ofbars Presentation Graphics makes room for on the x axis. For example, for aprogram that draws a chart with two groups of three bars each, CHNUM(3) causes
Chapter 4. Using Presentation Graphics 4-65
Drawing the Chart
the bars drawn by the first CHBAR routine to be narrower and placed on the x axisso that two other bars can also be drawn by other CHBAR routines.
4-66 AS/400 GDDM Programming Guide
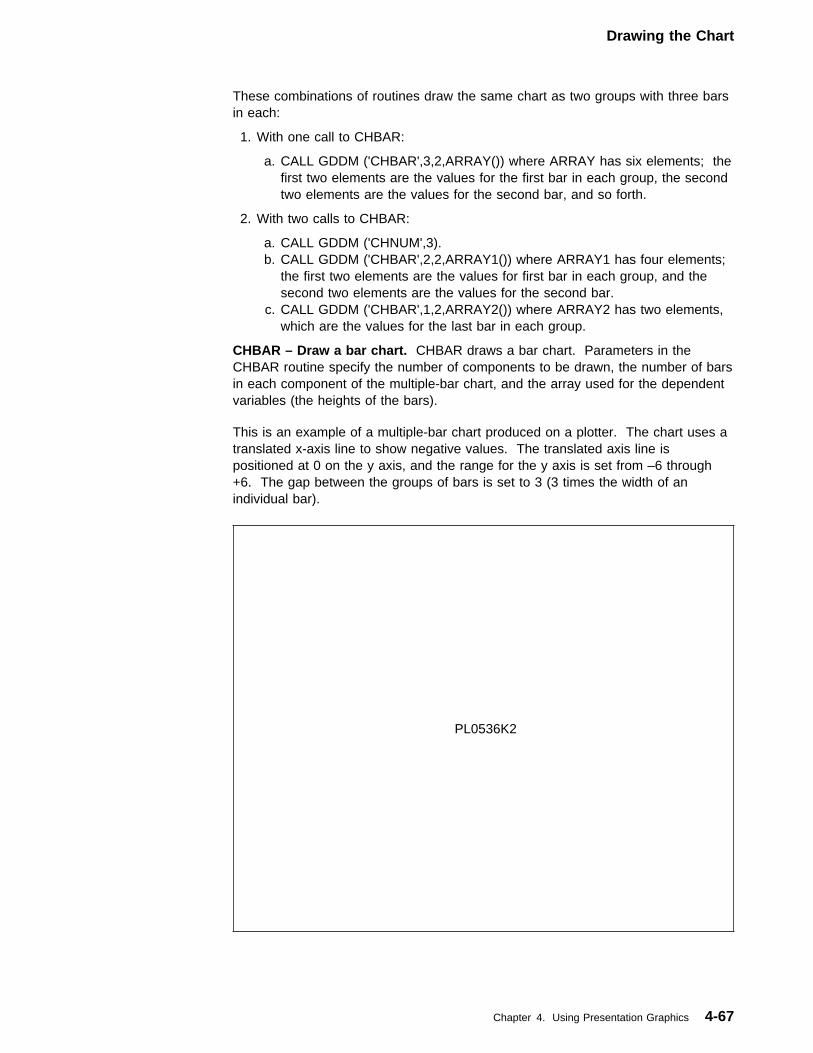
Drawing the Chart
These combinations of routines draw the same chart as two groups with three barsin each:
1. With one call to CHBAR:
a. CALL GDDM ('CHBAR',3,2,ARRAY()) where ARRAY has six elements; thefirst two elements are the values for the first bar in each group, the secondtwo elements are the values for the second bar, and so forth.
2. With two calls to CHBAR:
a. CALL GDDM ('CHNUM',3).b. CALL GDDM ('CHBAR',2,2,ARRAY1()) where ARRAY1 has four elements;
the first two elements are the values for first bar in each group, and thesecond two elements are the values for the second bar.
c. CALL GDDM ('CHBAR',1,2,ARRAY2()) where ARRAY2 has two elements,which are the values for the last bar in each group.
CHBAR – Draw a bar chart. CHBAR draws a bar chart. Parameters in theCHBAR routine specify the number of components to be drawn, the number of barsin each component of the multiple-bar chart, and the array used for the dependentvariables (the heights of the bars).
This is an example of a multiple-bar chart produced on a plotter. The chart uses atranslated x-axis line to show negative values. The translated axis line ispositioned at 0 on the y axis, and the range for the y axis is set from –6 through+6. The gap between the groups of bars is set to 3 (3 times the width of anindividual bar).
PL0536K2
Chapter 4. Using Presentation Graphics 4-67
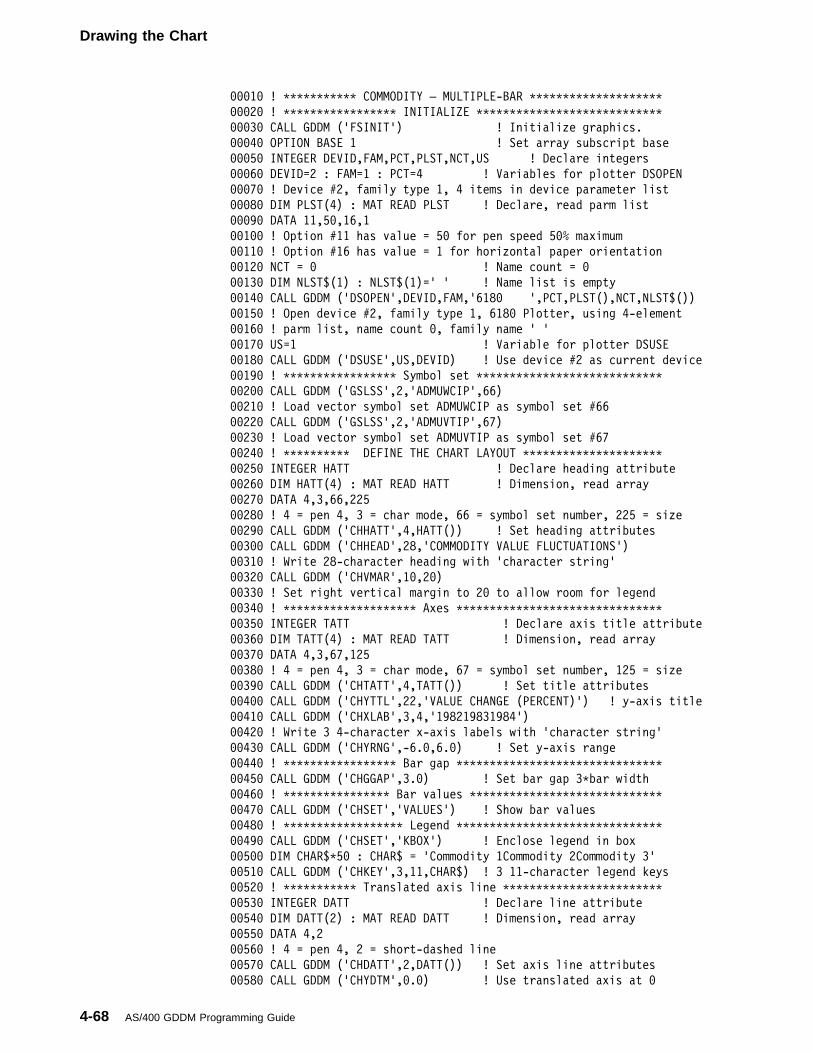
Drawing the Chart
���1� ! ����������� COMMODITY – MULTIPLE-BAR ��������������������
���2� ! ����������������� INITIALIZE ����������������������������
���3� CALL GDDM ('FSINIT') ! Initialize graphics.
���4� OPTION BASE 1 ! Set array subscript base
���5� INTEGER DEVID,FAM,PCT,PLST,NCT,US ! Declare integers
���6� DEVID=2 : FAM=1 : PCT=4 ! Variables for plotter DSOPEN
���7� ! Device #2, family type 1, 4 items in device parameter list
���8� DIM PLST(4) : MAT READ PLST ! Declare, read parm list
���9� DATA 11,5�,16,1
��1�� ! Option #11 has value = 5� for pen speed 5�% maximum
��11� ! Option #16 has value = 1 for horizontal paper orientation
��12� NCT = � ! Name count = �
��13� DIM NLST$(1) : NLST$(1)=' ' ! Name list is empty
��14� CALL GDDM ('DSOPEN',DEVID,FAM,'618� ',PCT,PLST(),NCT,NLST$())
��15� ! Open device #2, family type 1, 618� Plotter, using 4-element
��16� ! parm list, name count �, family name ' '
��17� US=1 ! Variable for plotter DSUSE
��18� CALL GDDM ('DSUSE',US,DEVID) ! Use device #2 as current device
��19� ! ����������������� Symbol set ����������������������������
��2�� CALL GDDM ('GSLSS',2,'ADMUWCIP',66)
��21� ! Load vector symbol set ADMUWCIP as symbol set #66
��22� CALL GDDM ('GSLSS',2,'ADMUVTIP',67)
��23� ! Load vector symbol set ADMUVTIP as symbol set #67
��24� ! ���������� DEFINE THE CHART LAYOUT ���������������������
��25� INTEGER HATT ! Declare heading attribute
��26� DIM HATT(4) : MAT READ HATT ! Dimension, read array
��27� DATA 4,3,66,225
��28� ! 4 = pen 4, 3 = char mode, 66 = symbol set number, 225 = size
��29� CALL GDDM ('CHHATT',4,HATT()) ! Set heading attributes
��3�� CALL GDDM ('CHHEAD',28,'COMMODITY VALUE FLUCTUATIONS')
��31� ! Write 28-character heading with 'character string'
��32� CALL GDDM ('CHVMAR',1�,2�)
��33� ! Set right vertical margin to 2� to allow room for legend
��34� ! �������������������� Axes �������������������������������
��35� INTEGER TATT ! Declare axis title attribute
��36� DIM TATT(4) : MAT READ TATT ! Dimension, read array
��37� DATA 4,3,67,125
��38� ! 4 = pen 4, 3 = char mode, 67 = symbol set number, 125 = size
��39� CALL GDDM ('CHTATT',4,TATT()) ! Set title attributes
��4�� CALL GDDM ('CHYTTL',22,'VALUE CHANGE (PERCENT)') ! y-axis title
��41� CALL GDDM ('CHXLAB',3,4,'198219831984')
��42� ! Write 3 4-character x-axis labels with 'character string'
��43� CALL GDDM ('CHYRNG',-6.�,6.�) ! Set y-axis range
��44� ! ����������������� Bar gap �������������������������������
��45� CALL GDDM ('CHGGAP',3.�) ! Set bar gap 3�bar width
��46� ! ���������������� Bar values �����������������������������
��47� CALL GDDM ('CHSET','VALUES') ! Show bar values
��48� ! ������������������ Legend �������������������������������
��49� CALL GDDM ('CHSET','KBOX') ! Enclose legend in box
��5�� DIM CHAR$�5� : CHAR$ = 'Commodity 1Commodity 2Commodity 3'
��51� CALL GDDM ('CHKEY',3,11,CHAR$) ! 3 11-character legend keys
��52� ! ����������� Translated axis line ������������������������
��53� INTEGER DATT ! Declare line attribute
��54� DIM DATT(2) : MAT READ DATT ! Dimension, read array
��55� DATA 4,2
��56� ! 4 = pen 4, 2 = short-dashed line
��57� CALL GDDM ('CHDATT',2,DATT()) ! Set axis line attributes
��58� CALL GDDM ('CHYDTM',�.�) ! Use translated axis at �
4-68 AS/400 GDDM Programming Guide
Drawing the Chart
��59� ! ������������ Specify data �������������������������������
��6�� DIM DELTA(12) : MAT READ DELTA ! Dimension and read data array
��61� DATA -1,-3, 4, 2, 3, 5,-3, 5,-4, 2,-4,-4
��62� ! ������������� Draw chart ��������������������������������
��63� CALL GDDM ('CHBAR',3,4,DELTA())
��64� ! Draw chart with 4 data groups of 3 bars each
��65� ! ������������� Write notes �������������������������������
��66� INTEGER NATT ! Declare note attribute
��67� DIM NATT(4) : MAT READ NATT ! Dimension, read array
��68� DATA 4,3,66,15�
��69� ! 4 = pen 4, 3 = mode 3, 66 = symbol set, 15� = size multiplier
��7�� CALL GDDM ('CHNATT',4,NATT()) ! Set note attributes
��71� CALL GDDM ('CHSET','NBOX') ! Enclose note in box
��72� CALL GDDM ('CHNOFF',1.�,1.�) ! Note position
��73� CHAR$ = 'Change based on previous year average value'
��74� CALL GDDM ('CHNOTE','H1',43,CHAR$) ! Write note
��75� ! ��������������� Send to display �������������������������
��76� CALL GDDM ('FSFRCE') ! Send to plotter
��77� ! ����������������� TERMINATE �����������������������������
��78� CALL GDDM ('FSTERM') ! Terminate graphics
��79� END ! End BASIC program
This multiple-bar chart uses CHNUM to specify that the chart uses three groups ofbars:
�
������ 35MM�536K3 ������
� �
Chapter 4. Using Presentation Graphics 4-69
Drawing the Chart
���1� ! ����������� CPU LOADS – MULTIPLE-BAR ��������������������
���2� ! ����������������� INITIALIZE ����������������������������
���3� CALL GDDM ('FSINIT') ! Initialize graphics.
���4� OPTION BASE 1 ! Set array subscript base
���5� ! ����������������� Symbol set ����������������������������
���6� CALL GDDM ('GSLSS',2,'ADMUWTRP',66)
���7� ! Load vector symbol set ADMUWTRP as symbol set #66
���8� ! ���������� DEFINE THE CHART LAYOUT ���������������������
���9� INTEGER HATT ! Declare heading attribute
��1�� DIM HATT(4) : MAT READ HATT ! Dimension, read array
��11� DATA 5,3,66,225
��12� ! 5 = turq, 3 = char mode, 66 = symbol set number, 225 = size
��13� CALL GDDM ('CHHATT',4,HATT()) ! Set heading attributes
��14� CALL GDDM ('CHHEAD',23,'FIRST-SHIFT CPU LOADING')
��15� ! Write 23-character heading with 'character string'
��16� ! ������������������ Axes ���������������������������������
��17� INTEGER TATT ! Declare axis title attribute
��18� DIM TATT(2) : MAT READ TATT ! Dimension, read array
��19� DATA 2,2
��2�� ! 2 = red, 2 = character mode
��21� CALL GDDM ('CHTATT',2,TATT()) ! Set title attributes
��22� CALL GDDM ('CHXTTL',4,'TIME') ! x-axis title
��23� CALL GDDM ('CHYTTL',7,'PERCENT') ! y-axis title
��24� INTEGER LATT ! Declare label attribute
��25� DIM LATT(2) : MAT READ LATT ! Dimension, read array
��26� DATA 4,2
��27� ! 4 = green, 2 = character mode
��28� CALL GDDM ('CHLATT',2,LATT()) ! Set label attributes
��29� CALL GDDM ('CHXLAB',1�,2,' 8 91�1112 1 2 3 4 5')
��3�� ! Write 1� 2-character x-axis labels with 'character string'
��31� ! ����������������� Grid ����������������������������������
��32� INTEGER GATT ! Declare axis grid attribute
��33� DIM GATT(6) : MAT READ GATT ! Dimension, read array
��34� DATA �,�,�,4,�,�
��35� ! First three elements for any specified x-axis grid.
��36� ! For y-axis grid, 4 = green, � = solid line, � = narrow line
��37� CALL GDDM ('CHGATT',6,GATT()) ! Set grid attributes
��38� CALL GDDM ('CHYSET','GRID') ! Draw grid from y axis
��39� ! �������������� Components �������������������������������
��4�� INTEGER PATT ! Declare pattern array
��41� DIM PATT(3) : MAT READ PATT ! Dimension, read array
��42� DATA 16,16,16
��43� CALL GDDM ('CHPAT',3,PATT()) ! Set all patterns to solid
��44� ! ���������������� Legend ���������������������������������
��45� INTEGER KATT ! Declare key attribute array
��46� DIM KATT(2) : MAT READ KATT ! Dimension, read array
��47� DATA 6,2
��48� ! 6 = yellow, 2 = character mode
��49� CALL GDDM ('CHKATT',2,KATT()) ! Set key label attributes
��5�� CALL GDDM ('CHSET','KBOX') ! Enclose legend in box
��51� CALL GDDM ('CHKEY',3,4,'S/383�813�33') ! Three legend keys
��52� ! ��������� Number of components ��������������������������
��53� CALL GDDM ('CHNUM',3) ! Use three bars per x-value
��54� ! ����������� Specify S/38 data ���������������������������
��55� DIM NMD(1�) : MAT READ NMD ! Dimension and read data array
��56� DATA 15,56,67,76,43,45,56,87,56,34
��57� ! ������������� Draw chart ��������������������������������
��58� CALL GDDM ('CHBAR',1,1�,NMD())
4-70 AS/400 GDDM Programming Guide
Drawing the Chart
��59� ! Draw chart with 1� data groups of 1 bar each
��6�� ! ����������� Specify 3�81, 3�33 data ���������������������
��61� DIM NAD(2�) : MAT READ NAD ! Dimension and read data array
��62� DATA 25,67,69,65,55,67,69,72,56,34
��63� DATA 35,62,73,64,43,65,66,68,66,45
��64� CALL GDDM ('CHBAR',2,1�,NAD())
��65� ! Draw chart with 1� data groups of 2 bars each
��66� ! ��������������� Send to display �������������������������
��67� INTEGER ATTYPE,ATMOD,COUNT
��68� CALL GDDM ('ASREAD',ATTYPE,ATMOD,COUNT) ! Send to display
��69� ! ����������������� TERMINATE �����������������������������
��7�� CALL GDDM ('FSTERM') ! Terminate graphics
��71� END ! End BASIC program
| Drawing Composite-Bar ChartsData for composite or floating-bar charts can be shown as absolute or relative.
Charts that use absolute data (the default) have the upper boundary of the shadedregion showing the true values of the y-data for that component. All the datagroups are plotted from the x axis.
Charts that use relative data have the upper boundary of a component showing thesum of its own y-values added to those of the components shown below it. Thetrue y-value of the component can be seen by comparing the thickness of itsshaded region with the y-axis scale. Each data group is plotted from the top of theprevious one.
If each data group is larger than the one before, use absolute data. If some datagroups are smaller than the ones before, they will be hidden if you use absolutedata, use relative instead. For example:
�
������ 35MM�536K4 ������
� �
Chapter 4. Using Presentation Graphics 4-71
Drawing the Chart
CHSET – Specify chart options. CHSET (CBAR) draws a composite-bar chartwhen CHBAR is called.
CHSET – Specify chart options. CHSET (INFILL) suppresses the shading of thefirst component.
CHSET – Specify chart options. CHSET (RELATIVE) shows the data as relativedata.
This is an example of a horizontal composite-bar chart. The axis tick marks havebeen suppressed, and the color selection order has been modified:
�
������ 35MM�536K5 ������
� �
���1� ! ������������� FLEET – COMPOSITE-BAR ���������������������
���2� ! ����������������� INITIALIZE ����������������������������
���3� CALL GDDM ('FSINIT') ! Initialize graphics.
���4� OPTION BASE 1 ! Set array subscript base
���5� ! ����������������� Symbol set ����������������������������
���6� CALL GDDM ('GSLSS',2,'ADMUWTRP',66)
���7� ! Load vector symbol set ADMUWTRP as symbol set #66
���8� ! ���������� DEFINE THE CHART LAYOUT ���������������������
���9� CALL GDDM ('CHHMAR',3,�) ! Change horizontal margins
��1�� CALL GDDM ('CHVMAR',4,18) ! Change vertical margin space
��11� INTEGER HATT ! Declare heading attribute
��12� DIM HATT(4) : MAT READ HATT ! Dimension, read array
��13� DATA 2,3,66,25�
��14� ! 2 = red, 3 = char mode, 66 = symbol set number, 25� = size
��15� CALL GDDM ('CHHATT',4,HATT()) ! Set heading attributes
��16� CALL GDDM ('CHHEAD',29,'FLEET USAGE, CHARTER AIRCRAFT')
��17� ! Write 29-character heading with 'character string'
��18� CALL GDDM ('CHSET','XVERTICAL') ! Horizontal orientation
��19� CALL GDDM ('CHYRNG',�.�,15��.�) ! Set y-axis scale range
4-72 AS/400 GDDM Programming Guide
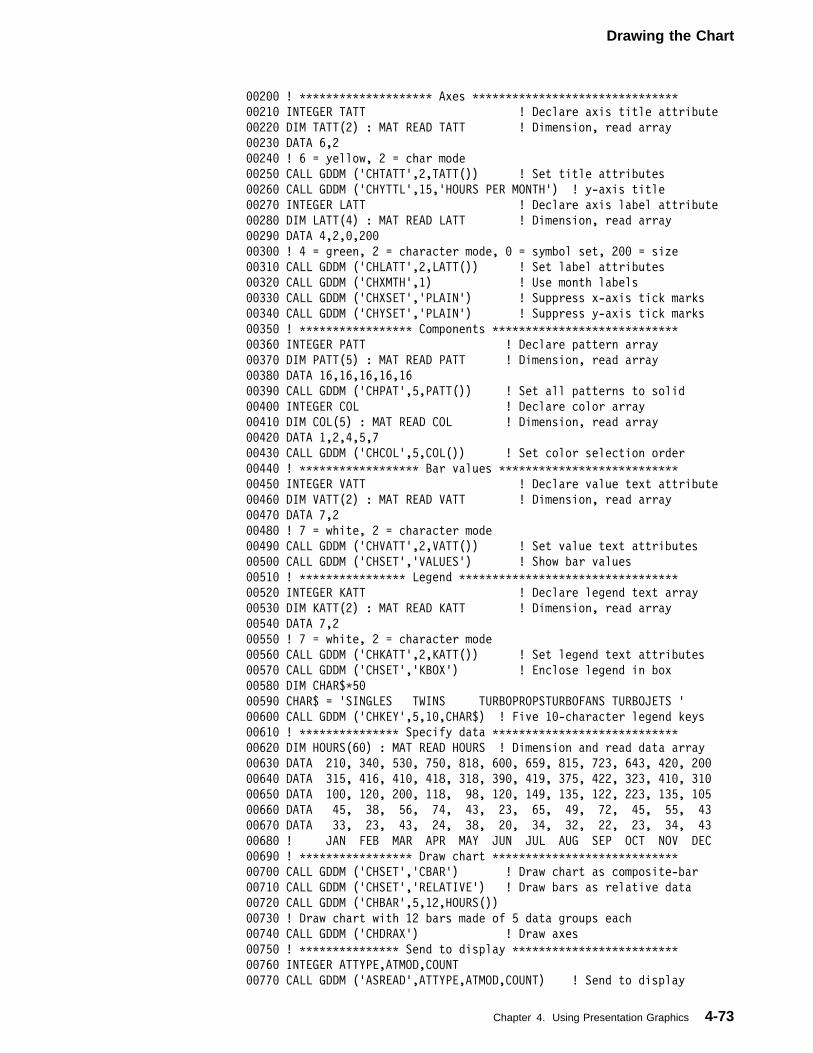
Drawing the Chart
��2�� ! �������������������� Axes �������������������������������
��21� INTEGER TATT ! Declare axis title attribute
��22� DIM TATT(2) : MAT READ TATT ! Dimension, read array
��23� DATA 6,2
��24� ! 6 = yellow, 2 = char mode
��25� CALL GDDM ('CHTATT',2,TATT()) ! Set title attributes
��26� CALL GDDM ('CHYTTL',15,'HOURS PER MONTH') ! y-axis title
��27� INTEGER LATT ! Declare axis label attribute
��28� DIM LATT(4) : MAT READ LATT ! Dimension, read array
��29� DATA 4,2,�,2��
��3�� ! 4 = green, 2 = character mode, � = symbol set, 2�� = size
��31� CALL GDDM ('CHLATT',2,LATT()) ! Set label attributes
��32� CALL GDDM ('CHXMTH',1) ! Use month labels
��33� CALL GDDM ('CHXSET','PLAIN') ! Suppress x-axis tick marks
��34� CALL GDDM ('CHYSET','PLAIN') ! Suppress y-axis tick marks
��35� ! ����������������� Components ����������������������������
��36� INTEGER PATT ! Declare pattern array
��37� DIM PATT(5) : MAT READ PATT ! Dimension, read array
��38� DATA 16,16,16,16,16
��39� CALL GDDM ('CHPAT',5,PATT()) ! Set all patterns to solid
��4�� INTEGER COL ! Declare color array
��41� DIM COL(5) : MAT READ COL ! Dimension, read array
��42� DATA 1,2,4,5,7
��43� CALL GDDM ('CHCOL',5,COL()) ! Set color selection order
��44� ! ������������������ Bar values ���������������������������
��45� INTEGER VATT ! Declare value text attribute
��46� DIM VATT(2) : MAT READ VATT ! Dimension, read array
��47� DATA 7,2
��48� ! 7 = white, 2 = character mode
��49� CALL GDDM ('CHVATT',2,VATT()) ! Set value text attributes
��5�� CALL GDDM ('CHSET','VALUES') ! Show bar values
��51� ! ���������������� Legend ���������������������������������
��52� INTEGER KATT ! Declare legend text array
��53� DIM KATT(2) : MAT READ KATT ! Dimension, read array
��54� DATA 7,2
��55� ! 7 = white, 2 = character mode
��56� CALL GDDM ('CHKATT',2,KATT()) ! Set legend text attributes
��57� CALL GDDM ('CHSET','KBOX') ! Enclose legend in box
��58� DIM CHAR$�5�
��59� CHAR$ = 'SINGLES TWINS TURBOPROPSTURBOFANS TURBOJETS '
��6�� CALL GDDM ('CHKEY',5,1�,CHAR$) ! Five 1�-character legend keys
��61� ! ��������������� Specify data ����������������������������
��62� DIM HOURS(6�) : MAT READ HOURS ! Dimension and read data array
��63� DATA 21�, 34�, 53�, 75�, 818, 6��, 659, 815, 723, 643, 42�, 2��
��64� DATA 315, 416, 41�, 418, 318, 39�, 419, 375, 422, 323, 41�, 31�
��65� DATA 1��, 12�, 2��, 118, 98, 12�, 149, 135, 122, 223, 135, 1�5
��66� DATA 45, 38, 56, 74, 43, 23, 65, 49, 72, 45, 55, 43
��67� DATA 33, 23, 43, 24, 38, 2�, 34, 32, 22, 23, 34, 43
��68� ! JAN FEB MAR APR MAY JUN JUL AUG SEP OCT NOV DEC
��69� ! ����������������� Draw chart ����������������������������
��7�� CALL GDDM ('CHSET','CBAR') ! Draw chart as composite-bar
��71� CALL GDDM ('CHSET','RELATIVE') ! Draw bars as relative data
��72� CALL GDDM ('CHBAR',5,12,HOURS())
��73� ! Draw chart with 12 bars made of 5 data groups each
��74� CALL GDDM ('CHDRAX') ! Draw axes
��75� ! ��������������� Send to display �������������������������
��76� INTEGER ATTYPE,ATMOD,COUNT
��77� CALL GDDM ('ASREAD',ATTYPE,ATMOD,COUNT) ! Send to display
Chapter 4. Using Presentation Graphics 4-73
Drawing the Chart
��79� CALL GDDM ('FSTERM') ! Terminate graphics
��8�� END ! End BASIC program
4-74 AS/400 GDDM Programming Guide
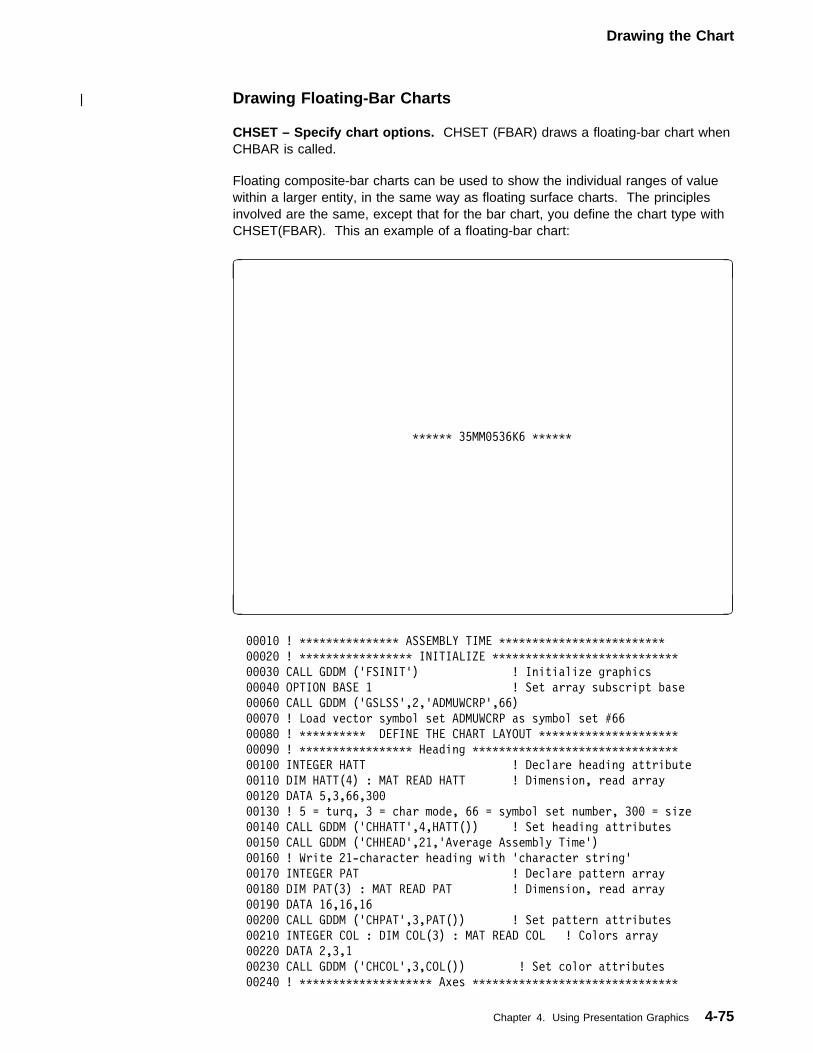
Drawing the Chart
| Drawing Floating-Bar Charts CHSET – Specify chart options. CHSET (FBAR) draws a floating-bar chart whenCHBAR is called.
Floating composite-bar charts can be used to show the individual ranges of valuewithin a larger entity, in the same way as floating surface charts. The principlesinvolved are the same, except that for the bar chart, you define the chart type withCHSET(FBAR). This an example of a floating-bar chart:
�
������ 35MM�536K6 ������
� �
���1� ! ��������������� ASSEMBLY TIME �������������������������
���2� ! ����������������� INITIALIZE ����������������������������
���3� CALL GDDM ('FSINIT') ! Initialize graphics
���4� OPTION BASE 1 ! Set array subscript base
���6� CALL GDDM ('GSLSS',2,'ADMUWCRP',66)
���7� ! Load vector symbol set ADMUWCRP as symbol set #66
���8� ! ���������� DEFINE THE CHART LAYOUT ���������������������
���9� ! ����������������� Heading �������������������������������
��1�� INTEGER HATT ! Declare heading attribute
��11� DIM HATT(4) : MAT READ HATT ! Dimension, read array
��12� DATA 5,3,66,3��
��13� ! 5 = turq, 3 = char mode, 66 = symbol set number, 3�� = size
��14� CALL GDDM ('CHHATT',4,HATT()) ! Set heading attributes
��15� CALL GDDM ('CHHEAD',21,'Average Assembly Time')
��16� ! Write 21-character heading with 'character string'
��17� INTEGER PAT ! Declare pattern array
��18� DIM PAT(3) : MAT READ PAT ! Dimension, read array
��19� DATA 16,16,16
��2�� CALL GDDM ('CHPAT',3,PAT()) ! Set pattern attributes
��21� INTEGER COL : DIM COL(3) : MAT READ COL ! Colors array
��22� DATA 2,3,1
��23� CALL GDDM ('CHCOL',3,COL()) ! Set color attributes
��24� ! �������������������� Axes �������������������������������
Chapter 4. Using Presentation Graphics 4-75
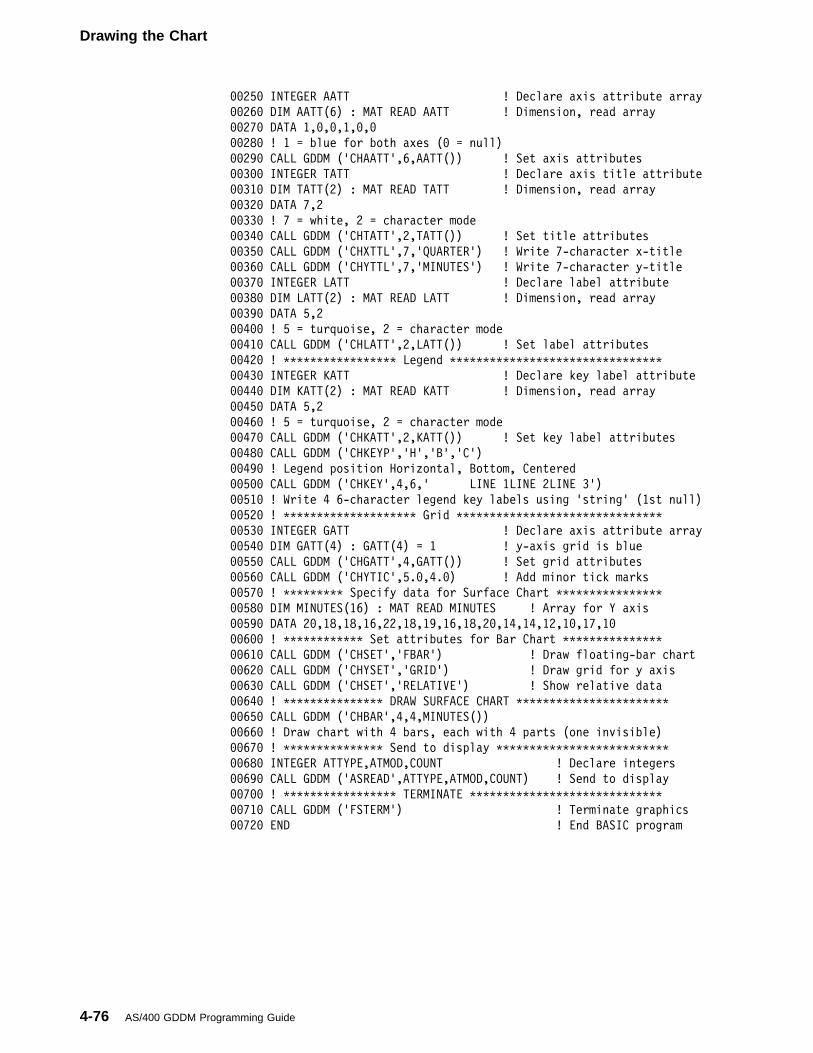
Drawing the Chart
��25� INTEGER AATT ! Declare axis attribute array
��26� DIM AATT(6) : MAT READ AATT ! Dimension, read array
��27� DATA 1,�,�,1,�,�
��28� ! 1 = blue for both axes (� = null)
��29� CALL GDDM ('CHAATT',6,AATT()) ! Set axis attributes
��3�� INTEGER TATT ! Declare axis title attribute
��31� DIM TATT(2) : MAT READ TATT ! Dimension, read array
��32� DATA 7,2
��33� ! 7 = white, 2 = character mode
��34� CALL GDDM ('CHTATT',2,TATT()) ! Set title attributes
��35� CALL GDDM ('CHXTTL',7,'QUARTER') ! Write 7-character x-title
��36� CALL GDDM ('CHYTTL',7,'MINUTES') ! Write 7-character y-title
��37� INTEGER LATT ! Declare label attribute
��38� DIM LATT(2) : MAT READ LATT ! Dimension, read array
��39� DATA 5,2
��4�� ! 5 = turquoise, 2 = character mode
��41� CALL GDDM ('CHLATT',2,LATT()) ! Set label attributes
��42� ! ����������������� Legend ��������������������������������
��43� INTEGER KATT ! Declare key label attribute
��44� DIM KATT(2) : MAT READ KATT ! Dimension, read array
��45� DATA 5,2
��46� ! 5 = turquoise, 2 = character mode
��47� CALL GDDM ('CHKATT',2,KATT()) ! Set key label attributes
��48� CALL GDDM ('CHKEYP','H','B','C')
��49� ! Legend position Horizontal, Bottom, Centered
��5�� CALL GDDM ('CHKEY',4,6,' LINE 1LINE 2LINE 3')
��51� ! Write 4 6-character legend key labels using 'string' (1st null)
��52� ! �������������������� Grid �������������������������������
��53� INTEGER GATT ! Declare axis attribute array
��54� DIM GATT(4) : GATT(4) = 1 ! y-axis grid is blue
��55� CALL GDDM ('CHGATT',4,GATT()) ! Set grid attributes
��56� CALL GDDM ('CHYTIC',5.�,4.�) ! Add minor tick marks
��57� ! ��������� Specify data for Surface Chart ����������������
��58� DIM MINUTES(16) : MAT READ MINUTES ! Array for Y axis
��59� DATA 2�,18,18,16,22,18,19,16,18,2�,14,14,12,1�,17,1�
��6�� ! ������������ Set attributes for Bar Chart ���������������
��61� CALL GDDM ('CHSET','FBAR') ! Draw floating-bar chart
��62� CALL GDDM ('CHYSET','GRID') ! Draw grid for y axis
��63� CALL GDDM ('CHSET','RELATIVE') ! Show relative data
��64� ! ��������������� DRAW SURFACE CHART �����������������������
��65� CALL GDDM ('CHBAR',4,4,MINUTES())
��66� ! Draw chart with 4 bars, each with 4 parts (one invisible)
��67� ! ��������������� Send to display ��������������������������
��68� INTEGER ATTYPE,ATMOD,COUNT ! Declare integers
��69� CALL GDDM ('ASREAD',ATTYPE,ATMOD,COUNT) ! Send to display
��7�� ! ����������������� TERMINATE �����������������������������
��71� CALL GDDM ('FSTERM') ! Terminate graphics
��72� END ! End BASIC program
4-76 AS/400 GDDM Programming Guide
Drawing the Chart
Drawing Pie Charts
| Setting the Component Color Selection Order CHCOL – Set component color. CHCOL sets the color of the pie slices bydefining a table that holds the number of colors and the order of their selection.
If CHCOL is not specified, the sequence of colors in the default color table is used.The default color table is, in this case, the GDDM color table which is either thedefault color table for the current page or a color table modified for use in thecurrent page.
| Setting the Shading Attributes CHPAT – Set component shading pattern. CHPAT sets the type of pattern usedby shaded components by defining a table that holds the number of patterns andthe order of their selection.
If CHPAT is not specified, the sequence of patterns in the default pattern table isused. The default pattern table shown for the discussion of the GSPAT routine inChapter 3, “Using GDDM” shows the order of selection.
CHSET – Specify chart options. CHSET (NOFILL) suppresses the shading ofpies.
| Writing Pie Chart TextBesides using a chart heading and using chart notes to write text for pie charts, youcan use a legend to identify the value and meaning of pie slices or you can writethe legend key values next to the pie slices. For either of these options, you canalso write the percentage values of each pie slice next to it, and connect the twowith a line.
Using a legend
CHSET – Specify chart options. CHSET (PIEKEY) generates a chart legend, asopposed to writing the legend key labels next to the pie slices with CHSET(SPIDER). PIEKEY is the default.
When you use a legend, the attributes for the legend key labels are specified bythe CHKATT routine.
Using legend key labels as pie slice labels
CHSET – Specify chart options. CHSET (SPIDER) writes the legend key labelsnext to the pie slices.
When you use a legend key labels as pie slice values, the attributes for the legendkey labels are specified by the CHKATT routine.
Using value text as pie slice labels
You can specify that the value of each pie slice is written next to it. The value isconnected to the slice with a line called a spider tag.
Chapter 4. Using Presentation Graphics 4-77
Drawing the Chart
You can use value text in addition to the legend or the legend key labels.However, the routine used to set attributes for the value text differs with each.
For value text used when a legend is also used, use the CHVATT routine to set thecolor, character mode, symbol set used, and character size of the value text. Forthe color value to have an effect, SPILABEL must also be specified; otherwise,(when SPISECTOR is used) the value text is the color of the associated pie slice.
For value text used when legend key labels are used (SPIDER), use the CHKATTroutine to set the color, character mode, symbol set used, and character size of thevalue text. For the color value to have an effect on both the value text and thelegend key labels, SPILABEL must also be specified; otherwise, (whenSPISECTOR is used) the value text and the legend key labels are the color of theassociated pie slice.
Setting pie slice data values
CHSET – Specify chart options. CHSET (VALUES) writes the data valuerepresented by each pie slice adjacent to it.
CHSET (BVALUES) blanks the areas where pie slice values are written. When thearea is blanked, no other display feature can occupy the pie slice value text box.When the area is not blanked, the values can overpaint another feature.
CHVCHR – Number of value text characters. CHVCHR sets the number ofcharacters to be used for showing pie slice values on a pie chart. The value textattributes are controlled by CHVATT. By default, up to 9 character positions can beused.
CHVATT – Value text attributes. CHVATT specifies the attributes for data valuetext. Data value text is used to show individual values for pie slices. Attributes that
| can be set are color, character mode, and character font and size. Character| rotation is ignored for pie charts.
If CHVATT is not specified, each value uses standard-size device defaultcharacters of the default color, or of the color of the associated pie slice (ifSPISECTOR is used).
CHSET – Specify chart options. CHSET (SPISECTOR|SPILABEL) specifies thecolor of spider tags and value text. If SPISECTOR is specified, the spider tags,value text, and legend key labels are colored the same as the associated sector. IfSPILABEL is specified, the spider tags are the default color and the value text iseither the color of the legend key labels (CHKATT) or the color specified byCHVATT for value text attributes.
Note: If spider tags overlap with the legend, you should move the legend (withCHKEYP) or change the size of the margins (with CHHMAR or CHVMAR).
4-78 AS/400 GDDM Programming Guide
Drawing the Chart
| Setting the Type of Data to be Shown CHSET – Specify chart options. CHSET (PERPIE|ABPIE) shows the slices ofthe pie as relative data (PERPIE), or as absolute data (ABPIE). When the data isshown as relative data, each pie slice is shown with its true value (the value usedin the pie chart data value array) as a percentage. Percentage values are subjectto rounding errors and may not be precise. If the percentage values should be ofdecimal precision, you should calculate them in your program and then use themas pie slice labels. If the sum of all the values is less than 100, an incomplete pieis drawn. If the sum of the values exceeds 100, an error occurs and the pie is notdrawn.
For absolute data (ABPIE), the data values of the pie chart array are reduced orincreased so that their sum equals 100, which results in a complete pie.
| Controlling Pie Slices CHPCTL – Specify chart appearance. You can make a pie chart more interestingby moving one or more of the slices out from the rest (exploding the chart). Tospecify which slices you want to move, use CHPEXP.
| Drawing the Pie Chart CHPIE – Draw a pie chart. CHPIE draws one or more pie charts. Parameters inthe CHPIE routine specify the number of components (pies) to be drawn, thenumber of slices in each pie, and the array used for the dependent variables (thesize of the pie slices).
The following chart is an example of a single-pie chart. The pie chart uses abackground, and the patterns used for the pie slices have been set to solid. Also,both the horizontal and vertical margins have been reduced to zero to enlarge thepie:
Chapter 4. Using Presentation Graphics 4-79
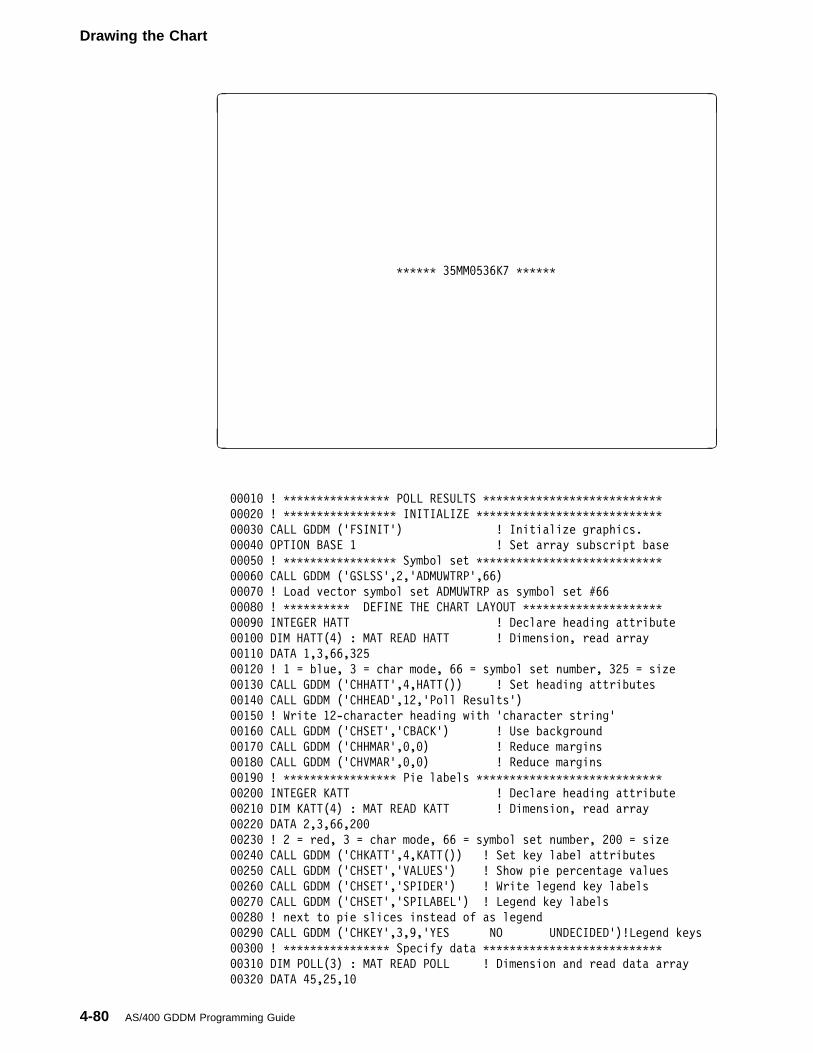
Drawing the Chart
�
������ 35MM�536K7 ������
� �
���1� ! ���������������� POLL RESULTS ���������������������������
���2� ! ����������������� INITIALIZE ����������������������������
���3� CALL GDDM ('FSINIT') ! Initialize graphics.
���4� OPTION BASE 1 ! Set array subscript base
���5� ! ����������������� Symbol set ����������������������������
���6� CALL GDDM ('GSLSS',2,'ADMUWTRP',66)
���7� ! Load vector symbol set ADMUWTRP as symbol set #66
���8� ! ���������� DEFINE THE CHART LAYOUT ���������������������
���9� INTEGER HATT ! Declare heading attribute
��1�� DIM HATT(4) : MAT READ HATT ! Dimension, read array
��11� DATA 1,3,66,325
��12� ! 1 = blue, 3 = char mode, 66 = symbol set number, 325 = size
��13� CALL GDDM ('CHHATT',4,HATT()) ! Set heading attributes
��14� CALL GDDM ('CHHEAD',12,'Poll Results')
��15� ! Write 12-character heading with 'character string'
��16� CALL GDDM ('CHSET','CBACK') ! Use background
��17� CALL GDDM ('CHHMAR',�,�) ! Reduce margins
��18� CALL GDDM ('CHVMAR',�,�) ! Reduce margins
��19� ! ����������������� Pie labels ����������������������������
��2�� INTEGER KATT ! Declare heading attribute
��21� DIM KATT(4) : MAT READ KATT ! Dimension, read array
��22� DATA 2,3,66,2��
��23� ! 2 = red, 3 = char mode, 66 = symbol set number, 2�� = size
��24� CALL GDDM ('CHKATT',4,KATT()) ! Set key label attributes
��25� CALL GDDM ('CHSET','VALUES') ! Show pie percentage values
��26� CALL GDDM ('CHSET','SPIDER') ! Write legend key labels
��27� CALL GDDM ('CHSET','SPILABEL') ! Legend key labels
��28� ! next to pie slices instead of as legend
��29� CALL GDDM ('CHKEY',3,9,'YES NO UNDECIDED')!Legend keys
��3�� ! ���������������� Specify data ���������������������������
��31� DIM POLL(3) : MAT READ POLL ! Dimension and read data array
��32� DATA 45,25,1�
4-80 AS/400 GDDM Programming Guide
Drawing the Chart
��33� ! ����������������� Draw chart ����������������������������
��34� INTEGER PAT ! Declare pattern attribute
��35� DIM PAT(3) : MAT READ PAT ! Dimension, read array
��36� DATA 16,16,16
��37� ! Use solid fill for each pie slice
��38� CALL GDDM ('CHPAT',3,PAT()) ! Set heading attributes
��39� CALL GDDM ('CHSET','ABPIE') ! Draw pie as absolute data
��4�� CALL GDDM ('CHPIE',1,3,POLL()) ! Draw 1 pie, 3 slices
��41� ! ��������������� Send to display �������������������������
��42� INTEGER ATTYPE,ATMOD,COUNT ! Declare integers
��43� CALL GDDM ('ASREAD',ATTYPE,ATMOD,COUNT) ! Send to display
��44� ! ����������������� TERMINATE �����������������������������
��45� CALL GDDM ('FSTERM') ! Terminate graphics
��46� END ! End BASIC program
| Drawing a Multiple-Pie ChartFor other chart types, such as line charts and bar charts, the term chart componentrefers to a representation of one data group for the chart, such as a line or a bar.For pie charts, a chart component is one pie because one CHPIE routine can drawmany pies.
Chapter 4. Using Presentation Graphics 4-81
Drawing the Chart
There are two types of multiple-pie chart:
� Charts where each pie shows a variation of an amount. An example ofsuch a multiple-pie chart is one that uses three pies to show the percentages ofthe total operating costs for a business over three years, see the example of amultiple-pie chart on page 4-83.
For this type of chart, use a single CHPIE routine, but specify the number ofcomponents (pies) to be drawn. When drawing multiple-pie charts this way,you can specify CHSET(PROPIE) to vary the size of each chart based on thesum of its chart data values to show the value of each pie relative to theothers.
CHNUM and a corresponding number of CHPIE routines can also be used.
� Charts where each pie shows a different group of data. For an example ofsuch a chart, see the example of a multiple-pie chart on page 4-85.
For this type of chart, use CHNUM to specify the number of pies, then use aCHPIE routine to draw each pie. The relative size of the pies cannot be variedwith CHSET(PROPIE).
Use these routines to draw multiple-pie charts:
CHNUM – Set number of chart components. CHNUM sets the number of piecharts to be constructed on a single chart format. One pie chart is constructed byeach call of the CHPIE routine.
CHPIER – Pie chart size reduction. The CHPIER routine specifies a reductionpercentage for reducing the size of each chart.
CHSET – Specify chart options. CHSET(ABPIE|PROPIE) specifies whether thesum of the chart data determines the relative size (diameter) of each pie. ABPIEmakes all pies the same size (the default), and PROPIE varies the size of the pies(the smallest-value pie will have the smallest diameter). PROPIE is valid only whena single CHPIE routine is used to draw multiple pies.
CHXLAB – x-axis label text specification. CHXLAB is used to specify the titlesfor the individual pies in multiple-pie charts.
4-82 AS/400 GDDM Programming Guide
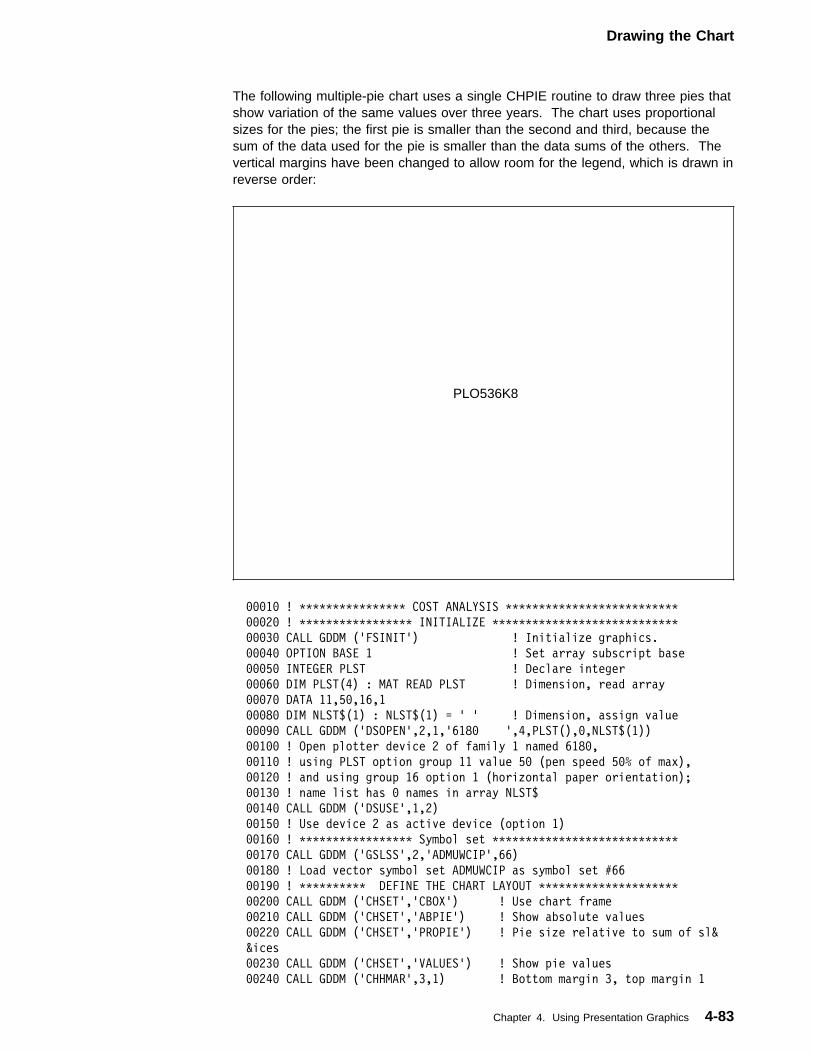
Drawing the Chart
The following multiple-pie chart uses a single CHPIE routine to draw three pies thatshow variation of the same values over three years. The chart uses proportionalsizes for the pies; the first pie is smaller than the second and third, because thesum of the data used for the pie is smaller than the data sums of the others. Thevertical margins have been changed to allow room for the legend, which is drawn inreverse order:
PLO536K8
���1� ! ���������������� COST ANALYSIS ��������������������������
���2� ! ����������������� INITIALIZE ����������������������������
���3� CALL GDDM ('FSINIT') ! Initialize graphics.
���4� OPTION BASE 1 ! Set array subscript base
���5� INTEGER PLST ! Declare integer
���6� DIM PLST(4) : MAT READ PLST ! Dimension, read array
���7� DATA 11,5�,16,1
���8� DIM NLST$(1) : NLST$(1) = ' ' ! Dimension, assign value
���9� CALL GDDM ('DSOPEN',2,1,'618� ',4,PLST(),�,NLST$(1))
��1�� ! Open plotter device 2 of family 1 named 618�,
��11� ! using PLST option group 11 value 5� (pen speed 5�% of max),
��12� ! and using group 16 option 1 (horizontal paper orientation);
��13� ! name list has � names in array NLST$
��14� CALL GDDM ('DSUSE',1,2)
��15� ! Use device 2 as active device (option 1)
��16� ! ����������������� Symbol set ����������������������������
��17� CALL GDDM ('GSLSS',2,'ADMUWCIP',66)
��18� ! Load vector symbol set ADMUWCIP as symbol set #66
��19� ! ���������� DEFINE THE CHART LAYOUT ���������������������
��2�� CALL GDDM ('CHSET','CBOX') ! Use chart frame
��21� CALL GDDM ('CHSET','ABPIE') ! Show absolute values
��22� CALL GDDM ('CHSET','PROPIE') ! Pie size relative to sum of sl&
&ices
��23� CALL GDDM ('CHSET','VALUES') ! Show pie values
��24� CALL GDDM ('CHHMAR',3,1) ! Bottom margin 3, top margin 1
Chapter 4. Using Presentation Graphics 4-83
Drawing the Chart
��25� CALL GDDM ('CHVMAR',�,2�) ! Left margin �, right margin 2�
��26� INTEGER HATT ! Declare heading attribute
��27� DIM HATT(4) : MAT READ HATT ! Dimension, read array
��28� DATA 2,3,66,225
��29� ! 2 = pen 2, 3 = char mode, 66 = symbol set number, 225 = size
��3�� CALL GDDM ('CHHATT',4,HATT()) ! Set heading attributes
��31� CALL GDDM ('CHHEAD',37,'Three-year Operational Cost Breakdown')
��32� ! Write 37-character heading with 'character string'
��33� ! ���������������� Pie titles �����������������������������
��34� INTEGER LATT ! Declare label attribute
��35� DIM LATT(4) : MAT READ LATT ! Dimension, read array
��36� DATA 5,3,66,2��
��37� ! 5 = pen 5, 3 = character mode, 66 = symbol set, 2�� = size
��38� CALL GDDM ('CHLATT',4,LATT()) ! Set label attributes
��39� CALL GDDM ('CHXLAB',3,4,'198219831984')
��4�� ! Write three 4-character labels to be used as pie titles
��41� ! ���������������� Legend ���������������������������������
��42� CALL GDDM ('CHSET','KBOX') ! Enclose legend in box
��43� DIM CHAR$�11�
��44� CALL GDDM ('CHSET','KREVERSE') ! Write legend reverse order
��45� CHAR$ = 'DepreciationInterest Insurance Fuel Seed &
& Chemicals Maintenance Labor Misc '
��46� CALL GDDM ('CHKEY',9,12,CHAR$) ! Write legend keys
��47� ! ������������� Specify chart data ������������������������
��48� DIM FARM(27) : MAT READ FARM ! Dimension and read data array
��49� DATA 4,14,2,1�,11,17,3,5,5
��5�� DATA 3,18,3,12,12,19,4,4,1�
��51� DATA 2,18,3,14,15,18,5,4,9
��52� CALL GDDM ('CHPIE',3,9,FARM()) ! Draw 3 pies
��53� ! ��������������� Send to plotter �������������������������
��54� CALL GDDM ('FSFRCE') ! Send to plotter
��55� ! ����������������� TERMINATE �����������������������������
��56� CALL GDDM ('FSTERM') ! Terminate graphics
��57� END ! End BASIC program
4-84 AS/400 GDDM Programming Guide
Drawing the Chart
This multiple-pie chart uses CHNUM to specify two pies, and uses twocorresponding CHPIE routines:
PL0536K9
���1� ! ����������� FIXED VERSUS VARIABLE �����������������������
���2� ! ����������������� INITIALIZE ����������������������������
���3� CALL GDDM ('FSINIT') ! Initialize graphics.
���4� OPTION BASE 1 ! Set array subscript base
���5� INTEGER PLST ! Declare integer
���6� DIM PLST(4) : MAT READ PLST ! Dimension, read array
���7� DATA 11,5�,16,1
���8� DIM NLST$(1) : NLST$(1) = ' ' ! Dimension, assign value
���9� CALL GDDM ('DSOPEN',2,1,'618� ',4,PLST(),�,NLST$(1))
��1�� ! Open plotter device 2 of family 1 named 618�,
��11� ! using PLST option group 11 value 5� (pen speed 5�% of max),
��12� ! and using group 16 option 1 (horizontal paper orientation);
��13� ! name list has � names in array NLST$
��14� CALL GDDM ('DSUSE',1,2)
��15� ! Use device 2 as active device (option 1)
��16� ! ����������������� Symbol set ����������������������������
��17� CALL GDDM ('GSLSS',2,'ADMUWCIP',66)
��18� ! Load vector symbol set ADMUWCIP as symbol set #66
��19� ! ���������� DEFINE THE CHART LAYOUT ���������������������
��2�� CALL GDDM ('CHSET','CBOX') ! Use chart frame
��21� CALL GDDM ('CHSET','ABPIE') ! Show absolute values
��22� CALL GDDM ('CHSET','VALUES') ! Show pie values
��23� CALL GDDM ('CHHMAR',3,1) ! Bottom margin 3, top margin 1
��24� CALL GDDM ('CHVMAR',�,2�) ! Left margin �, right margin 2�
��25� INTEGER HATT ! Declare heading attribute
��26� DIM HATT(4) : MAT READ HATT ! Dimension, read array
��27� DATA 2,3,66,225
��28� ! 2 = pen 2, 3 = char mode, 66 = symbol set number, 225 = size
��29� CALL GDDM ('CHHATT',4,HATT()) ! Set heading attributes
Chapter 4. Using Presentation Graphics 4-85
Drawing the Chart
��3�� DIM CHAR$�11�
��31� CHAR$ = 'Three-year Operational Cost Breakdown;Averages for ''82&
& – ''84'
��32� CALL GDDM ('CHHEAD',6�,CHAR$) ! Write heading
��33� CALL GDDM ('CHNUM',2) ! Draw 2 pie charts
��34� ! ���������������� Pie titles �����������������������������
��35� INTEGER LATT ! Declare label attribute
��36� DIM LATT(4) : MAT READ LATT ! Dimension, read array
��37� DATA 5,3,66,15�
��38� ! 5 = pen 5, 3 = character mode, 66 = symbol set, 15� = size
��39� CALL GDDM ('CHLATT',4,LATT()) ! Set label attributes
��4�� CHAR$ = ' Fixed Costs Only Fixed Costs and Variable &
&Costs'
��41� CALL GDDM ('CHXLAB',2,3�,CHAR$)
��42� ! Write two 3�-character labels to be used as pie titles
��43� ! �������������������� Legend �����������������������������
��44� CALL GDDM ('CHSET','KBOX') ! Enclose legend in box
��45� CALL GDDM ('CHSET','KREVERSE') ! Write legend reverse order
��46� INTEGER KATT ! Declare label attribute
��47� DIM KATT(2) : MAT READ KATT ! Dimension, read array
��48� DATA �,2
��49� ! � = pen 1, 2 = character mode
��5�� CALL GDDM ('CHKATT',2,KATT()) ! Set legend text attributes
��51� CHAR$ = 'DepreciationInterest Insurance Fuel Seed &
& Chemicals Maintenance Labor Misc '
��52� CALL GDDM ('CHKEY',9,12,CHAR$) ! Write labels
��53� ! ������������ Draw fixed-cost chart ����������������������
��54� DIM FIX(3) : MAT READ FIX ! Dimension and read data array
��55� DATA 9,56,8
��56� CALL GDDM ('CHPIE',1,3,FIX()) ! Draw 1 pie, 3 slices
��57� ! ������������ Draw variable cost chart �������������������
��58� DIM VAR(9) : MAT READ VAR ! Dimension and read data array
��59� DATA 9,56,8,6�,36,38,12,13,24
��6�� CALL GDDM ('CHPIE',1,9,VAR()) ! Draw 1 pie, 9 slices
��61� ! ��������������� Send to plotter �������������������������
��62� CALL GDDM ('FSFRCE') ! Send to plotter
��63� ! ����������������� TERMINATE �����������������������������
��64� CALL GDDM ('FSTERM') ! Terminate graphics
��65� END ! End BASIC program
4-86 AS/400 GDDM Programming Guide
Drawing the Chart
Drawing Histograms
| Setting the Color of the Shaded Area CHCOL – Set component color. CHCOL sets the color of the shaded area. Thehistogram uses the first color in the CHCOL color-selection table.
If CHCOL is not specified, the sequence of colors in the default color table is used.The default color table is, in this case, the GDDM color table which is either thedefault color table for the current page or a color table modified for use in thecurrent page.
| Setting the Shading Attributes CHSET – Specify chart options. CHSET (NOFILL) suppresses the shading of thearea.
CHPAT – Set component shading pattern. CHPAT sets the pattern of theshaded area. The histogram uses the first pattern in the CHPAT pattern-selectiontable.
| Setting the Type of Data to be Shown CHSET – Specify chart options. CHSET (RELATIVE) shows the data as relativedata.
| Suppressing the Risers CHSET – Specify chart options. CHSET (RISERS|NORISERS) specifies whetherlines (risers) are drawn between data groups or not. CHSET (NORISERS) stopsthe risers of the histogram being drawn. Histogram risers show the divisionsbetween the steps of the histogram component levels.
| Drawing the Histogram CHHIST – Draw a histogram. CHHIST draws a histogram. Parameters in theCHHIST routine specify the number of components to be drawn, the number ofranges for each component, the arrays used for the ranges of the components, andthe arrays used for the data groups the components are drawn to represent.
Chapter 4. Using Presentation Graphics 4-87
Drawing the Chart
This is an example of a histogram. Chart notes are used in place of x-axis labelsbecause the default labels are placed at even increments along the axis, while thecomponents for the histogram use varying ranges along the x axis:
�
������ 35MM�536L1 ������
� �
���1� ! �������������� BICYCLE OWNERSHIP ������������������������
���2� ! ����������������� INITIALIZE ����������������������������
���3� CALL GDDM ('FSINIT') ! Initialize graphics.
���4� OPTION BASE 1 ! Set array subscript base
���5� ! ����������������� Symbol set ����������������������������
���6� CALL GDDM ('GSLSS',2,'ADMUWGEP',66)
���7� ! Load vector symbol set ADMUWGEP as symbol set #66
���8� ! ���������� DEFINE THE CHART LAYOUT ���������������������
���9� INTEGER HATT ! Declare heading attribute
��1�� DIM HATT(4) : MAT READ HATT ! Dimension, read array
��11� DATA 2,3,66,3��
��12� ! 2 = red, 3 = char mode, 66 = symbol set number, 3�� = size
��13� CALL GDDM ('CHHATT',4,HATT()) ! Set heading attributes
��14� CALL GDDM ('CHHEAD',17,'Bicycle Ownership')
��15� ! Write 17-character heading with 'character string'
��16� ! ������������������ Axes ���������������������������������
��17� INTEGER TATT ! Declare axis title attribute
��18� DIM TATT(4) : MAT READ TATT ! Dimension, read array
��19� DATA 2,3,�,15�
��2�� ! 2 = red, 3 = character mode, � = symbol set, 15� = title size
��21� CALL GDDM ('CHTATT',4,TATT()) ! Set title attributes
��22� CALL GDDM ('CHYTTL',24,'PERCENTAGE OF POPULATION') ! y-axis title
��23� CALL GDDM ('CHXSET','NOLAB') ! Suppress x-axis labels
��24� CALL GDDM ('CHXSET','PLAIN') ! Suppress x-axis ticks
��25� ! ����������������� Specify data ��������������������������
��26� DIM XLO(6) : MAT READ XLO ! Array for x low range
��27� DATA �,1�,2�,35,5�,7�
��28� DIM XHI(6) : MAT READ XHI ! Array for x high range
4-88 AS/400 GDDM Programming Guide
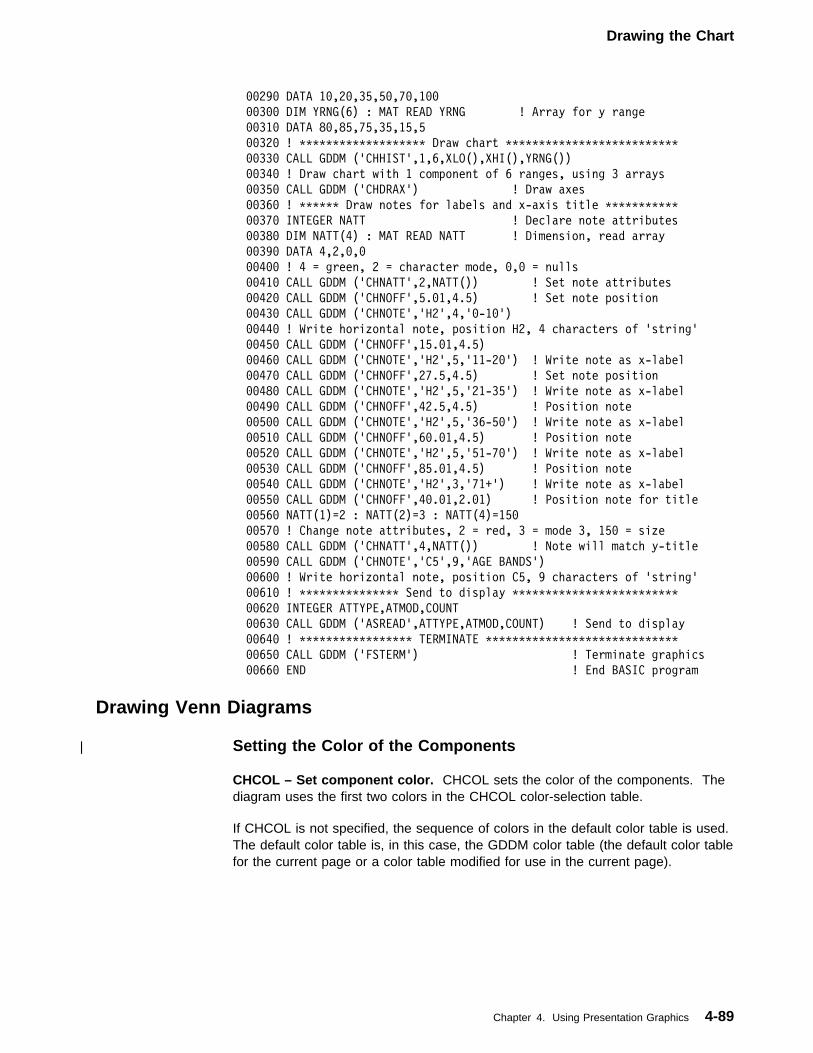
Drawing the Chart
��29� DATA 1�,2�,35,5�,7�,1��
��3�� DIM YRNG(6) : MAT READ YRNG ! Array for y range
��31� DATA 8�,85,75,35,15,5
��32� ! ������������������� Draw chart ��������������������������
��33� CALL GDDM ('CHHIST',1,6,XLO(),XHI(),YRNG())
��34� ! Draw chart with 1 component of 6 ranges, using 3 arrays
��35� CALL GDDM ('CHDRAX') ! Draw axes
��36� ! ������ Draw notes for labels and x-axis title �����������
��37� INTEGER NATT ! Declare note attributes
��38� DIM NATT(4) : MAT READ NATT ! Dimension, read array
��39� DATA 4,2,�,�
��4�� ! 4 = green, 2 = character mode, �,� = nulls
��41� CALL GDDM ('CHNATT',2,NATT()) ! Set note attributes
��42� CALL GDDM ('CHNOFF',5.�1,4.5) ! Set note position
��43� CALL GDDM ('CHNOTE','H2',4,'�-1�')
��44� ! Write horizontal note, position H2, 4 characters of 'string'
��45� CALL GDDM ('CHNOFF',15.�1,4.5)
��46� CALL GDDM ('CHNOTE','H2',5,'11-2�') ! Write note as x-label
��47� CALL GDDM ('CHNOFF',27.5,4.5) ! Set note position
��48� CALL GDDM ('CHNOTE','H2',5,'21-35') ! Write note as x-label
��49� CALL GDDM ('CHNOFF',42.5,4.5) ! Position note
��5�� CALL GDDM ('CHNOTE','H2',5,'36-5�') ! Write note as x-label
��51� CALL GDDM ('CHNOFF',6�.�1,4.5) ! Position note
��52� CALL GDDM ('CHNOTE','H2',5,'51-7�') ! Write note as x-label
��53� CALL GDDM ('CHNOFF',85.�1,4.5) ! Position note
��54� CALL GDDM ('CHNOTE','H2',3,'71+') ! Write note as x-label
��55� CALL GDDM ('CHNOFF',4�.�1,2.�1) ! Position note for title
��56� NATT(1)=2 : NATT(2)=3 : NATT(4)=15�
��57� ! Change note attributes, 2 = red, 3 = mode 3, 15� = size
��58� CALL GDDM ('CHNATT',4,NATT()) ! Note will match y-title
��59� CALL GDDM ('CHNOTE','C5',9,'AGE BANDS')
��6�� ! Write horizontal note, position C5, 9 characters of 'string'
��61� ! ��������������� Send to display �������������������������
��62� INTEGER ATTYPE,ATMOD,COUNT
��63� CALL GDDM ('ASREAD',ATTYPE,ATMOD,COUNT) ! Send to display
��64� ! ����������������� TERMINATE �����������������������������
��65� CALL GDDM ('FSTERM') ! Terminate graphics
��66� END ! End BASIC program
Drawing Venn Diagrams
| Setting the Color of the Components CHCOL – Set component color. CHCOL sets the color of the components. Thediagram uses the first two colors in the CHCOL color-selection table.
If CHCOL is not specified, the sequence of colors in the default color table is used.The default color table is, in this case, the GDDM color table (the default color tablefor the current page or a color table modified for use in the current page).
Chapter 4. Using Presentation Graphics 4-89
Drawing the Chart
| Setting the Shading Attributes CHSET – Specify chart options. CHSET (NOFILL) suppresses shading of thepopulation circles and of the overlap area.
CHPAT – Set component shading pattern. CHPAT sets the pattern of theshaded area. The diagram uses the first two patterns in the CHPATpattern-selection table.
If CHPAT is not specified, the sequence of patterns in the default pattern table isused. The default pattern table shown for the discussion of the GSPAT routine inChapter 3, “Using GDDM” shows the order of selection.
| Drawing the Venn Diagram CHVENN – Draw a Venn diagram. CHVENN draws a Venn diagram. Parametersin the CHVENN routine specify the values of both populations, and the value of theoverlap area.
This is an example of a Venn diagram. It has a chart frame, and uses blankednotes to indicate the relative values of the populations and their overlap:
�
������ 35MM�536L2 ������
� �
4-90 AS/400 GDDM Programming Guide
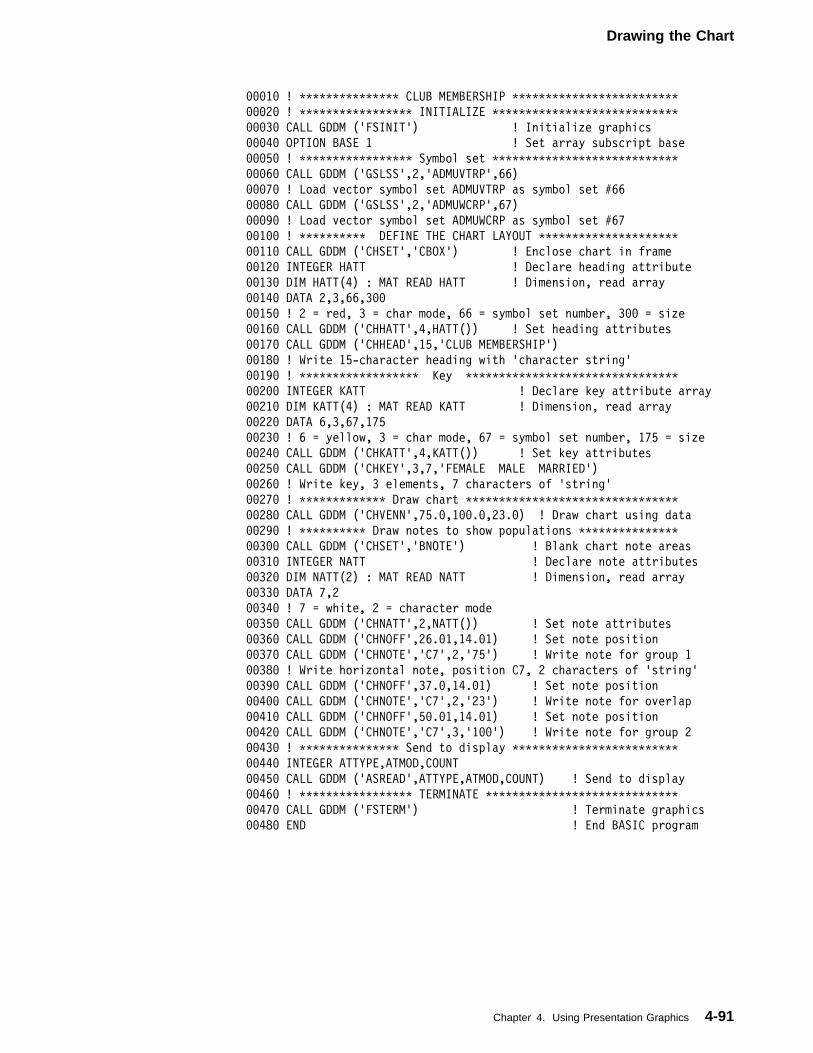
Drawing the Chart
���1� ! ��������������� CLUB MEMBERSHIP �������������������������
���2� ! ����������������� INITIALIZE ����������������������������
���3� CALL GDDM ('FSINIT') ! Initialize graphics
���4� OPTION BASE 1 ! Set array subscript base
���5� ! ����������������� Symbol set ����������������������������
���6� CALL GDDM ('GSLSS',2,'ADMUVTRP',66)
���7� ! Load vector symbol set ADMUVTRP as symbol set #66
���8� CALL GDDM ('GSLSS',2,'ADMUWCRP',67)
���9� ! Load vector symbol set ADMUWCRP as symbol set #67
��1�� ! ���������� DEFINE THE CHART LAYOUT ���������������������
��11� CALL GDDM ('CHSET','CBOX') ! Enclose chart in frame
��12� INTEGER HATT ! Declare heading attribute
��13� DIM HATT(4) : MAT READ HATT ! Dimension, read array
��14� DATA 2,3,66,3��
��15� ! 2 = red, 3 = char mode, 66 = symbol set number, 3�� = size
��16� CALL GDDM ('CHHATT',4,HATT()) ! Set heading attributes
��17� CALL GDDM ('CHHEAD',15,'CLUB MEMBERSHIP')
��18� ! Write 15-character heading with 'character string'
��19� ! ������������������ Key ��������������������������������
��2�� INTEGER KATT ! Declare key attribute array
��21� DIM KATT(4) : MAT READ KATT ! Dimension, read array
��22� DATA 6,3,67,175
��23� ! 6 = yellow, 3 = char mode, 67 = symbol set number, 175 = size
��24� CALL GDDM ('CHKATT',4,KATT()) ! Set key attributes
��25� CALL GDDM ('CHKEY',3,7,'FEMALE MALE MARRIED')
��26� ! Write key, 3 elements, 7 characters of 'string'
��27� ! ������������� Draw chart ��������������������������������
��28� CALL GDDM ('CHVENN',75.�,1��.�,23.�) ! Draw chart using data
��29� ! ���������� Draw notes to show populations ���������������
��3�� CALL GDDM ('CHSET','BNOTE') ! Blank chart note areas
��31� INTEGER NATT ! Declare note attributes
��32� DIM NATT(2) : MAT READ NATT ! Dimension, read array
��33� DATA 7,2
��34� ! 7 = white, 2 = character mode
��35� CALL GDDM ('CHNATT',2,NATT()) ! Set note attributes
��36� CALL GDDM ('CHNOFF',26.�1,14.�1) ! Set note position
��37� CALL GDDM ('CHNOTE','C7',2,'75') ! Write note for group 1
��38� ! Write horizontal note, position C7, 2 characters of 'string'
��39� CALL GDDM ('CHNOFF',37.�,14.�1) ! Set note position
��4�� CALL GDDM ('CHNOTE','C7',2,'23') ! Write note for overlap
��41� CALL GDDM ('CHNOFF',5�.�1,14.�1) ! Set note position
��42� CALL GDDM ('CHNOTE','C7',3,'1��') ! Write note for group 2
��43� ! ��������������� Send to display �������������������������
��44� INTEGER ATTYPE,ATMOD,COUNT
��45� CALL GDDM ('ASREAD',ATTYPE,ATMOD,COUNT) ! Send to display
��46� ! ����������������� TERMINATE �����������������������������
��47� CALL GDDM ('FSTERM') ! Terminate graphics
��48� END ! End BASIC program
Chapter 4. Using Presentation Graphics 4-91
Drawing the Chart
More Control Routines“Control Operations” on page 4-13 discussed the control routines you use toinitialize and otherwise control the characteristics of the program and picture beforeany chart definition or chart construction routines were called.
The following chart control routines, called after the chart-drawing routine has beenspecified, let you either draw another chart or exit the program.
After the chart has been defined and constructed, you can:
1. Reset the processing state so that other state-1 attributes and options can beset.
When you reset the processing state, you can modify the chart or create a newchart of the same type quickly and efficiently within the same program.
2. Reinitialize Presentation Graphics and start over, without terminating thegraphics environment.
3. Terminate the Presentation Graphics portion of the program, and then send thepicture to a device (using the device control routines described in “DeviceControls” on page 3-65).
The following routines can be used to perform these three actions:
| Reset the Processing State CHSTRT – Reset the processing state. If CHSTRT is specified after achart-drawing routine, it resets the program to the point just prior to the most recentchart-drawing routine. All chart control and chart definition routines maintain theirvalues. This routine is useful for a program that draws a number of similar charts.
If CHSTRT is specified before a chart-drawing routine, it reinitializes the program byresetting all chart definition routines to their default values.
| Reinitialize Presentation Graphics CHRNIT – Reinitialize Presentation Graphics. CHRNIT reinitializes the programby resetting all chart definition routines to their default values. CHRNIT can beused if another chart will be shown on the same screen, in the area specified byCHAREA.
| Terminate Presentation Graphics CHTERM – Terminate Presentation Graphics. CHTERM terminates thePresentation Graphics environment and releases storage used by PresentationGraphics to construct the chart. You should issue the CHTERM routine as soon asyou know you are not going to call more Presentation Graphics routines. CHTERMcan be issued before the GDDM routine ASREAD sends the chart to the device fordisplay, or before other GDDM routines are used to define the picture in moredetail.
4-92 AS/400 GDDM Programming Guide
Drawing the Chart
Summary of This ChapterIn Chapter 2, “The Application Program Interface to Graphics” the program thatdrew the line chart introduced you to the basic idea of Presentation Graphics thatroutines are called from application programs written in high-level languages todraw a chart. When the chart is drawn, the program sends it to a display device.
Chapter 4, “Using Presentation Graphics” showed you the concepts and functionsof Presentation Graphics routines. Specifically, the topics presented in this chapterwere:
Understanding Presentation GraphicsThe first part of the chapter showed you the various types of chart you can drawwith Presentation Graphics routines. It also showed you some ways to use thecharts.
Drawing charts with Presentation Graphics routinesThe second part of the chapter showed the structure of Presentation Graphicsprograms, and the typical sequence of Presentation Graphics routines used in aprogram to draw a chart. Routines that define the chart were shown, as well as theroutines that perform the chart construction. Explained last were other PresentationGraphics routines that control the environment.
At this point you should experiment with Presentation Graphics routines in simpleprograms to gain a better understanding of them, and to get ideas for applicationprograms that use them. (Chapter 6, “Graphics Application Program Examples”offers more ideas for programs, and shows and explains some sample programs.)
Here are some points to remember:
1. FSINIT must be specified before any calls to GDDM or Presentation Graphicsroutines are performed by your program.
2. All of the chart definition routines can be allowed to default; however, the chartcan be difficult to understand without chart text (axis titles, labels, and a chartlegend).
3. Some chart definition routines can be used only in state-1 (before the chartdrawing routine is used).
4. Data types must be declared according to the high-level language being used.
| For more detailed information about each Presentation Graphics routine, refer to| the GDDM Programming Reference manual.
Chapter 4. Using Presentation Graphics 4-93
Drawing the Chart
4-94 AS/400 GDDM Programming Guide
Programming Considerations
Chapter 5. OS/400 Programming Considerations
In Chapter 3, “Using GDDM,” and Chapter 4, “Using Presentation Graphics,” youlearned of the variety of GDDM and Presentation Graphics routines that you canuse in application programs to construct graphics pictures and charts. Theconcepts and functions of GDDM and Presentation Graphics routines werediscussed, but few ideas about how GDDM and Presentation Graphics routineswork with the AS/400 System were discussed.
This chapter is about the AS/400 System and its interface to OS/400 Graphics.The topics are:
Files for graphics
Graphics symbol sets
Performance
Error recovery
User-defined data streams
AS/400 Files Used for GraphicsThree types of file can be used with graphics application programs:
1. Display device files, which can be used with graphics to provide more usableand attractive display formats for interactive applications.
2. Printer device files, which can be used to format output from a printer graphicsapplication program for printing on a work station printer capable of graphics.
| 3. Database files, which can be used to hold the hexadecimal data of a graphicsdata format (GDF) file for later interpretation by the AS/400 System or anothersystem.
Display FilesBy using only GDDM and Presentation Graphics routines in your program, you canwrite programs that produce pictures and charts. If you want a program thatcombines OS/400 Graphics with work station input/output operations, you must useDDS (data description specification) display device files with your graphics program.(Ideas for programs that prompt for information, and then perform actions based onthat information are given in Chapter 6, “Graphics Application Program Examples.”)
For an OS/400 Graphics application program to perform input/output operations, theprogram must first open a display device file to communicate with a display device.The program can then do input and output operations (usually coded as READ andWRITE operations in high-level language programs) to transfer data to and from thedevice. For OS/400 Graphics, the preferred display device is the IBM PC withWorkstation Function.
There are two types of display files that you can use for graphics applications onthe AS/400 System:
IBM-supplied: QDGDDM is an IBM-supplied display file in library QSYS whichis used when you call OS/400 Graphics routines for display or plotter devices.Usually, you are aware of this file only when other display files compete for theuse of the same display device, or when its name appears in error messages.
Copyright IBM Corp. 1991 5-1
Programming Considerations
Externally-described: You can describe your own display file with DDS andcreate it using the CRTDSPF (Create Display File) command. Anexternally-described display file that uses the ALWGPH DDS keyword allowsyou to display alphanumeric data and input fields at the same time graphics arebeing displayed. ALWGPH is described in “The ALWGPH DDS Keyword” onpage 5-3.
When your graphics application program sends a picture to the graphics workstation (with or without externally-described display files), or when a record isdisplayed that uses the ALWGPH keyword, the screen is set to graphics displaymode.
In graphics display mode:
1. The device is automatically placed in reduced line spacing mode, with lessspace between lines. In graphics display mode, the reduced line spacingcannot be overridden by the work station user.
2. The graphics display mode indicator, the blue uppercase G character, is shownat the bottom of the screen.
3. The graphics picture is shown as a background to any alphanumeric datashown by an externally-described display file.
QDGDDM Display File ConsiderationsGDDM uses the QDGDDM display file for communication with display devicescapable of showing graphics. These special considerations apply to the QDGDDMdisplay file:
QDGDDM is secured from overrides; GDDM graphics output cannot beredirected to other devices by use of override commands, such as theOVRDSPF (Override with Display File) command. If GDDM output is desiredon a specific device, you can specify a device identifier in the DSOPEN routine.The device must be made known to the system by using a CRTDEVDSP(Create Device Description (Display)) command.
If a file error occurs (perhaps due to a device failure), GDDM generates aseverity 40 (unrecoverable) error. The application program must recover thedevice by doing a DSCLS-DSOPEN sequence to close and reopen the file.
If a process has performed a DSOPEN to the device, but not a DSCLS torelease the device, an attempt by an alternative process (such as SystemRequest) to use a graphics-capable device will fail.
5-2 AS/400 GDDM Programming Guide
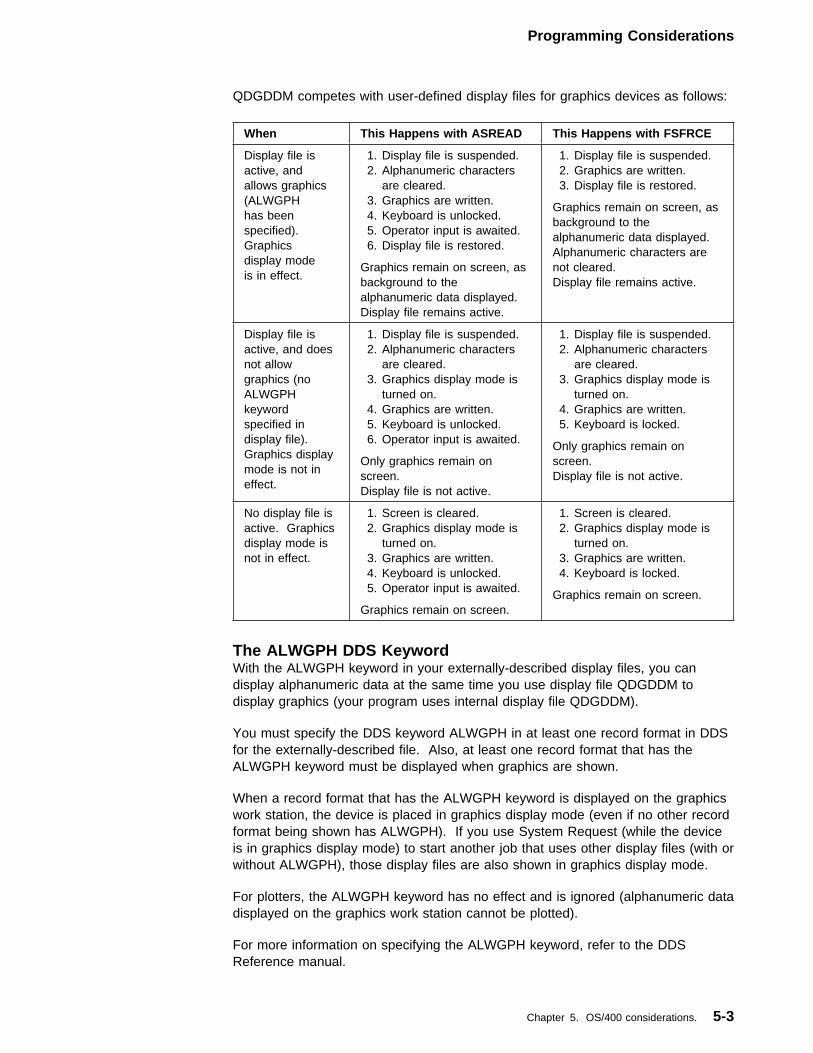
Programming Considerations
QDGDDM competes with user-defined display files for graphics devices as follows:
When This Happens with ASREAD This Happens with FSFRCE
Display file isactive, andallows graphics(ALWGPHhas beenspecified).Graphicsdisplay modeis in effect.
1. Display file is suspended. 2. Alphanumeric characters
are cleared.3. Graphics are written.4. Keyboard is unlocked.5. Operator input is awaited.6. Display file is restored.
Graphics remain on screen, asbackground to thealphanumeric data displayed.Display file remains active.
1. Display file is suspended.2. Graphics are written.3. Display file is restored.
Graphics remain on screen, asbackground to thealphanumeric data displayed.Alphanumeric characters arenot cleared.Display file remains active.
Display file isactive, and doesnot allowgraphics (noALWGPHkeywordspecified indisplay file).Graphics displaymode is not ineffect.
1. Display file is suspended. 2. Alphanumeric characters
are cleared.3. Graphics display mode is
turned on.4. Graphics are written.5. Keyboard is unlocked.6. Operator input is awaited.
Only graphics remain onscreen.Display file is not active.
1. Display file is suspended. 2. Alphanumeric characters
are cleared.3. Graphics display mode is
turned on.4. Graphics are written.5. Keyboard is locked.
Only graphics remain onscreen.Display file is not active.
No display file isactive. Graphicsdisplay mode isnot in effect.
1. Screen is cleared.2. Graphics display mode is
turned on.3. Graphics are written.4. Keyboard is unlocked.5. Operator input is awaited.
Graphics remain on screen.
1. Screen is cleared.2. Graphics display mode is
turned on.3. Graphics are written.4. Keyboard is locked.
Graphics remain on screen.
The ALWGPH DDS KeywordWith the ALWGPH keyword in your externally-described display files, you candisplay alphanumeric data at the same time you use display file QDGDDM todisplay graphics (your program uses internal display file QDGDDM).
You must specify the DDS keyword ALWGPH in at least one record format in DDSfor the externally-described file. Also, at least one record format that has theALWGPH keyword must be displayed when graphics are shown.
When a record format that has the ALWGPH keyword is displayed on the graphicswork station, the device is placed in graphics display mode (even if no other recordformat being shown has ALWGPH). If you use System Request (while the deviceis in graphics display mode) to start another job that uses other display files (with orwithout ALWGPH), those display files are also shown in graphics display mode.
For plotters, the ALWGPH keyword has no effect and is ignored (alphanumeric datadisplayed on the graphics work station cannot be plotted).
For more information on specifying the ALWGPH keyword, refer to the DDSReference manual.
Chapter 5. OS/400 considerations. 5-3
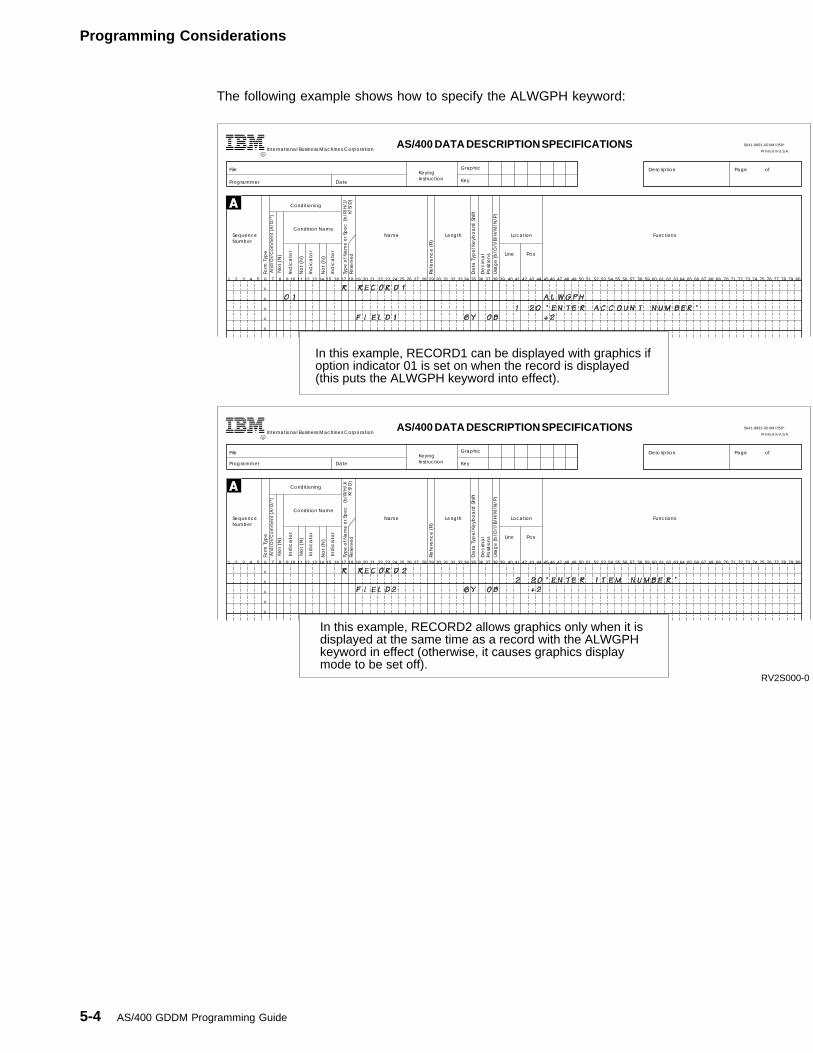
Programming Considerations
The following example shows how to specify the ALWGPH keyword:
File
File
KeyingInstruction
KeyingInstruction
Programmer
Programmer
Date
Date
Graphic
Graphic
Key
Key
Description
Description
Page of
Page of
International Business Machines Corporation
International Business Machines Corporation
Printed in U.S.A.
Printed in U.S.A.
AS/400 DATA DESCRIPTION SPECIFICATIONS
AS/400 DATA DESCRIPTION SPECIFICATIONS
And
/Or/
Com
me
nt (
A/O
/*)
And
/Or/
Com
me
nt (
A/O
/*)
No
t (N
)N
ot
(N)
Ind
ica
tor
Ind
ica
tor
Ind
ica
tor
Ind
ica
tor
Ind
ica
tor
Ind
ica
tor
No
t (N
)N
ot
(N)
No
t (N
)N
ot
(N)
Rese
rve
dRe
serv
ed
Typ
e o
f Na
me
or S
pe
cTy
pe
of N
am
e o
r Sp
ec
(b/R
/H/J
/K/
S/D
)(b
/R/H
/J/
K/S/
D)
Re
fere
nc
e (
R)
Re
fere
nc
e (
R)
Usa
ge
(b
/O/I
/B/H
/M/N
/P)
Usa
ge
(b
/O/I
/B/H
/M/N
/P)
SequenceNumber
SequenceNumber
Name
Name
Length
Length
Location
Location
Line
Line
Pos
Pos
Functions
Functions
Form
Typ
eFo
rm T
ype
Conditioning
Conditioning
Condition Name
Condition Name
Da
ta T
ype
/Ke
ybo
ard
Sh
iftD
ata
Typ
e/K
eyb
oa
rd S
hift
De
cim
al
Po
sitio
ns
De
cim
al
Po
sitio
ns
SX41-9891-00 UM/050*
SX41-9891-00 UM/050*
R
R
A
A
A
A
A
A
A
A
A
A
1 2 3 4 5 6 7 8 9
1 2 3 4 5 6 7 8 9
10 11 12 13 14 15
10 11 12 13 14 15
16 17 18 19 20 21
16 17 18 19 20 21
22 23 24 25 26 27
22 23 24 25 26 27
28 29 30 31 32 33
28 29 30 31 32 33
34 35 36 37 38 39
34 35 36 37 38 39
40 41 42 43 44 45
40 41 42 43 44 45
46 47 48 49 50 51
46 47 48 49 50 51
52 53 54 55 56 57
52 53 54 55 56 57
58 59 60 61 62 63
58 59 60 61 62 63
64 65 66 67 68 69
64 65 66 67 68 69
70 71 72 73 74 75 76 77 78 79 80
70 71 72 73 74 75 76 77 78 79 80
In this example, RECORD1 can be displayed with graphics if option indicator 01 is set on when the record is displayed(this puts the ALWGPH keyword into effect).
In this example, RECORD2 allows graphics only when it isdisplayed at the same time as a record with the ALWGPHkeyword in effect (otherwise, it causes graphics displaymode to be set off).
RV2S000-0
5-4 AS/400 GDDM Programming Guide
Programming Considerations
Printer FilesGDDM uses printer files to communicate with work station printers capable ofgraphics.
The device-token parameter of the DSOPEN routine identifies the program toGDDM as being one that is to produce printer output. When a DSOPEN routinehas a printer device token, GDDM opens the default printer file QPGDDM.QSYS/QPGDDM is the default printer file, but you can create your own printer file(with characteristics similar to QPGDDM) and use it by passing its name to GDDMvia the name-list parameter of the DSOPEN routine. For more information on usingDSOPEN to open printer files, see Appendix A, “Devices Compatible with theAS/400 System.”
QPGDDM Printer File ConsiderationsGDDM uses the QPGDDM printer file for communication with work station printerscapable of graphics. When shipped, QPGDDM is defined as follows:
CRTPRTF FILE(QSYS/QPGDDM) +
DEVTYPE(�SCS) +
PAGESIZE(99 132) +
LPI(9) +
CPI(1�) +
OVRFLW(9�) +
RPLUNPRT(�NO) +
CHRID(1�1 �37) +
SPOOL(�YES) +
OUTQ(�JOB) +
FILESEP(�) +
SCHEDULE(�FILEEND) +
LVLCHK(�NO) +
SHARE(�NO) +
TEXT('System printer file for printer graphics')
| The size of the graphics page (where graphics are allowed to be displayed on the| printer form) is determined by the PAGESIZE value for form width and the| OVRFLW value in the printer file. QPGDDM specifies a PAGESIZE width of 132| characters (10 cpi) and an OVRFLW value of 90 lines (9 lpi). This means the| default graphics page is 13.2 inches wide and 10 inches long.
| The graphics page is positioned by its upper left corner being placed at the upper| left corner of the printer form and its lower left corner being at the left edge of the| OVRFLW line. If the user specifies a width and overflow covering the entire page,| then the graphics page covers the entire form. The graphics field by default covers| the entire graphics page.
| The default coordinate range that is mapped on top of the graphics field is 0| through 100 in both the x and y directions. The origin (0,0) is in the lower left| corner of the graphics field.
| For example, if you specified a width of 130 characters (10 cpi) and an overflow| value of 54 lines (9 lpi), then the graphics field would be 6 inches high by 13 inches| wide, starting in the upper left corner of the printer form. If you did not call GSWIN| in your application, then the coordinate range of this graphics field would be 0| through 100 in the x direction (horizontal) and 0 through 100 in the y direction| (vertical), with the origin being in the lower left corner of the graphics field.
Chapter 5. OS/400 considerations. 5-5
Programming Considerations
You can override any of the attributes of QPGDDM. The effect of overridingattributes for graphics using QPGDDM and user-defined print files is shown in thistable:
PAGESIZEOVRFLWLPICPI
When the PAGESIZE value for form width and the OVERFLW value are changed, graphicshierarchy default values (such as the default values for page size and graphic field size) are alsochanged.
For example, a printer file that specifies a width of 50 columns and an OVRFLW of 25 linescauses a default graphics page of 25 rows by 50 columns. The default graphics field assumesthe same dimensions, and the aspect ratio also changes.
The lines-per-inch (LPI) value can be overridden, but has little effect other than to cause adifferent default page or field size. Any LPI value you use is converted to 9 LPI becausegraphics must be printed at 9 LPI. The default page or field size results from the conversion; ifyou use a printer file that has values of 6 LPI and OVRFLW 36, the page would eject after 6inches of printing. When the conversion to 9 LPI is made, the OVRFLW value is converted toreflect the number of lines that can be printed on 6 inches (at 9 LPI, 54 lines can be printed on 6inches). With a printer file in use or an override that uses the above values, a query of thedefault page or field will result in the converted values. The converted values are used only forthe default page or field. If you define a page or field size less than the converted values, yourvalues are used instead.
You may want to specify your print file as 6 LPI instead of 9 LPI. For example, if you haveforms which are 8.5 inches long, you cannot describe your form with 9 LPI (correct form sizewould be 76.5), but with 6 LPI you can by specifying a form size of 51 lines.
The characters-per-inch (CPI) value for graphics printer files must be 10 or 15. The defaultcharacter density is 10 CPI.
| For IPDS page printers, you probably want to change the PAGESIZE value for width and the| OVRFLW value to match the size of the page you are printing on. For example, if you are using| 8.5 inch by 11 inch paper, you may want to specify 83 for the width on the PAGESIZE value.| This produces output that is 8.3 inches wide when the CPI value is 10. If the page is rotated 90| degrees, you may want to specify 110 for the width on the PAGESIZE value and 72 for the| OVRFLW value. This produces output that is 11 inches wide (10 CPI) and 8 inches long (9 LPI).
| PAGRTT| This parameter applies to the IPDS page printers. It specifies the degree of rotation of the| output on the page with respect to the way the form is loaded into the printer.
| The default orientation of the page for IPDS page printers is vertical, as opposed to the| landscape orientation of the plotters and SCS printers. A rotation value of 90 degrees produces| a landscape orientation for your output, which is the same as for plotters and SCS printers.
SPOOLDEVTYPEOUTQALIGN
The SPOOL parameter works in conjunction with the DEVTYPE parameter. If you specifySPOOL(*NO) to send the file directly to the printer, DEVTYPE must specify the printer devicename. SPOOL(*YES) causes the file to be spooled to the output queue named in the OUTQparameter. ALIGN causes a forms alignment reply message to be send for SPOOL(*NO) files.
Graphics printer files are generally incompatible with devices that do not match the device tokenused to produce the file. However, a printer file that is produced using the 522X device tokencan be printed on a 4234 printer, but not the converse.
An SCS-type device token has precedence over the DEVTYPE (*IPDS) parameter. An IPDSdevice token has precedence over the DEVTYPE (*SCS) parameter.
MAXRCDSSCHEDULECOPIESFORMTYPEFILESEPHOLDSAVE
These parameters apply only if SPOOL(*YES) is specified. The parameters work in the samemanner for graphics printer files as they do for other printer files.
5-6 AS/400 GDDM Programming Guide
Programming Considerations
PRTQLTY This parameter applies to the 3812, 4214, and 4224 printers. It specifies the print quality for texton applications that merge text from non-graphics print files with graphics ones.
FORMFEEDDRAWER
These parameters apply only to the IBM 4214 Printer, which can use cut sheets.
CHRID This parameter applies only to the 3812 and 4224 printers. It specifies the character set to beused when using the default image symbol set.
SHARE This parameter applies only to application programs that merge text from non-graphics print fileswith graphics printer files (SHARE(*YES)), and the open for the non-graphics print file mustoccur after the graphics printer file has been opened via the DSOPEN routine. For more detailedinformation, see “Merging Text and Graphics for Print Files” on page A-9.
| Database Files| Database files on the AS/400 System can be used either to store data used as
input by the graphics application program or to hold the graphics data format (GDF)file that is created by the program.
| For examples of programs that receive input from database files, see Chapter 6,“Graphics Application Program Examples.” For more information on GDF files, see“Using Graphics Data Format Files” on page 3-68.
OS/400 Graphics Symbol SetsOS/400 Graphics uses graphics symbol sets (GSS) for text in GDDM andPresentation Graphics application programs. Each character in a graphics symbolset is a formatted group of EBCDIC code points.
Two types of graphics symbol sets are available:
Image symbols (mode-2 characters), where each character is built with a set ofPELs
Vector symbols (mode-3 characters), where each character is built with a set ofstraight and curved lines
Image symbols are the default for GDDM, and vector symbols are the default forPresentation Graphics. For GDDM, however, you must explicitly set the charactermode to 2 (with GSCM) before any of the attribute routines can have an effect.
Multinational character sets (the default for both image and vector symbols)| containing the IBM multinational characters are shown in the Programming| Reference Summary manual.
Characters from the multinational sets can be coded in hexadecimal from agraphics work station keyboard by first pressing the CMD key, then the accent keybetween the CMD key and the 1 key on the top row, and then entering thehexadecimal code. For example, the hexadecimal code for “A” is X'C1'.
Note: The characters in the multinational set might differ from the characters usedin your country; if you need specific characters, use the appropriate nationallanguage symbol set for your country.
For IPDS Printers, the character set used by the default image symbol set (mode-2characters) is determined by the CHRID parameter at the print file being used. For
Chapter 5. OS/400 considerations. 5-7
Programming Considerations
more information, see the CHRID parameter on the CRTPRTF command in the CLReference manual.
5-8 AS/400 GDDM Programming Guide
Programming Considerations
For IBM-supplied image and vector symbol sets (found in library QGDDM), theprefix characters for symbol sets are as follows:
ADMM____ Multinational standard characters (the default vector symbols,and the default for Presentation Graphics on the graphics workstation and for both GDDM and Presentation Graphics on theplotters)
ADMD____ Standard characters for each national language (vector symbols)
The following naming convention applies to vector symbol sets that have thespecific font styles of Standard Simple, Standard Bold, Open Block, Filled Block,and Roman Principal:
ADMVM___ Multinational standard characters of a specific font style,mono-spaced
ADMWM___ Multinational standard characters of a specific font style,proportionally-spaced
National Language versions of these symbol sets are available. For moreinformation, contact your IBM representative.
Vector symbol sets contain the following characters:
ABCDEFGHIJKLMNOPQRSTUVWXYZ �123456789
abcdefghijklmnopqrstuvwxyz $&�()-+=!:;',.?/
The prefix characters for vector symbol sets are:
ADMU____ Specialty charactersADMUV___ Specialty characters, mono-spacedADMUW___ Specialty characters, proportionally-spaced
Most vector symbol sets come in two versions: mono-spaced andproportionally-spaced.
Mono-spaced characters in a character string use the same-sized character box (an“I” is as wide as an “M”), while proportionally-spaced characters take only as muchspace as the character itself.
More information on the uses and characteristics of both types of graphics symbolsis available in “How to Draw Graphics Symbols” on page 3-25.
Image Symbol SetsThis table shows the image symbol sets (ISS, or mode-2 characters) available.They are all multinational standard characters and defaults for GDDM.
Note: The IPDS printers do not use a default image symbol set. When mode-2characters are specified or defaulted, the printer hardware characters areused. The printer hardware character set used is determined by the CHRIDparameter of the print file being used.
ISS name Object text (description)ADMMISSG For the 4214 PrinterADMMISSI For the 5224/5 Printers, and the 4234 Printer at 10 cpiADMMISSP For the 4234 Printer at 15 cpi
Chapter 5. OS/400 considerations. 5-9
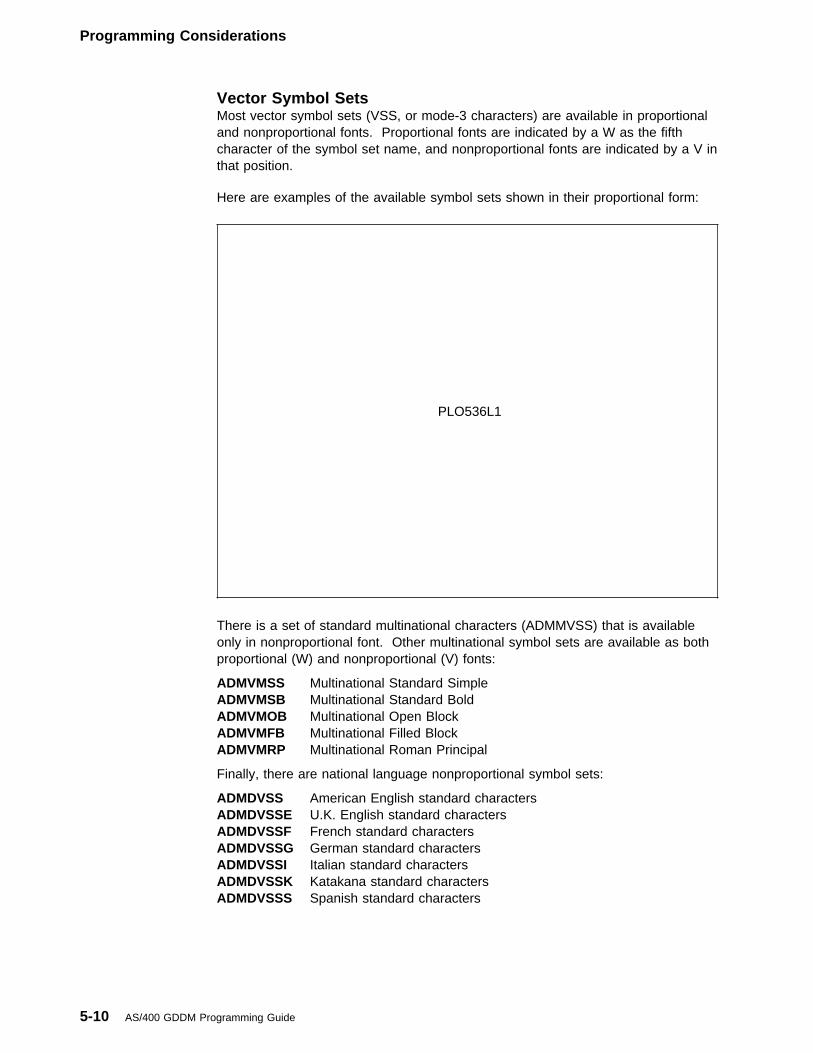
Programming Considerations
Vector Symbol SetsMost vector symbol sets (VSS, or mode-3 characters) are available in proportionaland nonproportional fonts. Proportional fonts are indicated by a W as the fifthcharacter of the symbol set name, and nonproportional fonts are indicated by a V inthat position.
Here are examples of the available symbol sets shown in their proportional form:
PLO536L1
There is a set of standard multinational characters (ADMMVSS) that is availableonly in nonproportional font. Other multinational symbol sets are available as bothproportional (W) and nonproportional (V) fonts:
ADMVMSS Multinational Standard SimpleADMVMSB Multinational Standard BoldADMVMOB Multinational Open BlockADMVMFB Multinational Filled BlockADMVMRP Multinational Roman Principal
Finally, there are national language nonproportional symbol sets:
ADMDVSS American English standard charactersADMDVSSE U.K. English standard charactersADMDVSSF French standard charactersADMDVSSG German standard charactersADMDVSSI Italian standard charactersADMDVSSK Katakana standard charactersADMDVSSS Spanish standard characters
5-10 AS/400 GDDM Programming Guide
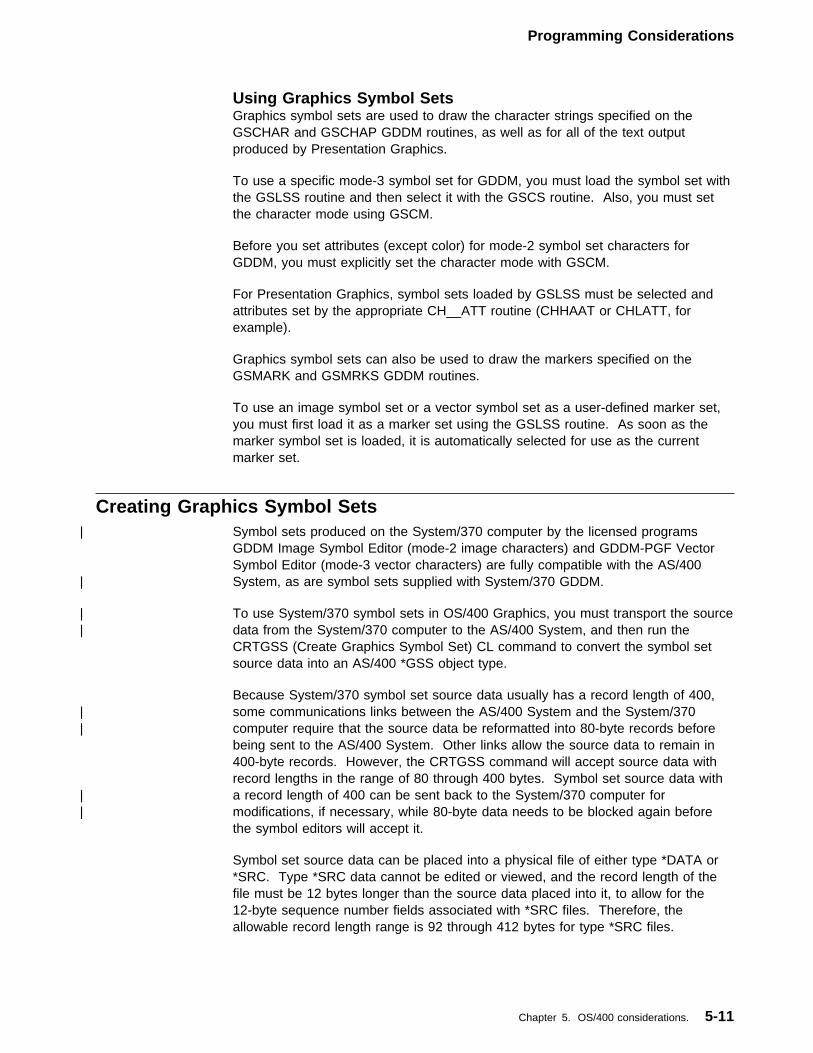
Programming Considerations
Using Graphics Symbol SetsGraphics symbol sets are used to draw the character strings specified on theGSCHAR and GSCHAP GDDM routines, as well as for all of the text outputproduced by Presentation Graphics.
To use a specific mode-3 symbol set for GDDM, you must load the symbol set withthe GSLSS routine and then select it with the GSCS routine. Also, you must setthe character mode using GSCM.
Before you set attributes (except color) for mode-2 symbol set characters forGDDM, you must explicitly set the character mode with GSCM.
For Presentation Graphics, symbol sets loaded by GSLSS must be selected andattributes set by the appropriate CH__ATT routine (CHHAAT or CHLATT, forexample).
Graphics symbol sets can also be used to draw the markers specified on theGSMARK and GSMRKS GDDM routines.
To use an image symbol set or a vector symbol set as a user-defined marker set,you must first load it as a marker set using the GSLSS routine. As soon as themarker symbol set is loaded, it is automatically selected for use as the currentmarker set.
Creating Graphics Symbol Sets| Symbol sets produced on the System/370 computer by the licensed programs
GDDM Image Symbol Editor (mode-2 image characters) and GDDM-PGF VectorSymbol Editor (mode-3 vector characters) are fully compatible with the AS/400
| System, as are symbol sets supplied with System/370 GDDM.
| To use System/370 symbol sets in OS/400 Graphics, you must transport the source| data from the System/370 computer to the AS/400 System, and then run the
CRTGSS (Create Graphics Symbol Set) CL command to convert the symbol setsource data into an AS/400 *GSS object type.
Because System/370 symbol set source data usually has a record length of 400,| some communications links between the AS/400 System and the System/370| computer require that the source data be reformatted into 80-byte records before
being sent to the AS/400 System. Other links allow the source data to remain in400-byte records. However, the CRTGSS command will accept source data withrecord lengths in the range of 80 through 400 bytes. Symbol set source data with
| a record length of 400 can be sent back to the System/370 computer for| modifications, if necessary, while 80-byte data needs to be blocked again before
the symbol editors will accept it.
Symbol set source data can be placed into a physical file of either type *DATA or*SRC. Type *SRC data cannot be edited or viewed, and the record length of thefile must be 12 bytes longer than the source data placed into it, to allow for the12-byte sequence number fields associated with *SRC files. Therefore, theallowable record length range is 92 through 412 bytes for type *SRC files.
Chapter 5. OS/400 considerations. 5-11
Programming Considerations
| Once the symbol set source data is contained as a member in an AS/400 database| file, it can be used to create a symbol set object (object type *GSS) in the CRTGSS
command.
| The database file source is provided by the System/370 GDDM-PGF Vector| Symbol Editor in the following format (the format of the Image Symbol Editor| database file is the same):
Length fields.Each must belarger than theprevious fieldby two.
charboxsize
1st char definition 2nd chardefinitionbegins
Type:01 - vector06 - image
3 offsets to definitionsfor 3 characters
First codepoint in set
Last codepoint in set
All records contain this 20-byte header.
3rd char definitionRV2S001-0
Graphics Symbol Set (*GSS) ObjectsOn the AS/400 System, graphics symbol sets are stored in the graphics symbol setobject. The GSS object is an AS/400 object with an external symbolic type of*GSS.
Graphics Symbol Set CL Commands: You can use CL commands to tailorusage of the graphics symbol set objects to your own installation. Graphics symbolsets are supplied by IBM.
To manage graphics symbol sets use the CL object-management commands:
CRTGSS Create Graphics Symbol SetDLTGSS Delete Graphics Symbol SetRNMOBJ Rename ObjectMOVOBJ Move ObjectCRTDUPOBJ Create Duplicate ObjectSAVOBJ Save ObjectSAVCHGOBJ Save Changed ObjectRSTOBJ Restore ObjectGRTOBJAUT Grant Object AuthorityRVKOBJAUT Revoke Object AuthorityDSPOBJAUT Display Object AuthorityCHGOBJOWN Change Object Ownership
5-12 AS/400 GDDM Programming Guide
Programming Considerations
DMPSYSOBJ Dump System ObjectDMPOBJ Dump ObjectWRKOBJLCK Work with Object Locks
Chapter 5. OS/400 considerations. 5-13
Programming Considerations
These CL object management commands cannot be used for graphics symbol sets:
ALCOBJ Allocate Object (lock)DLCOBJ Deallocate Object (unlock).
You can issue the DSPOBJD command to see which symbol sets are available onyour system.
For a complete description of any of these CL commands, refer to the CLReference manual.
Performance ConsiderationsSome of your graphics applications programs could be programs that produce asimple picture or chart, others could be performing complex input/output operationsand showing various pictures, while others draw highly-detailed charts.
If your program will be a complex one that other users execute, you should try toensure that the processing time needed to construct each picture is acceptable.The more complex the picture, the more time is needed by the system to constructit.
Here are some ways to improve the performance of OS/400 Graphics applicationprograms if response time is important:
� Avoid the use of curved lines in the pictures or charts.
The system draws curves with many small, straight lines, whose end pointsmust be defined (just like you define the end points of lines with GDDM). Acircle with a diameter of 2.54 centimeters (one inch) is made up of more than40 short lines.
If curved lines are required on a chart, use a smaller number for the degree ofsmoothness for the CHFINE routine. Higher degrees of smoothness (largernumbers) might not be noticeable but will substantially increase the timeneeded to process the chart.
Line or surface charts that use line curving, and Venn diagrams and pie chartsthat use circles are more complex for the system to construct than other typesof chart.
� Use image symbols or the default vector symbol set ADMMVSS for graphicscharacters until the chart is in its final form, or use the default hardwarecharacters. (The characters put on the screen by a display file are the fastest,most efficient way to show text.) Like arcs, each character is drawn with smalllines. Complex fonts (such as Triplex) can multiply the number of lines thesystem must draw by factors of 10 through 100, depending on the number ofcharacters your program uses.
� Use outlines instead of area-fills and shading patterns (these are also definedby the system with individual lines) for previewing pictures; later, you can addthe patterns when the chart is in its final form.
Sparse shading patterns are faster to draw than dense ones, especially on theplotter.
� Use a solid area-fill instead of a GDDM pattern for areas. When the area-fillpattern is solid, an area is enclosed by a maximum of 128 lines with boundarylines drawn, no two lines crossing, and no GSMOVE routines are used withinthe area, the graphics work station performs the area-fill, rather than the
5-14 AS/400 GDDM Programming Guide
Programming Considerations
AS/400 System. (The AS/400 system must process the end points of each linein a pattern.)
Chapter 5. OS/400 considerations. 5-15
Programming Considerations
� When your graphics program uses DDS display files, use FSFRCE to send thegraphics output to the screen first, then use the display file information. Thisreduces the number of screen saves and restores.
� Use the Presentation Graphics routine CHTERM in the program as soon as youknow that no more Presentation Graphics routines will be called. CHTERMreleases the internal storage used by the program to process and construct thechart.
� When many continuous lines have to be drawn, GSPLNE is faster than severalGSLINE calls.
� Structure a program that draws many pictures or charts such that you define allthe pages before you select and display them at the end of the program. Whilethis technique does not reduce processing time, it gives the illusion ofincreased performance by enabling you to display in quick succession a largenumber of pages whose processing time has already occurred (the pages areheld in an internal form after they have been processed; they can be quicklyselected and displayed).
� If your GDDM or Presentation Graphics program only draws a picture andshows it, (the picture does not have to be changed often), consider using theGDDM GDF routines to capture the processed graphic data format file. Youcan then display or plot the picture without having to execute the drawingroutines each time.
Error RecoveryWhen GDDM detects an error in an application program, it sends a diagnosticmessage describing the error to the program message queue of the applicationprogram and creates an error record that contains the error message data.
Error-Handling ConsiderationsYou can use the GDDM routine FSEXIT to specify an error-handling program thatyour GDDM or Presentation Graphics application program will call when an error isencountered.
If the error severity equals or exceeds the threshold specified in the FSEXITroutine, your error-handling program is invoked and the error record is passed to it.If FSEXIT is not specified and the severity of the error exceeds 40, or if FSEXIT isspecified with only a severity threshold (and not the name of an error-handlingprogram) whose value is equaled or exceeded by the error, the IBM-supplieddefault error message CPF8619 is issued.
If a threshold level of zero is specified, the error-handling program is invoked aftereach call to a GDDM routine, whether or not an error has occurred. In such cases,each error record contains only information about the most recent GDDM routinecalled.
A default error-handling program is set up on initialization, with a default thresholdof 40 (unrecoverable error). This default error-handling program sends a CPF8619escape message to the application program, and the application program isterminated (unless you are using the MONMSG (Monitor Message) command toperform other actions when the message is encountered).
5-16 AS/400 GDDM Programming Guide
Programming Considerations
If FSEXIT specifies the name of an error-handling program (in addition to thedefault), the program can be reset by the following statements:
CALL GDDM ('FSEXIT','�NONE',SEV) ! SEV = severity
or
CALL GDDM ('FSEXIT','�SAME',SEV) ! SEV = severity
An error-handling program specified by FSEXIT is called by GDDM exactly as if ithad been invoked instead of the GDDM routine that produced the error. Theapplication program can use the error-handling program to call other GDDMroutines, which are valid and current when control is returned to the originalprogram (the one with the error).
If a file error occurs (perhaps due to a device failure), GDDM generates a severity40 (unrecoverable) error. The application program must recover the device byusing DSCLS followed by DSOPEN to close and reopen the file. The errormessage will show what you need to do.
The error record created by GDDM for the most recent error whose severity isnonzero can be returned to the application program by a call to FSQERR. Thestructure of the error record returned is identical to that passed to an error-handlingprogram specified by FSEXIT. The error record is set to blanks in character fieldsand zeros in numeric fields before each call to FSQERR.
Error MessagesMessage Identifiers: OS/400 Graphics diagnostic messages have a prefix of“CPG.” All CPG messages are diagnostic messages; they further define an errorcondition or provide explanatory information.
OS/400 Graphics escape messages are CPF8600-series messages. If themessage is unmonitored, termination occurs.
| Further information regarding graphics and OS/400 messages is available through| message help text.
Error Record Structure: The GDDM error record is similar to a record resultingfrom a RCVMSG (Receive Message) command.
The format of the error record is:
1. Severity. A number shows the AS/400 message severity:
00 No error10 Warning20 Error (GDDM or Presentation Graphics routine is ignored)30 Severe error (unpredictable results may occur)40 Unrecoverable error.
2. Message identifier. The 7-character message identifier (CPGnnnn), wherennnn is the message number.
3. Routine name. Eight characters that contain the name of the GDDM routinethat caused the error.
For FSQERR, this field contains blanks if no error has occurred since the lastcall to FSQERR, or if there have been no errors since FSINIT.
Chapter 5. OS/400 considerations. 5-17
Programming Considerations
4. Message text length. A 5-digit decimal number containing the length of thefirst-level message text, excluding trailing blanks. The maximum text length is132.
5-18 AS/400 GDDM Programming Guide
Programming Considerations
5. Message text. A character field containing the first-level text of the errormessage associated with the error. 132 bytes are reserved in the error recordstructure for the message text, regardless of the length specified for the text.
6. RCP (request control parameter) code. A 4-byte binary integer with the RCPcode of the GDDM routine. For FSQERR, the number is zero if no error hasoccurred since the last call to FSQERR or if there have been no errors sinceFSINIT.
7. Message reference key. The 4-character AS/400 message reference key ofthe message. This key is needed if the error-handling program receives thediagnostic message for any reason (with the RCVMSG (Receive Message) CLcommand).
8. Message type code. A 2-character field containing the AS/400 message typecode for the message. This field usually contains 02 to indicate a diagnosticmessage. (The discussion for the RTNTYPE parameter of the RCVMSGcommand in the CL Reference manual shows other codes.)
9. Message data length. A 5-digit decimal number containing the length of themessage data, if any. The minimum length is 12 (to accommodate themessage variables listed below); the maximum length is 400.
10. Message data. The message data contains the substitution values (in a singlecharacter string) that were used in the text of the message. The amount ofdata returned and its format depend on the message.
All CPG-prefix messages have a format common to the first message variable, asfollows:
1. Routine name. Eight characters that contain the name of the GDDM routinethat caused the error. If the error exit threshold is zero or less, the routinename is that of the GDDM routine called. For FSQERR, the field containsblanks if no error has occurred since the last call to FSQERR or if there havebeen no errors since FSINIT.
2. Statement number. A 10-byte character string that identifies the statement inthe program that caused the error.
3. The remainder of the message replacement variables.
User-Defined Data StreamsYou can use a UDDS (user-defined data stream) with a user-defined keyword(USRDFN) to access the graphics work station and its attached devices for yourapplications, but it is not recommended.
If UDDS is used, the application program must be aware of the unusual nature ofthe graphics work station data stream and its pacing protocol for graphics. (Pacingis a method of communication between the graphics work station and the AS/400System; pacing for the graphics work station differs from SNA pacing.)
Chapter 5. OS/400 considerations. 5-19
Programming Considerations
You should be aware of these points before you use a UDDS:
� The graphics data stream must be sent in graphics blocks that must exceed 11bytes but be less than or equal to 1920 bytes in length. More than onegraphics block may be required to display a complete picture.
� Graphics blocks cannot contain normal alphanumeric data. All normalalphanumeric operations must be transmitted separately, and normal devicerules apply to them.
� The graphics data stream is encoded such that all characters are in the rangeX'40' through X'FF'.
� All graphics input/output must be done as PUTGET operations to handle pacingfor the display device, or pacing must be suppressed. The pacing schemeworks as follows:
1. The system sends a graphics block to the display device. The graphicsblock is recognized by the presence of X'FF' character immediatelyfollowing the first WTD (write-to-display) order in the data stream. Thiscauses the device to set graphics mode on and place the keyboard ingraphics lock state, which is identified by a special blue input inhibitedindicator on the screen. During graphics lock state, no keys can bepressed (including System Request) except for the special display devicelocal keys.
2. The display device processes the graphics block. Any block receivedduring processing is interpreted as a normal alphanumeric block.
3. When the display device finishes processing the graphics block (which maytake some time, and can be minutes if the printer or plotter is being used),it sends back an aid key (F1 through F24) to indicate that it is ready formore work and that another graphics block may be sent down. Thespecific aid key indicates whether the processing completed normally or anerror occurred.
4. The system must wait for this aid key to be sent back before sending anymore data to the display device.
5. At the end of the last graphics block, the system must send an endgraphics mode graphics order to signal to the display device to leavegraphics mode. Otherwise, the keyboard will remain in graphics lock state.The only option you have is to use of one of the local keys on the displaydevice to terminate graphics mode manually.
� If an event causes an interrupt (such as a break message or a system request)while the display device is in graphics mode (the application is in the process oftransmitting one or more graphics blocks to the device), the application couldbe suspended, with an input operation that cannot be completed. This occurswhen the normal graphics work station pacing response to a graphics block(the special aid key) is discarded by the work station controller becausealphanumeric input/output is attempted while the display station is processinggraphics. For more information on user-defined data streams, refer to the IBM5250 Information Display Systems Functions Reference Manual.
5-20 AS/400 GDDM Programming Guide
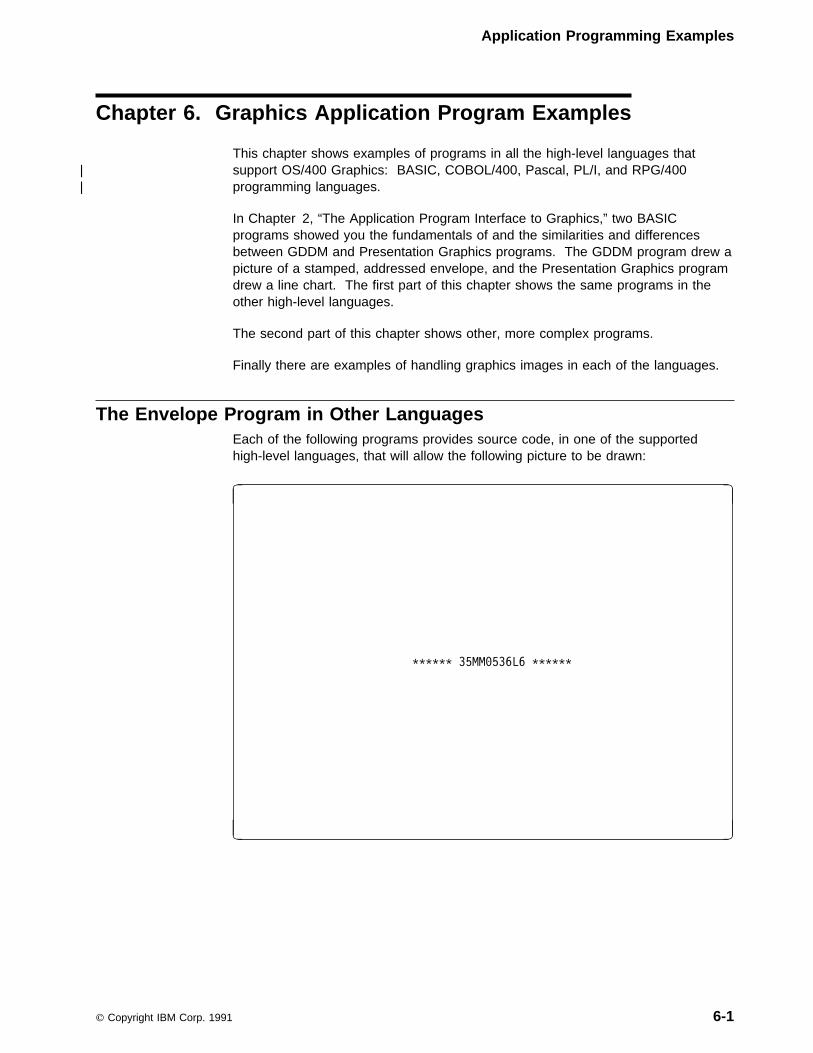
Application Programming Examples
Chapter 6. Graphics Application Program Examples
This chapter shows examples of programs in all the high-level languages that| support OS/400 Graphics: BASIC, COBOL/400, Pascal, PL/I, and RPG/400| programming languages.
In Chapter 2, “The Application Program Interface to Graphics,” two BASICprograms showed you the fundamentals of and the similarities and differencesbetween GDDM and Presentation Graphics programs. The GDDM program drew apicture of a stamped, addressed envelope, and the Presentation Graphics programdrew a line chart. The first part of this chapter shows the same programs in theother high-level languages.
The second part of this chapter shows other, more complex programs.
Finally there are examples of handling graphics images in each of the languages.
The Envelope Program in Other LanguagesEach of the following programs provides source code, in one of the supportedhigh-level languages, that will allow the following picture to be drawn:
�
������ 35MM�536L6 ������
� �
Copyright IBM Corp. 1991 6-1
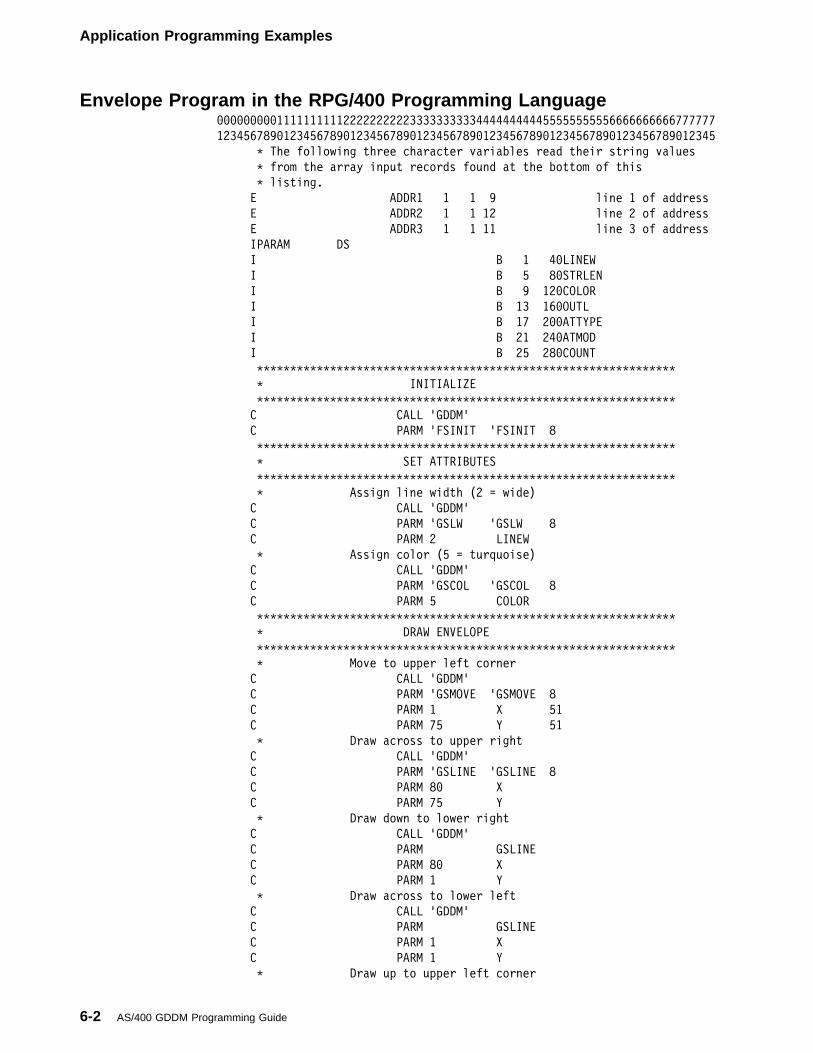
Application Programming Examples
Envelope Program in the RPG/400 Programming Language���������111111111122222222223333333333444444444455555555556666666666777777
123456789�123456789�123456789�123456789�123456789�123456789�123456789�12345
� The following three character variables read their string values
� from the array input records found at the bottom of this
� listing.
E ADDR1 1 1 9 line 1 of address
E ADDR2 1 1 12 line 2 of address
E ADDR3 1 1 11 line 3 of address
IPARAM DS
I B 1 4�LINEW
I B 5 8�STRLEN
I B 9 12�COLOR
I B 13 16�OUTL
I B 17 2��ATTYPE
I B 21 24�ATMOD
I B 25 28�COUNT
���������������������������������������������������������������
� INITIALIZE
���������������������������������������������������������������
C CALL 'GDDM'
C PARM 'FSINIT 'FSINIT 8
���������������������������������������������������������������
� SET ATTRIBUTES
���������������������������������������������������������������
� Assign line width (2 = wide)
C CALL 'GDDM'
C PARM 'GSLW 'GSLW 8
C PARM 2 LINEW
� Assign color (5 = turquoise)
C CALL 'GDDM'
C PARM 'GSCOL 'GSCOL 8
C PARM 5 COLOR
���������������������������������������������������������������
� DRAW ENVELOPE
���������������������������������������������������������������
� Move to upper left corner
C CALL 'GDDM'
C PARM 'GSMOVE 'GSMOVE 8
C PARM 1 X 51
C PARM 75 Y 51
� Draw across to upper right
C CALL 'GDDM'
C PARM 'GSLINE 'GSLINE 8
C PARM 8� X
C PARM 75 Y
� Draw down to lower right
C CALL 'GDDM'
C PARM GSLINE
C PARM 8� X
C PARM 1 Y
� Draw across to lower left
C CALL 'GDDM'
C PARM GSLINE
C PARM 1 X
C PARM 1 Y
� Draw up to upper left corner
6-2 AS/400 GDDM Programming Guide
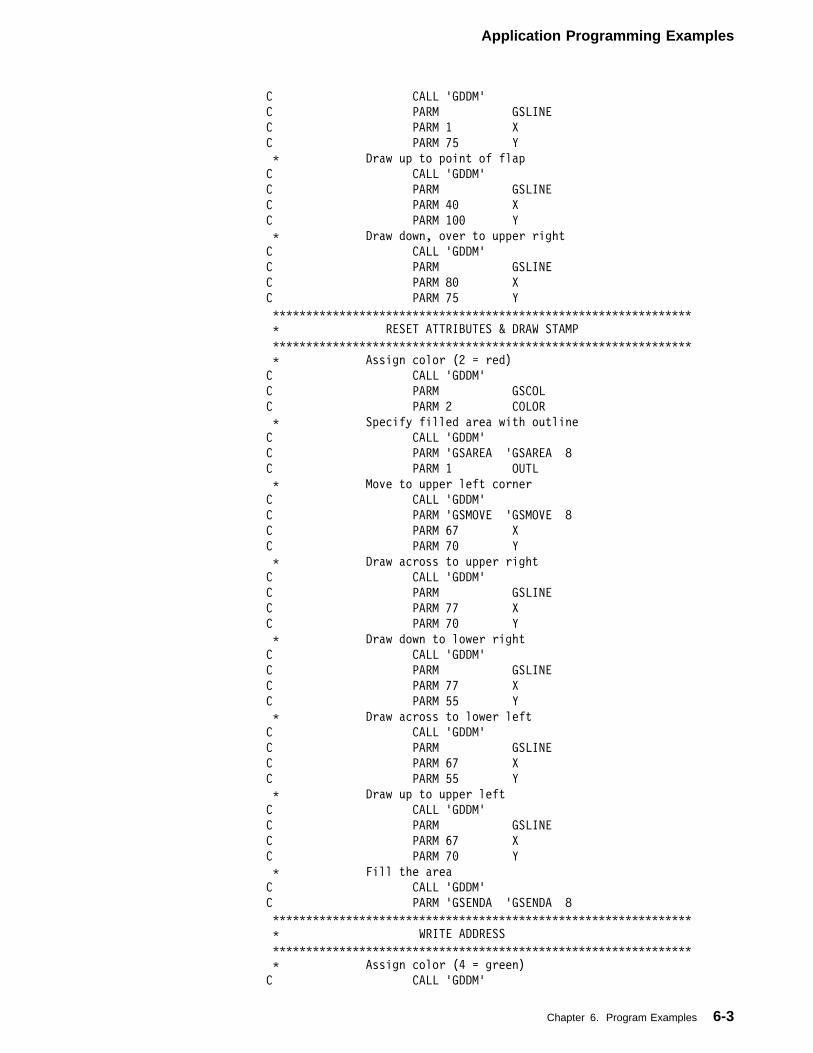
Application Programming Examples
C CALL 'GDDM'
C PARM GSLINE
C PARM 1 X
C PARM 75 Y
� Draw up to point of flap
C CALL 'GDDM'
C PARM GSLINE
C PARM 4� X
C PARM 1�� Y
� Draw down, over to upper right
C CALL 'GDDM'
C PARM GSLINE
C PARM 8� X
C PARM 75 Y
���������������������������������������������������������������
� RESET ATTRIBUTES & DRAW STAMP
���������������������������������������������������������������
� Assign color (2 = red)
C CALL 'GDDM'
C PARM GSCOL
C PARM 2 COLOR
� Specify filled area with outline
C CALL 'GDDM'
C PARM 'GSAREA 'GSAREA 8
C PARM 1 OUTL
� Move to upper left corner
C CALL 'GDDM'
C PARM 'GSMOVE 'GSMOVE 8
C PARM 67 X
C PARM 7� Y
� Draw across to upper right
C CALL 'GDDM'
C PARM GSLINE
C PARM 77 X
C PARM 7� Y
� Draw down to lower right
C CALL 'GDDM'
C PARM GSLINE
C PARM 77 X
C PARM 55 Y
� Draw across to lower left
C CALL 'GDDM'
C PARM GSLINE
C PARM 67 X
C PARM 55 Y
� Draw up to upper left
C CALL 'GDDM'
C PARM GSLINE
C PARM 67 X
C PARM 7� Y
� Fill the area
C CALL 'GDDM'
C PARM 'GSENDA 'GSENDA 8
���������������������������������������������������������������
� WRITE ADDRESS
���������������������������������������������������������������
� Assign color (4 = green)
C CALL 'GDDM'
Chapter 6. Program Examples 6-3
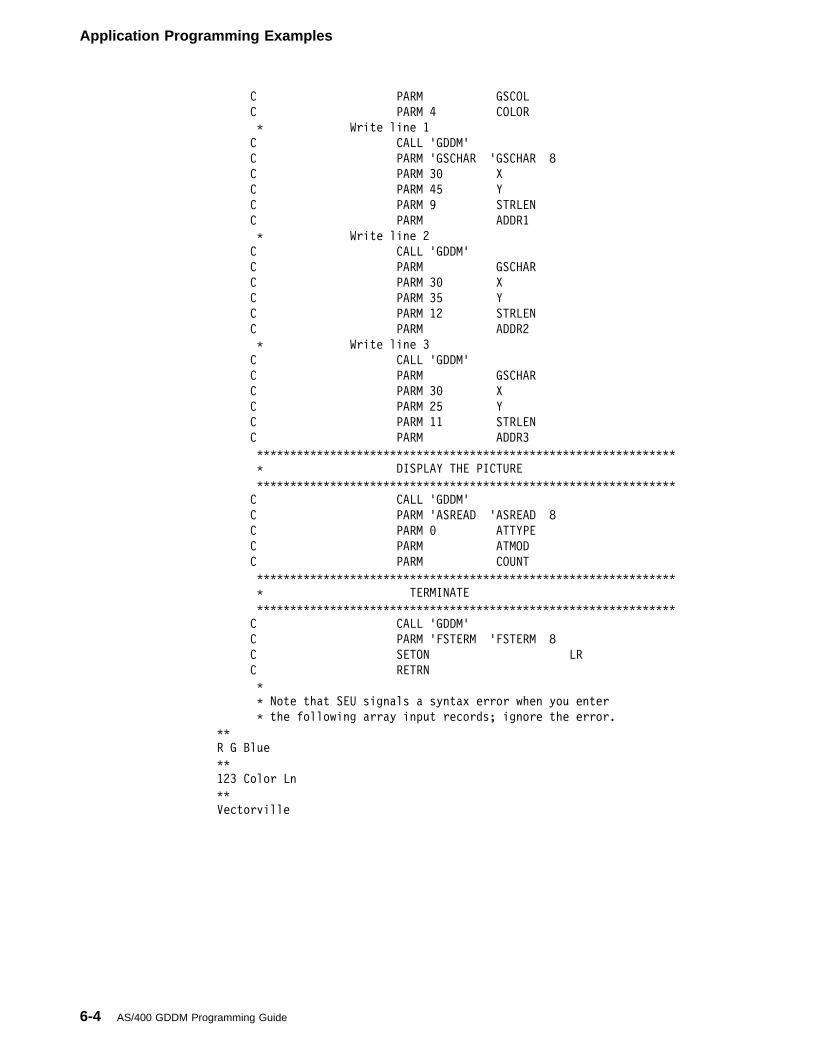
Application Programming Examples
C PARM GSCOL
C PARM 4 COLOR
� Write line 1
C CALL 'GDDM'
C PARM 'GSCHAR 'GSCHAR 8
C PARM 3� X
C PARM 45 Y
C PARM 9 STRLEN
C PARM ADDR1
� Write line 2
C CALL 'GDDM'
C PARM GSCHAR
C PARM 3� X
C PARM 35 Y
C PARM 12 STRLEN
C PARM ADDR2
� Write line 3
C CALL 'GDDM'
C PARM GSCHAR
C PARM 3� X
C PARM 25 Y
C PARM 11 STRLEN
C PARM ADDR3
���������������������������������������������������������������
� DISPLAY THE PICTURE
���������������������������������������������������������������
C CALL 'GDDM'
C PARM 'ASREAD 'ASREAD 8
C PARM � ATTYPE
C PARM ATMOD
C PARM COUNT
���������������������������������������������������������������
� TERMINATE
���������������������������������������������������������������
C CALL 'GDDM'
C PARM 'FSTERM 'FSTERM 8
C SETON LR
C RETRN
�
� Note that SEU signals a syntax error when you enter
� the following array input records; ignore the error.
��
R G Blue
��
123 Color Ln
��
Vectorville
6-4 AS/400 GDDM Programming Guide
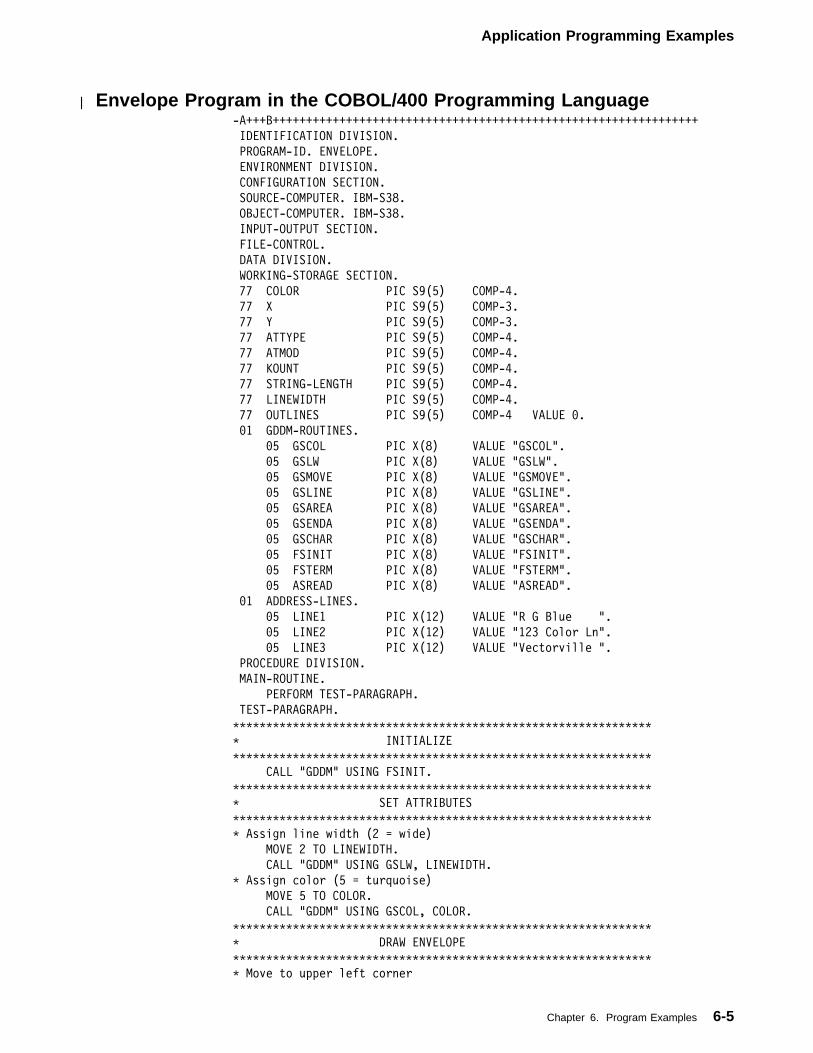
Application Programming Examples
| Envelope Program in the COBOL/400 Programming Language-A+++B++++++++++++++++++++++++++++++++++++++++++++++++++++++++++++++++
IDENTIFICATION DIVISION.
PROGRAM-ID. ENVELOPE.
ENVIRONMENT DIVISION.
CONFIGURATION SECTION.
SOURCE-COMPUTER. IBM-S38.
OBJECT-COMPUTER. IBM-S38.
INPUT-OUTPUT SECTION.
FILE-CONTROL.
DATA DIVISION.
WORKING-STORAGE SECTION.
77 COLOR PIC S9(5) COMP-4.
77 X PIC S9(5) COMP-3.
77 Y PIC S9(5) COMP-3.
77 ATTYPE PIC S9(5) COMP-4.
77 ATMOD PIC S9(5) COMP-4.
77 KOUNT PIC S9(5) COMP-4.
77 STRING-LENGTH PIC S9(5) COMP-4.
77 LINEWIDTH PIC S9(5) COMP-4.
77 OUTLINES PIC S9(5) COMP-4 VALUE �.
�1 GDDM-ROUTINES.
�5 GSCOL PIC X(8) VALUE "GSCOL".
�5 GSLW PIC X(8) VALUE "GSLW".
�5 GSMOVE PIC X(8) VALUE "GSMOVE".
�5 GSLINE PIC X(8) VALUE "GSLINE".
�5 GSAREA PIC X(8) VALUE "GSAREA".
�5 GSENDA PIC X(8) VALUE "GSENDA".
�5 GSCHAR PIC X(8) VALUE "GSCHAR".
�5 FSINIT PIC X(8) VALUE "FSINIT".
�5 FSTERM PIC X(8) VALUE "FSTERM".
�5 ASREAD PIC X(8) VALUE "ASREAD".
�1 ADDRESS-LINES.
�5 LINE1 PIC X(12) VALUE "R G Blue ".
�5 LINE2 PIC X(12) VALUE "123 Color Ln".
�5 LINE3 PIC X(12) VALUE "Vectorville ".
PROCEDURE DIVISION.
MAIN-ROUTINE.
PERFORM TEST-PARAGRAPH.
TEST-PARAGRAPH.
���������������������������������������������������������������
� INITIALIZE
���������������������������������������������������������������
CALL "GDDM" USING FSINIT.
���������������������������������������������������������������
� SET ATTRIBUTES
���������������������������������������������������������������
� Assign line width (2 = wide)
MOVE 2 TO LINEWIDTH.
CALL "GDDM" USING GSLW, LINEWIDTH.
� Assign color (5 = turquoise)
MOVE 5 TO COLOR.
CALL "GDDM" USING GSCOL, COLOR.
���������������������������������������������������������������
� DRAW ENVELOPE
���������������������������������������������������������������
� Move to upper left corner
Chapter 6. Program Examples 6-5
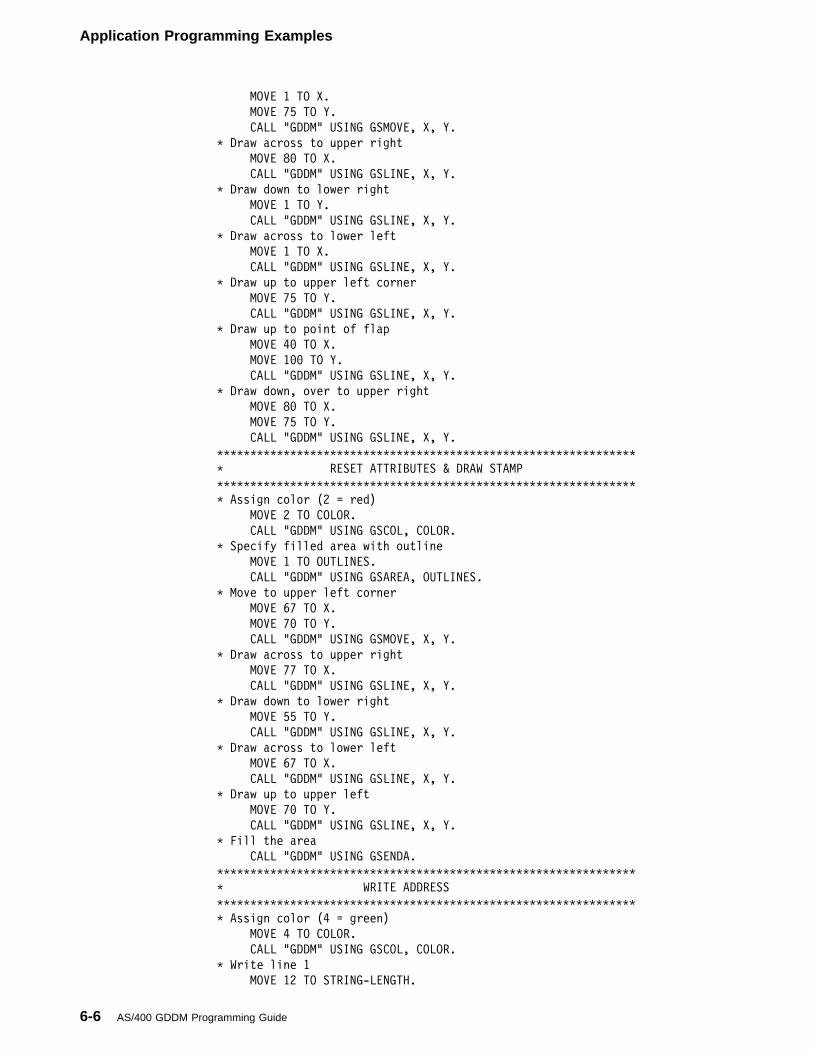
Application Programming Examples
MOVE 1 TO X.
MOVE 75 TO Y.
CALL "GDDM" USING GSMOVE, X, Y.
� Draw across to upper right
MOVE 8� TO X.
CALL "GDDM" USING GSLINE, X, Y.
� Draw down to lower right
MOVE 1 TO Y.
CALL "GDDM" USING GSLINE, X, Y.
� Draw across to lower left
MOVE 1 TO X.
CALL "GDDM" USING GSLINE, X, Y.
� Draw up to upper left corner
MOVE 75 TO Y.
CALL "GDDM" USING GSLINE, X, Y.
� Draw up to point of flap
MOVE 4� TO X.
MOVE 1�� TO Y.
CALL "GDDM" USING GSLINE, X, Y.
� Draw down, over to upper right
MOVE 8� TO X.
MOVE 75 TO Y.
CALL "GDDM" USING GSLINE, X, Y.
���������������������������������������������������������������
� RESET ATTRIBUTES & DRAW STAMP
���������������������������������������������������������������
� Assign color (2 = red)
MOVE 2 TO COLOR.
CALL "GDDM" USING GSCOL, COLOR.
� Specify filled area with outline
MOVE 1 TO OUTLINES.
CALL "GDDM" USING GSAREA, OUTLINES.
� Move to upper left corner
MOVE 67 TO X.
MOVE 7� TO Y.
CALL "GDDM" USING GSMOVE, X, Y.
� Draw across to upper right
MOVE 77 TO X.
CALL "GDDM" USING GSLINE, X, Y.
� Draw down to lower right
MOVE 55 TO Y.
CALL "GDDM" USING GSLINE, X, Y.
� Draw across to lower left
MOVE 67 TO X.
CALL "GDDM" USING GSLINE, X, Y.
� Draw up to upper left
MOVE 7� TO Y.
CALL "GDDM" USING GSLINE, X, Y.
� Fill the area
CALL "GDDM" USING GSENDA.
���������������������������������������������������������������
� WRITE ADDRESS
���������������������������������������������������������������
� Assign color (4 = green)
MOVE 4 TO COLOR.
CALL "GDDM" USING GSCOL, COLOR.
� Write line 1
MOVE 12 TO STRING-LENGTH.
6-6 AS/400 GDDM Programming Guide
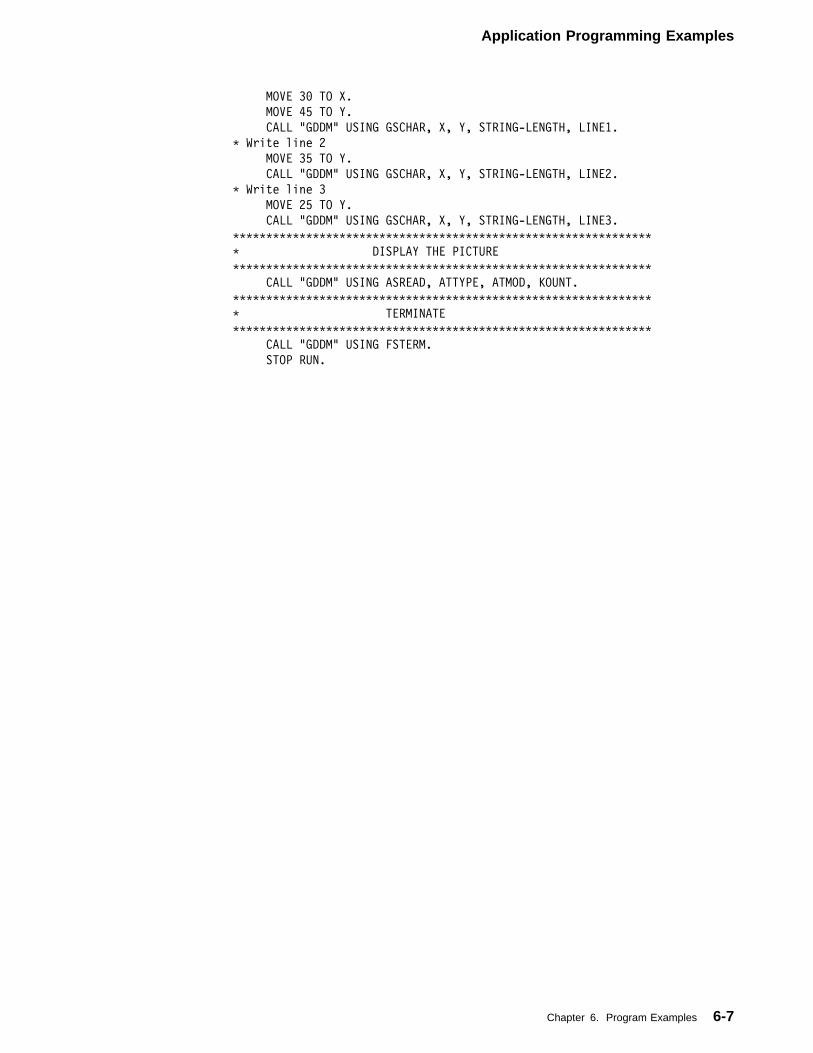
Application Programming Examples
MOVE 3� TO X.
MOVE 45 TO Y.
CALL "GDDM" USING GSCHAR, X, Y, STRING-LENGTH, LINE1.
� Write line 2
MOVE 35 TO Y.
CALL "GDDM" USING GSCHAR, X, Y, STRING-LENGTH, LINE2.
� Write line 3
MOVE 25 TO Y.
CALL "GDDM" USING GSCHAR, X, Y, STRING-LENGTH, LINE3.
���������������������������������������������������������������
� DISPLAY THE PICTURE
���������������������������������������������������������������
CALL "GDDM" USING ASREAD, ATTYPE, ATMOD, KOUNT.
���������������������������������������������������������������
� TERMINATE
���������������������������������������������������������������
CALL "GDDM" USING FSTERM.
STOP RUN.
Chapter 6. Program Examples 6-7
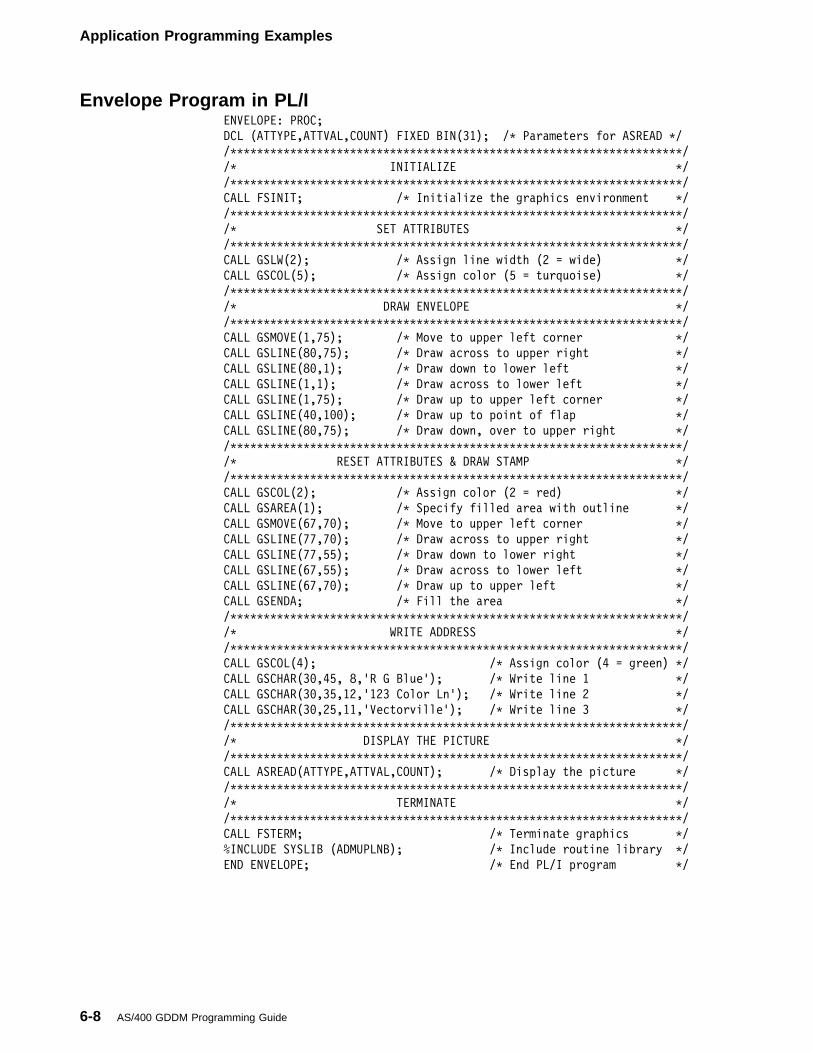
Application Programming Examples
Envelope Program in PL/I ENVELOPE: PROC;
DCL (ATTYPE,ATTVAL,COUNT) FIXED BIN(31); /� Parameters for ASREAD �/
/��������������������������������������������������������������������/
/� INITIALIZE �/
/��������������������������������������������������������������������/
CALL FSINIT; /� Initialize the graphics environment �/
/��������������������������������������������������������������������/
/� SET ATTRIBUTES �/
/��������������������������������������������������������������������/
CALL GSLW(2); /� Assign line width (2 = wide) �/
CALL GSCOL(5); /� Assign color (5 = turquoise) �/
/��������������������������������������������������������������������/
/� DRAW ENVELOPE �/
/��������������������������������������������������������������������/
CALL GSMOVE(1,75); /� Move to upper left corner �/
CALL GSLINE(8�,75); /� Draw across to upper right �/
CALL GSLINE(8�,1); /� Draw down to lower left �/
CALL GSLINE(1,1); /� Draw across to lower left �/
CALL GSLINE(1,75); /� Draw up to upper left corner �/
CALL GSLINE(4�,1��); /� Draw up to point of flap �/
CALL GSLINE(8�,75); /� Draw down, over to upper right �/
/��������������������������������������������������������������������/
/� RESET ATTRIBUTES & DRAW STAMP �/
/��������������������������������������������������������������������/
CALL GSCOL(2); /� Assign color (2 = red) �/
CALL GSAREA(1); /� Specify filled area with outline �/
CALL GSMOVE(67,7�); /� Move to upper left corner �/
CALL GSLINE(77,7�); /� Draw across to upper right �/
CALL GSLINE(77,55); /� Draw down to lower right �/
CALL GSLINE(67,55); /� Draw across to lower left �/
CALL GSLINE(67,7�); /� Draw up to upper left �/
CALL GSENDA; /� Fill the area �/
/��������������������������������������������������������������������/
/� WRITE ADDRESS �/
/��������������������������������������������������������������������/
CALL GSCOL(4); /� Assign color (4 = green) �/
CALL GSCHAR(3�,45, 8,'R G Blue'); /� Write line 1 �/
CALL GSCHAR(3�,35,12,'123 Color Ln'); /� Write line 2 �/
CALL GSCHAR(3�,25,11,'Vectorville'); /� Write line 3 �/
/��������������������������������������������������������������������/
/� DISPLAY THE PICTURE �/
/��������������������������������������������������������������������/
CALL ASREAD(ATTYPE,ATTVAL,COUNT); /� Display the picture �/
/��������������������������������������������������������������������/
/� TERMINATE �/
/��������������������������������������������������������������������/
CALL FSTERM; /� Terminate graphics �/
%INCLUDE SYSLIB (ADMUPLNB); /� Include routine library �/
END ENVELOPE; /� End PL/I program �/
6-8 AS/400 GDDM Programming Guide
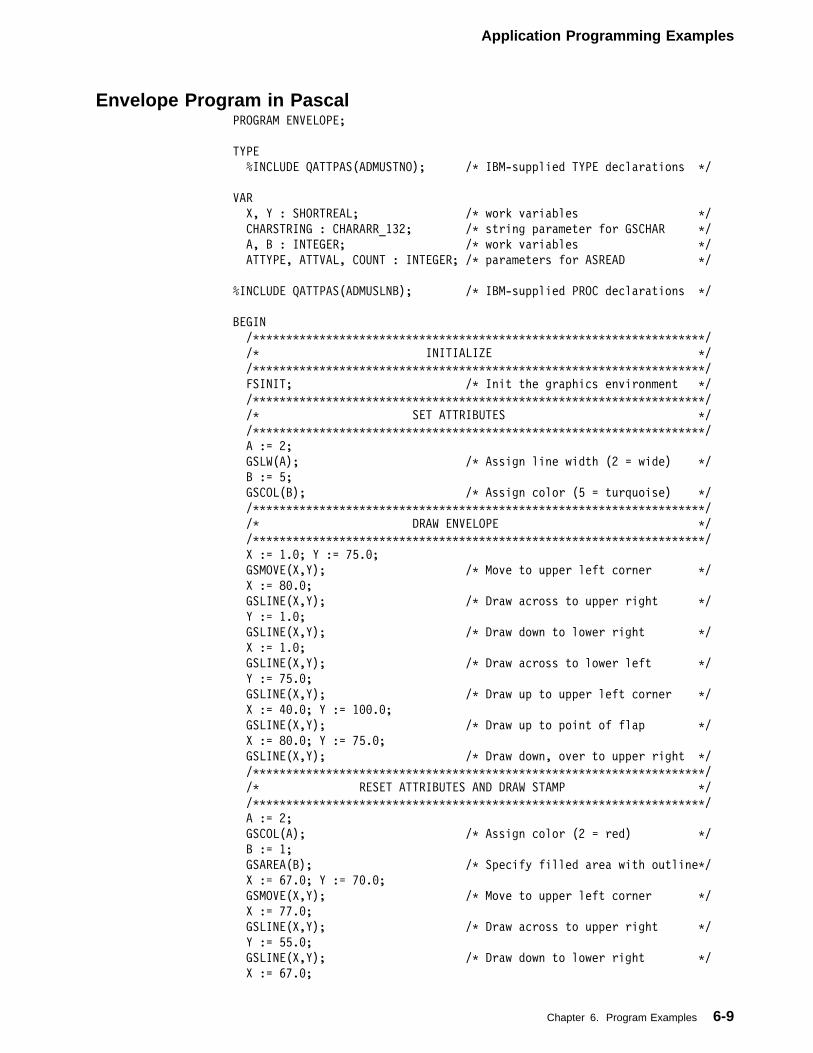
Application Programming Examples
Envelope Program in PascalPROGRAM ENVELOPE;
TYPE
%INCLUDE QATTPAS(ADMUSTNO); /� IBM-supplied TYPE declarations �/
VAR
X, Y : SHORTREAL; /� work variables �/
CHARSTRING : CHARARR_132; /� string parameter for GSCHAR �/
A, B : INTEGER; /� work variables �/
ATTYPE, ATTVAL, COUNT : INTEGER; /� parameters for ASREAD �/
%INCLUDE QATTPAS(ADMUSLNB); /� IBM-supplied PROC declarations �/
BEGIN
/��������������������������������������������������������������������/
/� INITIALIZE �/
/��������������������������������������������������������������������/
FSINIT; /� Init the graphics environment �/
/��������������������������������������������������������������������/
/� SET ATTRIBUTES �/
/��������������������������������������������������������������������/
A := 2;
GSLW(A); /� Assign line width (2 = wide) �/
B := 5;
GSCOL(B); /� Assign color (5 = turquoise) �/
/��������������������������������������������������������������������/
/� DRAW ENVELOPE �/
/��������������������������������������������������������������������/
X := 1.�; Y := 75.�;
GSMOVE(X,Y); /� Move to upper left corner �/
X := 8�.�;
GSLINE(X,Y); /� Draw across to upper right �/
Y := 1.�;
GSLINE(X,Y); /� Draw down to lower right �/
X := 1.�;
GSLINE(X,Y); /� Draw across to lower left �/
Y := 75.�;
GSLINE(X,Y); /� Draw up to upper left corner �/
X := 4�.�; Y := 1��.�;
GSLINE(X,Y); /� Draw up to point of flap �/
X := 8�.�; Y := 75.�;
GSLINE(X,Y); /� Draw down, over to upper right �/
/��������������������������������������������������������������������/
/� RESET ATTRIBUTES AND DRAW STAMP �/
/��������������������������������������������������������������������/
A := 2;
GSCOL(A); /� Assign color (2 = red) �/
B := 1;
GSAREA(B); /� Specify filled area with outline�/
X := 67.�; Y := 7�.�;
GSMOVE(X,Y); /� Move to upper left corner �/
X := 77.�;
GSLINE(X,Y); /� Draw across to upper right �/
Y := 55.�;
GSLINE(X,Y); /� Draw down to lower right �/
X := 67.�;
Chapter 6. Program Examples 6-9
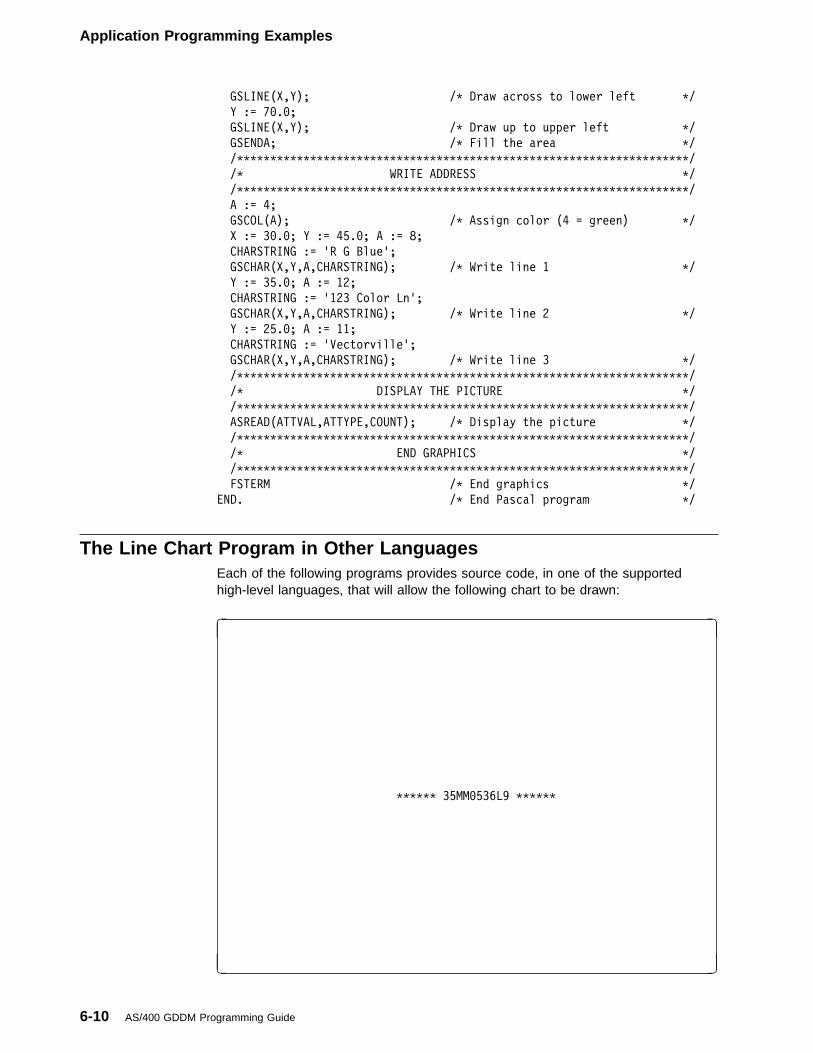
Application Programming Examples
GSLINE(X,Y); /� Draw across to lower left �/
Y := 7�.�;
GSLINE(X,Y); /� Draw up to upper left �/
GSENDA; /� Fill the area �/
/��������������������������������������������������������������������/
/� WRITE ADDRESS �/
/��������������������������������������������������������������������/
A := 4;
GSCOL(A); /� Assign color (4 = green) �/
X := 3�.�; Y := 45.�; A := 8;
CHARSTRING := 'R G Blue';
GSCHAR(X,Y,A,CHARSTRING); /� Write line 1 �/
Y := 35.�; A := 12;
CHARSTRING := '123 Color Ln';
GSCHAR(X,Y,A,CHARSTRING); /� Write line 2 �/
Y := 25.�; A := 11;
CHARSTRING := 'Vectorville';
GSCHAR(X,Y,A,CHARSTRING); /� Write line 3 �/
/��������������������������������������������������������������������/
/� DISPLAY THE PICTURE �/
/��������������������������������������������������������������������/
ASREAD(ATTVAL,ATTYPE,COUNT); /� Display the picture �/
/��������������������������������������������������������������������/
/� END GRAPHICS �/
/��������������������������������������������������������������������/
FSTERM /� End graphics �/
END. /� End Pascal program �/
The Line Chart Program in Other LanguagesEach of the following programs provides source code, in one of the supportedhigh-level languages, that will allow the following chart to be drawn:
�
������ 35MM�536L9 ������
� �
6-10 AS/400 GDDM Programming Guide
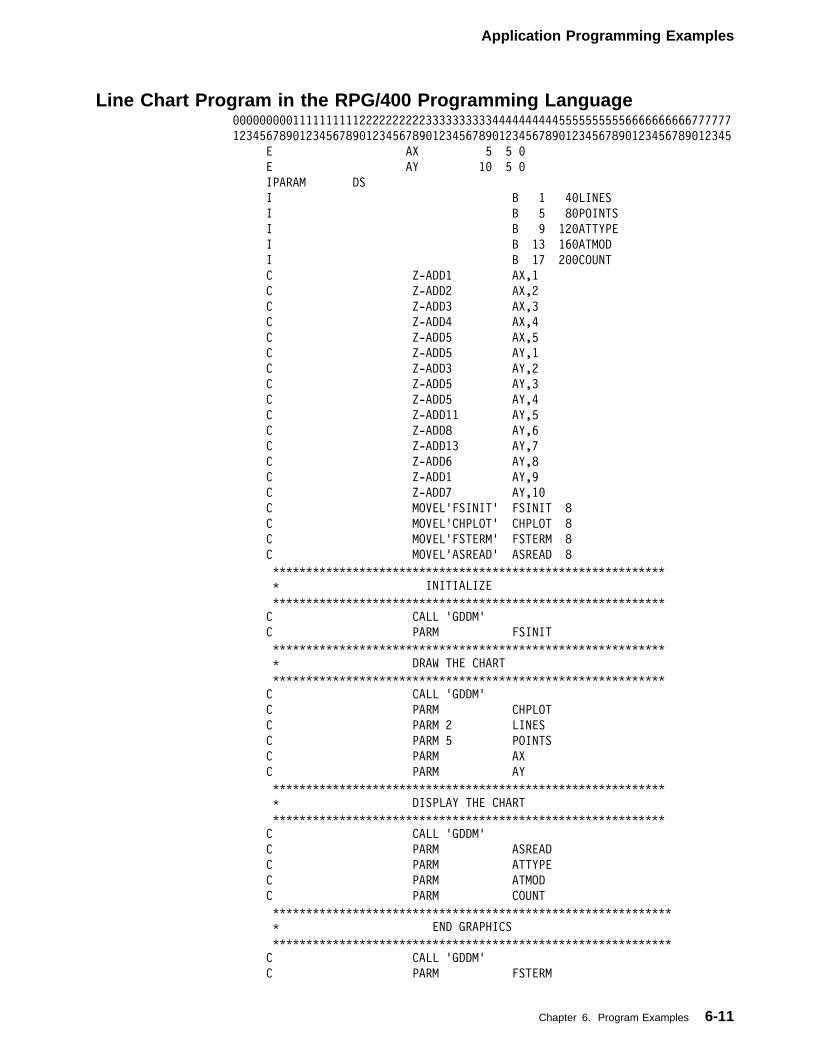
Application Programming Examples
Line Chart Program in the RPG/400 Programming Language���������111111111122222222223333333333444444444455555555556666666666777777
123456789�123456789�123456789�123456789�123456789�123456789�123456789�12345
E AX 5 5 �
E AY 1� 5 �
IPARAM DS
I B 1 4�LINES
I B 5 8�POINTS
I B 9 12�ATTYPE
I B 13 16�ATMOD
I B 17 2��COUNT
C Z-ADD1 AX,1
C Z-ADD2 AX,2
C Z-ADD3 AX,3
C Z-ADD4 AX,4
C Z-ADD5 AX,5
C Z-ADD5 AY,1
C Z-ADD3 AY,2
C Z-ADD5 AY,3
C Z-ADD5 AY,4
C Z-ADD11 AY,5
C Z-ADD8 AY,6
C Z-ADD13 AY,7
C Z-ADD6 AY,8
C Z-ADD1 AY,9
C Z-ADD7 AY,1�
C MOVEL'FSINIT' FSINIT 8
C MOVEL'CHPLOT' CHPLOT 8
C MOVEL'FSTERM' FSTERM 8
C MOVEL'ASREAD' ASREAD 8
�����������������������������������������������������������
� INITIALIZE
�����������������������������������������������������������
C CALL 'GDDM'
C PARM FSINIT
�����������������������������������������������������������
� DRAW THE CHART
�����������������������������������������������������������
C CALL 'GDDM'
C PARM CHPLOT
C PARM 2 LINES
C PARM 5 POINTS
C PARM AX
C PARM AY
�����������������������������������������������������������
� DISPLAY THE CHART
�����������������������������������������������������������
C CALL 'GDDM'
C PARM ASREAD
C PARM ATTYPE
C PARM ATMOD
C PARM COUNT
������������������������������������������������������������
� END GRAPHICS
������������������������������������������������������������
C CALL 'GDDM'
C PARM FSTERM
Chapter 6. Program Examples 6-11
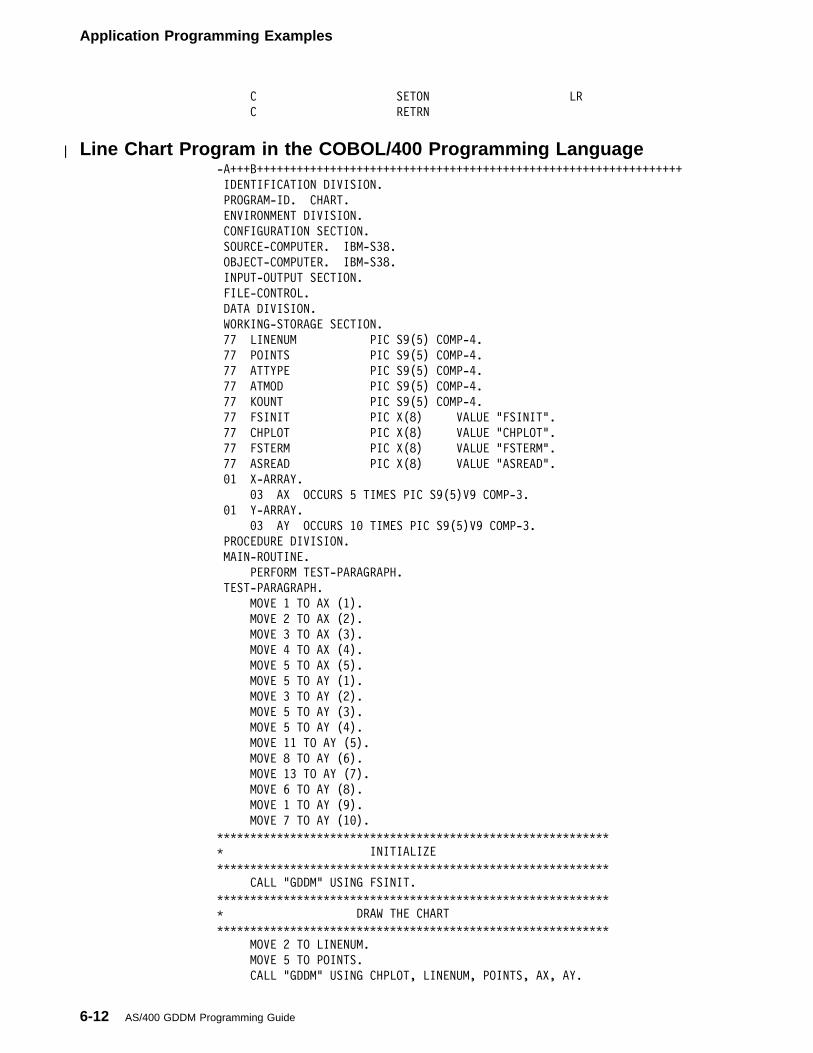
Application Programming Examples
C SETON LR
C RETRN
| Line Chart Program in the COBOL/400 Programming Language-A+++B++++++++++++++++++++++++++++++++++++++++++++++++++++++++++++++++
IDENTIFICATION DIVISION.
PROGRAM-ID. CHART.
ENVIRONMENT DIVISION.
CONFIGURATION SECTION.
SOURCE-COMPUTER. IBM-S38.
OBJECT-COMPUTER. IBM-S38.
INPUT-OUTPUT SECTION.
FILE-CONTROL.
DATA DIVISION.
WORKING-STORAGE SECTION.
77 LINENUM PIC S9(5) COMP-4.
77 POINTS PIC S9(5) COMP-4.
77 ATTYPE PIC S9(5) COMP-4.
77 ATMOD PIC S9(5) COMP-4.
77 KOUNT PIC S9(5) COMP-4.
77 FSINIT PIC X(8) VALUE "FSINIT".
77 CHPLOT PIC X(8) VALUE "CHPLOT".
77 FSTERM PIC X(8) VALUE "FSTERM".
77 ASREAD PIC X(8) VALUE "ASREAD".
�1 X-ARRAY.
�3 AX OCCURS 5 TIMES PIC S9(5)V9 COMP-3.
�1 Y-ARRAY.
�3 AY OCCURS 1� TIMES PIC S9(5)V9 COMP-3.
PROCEDURE DIVISION.
MAIN-ROUTINE.
PERFORM TEST-PARAGRAPH.
TEST-PARAGRAPH.
MOVE 1 TO AX (1).
MOVE 2 TO AX (2).
MOVE 3 TO AX (3).
MOVE 4 TO AX (4).
MOVE 5 TO AX (5).
MOVE 5 TO AY (1).
MOVE 3 TO AY (2).
MOVE 5 TO AY (3).
MOVE 5 TO AY (4).
MOVE 11 TO AY (5).
MOVE 8 TO AY (6).
MOVE 13 TO AY (7).
MOVE 6 TO AY (8).
MOVE 1 TO AY (9).
MOVE 7 TO AY (1�).
�����������������������������������������������������������
� INITIALIZE
�����������������������������������������������������������
CALL "GDDM" USING FSINIT.
�����������������������������������������������������������
� DRAW THE CHART
�����������������������������������������������������������
MOVE 2 TO LINENUM.
MOVE 5 TO POINTS.
CALL "GDDM" USING CHPLOT, LINENUM, POINTS, AX, AY.
6-12 AS/400 GDDM Programming Guide
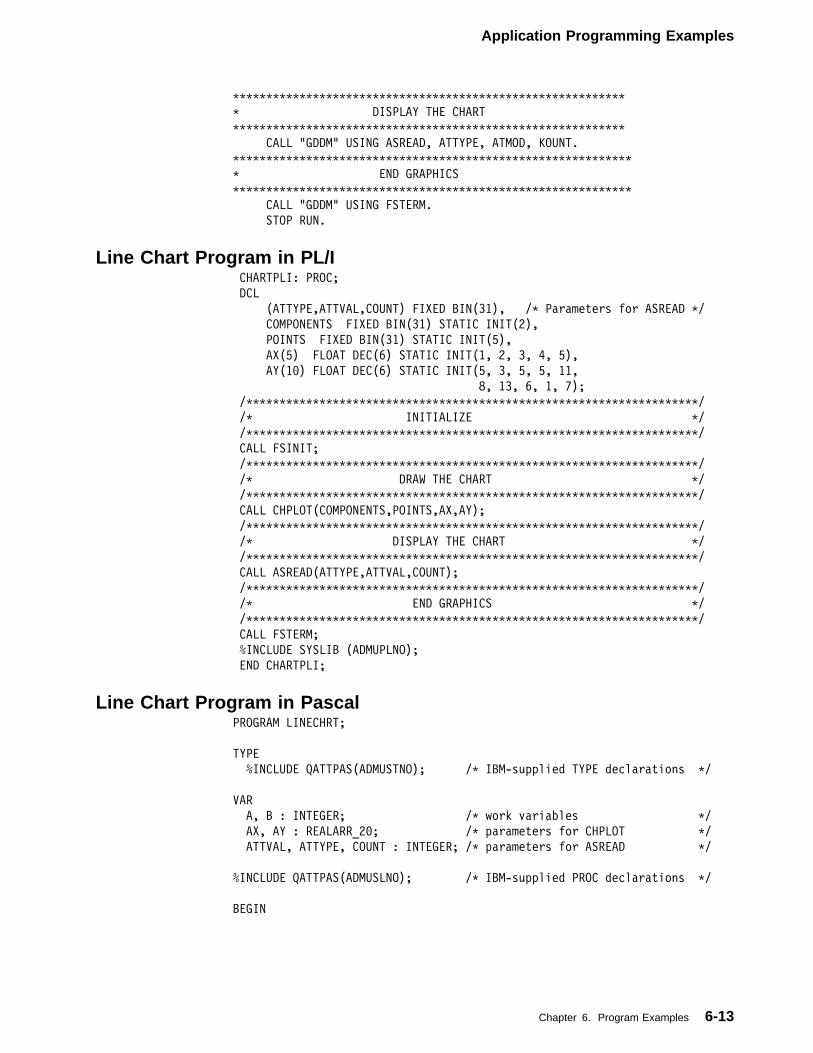
Application Programming Examples
�����������������������������������������������������������
� DISPLAY THE CHART
�����������������������������������������������������������
CALL "GDDM" USING ASREAD, ATTYPE, ATMOD, KOUNT.
������������������������������������������������������������
� END GRAPHICS
������������������������������������������������������������
CALL "GDDM" USING FSTERM.
STOP RUN.
Line Chart Program in PL/I CHARTPLI: PROC;
DCL
(ATTYPE,ATTVAL,COUNT) FIXED BIN(31), /� Parameters for ASREAD �/
COMPONENTS FIXED BIN(31) STATIC INIT(2),
POINTS FIXED BIN(31) STATIC INIT(5),
AX(5) FLOAT DEC(6) STATIC INIT(1, 2, 3, 4, 5),
AY(1�) FLOAT DEC(6) STATIC INIT(5, 3, 5, 5, 11,
8, 13, 6, 1, 7);
/��������������������������������������������������������������������/
/� INITIALIZE �/
/��������������������������������������������������������������������/
CALL FSINIT;
/��������������������������������������������������������������������/
/� DRAW THE CHART �/
/��������������������������������������������������������������������/
CALL CHPLOT(COMPONENTS,POINTS,AX,AY);
/��������������������������������������������������������������������/
/� DISPLAY THE CHART �/
/��������������������������������������������������������������������/
CALL ASREAD(ATTYPE,ATTVAL,COUNT);
/��������������������������������������������������������������������/
/� END GRAPHICS �/
/��������������������������������������������������������������������/
CALL FSTERM;
%INCLUDE SYSLIB (ADMUPLNO);
END CHARTPLI;
Line Chart Program in PascalPROGRAM LINECHRT;
TYPE
%INCLUDE QATTPAS(ADMUSTNO); /� IBM-supplied TYPE declarations �/
VAR
A, B : INTEGER; /� work variables �/
AX, AY : REALARR_2�; /� parameters for CHPLOT �/
ATTVAL, ATTYPE, COUNT : INTEGER; /� parameters for ASREAD �/
%INCLUDE QATTPAS(ADMUSLNO); /� IBM-supplied PROC declarations �/
BEGIN
Chapter 6. Program Examples 6-13
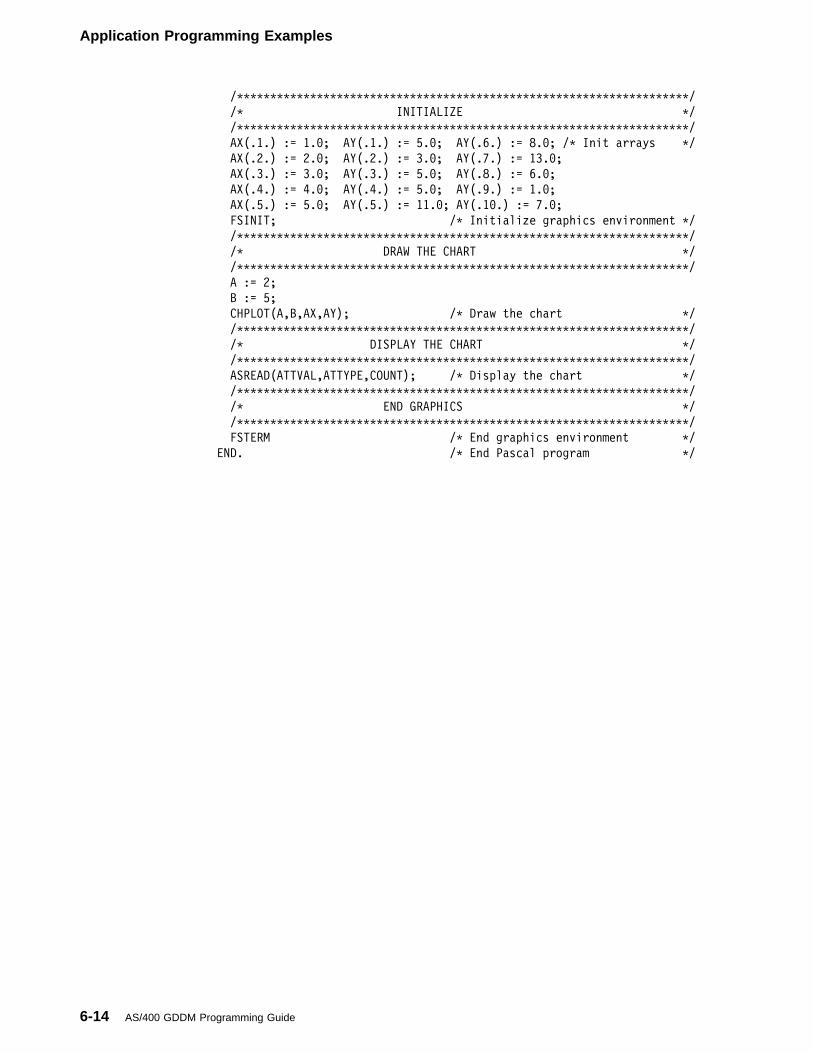
Application Programming Examples
/��������������������������������������������������������������������/
/� INITIALIZE �/
/��������������������������������������������������������������������/
AX(.1.) := 1.�; AY(.1.) := 5.�; AY(.6.) := 8.�; /� Init arrays �/
AX(.2.) := 2.�; AY(.2.) := 3.�; AY(.7.) := 13.�;
AX(.3.) := 3.�; AY(.3.) := 5.�; AY(.8.) := 6.�;
AX(.4.) := 4.�; AY(.4.) := 5.�; AY(.9.) := 1.�;
AX(.5.) := 5.�; AY(.5.) := 11.�; AY(.1�.) := 7.�;
FSINIT; /� Initialize graphics environment �/
/��������������������������������������������������������������������/
/� DRAW THE CHART �/
/��������������������������������������������������������������������/
A := 2;
B := 5;
CHPLOT(A,B,AX,AY); /� Draw the chart �/
/��������������������������������������������������������������������/
/� DISPLAY THE CHART �/
/��������������������������������������������������������������������/
ASREAD(ATTVAL,ATTYPE,COUNT); /� Display the chart �/
/��������������������������������������������������������������������/
/� END GRAPHICS �/
/��������������������������������������������������������������������/
FSTERM /� End graphics environment �/
END. /� End Pascal program �/
6-14 AS/400 GDDM Programming Guide
Application Programming Examples
Complex ProgramsThe programs in this section show some of the many variations available forgraphics application programs.
BASIC Program Showing Three Charts on a PageThis example program shows how to use:
| Data from a database file for chart data
GDDM and Presentation Graphics in the same program
A secondary axis on a chart
Three separate charts placed in separate chart areas.
�
������ 35MM�536M3 ������
� �
The combination of charts is drawn by this program:
���1� SALES: !
���2� !����������������������������������������������������������������
���3� !� This program displays an income and expense summary for the �
���4� !� XYZ Corporation by charting a condensed statement, a net �
���5� !� income chart, and a net sales chart. All three charts are �
���6� !� shown in the same picture. �
���7� !� �
���8� !� Declare all arrays and variables used in the program: �
���9� !����������������������������������������������������������������
��1�� OPTION BASE 1
��11� DIM MULBAR(9),NETSAL(3),COST(3),EXPEN(3),NETINC(3),MONTH(3)
��12� DIM UNITS(3),COLTAB(4),PATTAB(4)
��13� INTEGER ATTYPE,ATMOD
��14� DIM HATTS(4),TATTS(4),LATTS(4),KATTS(4),VATTS(4),AATTS(12)
��15� INTEGER LENGTH,POSITIONS,AXIS,COMP
��16� INTEGER HATTS,TATTS,LATTS,KATTS,COUNT,STARTMON,MODE,COLOR
Chapter 6. Program Examples 6-15
Application Programming Examples
��17� INTEGER LMAR,RMAR,BMAR,TMAR,VATTS,AATTS,COLTAB,PATTAB
��18� DECIMAL WIDTH,DEPTH,X,Y,MULBAR,DLINE
��19� DECIMAL NETSAL,COST,EXPEN,NETINC,UNITS,NETSS
��2�� !����������������������������������������������������������������
��21� !� Initialize arrays for the heading, axes, axis titles, �
��22� !� labels, and value text. �
��23� !����������������������������������������������������������������
��24� HATTS(1)=3 : HATTS(2)=2 : HATTS(3)=� : HATTS(4)=16�
��25� AATTS(1)=-1 : AATTS(2)=-1 : AATTS(3)=-1 : AATTS(4)=-1
��26� AATTS(5)=-1 : AATTS(6)=-1 : AATTS(7)=-1 : AATTS(8)=-1
��27� AATTS(9)=-1 : AATTS(1�)=6 : AATTS(11)=� : AATTS(12)=1
��28� TATTS(1)=4 : TATTS(2)=2 : TATTS(3)=� : TATTS(4)=15�
��29� LATTS(1)=1 : LATTS(2)=2 : LATTS(3)=� : LATTS(4)=16�
��3�� KATTS(1)=6 : KATTS(2)=2 : KATTS(3)=� : KATTS(4)=135
��31� VATTS(1)=5 : VATTS(2)=2 : VATTS(3)=� : VATTS(4)=16�
��32� !����������������������������������������������������������������
��33� !� Open the file that contains the data used to draw the �
��34� !� three charts. The file could have been generated using the �
��35� !� Query utility with the output going to this data base file. �
��36� !� Read the data and calculate the net income, then store the �
��37� !� net sales, cost, and expense figures in an array for later �
��38� !� use in the bar chart. �
��39� !����������������������������������������������������������������
��4�� OPEN #1 :'NAME=DBFILE,LIBRARY=YOURLIB',INPUT
��41� FOR I = 1 TO 3
��42� READ #1,USING'FORM ZD 3.1,5�ZD 6.2':MONTH(I),NETSAL(I),COS&
&T(I),EXPEN(I),UNITS(I),NETSS(I)
��43� NETINC(I) = NETSAL(I) - (COST(I) + EXPEN(I))
��44� MULBAR(I) = NETSAL(I) : MULBAR(I+3) = COST(I)
��45� MULBAR(I+6)=EXPEN(I)
��46� NEXT I
��47� !����������������������������������������������������������������
��48� !� Initialize the graphics environment �
��49� !����������������������������������������������������������������
��5�� CALL GDDM('FSINIT')
��51� !����������������������������������������������������������������
��52� !� Use subroutines to write the notes and draw the charts. �
��53� !����������������������������������������������������������������
��54� GOSUB NOTES
��55� GOSUB CONSTAT
��56� GOSUB NETINCOME
��57� GOSUB NETSSOURCE
��58� !����������������������������������������������������������������
��59� !� Terminate Presentation Graphics, send the picture to the �
��6�� !� display, and terminate GDDM. �
��61� !����������������������������������������������������������������
��62� CALL GDDM('CHTERM')
��63� CALL GDDM('ASREAD',ATTYPE,ATMOD,COUNT)
��64� CALL GDDM('FSTERM')
��65� GOTO DONE
��66� NOTES: !
��67� !����������������������������������������������������������������
��68� !� GDDM SUBROUTINE TO WRITE NOTES IN THE UPPER LEFT CORNER �
��69� !� OF THE PICTURE. �
��7�� !� �
��71� !� Set the color of the characters, set the character mode �
��72� !� to two, set the character box size, then draw the string �
��73� !� at position X,Y. �
6-16 AS/400 GDDM Programming Guide
Application Programming Examples
��74� !����������������������������������������������������������������
��75� CALL GDDM('GSSEG',�)
��76� COLOR=2
��77� CALL GDDM('GSCOL',COLOR)
��78� X=5 : Y=95 : LENGTH=24
��79� CALL GDDM('GSCHAR',X,Y,LENGTH,'INCOME & EXPENSE SUMMARY')
��8�� X=5 : Y=9�.� : LENGTH=15
��81� CALL GDDM('GSCHAR',X,Y,LENGTH,'XYZ CORPORATION')
��82� LENGTH=17
��83� CALL GDDM('GSCHAP',LENGTH,' --- DEC 31, 1984')
��84� !����������������������������������������������������������������
��85� !� Change the color, then draw the boundary lines for the note. �
��86� !����������������������������������������������������������������
��87� COLOR=7
��88� CALL GDDM('GSCOL',COLOR)
��89� X=�.� : Y=88.�
��9�� CALL GDDM('GSMOVE',X,Y)
��91� X=�.� : Y=1��.��
��92� CALL GDDM('GSLINE',X,Y)
��93� X=6�.25 : Y=1��.��
��94� CALL GDDM('GSLINE',X,Y)
��95� CALL GDDM('GSSCLS')
��96� RETURN
��97� CONSTAT: !
��98� !����������������������������������������������������������������
��99� !� SUBROUTINE TO DRAW THE CONDENSED STATEMENT CHART. �
�1��� !� �
�1�1� !� Query the picture space, then set the chart area and �
�1�2� !� draw a frame around the chart. �
�1�3� !����������������������������������������������������������������
�1�4� CALL GDDM('GSQPS',WIDTH,DEPTH)
�1�5� CALL GDDM('CHAREA',�.�,.6�WIDTH,�.�,.9�DEPTH)
�1�6� CALL GDDM('CHSET','CBOX')
�1�7� !����������������������������������������������������������������
�1�8� !� Set the attributes for and write the heading. �
�1�9� !����������������������������������������������������������������
�11�� POSITIONS=4
�111� CALL GDDM('CHHATT',POSITIONS,HATTS())
�112� LENGTH = 19
�113� CALL GDDM('CHHEAD',LENGTH,'CONDENSED STATEMENT')
�114� !����������������������������������������������������������������
�115� !� Set the attributes for the axis labels and axes, set the �
�116� !� margins. �
�117� !����������������������������������������������������������������
�118� POSITIONS=4
�119� CALL GDDM('CHLATT',POSITIONS,LATTS())
�12�� POSITIONS=12
�121� CALL GDDM('CHAATT',POSITIONS,AATTS())
�122� LMAR=14 : RMAR=12
�123� CALL GDDM('CHVMAR',LMAR,RMAR)
�124� BMAR=6 : TMAR=2
�125� CALL GDDM('CHHMAR',BMAR,TMAR)
�126� !����������������������������������������������������������������
�127� !� Position, set the attributes for, and draw the legend. �
�128� !����������������������������������������������������������������
�129� CALL GDDM('CHKEYP','H','B','C')
�13�� X=�.� : Y= 1.3
�131� CALL GDDM('CHKOFF',X,Y)
Chapter 6. Program Examples 6-17
Application Programming Examples
�132� CALL GDDM('CHSET','KBOX')
�133� POSITIONS=4
�134� CALL GDDM('CHKATT',POSITIONS,KATTS())
�135� COUNT=3
�136� LENGTH=13
�137� CALL GDDM('CHKEY',COUNT,LENGTH,'NET SALES COST OF GOODSEXP&
&ENSES ')
�138� !����������������������������������������������������������������
�139� !� Set the attributes for and write the axis titles. �
�14�� !����������������������������������������������������������������
�141� POSITIONS=4
�142� CALL GDDM('CHTATT',POSITIONS,TATTS())
�143� LENGTH = 11
�144� CALL GDDM('CHYTTL',LENGTH,'THOUSANDS $')
�145� !����������������������������������������������������������������
�146� !� Set the starting month for the x-axis labels, and set the �
�147� !� color table and the pattern table. �
�148� !����������������������������������������������������������������
�149� STARTMON=1
�15�� CALL GDDM('CHXMTH',STARTMON)
�151� COLTAB(1)=1 : COLTAB(2)=2 : COLTAB(3)=5 : COLTAB(4)=6
�152� CALL GDDM('CHCOL',POSITIONS,COLTAB())
�153� PATTAB(1)=� : PATTAB(2)=� : PATTAB(3)=� : PATTAB(4)=�
�154� CALL GDDM('CHPAT',POSITIONS,PATTAB())
�155� !����������������������������������������������������������������
�156� !� Select and define the secondary axis used for the �
�157� !� line chart that represents sales units. �
�158� !����������������������������������������������������������������
�159� AXIS = 2
�16�� CALL GDDM('CHYSEL',AXIS)
�161� LENGTH = 1�
�162� CALL GDDM('CHYTTL',LENGTH,'UNIT SALES')
�163� X=�.� : Y=5��.��
�164� CALL GDDM('CHYRNG',X,Y)
�165� X=1��.�� : Y=�.�
�166� CALL GDDM('CHYTIC',X,Y)
�167� CALL GDDM('CHYSET','PTICK')
�168� !����������������������������������������������������������������
�169� !� Select the primary axis and draw the bar chart. �
�17�� !����������������������������������������������������������������
�171� AXIS = 1
�172� CALL GDDM('CHYSEL',AXIS)
�173� COMP = 3 : COUNT=3
�174� CALL GDDM('CHBAR',COMP,COUNT,MULBAR())
�175� !����������������������������������������������������������������
�176� !� Select the secondary axis, then draw the �
�177� !� line chart component that represents sales units. �
�178� !����������������������������������������������������������������
�179� AXIS = 2
�18�� CALL GDDM('CHYSEL',AXIS)
�181� COMP = 1 : COUNT=3
�182� CALL GDDM('CHPLOT',COMP,COUNT,MONTH(),UNITS())
�183� !����������������������������������������������������������������
�184� !� Draw the axes again to overpaint the bar chart components. �
�185� !����������������������������������������������������������������
�186� CALL GDDM('CHDRAX')
�187� !����������������������������������������������������������������
�188� !� Reset all chart definition values to default values and �
6-18 AS/400 GDDM Programming Guide
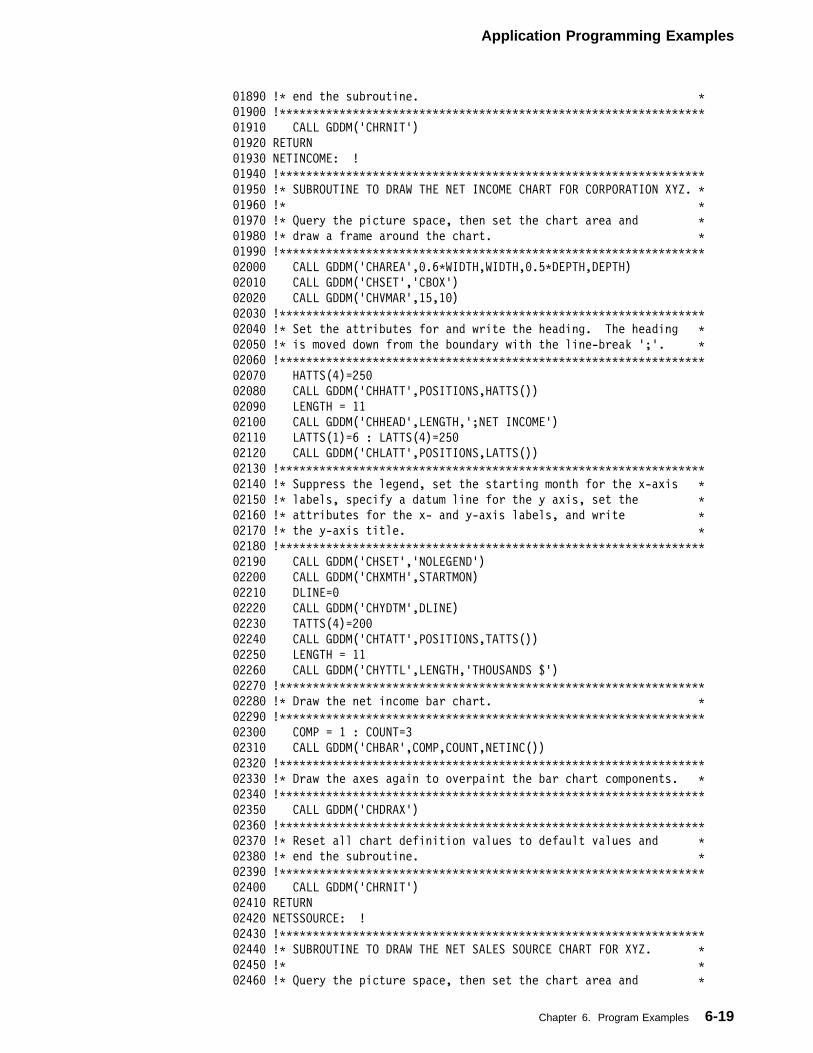
Application Programming Examples
�189� !� end the subroutine. �
�19�� !����������������������������������������������������������������
�191� CALL GDDM('CHRNIT')
�192� RETURN
�193� NETINCOME: !
�194� !����������������������������������������������������������������
�195� !� SUBROUTINE TO DRAW THE NET INCOME CHART FOR CORPORATION XYZ. �
�196� !� �
�197� !� Query the picture space, then set the chart area and �
�198� !� draw a frame around the chart. �
�199� !����������������������������������������������������������������
�2��� CALL GDDM('CHAREA',�.6�WIDTH,WIDTH,�.5�DEPTH,DEPTH)
�2�1� CALL GDDM('CHSET','CBOX')
�2�2� CALL GDDM('CHVMAR',15,1�)
�2�3� !����������������������������������������������������������������
�2�4� !� Set the attributes for and write the heading. The heading �
�2�5� !� is moved down from the boundary with the line-break ';'. �
�2�6� !����������������������������������������������������������������
�2�7� HATTS(4)=25�
�2�8� CALL GDDM('CHHATT',POSITIONS,HATTS())
�2�9� LENGTH = 11
�21�� CALL GDDM('CHHEAD',LENGTH,';NET INCOME')
�211� LATTS(1)=6 : LATTS(4)=25�
�212� CALL GDDM('CHLATT',POSITIONS,LATTS())
�213� !����������������������������������������������������������������
�214� !� Suppress the legend, set the starting month for the x-axis �
�215� !� labels, specify a datum line for the y axis, set the �
�216� !� attributes for the x- and y-axis labels, and write �
�217� !� the y-axis title. �
�218� !����������������������������������������������������������������
�219� CALL GDDM('CHSET','NOLEGEND')
�22�� CALL GDDM('CHXMTH',STARTMON)
�221� DLINE=�
�222� CALL GDDM('CHYDTM',DLINE)
�223� TATTS(4)=2��
�224� CALL GDDM('CHTATT',POSITIONS,TATTS())
�225� LENGTH = 11
�226� CALL GDDM('CHYTTL',LENGTH,'THOUSANDS $')
�227� !����������������������������������������������������������������
�228� !� Draw the net income bar chart. �
�229� !����������������������������������������������������������������
�23�� COMP = 1 : COUNT=3
�231� CALL GDDM('CHBAR',COMP,COUNT,NETINC())
�232� !����������������������������������������������������������������
�233� !� Draw the axes again to overpaint the bar chart components. �
�234� !����������������������������������������������������������������
�235� CALL GDDM('CHDRAX')
�236� !����������������������������������������������������������������
�237� !� Reset all chart definition values to default values and �
�238� !� end the subroutine. �
�239� !����������������������������������������������������������������
�24�� CALL GDDM('CHRNIT')
�241� RETURN
�242� NETSSOURCE: !
�243� !����������������������������������������������������������������
�244� !� SUBROUTINE TO DRAW THE NET SALES SOURCE CHART FOR XYZ. �
�245� !� �
�246� !� Query the picture space, then set the chart area and �
Chapter 6. Program Examples 6-19
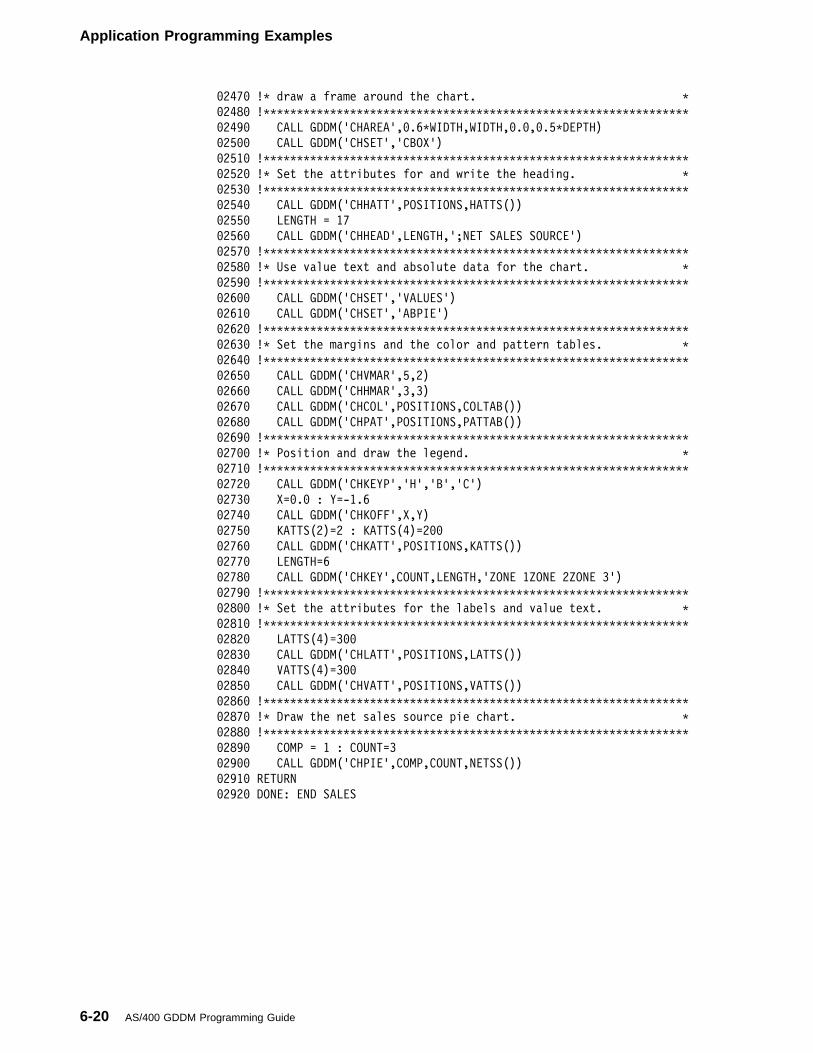
Application Programming Examples
�247� !� draw a frame around the chart. �
�248� !����������������������������������������������������������������
�249� CALL GDDM('CHAREA',�.6�WIDTH,WIDTH,�.�,�.5�DEPTH)
�25�� CALL GDDM('CHSET','CBOX')
�251� !����������������������������������������������������������������
�252� !� Set the attributes for and write the heading. �
�253� !����������������������������������������������������������������
�254� CALL GDDM('CHHATT',POSITIONS,HATTS())
�255� LENGTH = 17
�256� CALL GDDM('CHHEAD',LENGTH,';NET SALES SOURCE')
�257� !����������������������������������������������������������������
�258� !� Use value text and absolute data for the chart. �
�259� !����������������������������������������������������������������
�26�� CALL GDDM('CHSET','VALUES')
�261� CALL GDDM('CHSET','ABPIE')
�262� !����������������������������������������������������������������
�263� !� Set the margins and the color and pattern tables. �
�264� !����������������������������������������������������������������
�265� CALL GDDM('CHVMAR',5,2)
�266� CALL GDDM('CHHMAR',3,3)
�267� CALL GDDM('CHCOL',POSITIONS,COLTAB())
�268� CALL GDDM('CHPAT',POSITIONS,PATTAB())
�269� !����������������������������������������������������������������
�27�� !� Position and draw the legend. �
�271� !����������������������������������������������������������������
�272� CALL GDDM('CHKEYP','H','B','C')
�273� X=�.� : Y=-1.6
�274� CALL GDDM('CHKOFF',X,Y)
�275� KATTS(2)=2 : KATTS(4)=2��
�276� CALL GDDM('CHKATT',POSITIONS,KATTS())
�277� LENGTH=6
�278� CALL GDDM('CHKEY',COUNT,LENGTH,'ZONE 1ZONE 2ZONE 3')
�279� !����������������������������������������������������������������
�28�� !� Set the attributes for the labels and value text. �
�281� !����������������������������������������������������������������
�282� LATTS(4)=3��
�283� CALL GDDM('CHLATT',POSITIONS,LATTS())
�284� VATTS(4)=3��
�285� CALL GDDM('CHVATT',POSITIONS,VATTS())
�286� !����������������������������������������������������������������
�287� !� Draw the net sales source pie chart. �
�288� !����������������������������������������������������������������
�289� COMP = 1 : COUNT=3
�29�� CALL GDDM('CHPIE',COMP,COUNT,NETSS())
�291� RETURN
�292� DONE: END SALES
6-20 AS/400 GDDM Programming Guide
Application Programming Examples
| BASIC Program that Interacts with Database FilesThis program is a project scheduling application that uses a two-subfile display file
| to read data from and write data to a database file. The data is used to draw ahorizontal, floating, single-bar chart.
The first subfile produces the following display, which you can use to enter project| numbers for data that already exists in the database file:
�
������ 35MM�536M4 ������
� �
Chapter 6. Program Examples 6-21
Application Programming Examples
The second subfile works with the graphics program as shown in the followingpicture. The second subfile also accepts data entered for new projects.
�
������ 35MM�536M5 ������
� �
| There are two database files used for the project data. This is the accounting filecalled PACCT:
���������111111111122222222223333333333444444444455555555556666666666777777
123456789�123456789�123456789�123456789�123456789�123456789�123456789�12345
A UNIQUE
A R ACCT TEXT('Project Accounting File')
A PROJ 6A TEXT('Project Number')
A COST 4 � TEXT('Project Cost')
A REV 4 � TEXT('Project Revenue')
A K PROJ
| This is the schedule file called PSCHED:
���������111111111122222222223333333333444444444455555555556666666666777777
123456789�123456789�123456789�123456789�123456789�123456789�123456789�12345
A UNIQUE
A R SCHED TEXT('Project Schedule File')
A PROJ 6A TEXT('Project Number')
A CLIENT 15A TEXT('Client Name')
A BEGDAT 5A TEXT('Beginning Date')
A ENDDAT 5A TEXT('Ending Date')
A K PROJ
6-22 AS/400 GDDM Programming Guide
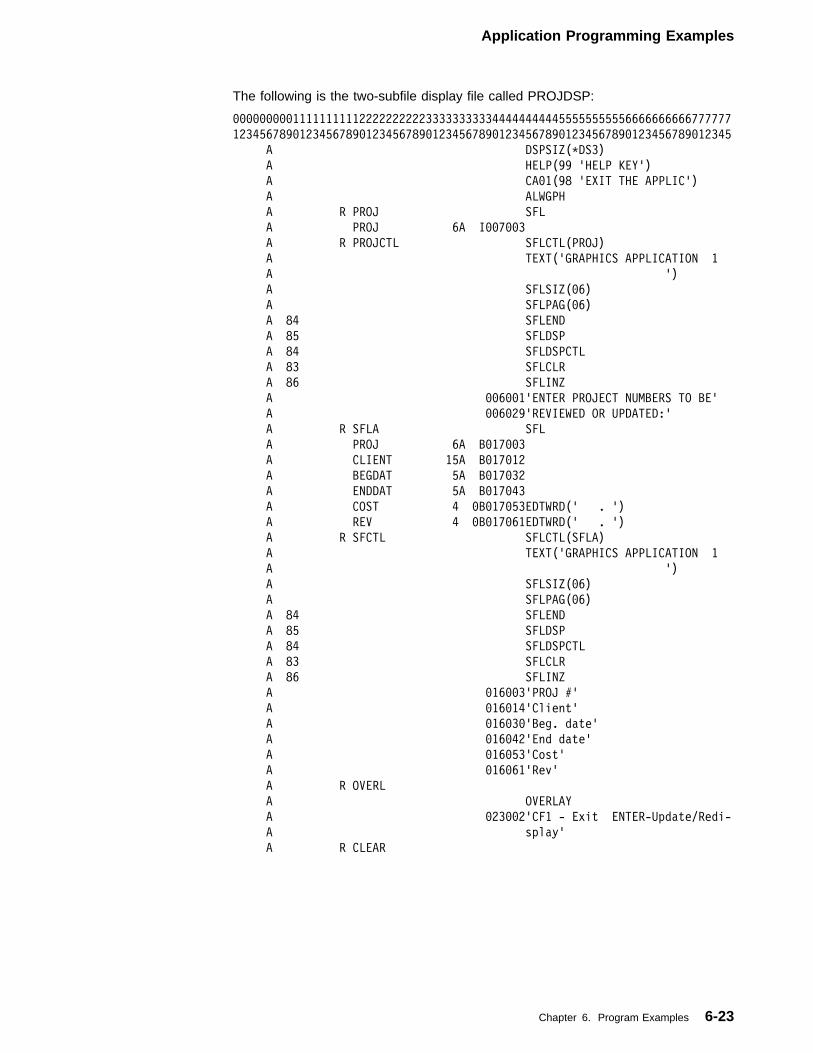
Application Programming Examples
The following is the two-subfile display file called PROJDSP:
���������111111111122222222223333333333444444444455555555556666666666777777
123456789�123456789�123456789�123456789�123456789�123456789�123456789�12345
A DSPSIZ(�DS3)
A HELP(99 'HELP KEY')
A CA�1(98 'EXIT THE APPLIC')
A ALWGPH
A R PROJ SFL
A PROJ 6A I��7��3
A R PROJCTL SFLCTL(PROJ)
A TEXT('GRAPHICS APPLICATION 1
A ')
A SFLSIZ(�6)
A SFLPAG(�6)
A 84 SFLEND
A 85 SFLDSP
A 84 SFLDSPCTL
A 83 SFLCLR
A 86 SFLINZ
A ��6��1'ENTER PROJECT NUMBERS TO BE'
A ��6�29'REVIEWED OR UPDATED:'
A R SFLA SFL
A PROJ 6A B�17��3
A CLIENT 15A B�17�12
A BEGDAT 5A B�17�32
A ENDDAT 5A B�17�43
A COST 4 �B�17�53EDTWRD(' . ')
A REV 4 �B�17�61EDTWRD(' . ')
A R SFCTL SFLCTL(SFLA)
A TEXT('GRAPHICS APPLICATION 1
A ')
A SFLSIZ(�6)
A SFLPAG(�6)
A 84 SFLEND
A 85 SFLDSP
A 84 SFLDSPCTL
A 83 SFLCLR
A 86 SFLINZ
A �16��3'PROJ #'
A �16�14'Client'
A �16�3�'Beg. date'
A �16�42'End date'
A �16�53'Cost'
A �16�61'Rev'
A R OVERL
A OVERLAY
A �23��2'CF1 - Exit ENTER-Update/Redi-
A splay'
A R CLEAR
Chapter 6. Program Examples 6-23
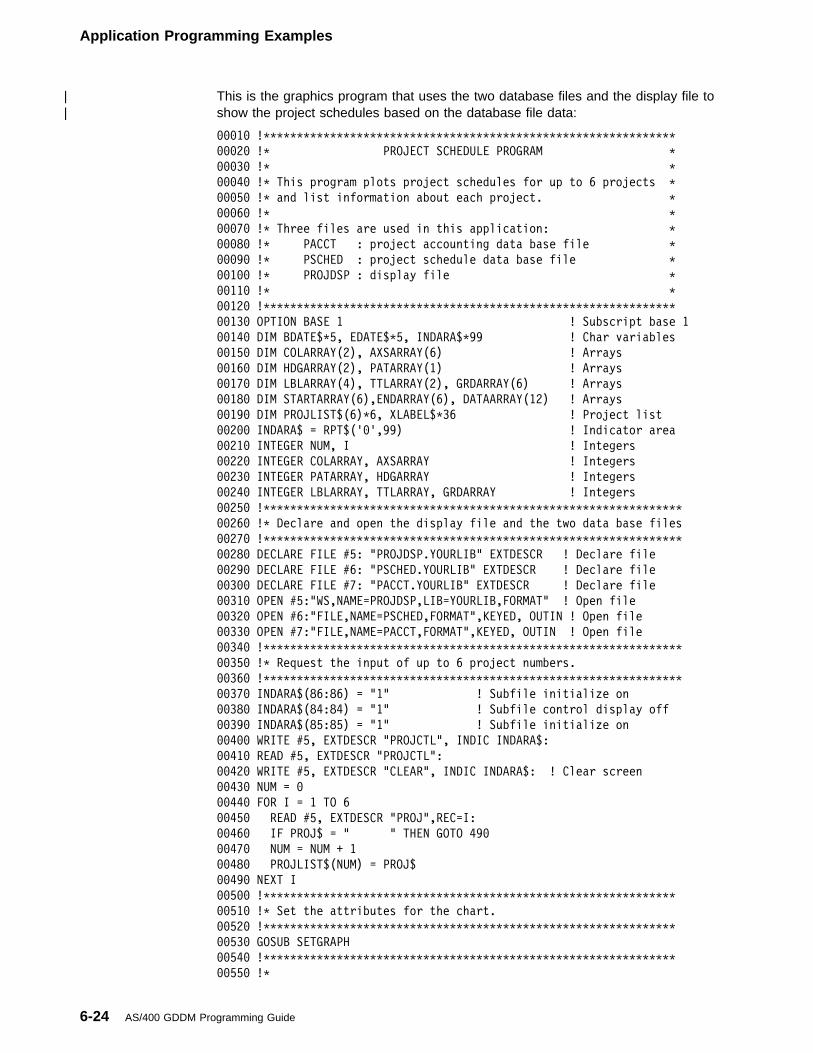
Application Programming Examples
| This is the graphics program that uses the two database files and the display file to| show the project schedules based on the database file data:
���1� !��������������������������������������������������������������
���2� !� PROJECT SCHEDULE PROGRAM �
���3� !� �
���4� !� This program plots project schedules for up to 6 projects �
���5� !� and list information about each project. �
���6� !� �
���7� !� Three files are used in this application: �
���8� !� PACCT : project accounting data base file �
���9� !� PSCHED : project schedule data base file �
��1�� !� PROJDSP : display file �
��11� !� �
��12� !��������������������������������������������������������������
��13� OPTION BASE 1 ! Subscript base 1
��14� DIM BDATE$�5, EDATE$�5, INDARA$�99 ! Char variables
��15� DIM COLARRAY(2), AXSARRAY(6) ! Arrays
��16� DIM HDGARRAY(2), PATARRAY(1) ! Arrays
��17� DIM LBLARRAY(4), TTLARRAY(2), GRDARRAY(6) ! Arrays
��18� DIM STARTARRAY(6),ENDARRAY(6), DATAARRAY(12) ! Arrays
��19� DIM PROJLIST$(6)�6, XLABEL$�36 ! Project list
��2�� INDARA$ = RPT$('�',99) ! Indicator area
��21� INTEGER NUM, I ! Integers
��22� INTEGER COLARRAY, AXSARRAY ! Integers
��23� INTEGER PATARRAY, HDGARRAY ! Integers
��24� INTEGER LBLARRAY, TTLARRAY, GRDARRAY ! Integers
��25� !���������������������������������������������������������������
��26� !� Declare and open the display file and the two data base files
��27� !���������������������������������������������������������������
��28� DECLARE FILE #5: "PROJDSP.YOURLIB" EXTDESCR ! Declare file
��29� DECLARE FILE #6: "PSCHED.YOURLIB" EXTDESCR ! Declare file
��3�� DECLARE FILE #7: "PACCT.YOURLIB" EXTDESCR ! Declare file
��31� OPEN #5:"WS,NAME=PROJDSP,LIB=YOURLIB,FORMAT" ! Open file
��32� OPEN #6:"FILE,NAME=PSCHED,FORMAT",KEYED, OUTIN ! Open file
��33� OPEN #7:"FILE,NAME=PACCT,FORMAT",KEYED, OUTIN ! Open file
��34� !���������������������������������������������������������������
��35� !� Request the input of up to 6 project numbers.
��36� !���������������������������������������������������������������
��37� INDARA$(86:86) = "1" ! Subfile initialize on
��38� INDARA$(84:84) = "1" ! Subfile control display off
��39� INDARA$(85:85) = "1" ! Subfile initialize on
��4�� WRITE #5, EXTDESCR "PROJCTL", INDIC INDARA$:
��41� READ #5, EXTDESCR "PROJCTL":
��42� WRITE #5, EXTDESCR "CLEAR", INDIC INDARA$: ! Clear screen
��43� NUM = �
��44� FOR I = 1 TO 6
��45� READ #5, EXTDESCR "PROJ",REC=I:
��46� IF PROJ$ = " " THEN GOTO 49�
��47� NUM = NUM + 1
��48� PROJLIST$(NUM) = PROJ$
��49� NEXT I
��5�� !��������������������������������������������������������������
��51� !� Set the attributes for the chart.
��52� !��������������������������������������������������������������
��53� GOSUB SETGRAPH
��54� !��������������������������������������������������������������
��55� !�
6-24 AS/400 GDDM Programming Guide
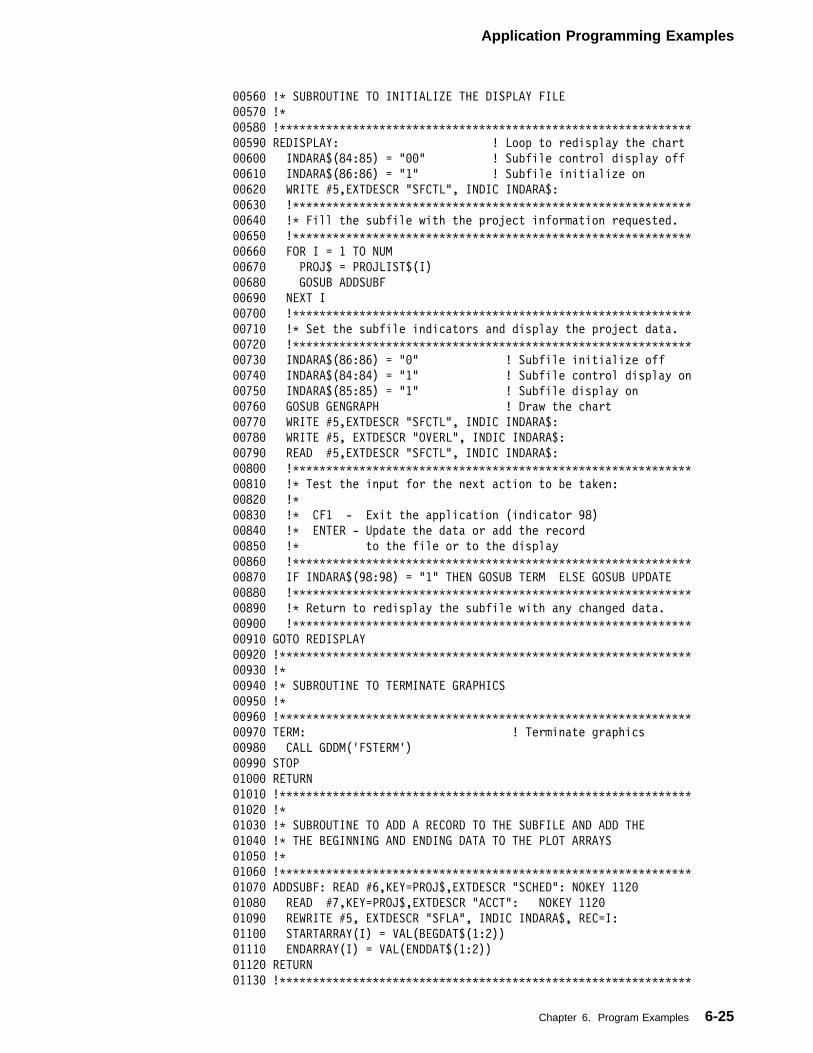
Application Programming Examples
��56� !� SUBROUTINE TO INITIALIZE THE DISPLAY FILE
��57� !�
��58� !��������������������������������������������������������������
��59� REDISPLAY: ! Loop to redisplay the chart
��6�� INDARA$(84:85) = "��" ! Subfile control display off
��61� INDARA$(86:86) = "1" ! Subfile initialize on
��62� WRITE #5,EXTDESCR "SFCTL", INDIC INDARA$:
��63� !������������������������������������������������������������
��64� !� Fill the subfile with the project information requested.
��65� !������������������������������������������������������������
��66� FOR I = 1 TO NUM
��67� PROJ$ = PROJLIST$(I)
��68� GOSUB ADDSUBF
��69� NEXT I
��7�� !������������������������������������������������������������
��71� !� Set the subfile indicators and display the project data.
��72� !������������������������������������������������������������
��73� INDARA$(86:86) = "�" ! Subfile initialize off
��74� INDARA$(84:84) = "1" ! Subfile control display on
��75� INDARA$(85:85) = "1" ! Subfile display on
��76� GOSUB GENGRAPH ! Draw the chart
��77� WRITE #5,EXTDESCR "SFCTL", INDIC INDARA$:
��78� WRITE #5, EXTDESCR "OVERL", INDIC INDARA$:
��79� READ #5,EXTDESCR "SFCTL", INDIC INDARA$:
��8�� !������������������������������������������������������������
��81� !� Test the input for the next action to be taken:
��82� !�
��83� !� CF1 - Exit the application (indicator 98)
��84� !� ENTER - Update the data or add the record
��85� !� to the file or to the display
��86� !������������������������������������������������������������
��87� IF INDARA$(98:98) = "1" THEN GOSUB TERM ELSE GOSUB UPDATE
��88� !������������������������������������������������������������
��89� !� Return to redisplay the subfile with any changed data.
��9�� !������������������������������������������������������������
��91� GOTO REDISPLAY
��92� !��������������������������������������������������������������
��93� !�
��94� !� SUBROUTINE TO TERMINATE GRAPHICS
��95� !�
��96� !��������������������������������������������������������������
��97� TERM: ! Terminate graphics
��98� CALL GDDM('FSTERM')
��99� STOP
�1��� RETURN
�1�1� !��������������������������������������������������������������
�1�2� !�
�1�3� !� SUBROUTINE TO ADD A RECORD TO THE SUBFILE AND ADD THE
�1�4� !� THE BEGINNING AND ENDING DATA TO THE PLOT ARRAYS
�1�5� !�
�1�6� !��������������������������������������������������������������
�1�7� ADDSUBF: READ #6,KEY=PROJ$,EXTDESCR "SCHED": NOKEY 112�
�1�8� READ #7,KEY=PROJ$,EXTDESCR "ACCT": NOKEY 112�
�1�9� REWRITE #5, EXTDESCR "SFLA", INDIC INDARA$, REC=I:
�11�� STARTARRAY(I) = VAL(BEGDAT$(1:2))
�111� ENDARRAY(I) = VAL(ENDDAT$(1:2))
�112� RETURN
�113� !��������������������������������������������������������������
Chapter 6. Program Examples 6-25
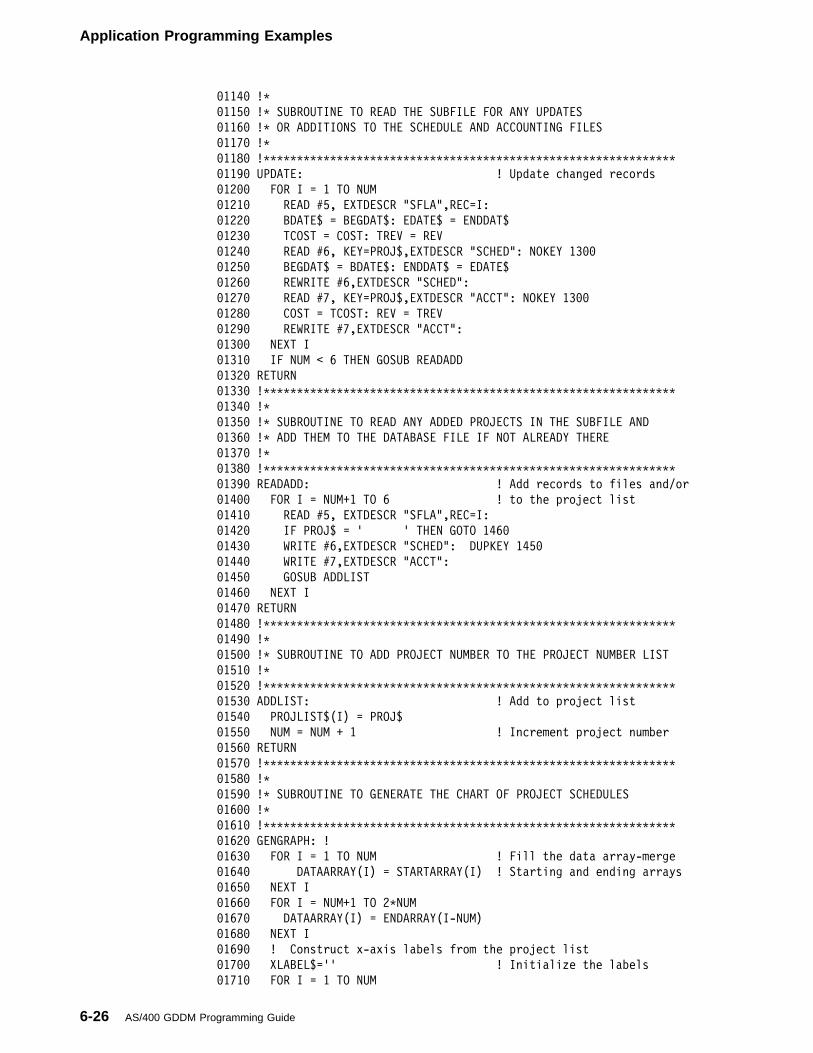
Application Programming Examples
�114� !�
�115� !� SUBROUTINE TO READ THE SUBFILE FOR ANY UPDATES
�116� !� OR ADDITIONS TO THE SCHEDULE AND ACCOUNTING FILES
�117� !�
�118� !��������������������������������������������������������������
�119� UPDATE: ! Update changed records
�12�� FOR I = 1 TO NUM
�121� READ #5, EXTDESCR "SFLA",REC=I:
�122� BDATE$ = BEGDAT$: EDATE$ = ENDDAT$
�123� TCOST = COST: TREV = REV
�124� READ #6, KEY=PROJ$,EXTDESCR "SCHED": NOKEY 13��
�125� BEGDAT$ = BDATE$: ENDDAT$ = EDATE$
�126� REWRITE #6,EXTDESCR "SCHED":
�127� READ #7, KEY=PROJ$,EXTDESCR "ACCT": NOKEY 13��
�128� COST = TCOST: REV = TREV
�129� REWRITE #7,EXTDESCR "ACCT":
�13�� NEXT I
�131� IF NUM < 6 THEN GOSUB READADD
�132� RETURN
�133� !��������������������������������������������������������������
�134� !�
�135� !� SUBROUTINE TO READ ANY ADDED PROJECTS IN THE SUBFILE AND
�136� !� ADD THEM TO THE DATABASE FILE IF NOT ALREADY THERE
�137� !�
�138� !��������������������������������������������������������������
�139� READADD: ! Add records to files and/or
�14�� FOR I = NUM+1 TO 6 ! to the project list
�141� READ #5, EXTDESCR "SFLA",REC=I:
�142� IF PROJ$ = ' ' THEN GOTO 146�
�143� WRITE #6,EXTDESCR "SCHED": DUPKEY 145�
�144� WRITE #7,EXTDESCR "ACCT":
�145� GOSUB ADDLIST
�146� NEXT I
�147� RETURN
�148� !��������������������������������������������������������������
�149� !�
�15�� !� SUBROUTINE TO ADD PROJECT NUMBER TO THE PROJECT NUMBER LIST
�151� !�
�152� !��������������������������������������������������������������
�153� ADDLIST: ! Add to project list
�154� PROJLIST$(I) = PROJ$
�155� NUM = NUM + 1 ! Increment project number
�156� RETURN
�157� !��������������������������������������������������������������
�158� !�
�159� !� SUBROUTINE TO GENERATE THE CHART OF PROJECT SCHEDULES
�16�� !�
�161� !��������������������������������������������������������������
�162� GENGRAPH: !
�163� FOR I = 1 TO NUM ! Fill the data array-merge
�164� DATAARRAY(I) = STARTARRAY(I) ! Starting and ending arrays
�165� NEXT I
�166� FOR I = NUM+1 TO 2�NUM
�167� DATAARRAY(I) = ENDARRAY(I-NUM)
�168� NEXT I
�169� ! Construct x-axis labels from the project list
�17�� XLABEL$='' ! Initialize the labels
�171� FOR I = 1 TO NUM
6-26 AS/400 GDDM Programming Guide
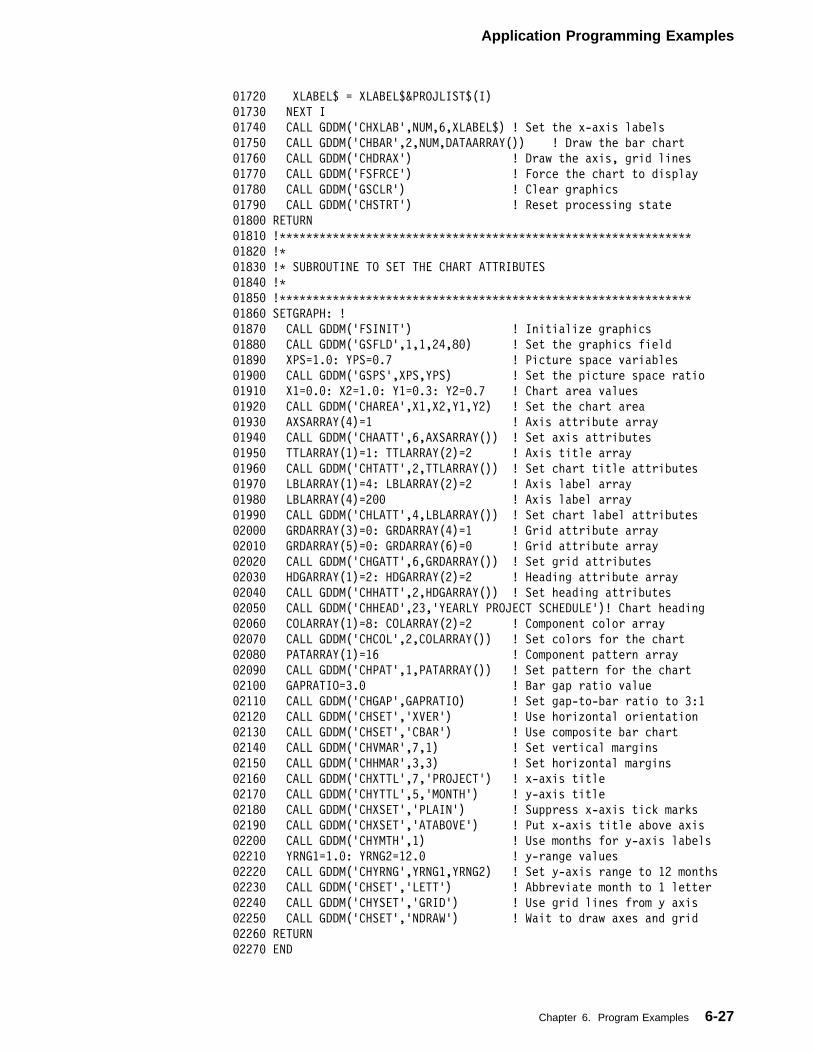
Application Programming Examples
�172� XLABEL$ = XLABEL$&PROJLIST$(I)
�173� NEXT I
�174� CALL GDDM('CHXLAB',NUM,6,XLABEL$) ! Set the x-axis labels
�175� CALL GDDM('CHBAR',2,NUM,DATAARRAY()) ! Draw the bar chart
�176� CALL GDDM('CHDRAX') ! Draw the axis, grid lines
�177� CALL GDDM('FSFRCE') ! Force the chart to display
�178� CALL GDDM('GSCLR') ! Clear graphics
�179� CALL GDDM('CHSTRT') ! Reset processing state
�18�� RETURN
�181� !��������������������������������������������������������������
�182� !�
�183� !� SUBROUTINE TO SET THE CHART ATTRIBUTES
�184� !�
�185� !��������������������������������������������������������������
�186� SETGRAPH: !
�187� CALL GDDM('FSINIT') ! Initialize graphics
�188� CALL GDDM('GSFLD',1,1,24,8�) ! Set the graphics field
�189� XPS=1.�: YPS=�.7 ! Picture space variables
�19�� CALL GDDM('GSPS',XPS,YPS) ! Set the picture space ratio
�191� X1=�.�: X2=1.�: Y1=�.3: Y2=�.7 ! Chart area values
�192� CALL GDDM('CHAREA',X1,X2,Y1,Y2) ! Set the chart area
�193� AXSARRAY(4)=1 ! Axis attribute array
�194� CALL GDDM('CHAATT',6,AXSARRAY()) ! Set axis attributes
�195� TTLARRAY(1)=1: TTLARRAY(2)=2 ! Axis title array
�196� CALL GDDM('CHTATT',2,TTLARRAY()) ! Set chart title attributes
�197� LBLARRAY(1)=4: LBLARRAY(2)=2 ! Axis label array
�198� LBLARRAY(4)=2�� ! Axis label array
�199� CALL GDDM('CHLATT',4,LBLARRAY()) ! Set chart label attributes
�2��� GRDARRAY(3)=�: GRDARRAY(4)=1 ! Grid attribute array
�2�1� GRDARRAY(5)=�: GRDARRAY(6)=� ! Grid attribute array
�2�2� CALL GDDM('CHGATT',6,GRDARRAY()) ! Set grid attributes
�2�3� HDGARRAY(1)=2: HDGARRAY(2)=2 ! Heading attribute array
�2�4� CALL GDDM('CHHATT',2,HDGARRAY()) ! Set heading attributes
�2�5� CALL GDDM('CHHEAD',23,'YEARLY PROJECT SCHEDULE')! Chart heading
�2�6� COLARRAY(1)=8: COLARRAY(2)=2 ! Component color array
�2�7� CALL GDDM('CHCOL',2,COLARRAY()) ! Set colors for the chart
�2�8� PATARRAY(1)=16 ! Component pattern array
�2�9� CALL GDDM('CHPAT',1,PATARRAY()) ! Set pattern for the chart
�21�� GAPRATIO=3.� ! Bar gap ratio value
�211� CALL GDDM('CHGAP',GAPRATIO) ! Set gap-to-bar ratio to 3:1
�212� CALL GDDM('CHSET','XVER') ! Use horizontal orientation
�213� CALL GDDM('CHSET','CBAR') ! Use composite bar chart
�214� CALL GDDM('CHVMAR',7,1) ! Set vertical margins
�215� CALL GDDM('CHHMAR',3,3) ! Set horizontal margins
�216� CALL GDDM('CHXTTL',7,'PROJECT') ! x-axis title
�217� CALL GDDM('CHYTTL',5,'MONTH') ! y-axis title
�218� CALL GDDM('CHXSET','PLAIN') ! Suppress x-axis tick marks
�219� CALL GDDM('CHXSET','ATABOVE') ! Put x-axis title above axis
�22�� CALL GDDM('CHYMTH',1) ! Use months for y-axis labels
�221� YRNG1=1.�: YRNG2=12.� ! y-range values
�222� CALL GDDM('CHYRNG',YRNG1,YRNG2) ! Set y-axis range to 12 months
�223� CALL GDDM('CHSET','LETT') ! Abbreviate month to 1 letter
�224� CALL GDDM('CHYSET','GRID') ! Use grid lines from y axis
�225� CALL GDDM('CHSET','NDRAW') ! Wait to draw axes and grid
�226� RETURN
�227� END
Chapter 6. Program Examples 6-27
Application Programming Examples
| COBOL/400 Multiple-Pie Chart Program
�
������ 35MM�536M6 ������
� �
| This COBOL/400 program draws two pie charts. The first pie uses absolute data,the second relative data (the sum of the chart data value array elements for thesecond chart must equal 100 for a complete pie).
-A+++B++++++++++++++++++++++++++++++++++++++++++++++++++++++++++++++++
IDENTIFICATION DIVISION.
PROGRAM-ID. CPGFAPP1.
ENVIRONMENT DIVISION.
CONFIGURATION SECTION.
SOURCE-COMPUTER. IBM-S38.
OBJECT-COMPUTER. IBM-S38.
INPUT-OUTPUT SECTION.
FILE-CONTROL.
DATA DIVISION.
WORKING-STORAGE SECTION.
�����������������������������������������������������������������
� Parameters used in graphics routines
�����������������������������������������������������������������
77 FKTYPE PIC S9(5) COMP-4.
77 FKNUM PIC S9(5) COMP-4.
77 NUM PIC S9(5) COMP-4.
77 STRING-LENGTH PIC S9(5) COMP-4.
77 X PIC S9(4)V9 COMP-3.
77 Y PIC S9(4)V9 COMP-3.
77 COMPNUMBER PIC S9(5) COMP-4.
77 XINT1 PIC S9(4)V9 COMP-3.
77 XINT2 PIC S9(4)V9 COMP-3.
77 YINT1 PIC S9(4)V9 COMP-3.
77 YINT2 PIC S9(4)V9 COMP-3.
77 ROW1 PIC S9(5) COMP-4.
77 ROW2 PIC S9(5) COMP-4.
77 COL1 PIC S9(5) COMP-4.
6-28 AS/400 GDDM Programming Guide
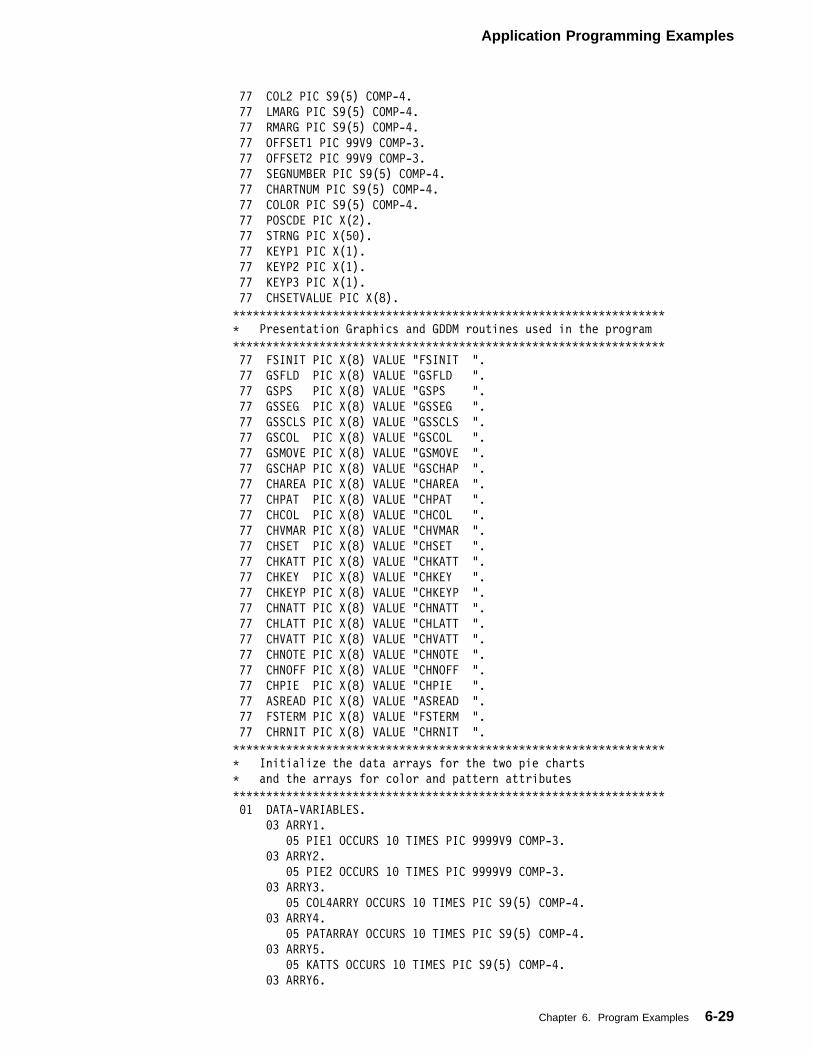
Application Programming Examples
77 COL2 PIC S9(5) COMP-4.
77 LMARG PIC S9(5) COMP-4.
77 RMARG PIC S9(5) COMP-4.
77 OFFSET1 PIC 99V9 COMP-3.
77 OFFSET2 PIC 99V9 COMP-3.
77 SEGNUMBER PIC S9(5) COMP-4.
77 CHARTNUM PIC S9(5) COMP-4.
77 COLOR PIC S9(5) COMP-4.
77 POSCDE PIC X(2).
77 STRNG PIC X(5�).
77 KEYP1 PIC X(1).
77 KEYP2 PIC X(1).
77 KEYP3 PIC X(1).
77 CHSETVALUE PIC X(8).
�����������������������������������������������������������������
� Presentation Graphics and GDDM routines used in the program
�����������������������������������������������������������������
77 FSINIT PIC X(8) VALUE "FSINIT ".
77 GSFLD PIC X(8) VALUE "GSFLD ".
77 GSPS PIC X(8) VALUE "GSPS ".
77 GSSEG PIC X(8) VALUE "GSSEG ".
77 GSSCLS PIC X(8) VALUE "GSSCLS ".
77 GSCOL PIC X(8) VALUE "GSCOL ".
77 GSMOVE PIC X(8) VALUE "GSMOVE ".
77 GSCHAP PIC X(8) VALUE "GSCHAP ".
77 CHAREA PIC X(8) VALUE "CHAREA ".
77 CHPAT PIC X(8) VALUE "CHPAT ".
77 CHCOL PIC X(8) VALUE "CHCOL ".
77 CHVMAR PIC X(8) VALUE "CHVMAR ".
77 CHSET PIC X(8) VALUE "CHSET ".
77 CHKATT PIC X(8) VALUE "CHKATT ".
77 CHKEY PIC X(8) VALUE "CHKEY ".
77 CHKEYP PIC X(8) VALUE "CHKEYP ".
77 CHNATT PIC X(8) VALUE "CHNATT ".
77 CHLATT PIC X(8) VALUE "CHLATT ".
77 CHVATT PIC X(8) VALUE "CHVATT ".
77 CHNOTE PIC X(8) VALUE "CHNOTE ".
77 CHNOFF PIC X(8) VALUE "CHNOFF ".
77 CHPIE PIC X(8) VALUE "CHPIE ".
77 ASREAD PIC X(8) VALUE "ASREAD ".
77 FSTERM PIC X(8) VALUE "FSTERM ".
77 CHRNIT PIC X(8) VALUE "CHRNIT ".
�����������������������������������������������������������������
� Initialize the data arrays for the two pie charts
� and the arrays for color and pattern attributes
�����������������������������������������������������������������
�1 DATA-VARIABLES.
�3 ARRY1.
�5 PIE1 OCCURS 1� TIMES PIC 9999V9 COMP-3.
�3 ARRY2.
�5 PIE2 OCCURS 1� TIMES PIC 9999V9 COMP-3.
�3 ARRY3.
�5 COL4ARRY OCCURS 1� TIMES PIC S9(5) COMP-4.
�3 ARRY4.
�5 PATARRAY OCCURS 1� TIMES PIC S9(5) COMP-4.
�3 ARRY5.
�5 KATTS OCCURS 1� TIMES PIC S9(5) COMP-4.
�3 ARRY6.
Chapter 6. Program Examples 6-29
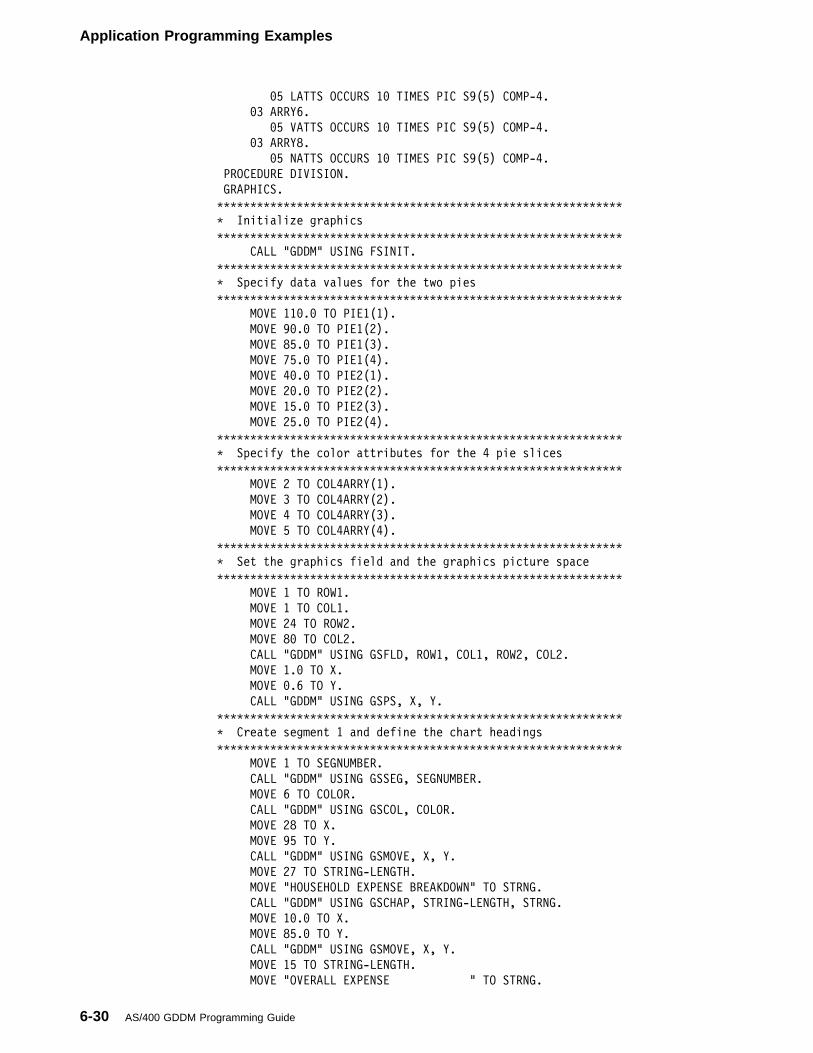
Application Programming Examples
�5 LATTS OCCURS 1� TIMES PIC S9(5) COMP-4.
�3 ARRY6.
�5 VATTS OCCURS 1� TIMES PIC S9(5) COMP-4.
�3 ARRY8.
�5 NATTS OCCURS 1� TIMES PIC S9(5) COMP-4.
PROCEDURE DIVISION.
GRAPHICS.
�������������������������������������������������������������
� Initialize graphics
�������������������������������������������������������������
CALL "GDDM" USING FSINIT.
�������������������������������������������������������������
� Specify data values for the two pies
�������������������������������������������������������������
MOVE 11�.� TO PIE1(1).
MOVE 9�.� TO PIE1(2).
MOVE 85.� TO PIE1(3).
MOVE 75.� TO PIE1(4).
MOVE 4�.� TO PIE2(1).
MOVE 2�.� TO PIE2(2).
MOVE 15.� TO PIE2(3).
MOVE 25.� TO PIE2(4).
�������������������������������������������������������������
� Specify the color attributes for the 4 pie slices
�������������������������������������������������������������
MOVE 2 TO COL4ARRY(1).
MOVE 3 TO COL4ARRY(2).
MOVE 4 TO COL4ARRY(3).
MOVE 5 TO COL4ARRY(4).
�������������������������������������������������������������
� Set the graphics field and the graphics picture space
�������������������������������������������������������������
MOVE 1 TO ROW1.
MOVE 1 TO COL1.
MOVE 24 TO ROW2.
MOVE 8� TO COL2.
CALL "GDDM" USING GSFLD, ROW1, COL1, ROW2, COL2.
MOVE 1.� TO X.
MOVE �.6 TO Y.
CALL "GDDM" USING GSPS, X, Y.
�������������������������������������������������������������
� Create segment 1 and define the chart headings
�������������������������������������������������������������
MOVE 1 TO SEGNUMBER.
CALL "GDDM" USING GSSEG, SEGNUMBER.
MOVE 6 TO COLOR.
CALL "GDDM" USING GSCOL, COLOR.
MOVE 28 TO X.
MOVE 95 TO Y.
CALL "GDDM" USING GSMOVE, X, Y.
MOVE 27 TO STRING-LENGTH.
MOVE "HOUSEHOLD EXPENSE BREAKDOWN" TO STRNG.
CALL "GDDM" USING GSCHAP, STRING-LENGTH, STRNG.
MOVE 1�.� TO X.
MOVE 85.� TO Y.
CALL "GDDM" USING GSMOVE, X, Y.
MOVE 15 TO STRING-LENGTH.
MOVE "OVERALL EXPENSE " TO STRNG.
6-30 AS/400 GDDM Programming Guide
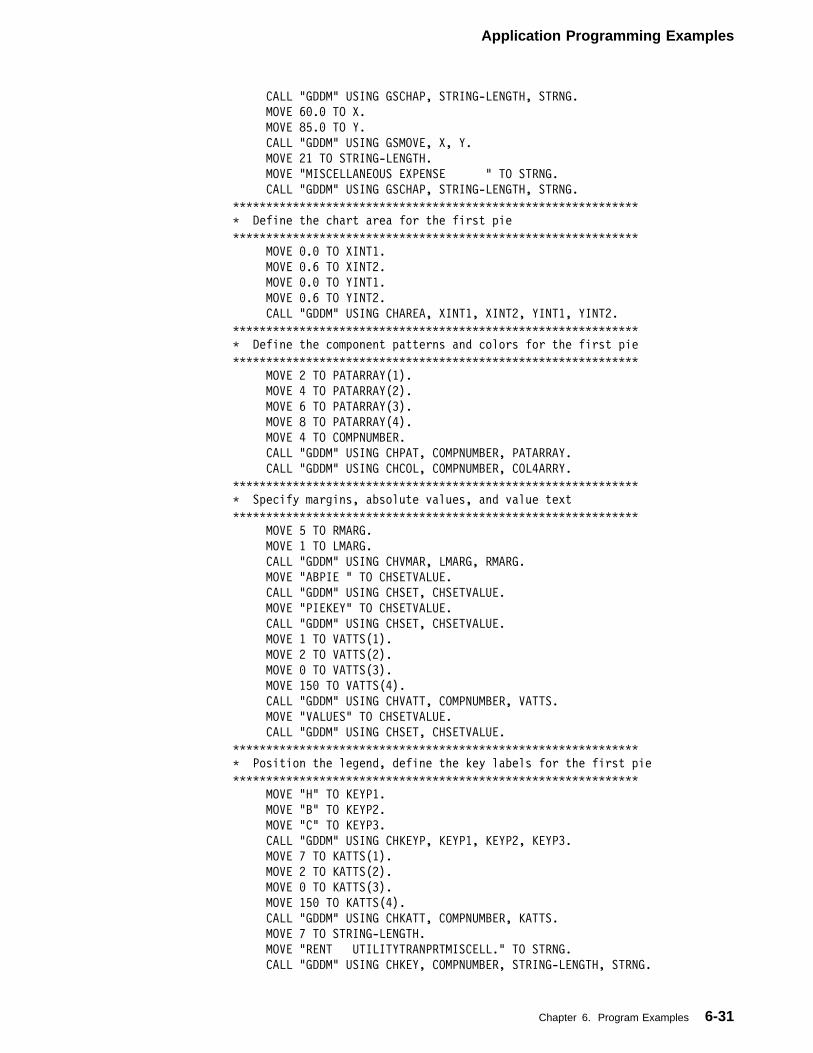
Application Programming Examples
CALL "GDDM" USING GSCHAP, STRING-LENGTH, STRNG.
MOVE 6�.� TO X.
MOVE 85.� TO Y.
CALL "GDDM" USING GSMOVE, X, Y.
MOVE 21 TO STRING-LENGTH.
MOVE "MISCELLANEOUS EXPENSE " TO STRNG.
CALL "GDDM" USING GSCHAP, STRING-LENGTH, STRNG.
�������������������������������������������������������������
� Define the chart area for the first pie
�������������������������������������������������������������
MOVE �.� TO XINT1.
MOVE �.6 TO XINT2.
MOVE �.� TO YINT1.
MOVE �.6 TO YINT2.
CALL "GDDM" USING CHAREA, XINT1, XINT2, YINT1, YINT2.
�������������������������������������������������������������
� Define the component patterns and colors for the first pie
�������������������������������������������������������������
MOVE 2 TO PATARRAY(1).
MOVE 4 TO PATARRAY(2).
MOVE 6 TO PATARRAY(3).
MOVE 8 TO PATARRAY(4).
MOVE 4 TO COMPNUMBER.
CALL "GDDM" USING CHPAT, COMPNUMBER, PATARRAY.
CALL "GDDM" USING CHCOL, COMPNUMBER, COL4ARRY.
�������������������������������������������������������������
� Specify margins, absolute values, and value text
�������������������������������������������������������������
MOVE 5 TO RMARG.
MOVE 1 TO LMARG.
CALL "GDDM" USING CHVMAR, LMARG, RMARG.
MOVE "ABPIE " TO CHSETVALUE.
CALL "GDDM" USING CHSET, CHSETVALUE.
MOVE "PIEKEY" TO CHSETVALUE.
CALL "GDDM" USING CHSET, CHSETVALUE.
MOVE 1 TO VATTS(1).
MOVE 2 TO VATTS(2).
MOVE � TO VATTS(3).
MOVE 15� TO VATTS(4).
CALL "GDDM" USING CHVATT, COMPNUMBER, VATTS.
MOVE "VALUES" TO CHSETVALUE.
CALL "GDDM" USING CHSET, CHSETVALUE.
�������������������������������������������������������������
� Position the legend, define the key labels for the first pie
�������������������������������������������������������������
MOVE "H" TO KEYP1.
MOVE "B" TO KEYP2.
MOVE "C" TO KEYP3.
CALL "GDDM" USING CHKEYP, KEYP1, KEYP2, KEYP3.
MOVE 7 TO KATTS(1).
MOVE 2 TO KATTS(2).
MOVE � TO KATTS(3).
MOVE 15� TO KATTS(4).
CALL "GDDM" USING CHKATT, COMPNUMBER, KATTS.
MOVE 7 TO STRING-LENGTH.
MOVE "RENT UTILITYTRANPRTMISCELL." TO STRNG.
CALL "GDDM" USING CHKEY, COMPNUMBER, STRING-LENGTH, STRNG.
Chapter 6. Program Examples 6-31
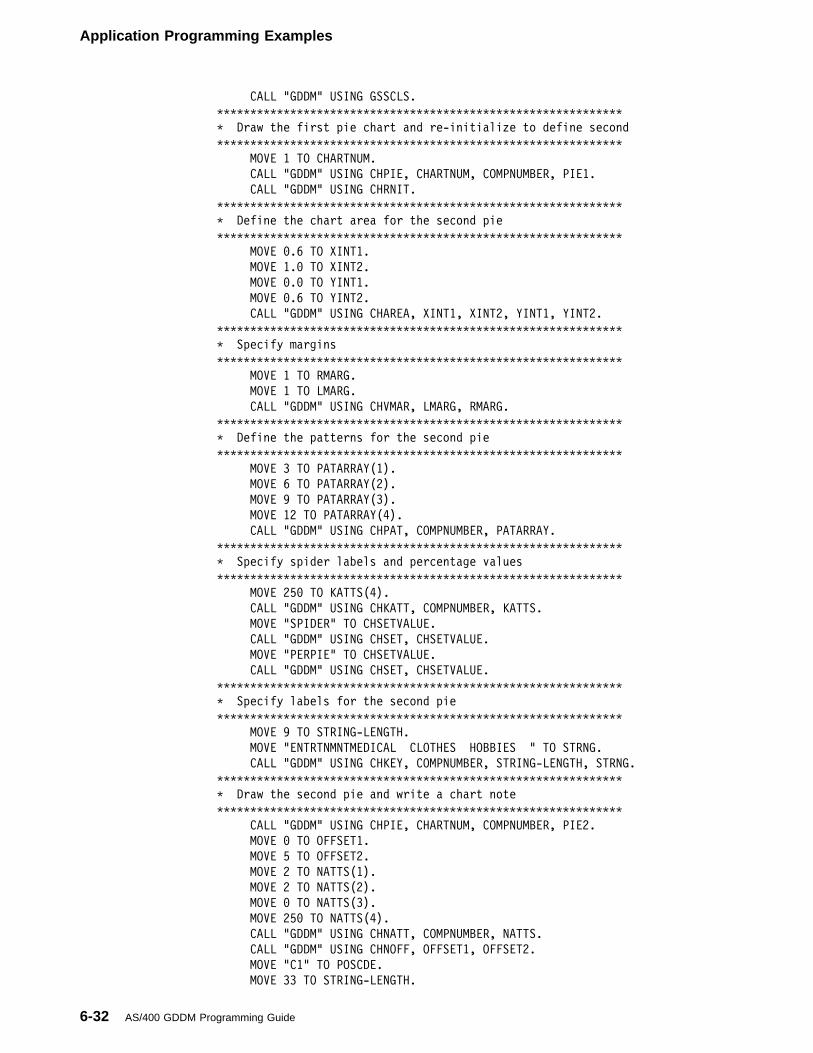
Application Programming Examples
CALL "GDDM" USING GSSCLS.
�������������������������������������������������������������
� Draw the first pie chart and re-initialize to define second
�������������������������������������������������������������
MOVE 1 TO CHARTNUM.
CALL "GDDM" USING CHPIE, CHARTNUM, COMPNUMBER, PIE1.
CALL "GDDM" USING CHRNIT.
�������������������������������������������������������������
� Define the chart area for the second pie
�������������������������������������������������������������
MOVE �.6 TO XINT1.
MOVE 1.� TO XINT2.
MOVE �.� TO YINT1.
MOVE �.6 TO YINT2.
CALL "GDDM" USING CHAREA, XINT1, XINT2, YINT1, YINT2.
�������������������������������������������������������������
� Specify margins
�������������������������������������������������������������
MOVE 1 TO RMARG.
MOVE 1 TO LMARG.
CALL "GDDM" USING CHVMAR, LMARG, RMARG.
�������������������������������������������������������������
� Define the patterns for the second pie
�������������������������������������������������������������
MOVE 3 TO PATARRAY(1).
MOVE 6 TO PATARRAY(2).
MOVE 9 TO PATARRAY(3).
MOVE 12 TO PATARRAY(4).
CALL "GDDM" USING CHPAT, COMPNUMBER, PATARRAY.
�������������������������������������������������������������
� Specify spider labels and percentage values
�������������������������������������������������������������
MOVE 25� TO KATTS(4).
CALL "GDDM" USING CHKATT, COMPNUMBER, KATTS.
MOVE "SPIDER" TO CHSETVALUE.
CALL "GDDM" USING CHSET, CHSETVALUE.
MOVE "PERPIE" TO CHSETVALUE.
CALL "GDDM" USING CHSET, CHSETVALUE.
�������������������������������������������������������������
� Specify labels for the second pie
�������������������������������������������������������������
MOVE 9 TO STRING-LENGTH.
MOVE "ENTRTNMNTMEDICAL CLOTHES HOBBIES " TO STRNG.
CALL "GDDM" USING CHKEY, COMPNUMBER, STRING-LENGTH, STRNG.
�������������������������������������������������������������
� Draw the second pie and write a chart note
�������������������������������������������������������������
CALL "GDDM" USING CHPIE, CHARTNUM, COMPNUMBER, PIE2.
MOVE � TO OFFSET1.
MOVE 5 TO OFFSET2.
MOVE 2 TO NATTS(1).
MOVE 2 TO NATTS(2).
MOVE � TO NATTS(3).
MOVE 25� TO NATTS(4).
CALL "GDDM" USING CHNATT, COMPNUMBER, NATTS.
CALL "GDDM" USING CHNOFF, OFFSET1, OFFSET2.
MOVE "C1" TO POSCDE.
MOVE 33 TO STRING-LENGTH.
6-32 AS/400 GDDM Programming Guide
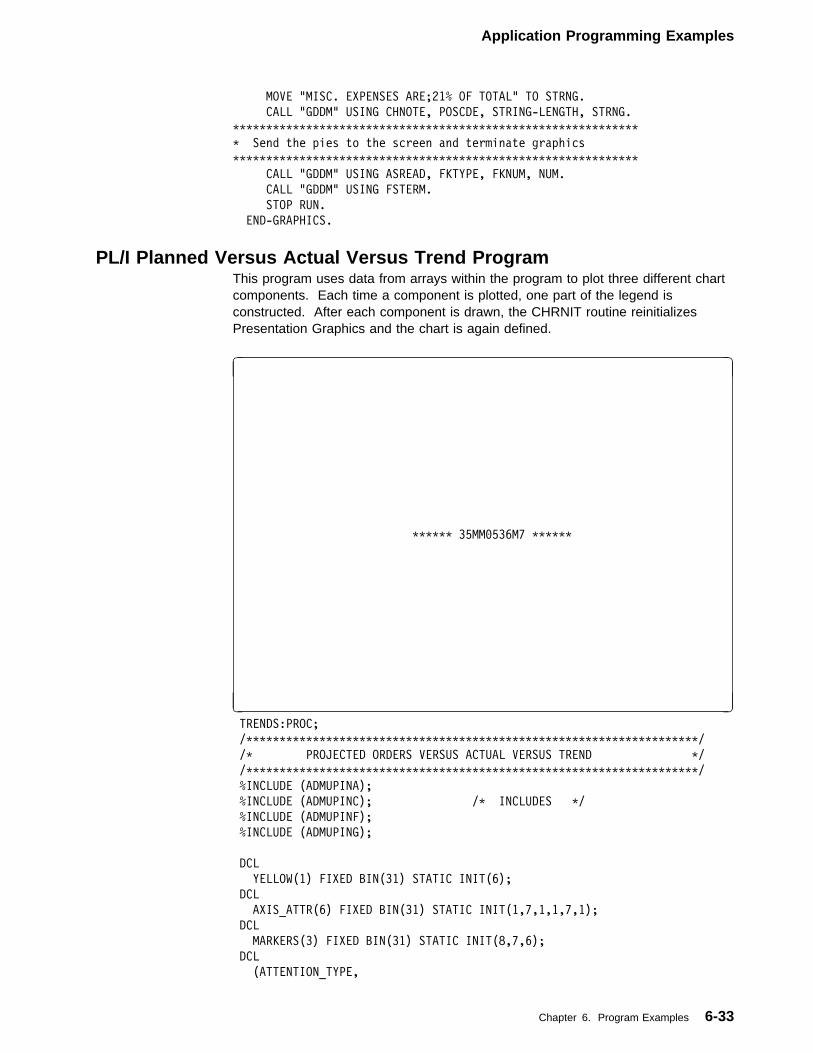
Application Programming Examples
MOVE "MISC. EXPENSES ARE;21% OF TOTAL" TO STRNG.
CALL "GDDM" USING CHNOTE, POSCDE, STRING-LENGTH, STRNG.
�������������������������������������������������������������
� Send the pies to the screen and terminate graphics
�������������������������������������������������������������
CALL "GDDM" USING ASREAD, FKTYPE, FKNUM, NUM.
CALL "GDDM" USING FSTERM.
STOP RUN.
END-GRAPHICS.
PL/I Planned Versus Actual Versus Trend ProgramThis program uses data from arrays within the program to plot three different chartcomponents. Each time a component is plotted, one part of the legend isconstructed. After each component is drawn, the CHRNIT routine reinitializesPresentation Graphics and the chart is again defined.
�
������ 35MM�536M7 ������
� � TRENDS:PROC;
/��������������������������������������������������������������������/
/� PROJECTED ORDERS VERSUS ACTUAL VERSUS TREND �/
/��������������������������������������������������������������������/
%INCLUDE (ADMUPINA);
%INCLUDE (ADMUPINC); /� INCLUDES �/
%INCLUDE (ADMUPINF);
%INCLUDE (ADMUPING);
DCL
YELLOW(1) FIXED BIN(31) STATIC INIT(6);
DCL
AXIS_ATTR(6) FIXED BIN(31) STATIC INIT(1,7,1,1,7,1);
DCL
MARKERS(3) FIXED BIN(31) STATIC INIT(8,7,6);
DCL
(ATTENTION_TYPE,
Chapter 6. Program Examples 6-33
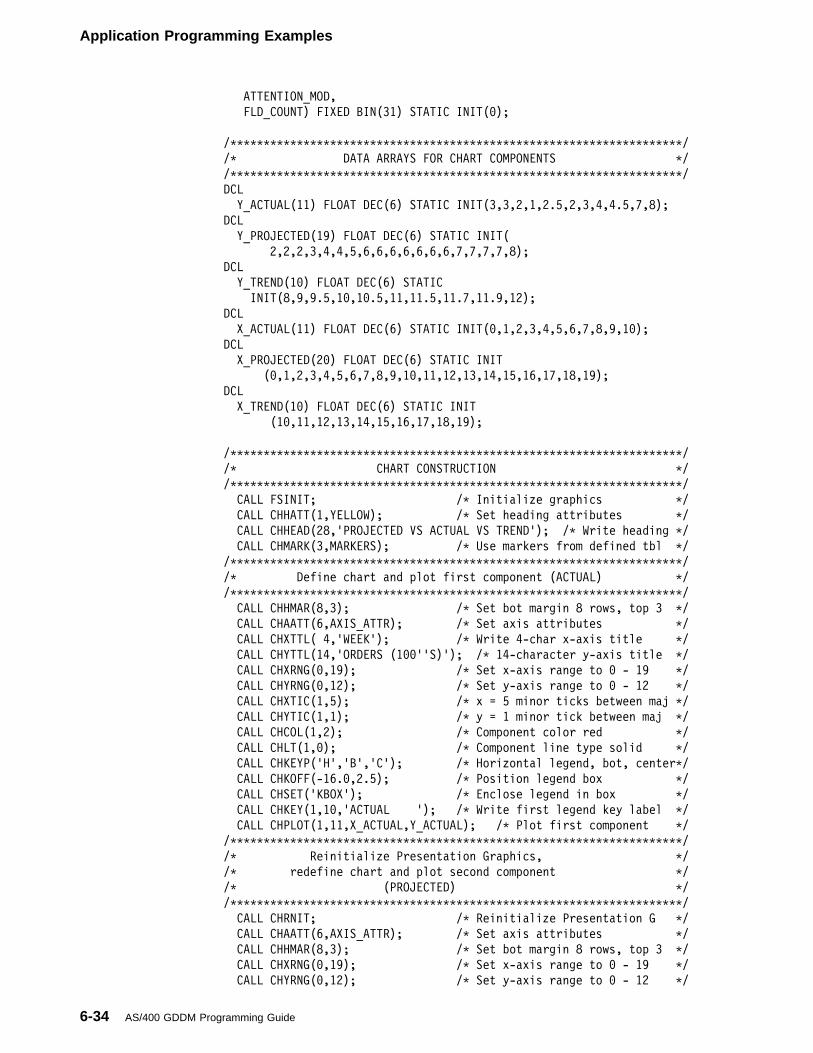
Application Programming Examples
ATTENTION_MOD,
FLD_COUNT) FIXED BIN(31) STATIC INIT(�);
/��������������������������������������������������������������������/
/� DATA ARRAYS FOR CHART COMPONENTS �/
/��������������������������������������������������������������������/
DCL
Y_ACTUAL(11) FLOAT DEC(6) STATIC INIT(3,3,2,1,2.5,2,3,4,4.5,7,8);
DCL
Y_PROJECTED(19) FLOAT DEC(6) STATIC INIT(
2,2,2,3,4,4,5,6,6,6,6,6,6,6,7,7,7,7,8);
DCL
Y_TREND(1�) FLOAT DEC(6) STATIC
INIT(8,9,9.5,1�,1�.5,11,11.5,11.7,11.9,12);
DCL
X_ACTUAL(11) FLOAT DEC(6) STATIC INIT(�,1,2,3,4,5,6,7,8,9,1�);
DCL
X_PROJECTED(2�) FLOAT DEC(6) STATIC INIT
(�,1,2,3,4,5,6,7,8,9,1�,11,12,13,14,15,16,17,18,19);
DCL
X_TREND(1�) FLOAT DEC(6) STATIC INIT
(1�,11,12,13,14,15,16,17,18,19);
/��������������������������������������������������������������������/
/� CHART CONSTRUCTION �/
/��������������������������������������������������������������������/
CALL FSINIT; /� Initialize graphics �/
CALL CHHATT(1,YELLOW); /� Set heading attributes �/
CALL CHHEAD(28,'PROJECTED VS ACTUAL VS TREND'); /� Write heading �/
CALL CHMARK(3,MARKERS); /� Use markers from defined tbl �/
/��������������������������������������������������������������������/
/� Define chart and plot first component (ACTUAL) �/
/��������������������������������������������������������������������/
CALL CHHMAR(8,3); /� Set bot margin 8 rows, top 3 �/
CALL CHAATT(6,AXIS_ATTR); /� Set axis attributes �/
CALL CHXTTL( 4,'WEEK'); /� Write 4-char x-axis title �/
CALL CHYTTL(14,'ORDERS (1��''S)'); /� 14-character y-axis title �/
CALL CHXRNG(�,19); /� Set x-axis range to � - 19 �/
CALL CHYRNG(�,12); /� Set y-axis range to � - 12 �/
CALL CHXTIC(1,5); /� x = 5 minor ticks between maj �/
CALL CHYTIC(1,1); /� y = 1 minor tick between maj �/
CALL CHCOL(1,2); /� Component color red �/
CALL CHLT(1,�); /� Component line type solid �/
CALL CHKEYP('H','B','C'); /� Horizontal legend, bot, center�/
CALL CHKOFF(-16.�,2.5); /� Position legend box �/
CALL CHSET('KBOX'); /� Enclose legend in box �/
CALL CHKEY(1,1�,'ACTUAL '); /� Write first legend key label �/
CALL CHPLOT(1,11,X_ACTUAL,Y_ACTUAL); /� Plot first component �/
/��������������������������������������������������������������������/
/� Reinitialize Presentation Graphics, �/
/� redefine chart and plot second component �/
/� (PROJECTED) �/
/��������������������������������������������������������������������/
CALL CHRNIT; /� Reinitialize Presentation G �/
CALL CHAATT(6,AXIS_ATTR); /� Set axis attributes �/
CALL CHHMAR(8,3); /� Set bot margin 8 rows, top 3 �/
CALL CHXRNG(�,19); /� Set x-axis range to � - 19 �/
CALL CHYRNG(�,12); /� Set y-axis range to � - 12 �/
6-34 AS/400 GDDM Programming Guide
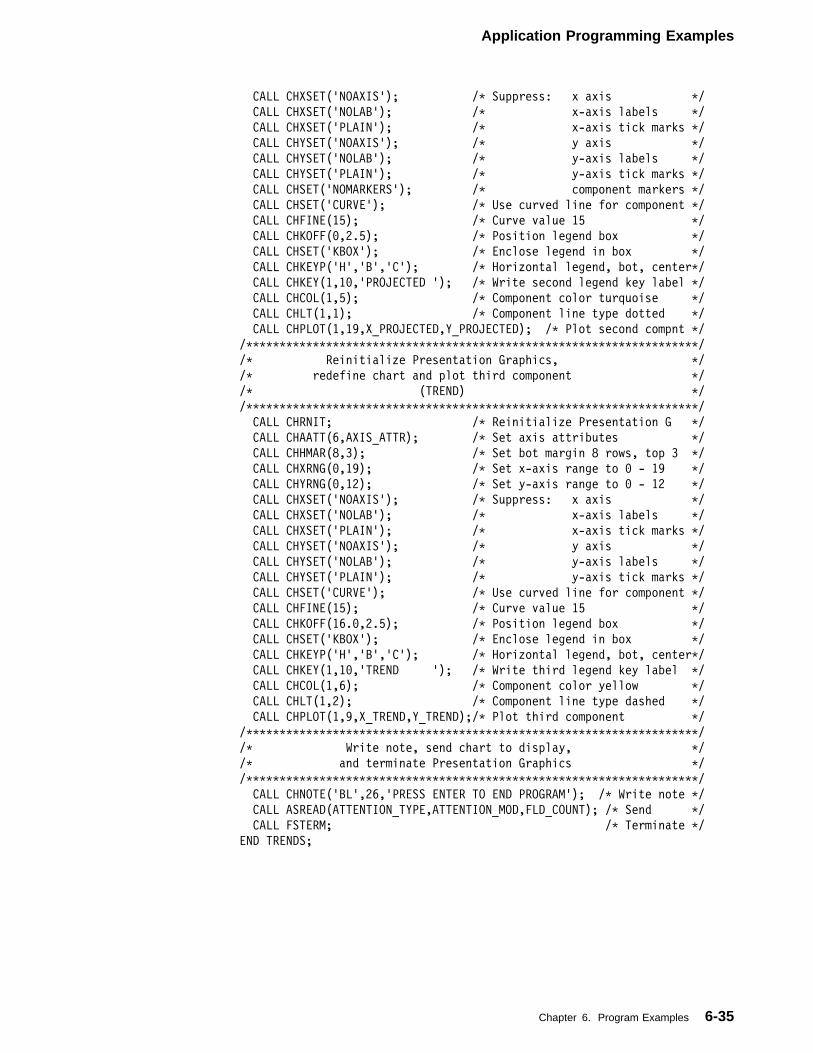
Application Programming Examples
CALL CHXSET('NOAXIS'); /� Suppress: x axis �/
CALL CHXSET('NOLAB'); /� x-axis labels �/
CALL CHXSET('PLAIN'); /� x-axis tick marks �/
CALL CHYSET('NOAXIS'); /� y axis �/
CALL CHYSET('NOLAB'); /� y-axis labels �/
CALL CHYSET('PLAIN'); /� y-axis tick marks �/
CALL CHSET('NOMARKERS'); /� component markers �/
CALL CHSET('CURVE'); /� Use curved line for component �/
CALL CHFINE(15); /� Curve value 15 �/
CALL CHKOFF(�,2.5); /� Position legend box �/
CALL CHSET('KBOX'); /� Enclose legend in box �/
CALL CHKEYP('H','B','C'); /� Horizontal legend, bot, center�/
CALL CHKEY(1,1�,'PROJECTED '); /� Write second legend key label �/
CALL CHCOL(1,5); /� Component color turquoise �/
CALL CHLT(1,1); /� Component line type dotted �/
CALL CHPLOT(1,19,X_PROJECTED,Y_PROJECTED); /� Plot second compnt �/
/��������������������������������������������������������������������/
/� Reinitialize Presentation Graphics, �/
/� redefine chart and plot third component �/
/� (TREND) �/
/��������������������������������������������������������������������/
CALL CHRNIT; /� Reinitialize Presentation G �/
CALL CHAATT(6,AXIS_ATTR); /� Set axis attributes �/
CALL CHHMAR(8,3); /� Set bot margin 8 rows, top 3 �/
CALL CHXRNG(�,19); /� Set x-axis range to � - 19 �/
CALL CHYRNG(�,12); /� Set y-axis range to � - 12 �/
CALL CHXSET('NOAXIS'); /� Suppress: x axis �/
CALL CHXSET('NOLAB'); /� x-axis labels �/
CALL CHXSET('PLAIN'); /� x-axis tick marks �/
CALL CHYSET('NOAXIS'); /� y axis �/
CALL CHYSET('NOLAB'); /� y-axis labels �/
CALL CHYSET('PLAIN'); /� y-axis tick marks �/
CALL CHSET('CURVE'); /� Use curved line for component �/
CALL CHFINE(15); /� Curve value 15 �/
CALL CHKOFF(16.�,2.5); /� Position legend box �/
CALL CHSET('KBOX'); /� Enclose legend in box �/
CALL CHKEYP('H','B','C'); /� Horizontal legend, bot, center�/
CALL CHKEY(1,1�,'TREND '); /� Write third legend key label �/
CALL CHCOL(1,6); /� Component color yellow �/
CALL CHLT(1,2); /� Component line type dashed �/
CALL CHPLOT(1,9,X_TREND,Y_TREND);/� Plot third component �/
/��������������������������������������������������������������������/
/� Write note, send chart to display, �/
/� and terminate Presentation Graphics �/
/��������������������������������������������������������������������/
CALL CHNOTE('BL',26,'PRESS ENTER TO END PROGRAM'); /� Write note �/
CALL ASREAD(ATTENTION_TYPE,ATTENTION_MOD,FLD_COUNT); /� Send �/
CALL FSTERM; /� Terminate �/
END TRENDS;
Chapter 6. Program Examples 6-35
Application Programming Examples
PL/I GDDM Color Table ApplicationThis program is useful for setting the color table for your program. If you add aroutine to your graphics program that selects color table entry 65 ('GSCT',65), youcan call this program from any of your graphics programs and set the color tablevalues used to display the picture interactively.
�
������ 35MM�536M8 ������
� �
This is the display file (named COLORS) used with the graphics program:
���������111111111122222222223333333333444444444455555555556666666666777777
123456789�123456789�123456789�123456789�123456789�123456789�123456789�12345
A DSPSIZ(24 8� �DS3)
A INDARA
A R COLORS
A CF�1(�1 'end the program')
A CF�2(�2 'return default color -
A values')
A ALWGPH
A OVERLAY
A 1 29'Color Selection Menu'
A COLOR(YLW)
A 3 2'Hue '
A COLOR(RED)
A FLD�65 3Y 2B 3 18EDTWRD('�. ')
A FLD�66 3Y 2B 3 27EDTWRD('�. ')
A FLD�67 3Y 2B 3 36EDTWRD('�. ')
A FLD�68 3Y 2B 3 45EDTWRD('�. ')
A FLD�69 3Y 2B 3 54EDTWRD('�. ')
A FLD�7� 3Y 2B 3 63EDTWRD('�. ')
A FLD�71 3Y 2B 3 72EDTWRD('�. ')
A 4 2'Lightness '
A COLOR(RED)
A FLD�72 3Y 2B 4 18EDTWRD('�. ')
A FLD�73 3Y 2B 4 27EDTWRD('�. ')
6-36 AS/400 GDDM Programming Guide
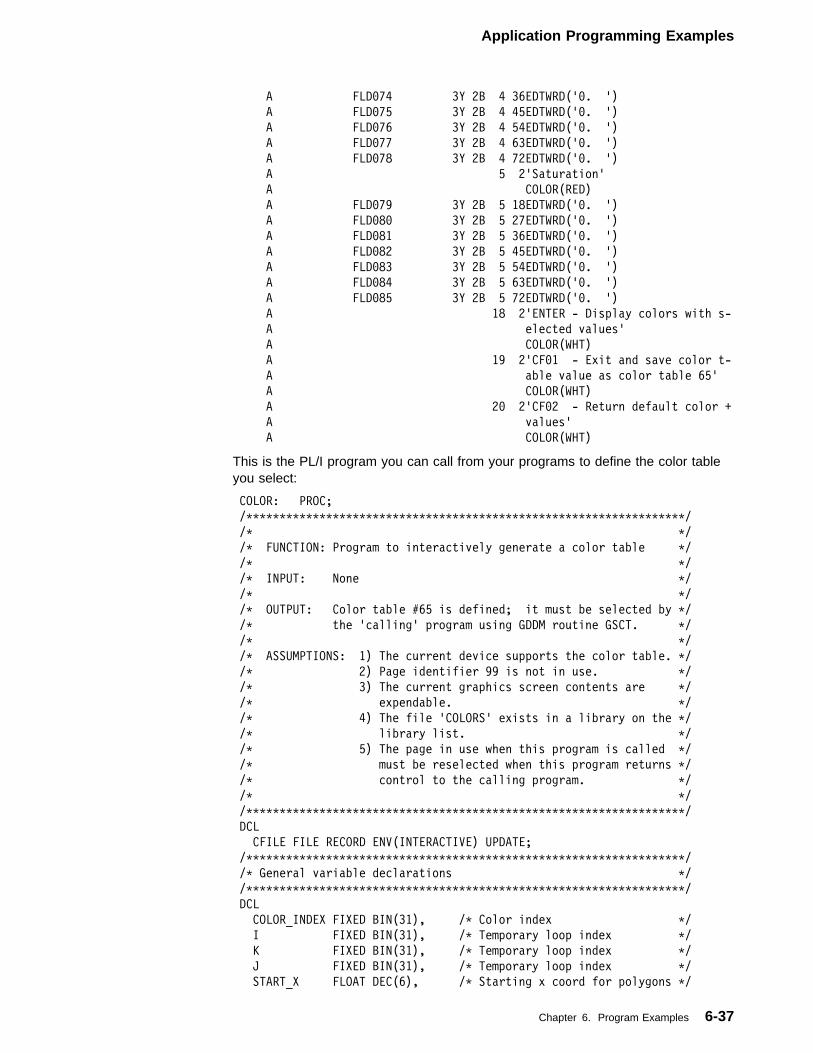
Application Programming Examples
A FLD�74 3Y 2B 4 36EDTWRD('�. ')
A FLD�75 3Y 2B 4 45EDTWRD('�. ')
A FLD�76 3Y 2B 4 54EDTWRD('�. ')
A FLD�77 3Y 2B 4 63EDTWRD('�. ')
A FLD�78 3Y 2B 4 72EDTWRD('�. ')
A 5 2'Saturation'
A COLOR(RED)
A FLD�79 3Y 2B 5 18EDTWRD('�. ')
A FLD�8� 3Y 2B 5 27EDTWRD('�. ')
A FLD�81 3Y 2B 5 36EDTWRD('�. ')
A FLD�82 3Y 2B 5 45EDTWRD('�. ')
A FLD�83 3Y 2B 5 54EDTWRD('�. ')
A FLD�84 3Y 2B 5 63EDTWRD('�. ')
A FLD�85 3Y 2B 5 72EDTWRD('�. ')
A 18 2'ENTER - Display colors with s-
A elected values'
A COLOR(WHT)
A 19 2'CF�1 - Exit and save color t-
A able value as color table 65'
A COLOR(WHT)
A 2� 2'CF�2 - Return default color +
A values'
A COLOR(WHT)
This is the PL/I program you can call from your programs to define the color tableyou select:
COLOR: PROC;
/������������������������������������������������������������������/
/� �/
/� FUNCTION: Program to interactively generate a color table �/
/� �/
/� INPUT: None �/
/� �/
/� OUTPUT: Color table #65 is defined; it must be selected by �/
/� the 'calling' program using GDDM routine GSCT. �/
/� �/
/� ASSUMPTIONS: 1) The current device supports the color table. �/
/� 2) Page identifier 99 is not in use. �/
/� 3) The current graphics screen contents are �/
/� expendable. �/
/� 4) The file 'COLORS' exists in a library on the �/
/� library list. �/
/� 5) The page in use when this program is called �/
/� must be reselected when this program returns �/
/� control to the calling program. �/
/� �/
/������������������������������������������������������������������/
DCL
CFILE FILE RECORD ENV(INTERACTIVE) UPDATE;
/������������������������������������������������������������������/
/� General variable declarations �/
/������������������������������������������������������������������/
DCL
COLOR_INDEX FIXED BIN(31), /� Color index �/
I FIXED BIN(31), /� Temporary loop index �/
K FIXED BIN(31), /� Temporary loop index �/
J FIXED BIN(31), /� Temporary loop index �/
START_X FLOAT DEC(6), /� Starting x coord for polygons �/
Chapter 6. Program Examples 6-37
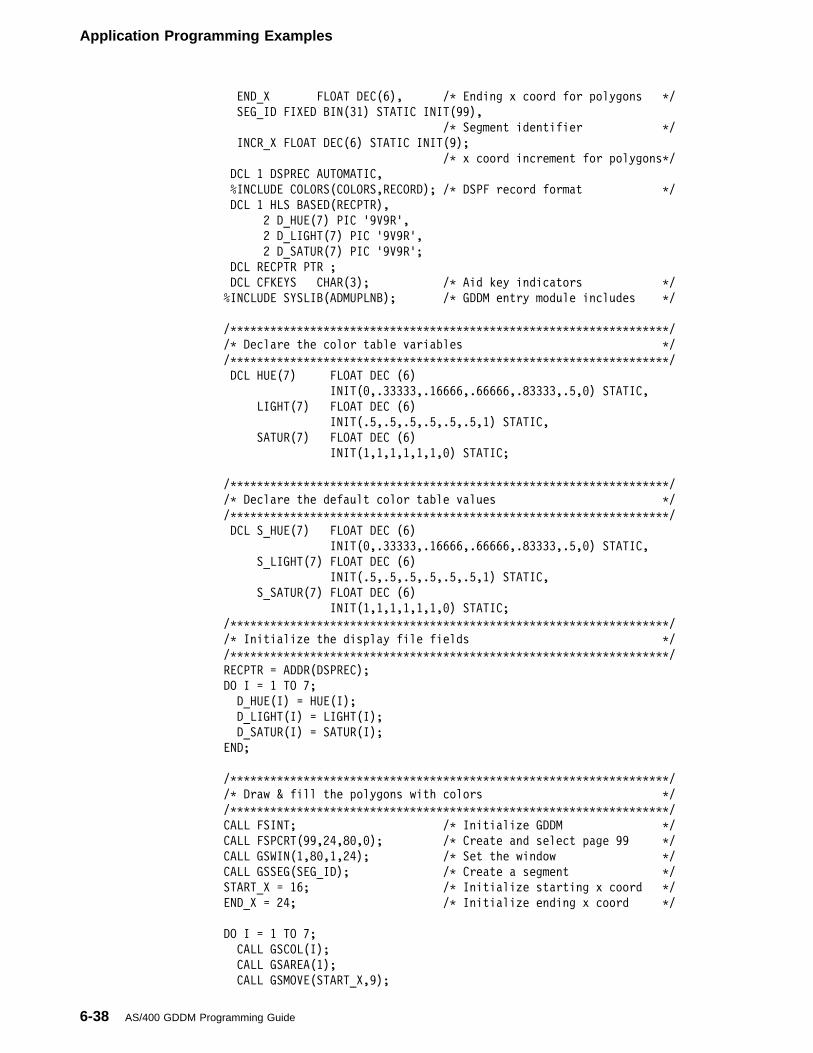
Application Programming Examples
END_X FLOAT DEC(6), /� Ending x coord for polygons �/
SEG_ID FIXED BIN(31) STATIC INIT(99),
/� Segment identifier �/
INCR_X FLOAT DEC(6) STATIC INIT(9);
/� x coord increment for polygons�/
DCL 1 DSPREC AUTOMATIC,
%INCLUDE COLORS(COLORS,RECORD); /� DSPF record format �/
DCL 1 HLS BASED(RECPTR),
2 D_HUE(7) PIC '9V9R',
2 D_LIGHT(7) PIC '9V9R',
2 D_SATUR(7) PIC '9V9R';
DCL RECPTR PTR ;
DCL CFKEYS CHAR(3); /� Aid key indicators �/
%INCLUDE SYSLIB(ADMUPLNB); /� GDDM entry module includes �/
/������������������������������������������������������������������/
/� Declare the color table variables �/
/������������������������������������������������������������������/
DCL HUE(7) FLOAT DEC (6)
INIT(�,.33333,.16666,.66666,.83333,.5,�) STATIC,
LIGHT(7) FLOAT DEC (6)
INIT(.5,.5,.5,.5,.5,.5,1) STATIC,
SATUR(7) FLOAT DEC (6)
INIT(1,1,1,1,1,1,�) STATIC;
/������������������������������������������������������������������/
/� Declare the default color table values �/
/������������������������������������������������������������������/
DCL S_HUE(7) FLOAT DEC (6)
INIT(�,.33333,.16666,.66666,.83333,.5,�) STATIC,
S_LIGHT(7) FLOAT DEC (6)
INIT(.5,.5,.5,.5,.5,.5,1) STATIC,
S_SATUR(7) FLOAT DEC (6)
INIT(1,1,1,1,1,1,�) STATIC;
/������������������������������������������������������������������/
/� Initialize the display file fields �/
/������������������������������������������������������������������/
RECPTR = ADDR(DSPREC);
DO I = 1 TO 7;
D_HUE(I) = HUE(I);
D_LIGHT(I) = LIGHT(I);
D_SATUR(I) = SATUR(I);
END;
/������������������������������������������������������������������/
/� Draw & fill the polygons with colors �/
/������������������������������������������������������������������/
CALL FSINT; /� Initialize GDDM �/
CALL FSPCRT(99,24,8�,�); /� Create and select page 99 �/
CALL GSWIN(1,8�,1,24); /� Set the window �/
CALL GSSEG(SEG_ID); /� Create a segment �/
START_X = 16; /� Initialize starting x coord �/
END_X = 24; /� Initialize ending x coord �/
DO I = 1 TO 7;
CALL GSCOL(I);
CALL GSAREA(1);
CALL GSMOVE(START_X,9);
6-38 AS/400 GDDM Programming Guide
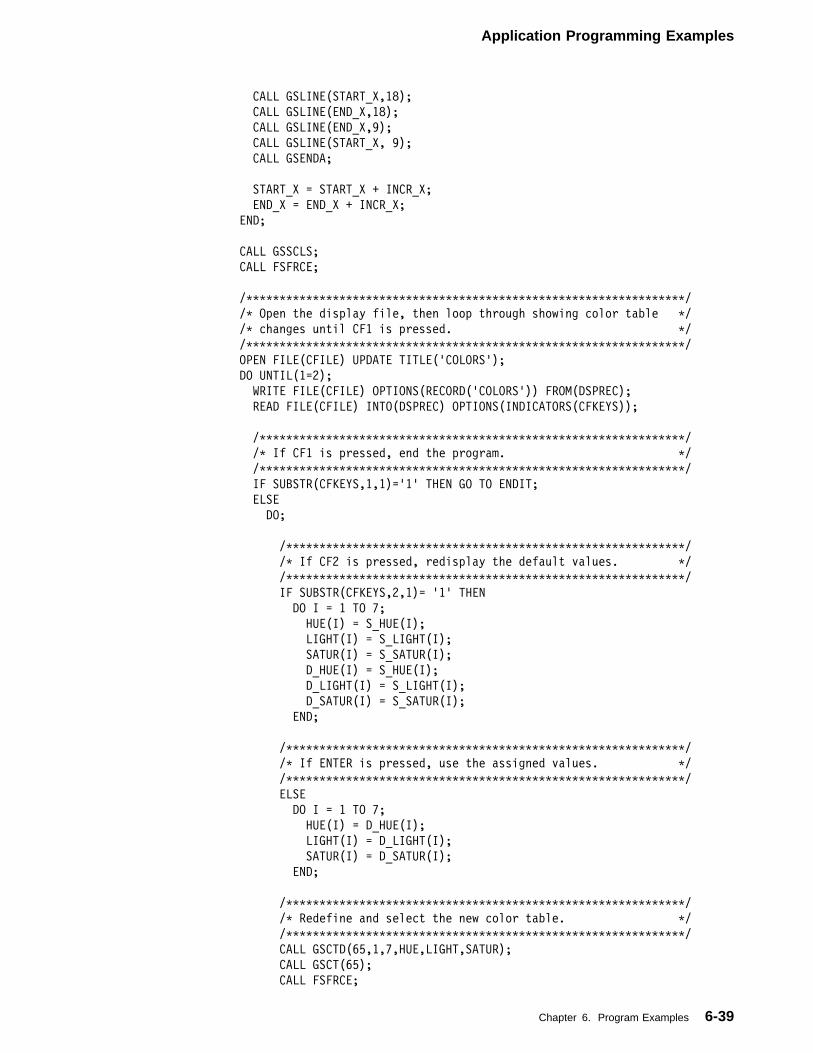
Application Programming Examples
CALL GSLINE(START_X,18);
CALL GSLINE(END_X,18);
CALL GSLINE(END_X,9);
CALL GSLINE(START_X, 9);
CALL GSENDA;
START_X = START_X + INCR_X;
END_X = END_X + INCR_X;
END;
CALL GSSCLS;
CALL FSFRCE;
/������������������������������������������������������������������/
/� Open the display file, then loop through showing color table �/
/� changes until CF1 is pressed. �/
/������������������������������������������������������������������/
OPEN FILE(CFILE) UPDATE TITLE('COLORS');
DO UNTIL(1=2);
WRITE FILE(CFILE) OPTIONS(RECORD('COLORS')) FROM(DSPREC);
READ FILE(CFILE) INTO(DSPREC) OPTIONS(INDICATORS(CFKEYS));
/����������������������������������������������������������������/
/� If CF1 is pressed, end the program. �/
/����������������������������������������������������������������/
IF SUBSTR(CFKEYS,1,1)='1' THEN GO TO ENDIT;
ELSE
DO;
/������������������������������������������������������������/
/� If CF2 is pressed, redisplay the default values. �/
/������������������������������������������������������������/
IF SUBSTR(CFKEYS,2,1)= '1' THEN
DO I = 1 TO 7;
HUE(I) = S_HUE(I);
LIGHT(I) = S_LIGHT(I);
SATUR(I) = S_SATUR(I);
D_HUE(I) = S_HUE(I);
D_LIGHT(I) = S_LIGHT(I);
D_SATUR(I) = S_SATUR(I);
END;
/������������������������������������������������������������/
/� If ENTER is pressed, use the assigned values. �/
/������������������������������������������������������������/
ELSE
DO I = 1 TO 7;
HUE(I) = D_HUE(I);
LIGHT(I) = D_LIGHT(I);
SATUR(I) = D_SATUR(I);
END;
/������������������������������������������������������������/
/� Redefine and select the new color table. �/
/������������������������������������������������������������/
CALL GSCTD(65,1,7,HUE,LIGHT,SATUR);
CALL GSCT(65);
CALL FSFRCE;
Chapter 6. Program Examples 6-39
Application Programming Examples
END;
END;
ENDIT:
CALL FSPDEL(99);
CLOSE FILE(CFILE);
END;
PL/I GDDM Order Form ApplicationThis is an example of graphics program used to enhance a menu. While this
| example does not contain programming for managing database files, a businessapplication modeled on this program could be used to update files on your system:
�
������ 35MM�536M9 ������
� �
���������111111111122222222223333333333444444444455555555556666666666777777
123456789�123456789�123456789�123456789�123456789�123456789�123456789�12345
A������������������������������������������������������������������
A�
A� TITLE: ORDERF
A�
A� DESCRIPTION: Display file used with the PL/I-GDDM order entry
A� application program 'ORDER'.
A�
A������������������������������������������������������������������
A�
A DSPSIZ(24 8� �DS3)
A INDARA
A R REC1
A������������������������������������������������������������������
A�
A� NOTE: The file or the record format(s) that are displayed
A� concurrently with graphics must use the ALWGPH keyword.
A�
A������������������������������������������������������������������
6-40 AS/400 GDDM Programming Guide
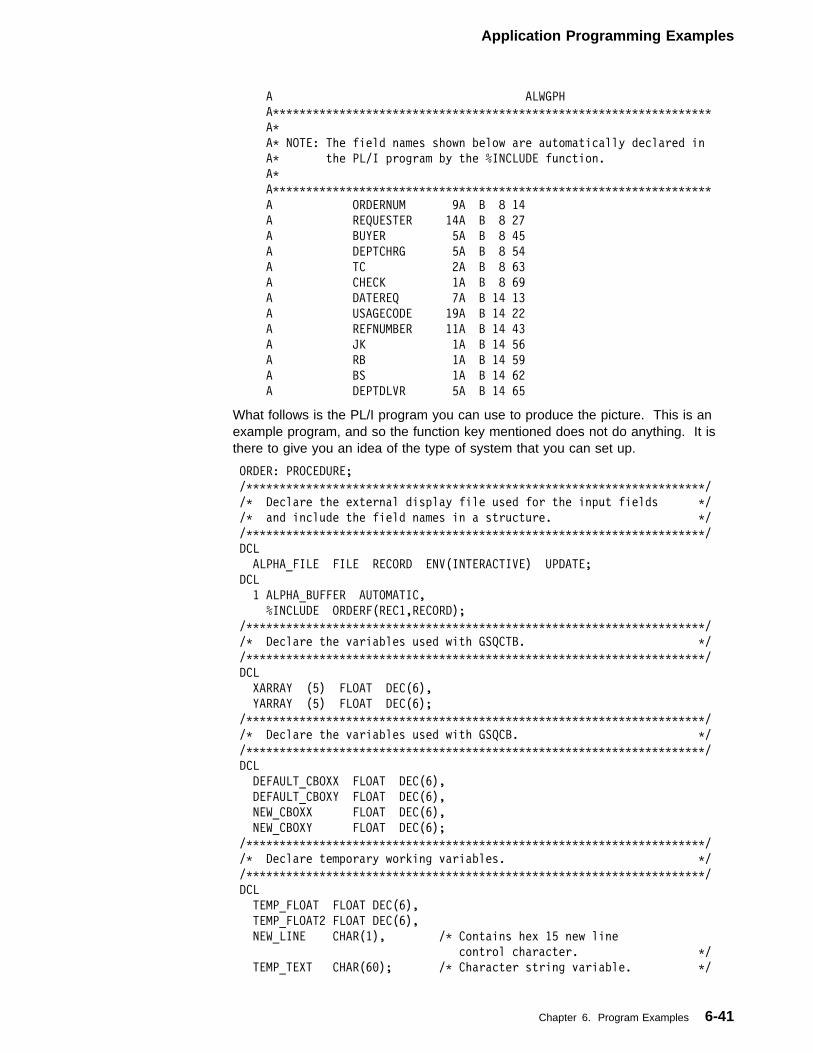
Application Programming Examples
A ALWGPH
A������������������������������������������������������������������
A�
A� NOTE: The field names shown below are automatically declared in
A� the PL/I program by the %INCLUDE function.
A�
A������������������������������������������������������������������
A ORDERNUM 9A B 8 14
A REQUESTER 14A B 8 27
A BUYER 5A B 8 45
A DEPTCHRG 5A B 8 54
A TC 2A B 8 63
A CHECK 1A B 8 69
A DATEREQ 7A B 14 13
A USAGECODE 19A B 14 22
A REFNUMBER 11A B 14 43
A JK 1A B 14 56
A RB 1A B 14 59
A BS 1A B 14 62
A DEPTDLVR 5A B 14 65
What follows is the PL/I program you can use to produce the picture. This is anexample program, and so the function key mentioned does not do anything. It isthere to give you an idea of the type of system that you can set up.
ORDER: PROCEDURE;
/���������������������������������������������������������������������/
/� Declare the external display file used for the input fields �/
/� and include the field names in a structure. �/
/���������������������������������������������������������������������/
DCL
ALPHA_FILE FILE RECORD ENV(INTERACTIVE) UPDATE;
DCL
1 ALPHA_BUFFER AUTOMATIC,
%INCLUDE ORDERF(REC1,RECORD);
/���������������������������������������������������������������������/
/� Declare the variables used with GSQCTB. �/
/���������������������������������������������������������������������/
DCL
XARRAY (5) FLOAT DEC(6),
YARRAY (5) FLOAT DEC(6);
/���������������������������������������������������������������������/
/� Declare the variables used with GSQCB. �/
/���������������������������������������������������������������������/
DCL
DEFAULT_CBOXX FLOAT DEC(6),
DEFAULT_CBOXY FLOAT DEC(6),
NEW_CBOXX FLOAT DEC(6),
NEW_CBOXY FLOAT DEC(6);
/���������������������������������������������������������������������/
/� Declare temporary working variables. �/
/���������������������������������������������������������������������/
DCL
TEMP_FLOAT FLOAT DEC(6),
TEMP_FLOAT2 FLOAT DEC(6),
NEW_LINE CHAR(1), /� Contains hex 15 new line
control character. �/
TEMP_TEXT CHAR(6�); /� Character string variable. �/
Chapter 6. Program Examples 6-41
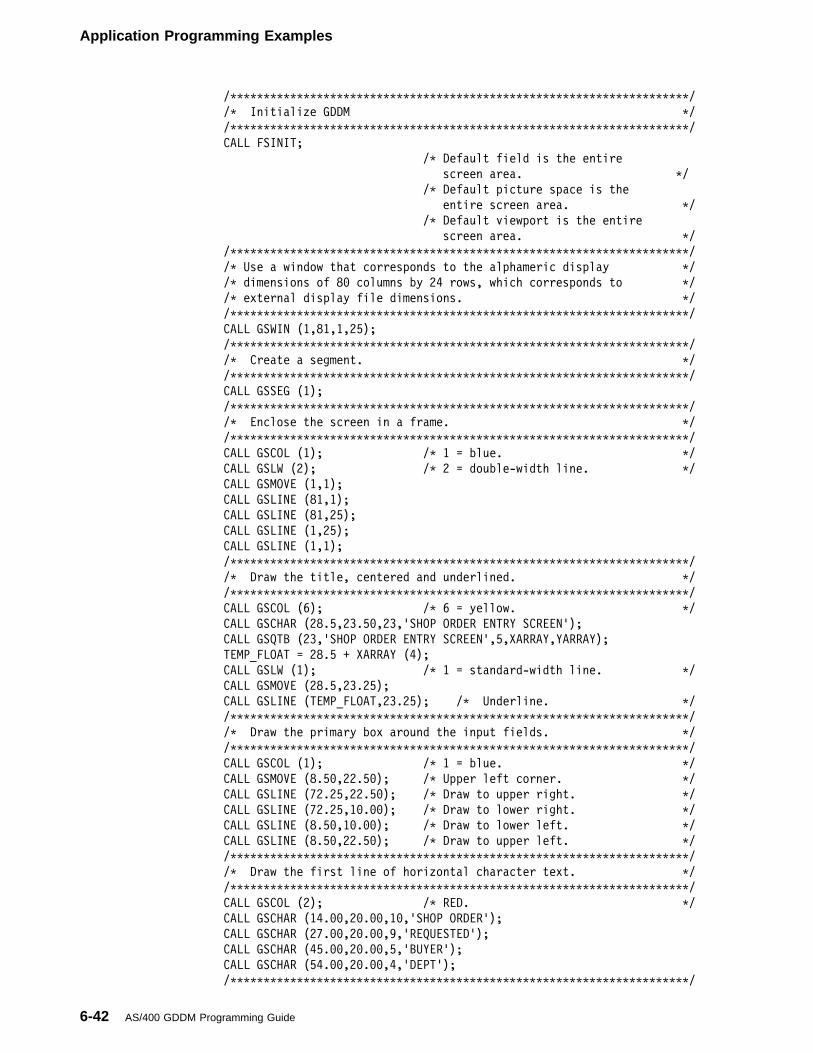
Application Programming Examples
/���������������������������������������������������������������������/
/� Initialize GDDM �/
/���������������������������������������������������������������������/
CALL FSINIT;
/� Default field is the entire
screen area. �/
/� Default picture space is the
entire screen area. �/
/� Default viewport is the entire
screen area. �/
/���������������������������������������������������������������������/
/� Use a window that corresponds to the alphameric display �/
/� dimensions of 8� columns by 24 rows, which corresponds to �/
/� external display file dimensions. �/
/���������������������������������������������������������������������/
CALL GSWIN (1,81,1,25);
/���������������������������������������������������������������������/
/� Create a segment. �/
/���������������������������������������������������������������������/
CALL GSSEG (1);
/���������������������������������������������������������������������/
/� Enclose the screen in a frame. �/
/���������������������������������������������������������������������/
CALL GSCOL (1); /� 1 = blue. �/
CALL GSLW (2); /� 2 = double-width line. �/
CALL GSMOVE (1,1);
CALL GSLINE (81,1);
CALL GSLINE (81,25);
CALL GSLINE (1,25);
CALL GSLINE (1,1);
/���������������������������������������������������������������������/
/� Draw the title, centered and underlined. �/
/���������������������������������������������������������������������/
CALL GSCOL (6); /� 6 = yellow. �/
CALL GSCHAR (28.5,23.5�,23,'SHOP ORDER ENTRY SCREEN');
CALL GSQTB (23,'SHOP ORDER ENTRY SCREEN',5,XARRAY,YARRAY);
TEMP_FLOAT = 28.5 + XARRAY (4);
CALL GSLW (1); /� 1 = standard-width line. �/
CALL GSMOVE (28.5,23.25);
CALL GSLINE (TEMP_FLOAT,23.25); /� Underline. �/
/���������������������������������������������������������������������/
/� Draw the primary box around the input fields. �/
/���������������������������������������������������������������������/
CALL GSCOL (1); /� 1 = blue. �/
CALL GSMOVE (8.5�,22.5�); /� Upper left corner. �/
CALL GSLINE (72.25,22.5�); /� Draw to upper right. �/
CALL GSLINE (72.25,1�.��); /� Draw to lower right. �/
CALL GSLINE (8.5�,1�.��); /� Draw to lower left. �/
CALL GSLINE (8.5�,22.5�); /� Draw to upper left. �/
/���������������������������������������������������������������������/
/� Draw the first line of horizontal character text. �/
/���������������������������������������������������������������������/
CALL GSCOL (2); /� RED. �/
CALL GSCHAR (14.��,2�.��,1�,'SHOP ORDER');
CALL GSCHAR (27.��,2�.��,9,'REQUESTED');
CALL GSCHAR (45.��,2�.��,5,'BUYER');
CALL GSCHAR (54.��,2�.��,4,'DEPT');
/���������������������������������������������������������������������/
6-42 AS/400 GDDM Programming Guide
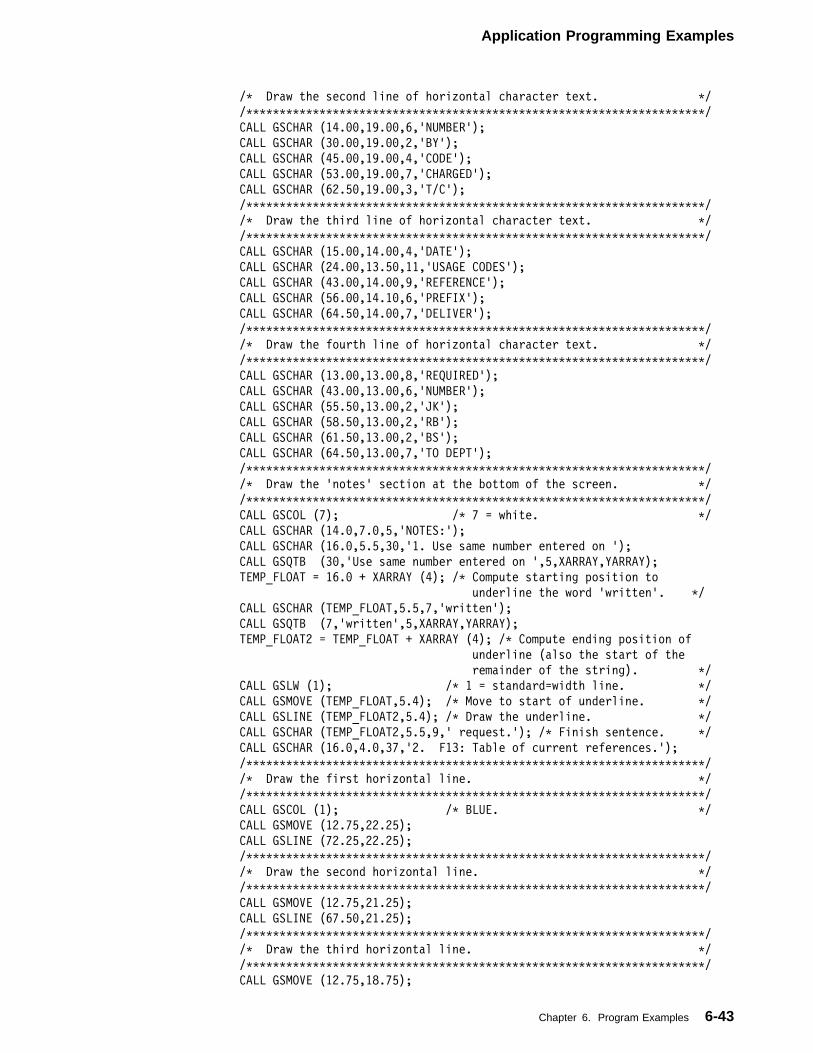
Application Programming Examples
/� Draw the second line of horizontal character text. �/
/���������������������������������������������������������������������/
CALL GSCHAR (14.��,19.��,6,'NUMBER');
CALL GSCHAR (3�.��,19.��,2,'BY');
CALL GSCHAR (45.��,19.��,4,'CODE');
CALL GSCHAR (53.��,19.��,7,'CHARGED');
CALL GSCHAR (62.5�,19.��,3,'T/C');
/���������������������������������������������������������������������/
/� Draw the third line of horizontal character text. �/
/���������������������������������������������������������������������/
CALL GSCHAR (15.��,14.��,4,'DATE');
CALL GSCHAR (24.��,13.5�,11,'USAGE CODES');
CALL GSCHAR (43.��,14.��,9,'REFERENCE');
CALL GSCHAR (56.��,14.1�,6,'PREFIX');
CALL GSCHAR (64.5�,14.��,7,'DELIVER');
/���������������������������������������������������������������������/
/� Draw the fourth line of horizontal character text. �/
/���������������������������������������������������������������������/
CALL GSCHAR (13.��,13.��,8,'REQUIRED');
CALL GSCHAR (43.��,13.��,6,'NUMBER');
CALL GSCHAR (55.5�,13.��,2,'JK');
CALL GSCHAR (58.5�,13.��,2,'RB');
CALL GSCHAR (61.5�,13.��,2,'BS');
CALL GSCHAR (64.5�,13.��,7,'TO DEPT');
/���������������������������������������������������������������������/
/� Draw the 'notes' section at the bottom of the screen. �/
/���������������������������������������������������������������������/
CALL GSCOL (7); /� 7 = white. �/
CALL GSCHAR (14.�,7.�,5,'NOTES:');
CALL GSCHAR (16.�,5.5,3�,'1. Use same number entered on ');
CALL GSQTB (3�,'Use same number entered on ',5,XARRAY,YARRAY);
TEMP_FLOAT = 16.� + XARRAY (4); /� Compute starting position to
underline the word 'written'. �/
CALL GSCHAR (TEMP_FLOAT,5.5,7,'written');
CALL GSQTB (7,'written',5,XARRAY,YARRAY);
TEMP_FLOAT2 = TEMP_FLOAT + XARRAY (4); /� Compute ending position of
underline (also the start of the
remainder of the string). �/
CALL GSLW (1); /� 1 = standard=width line. �/
CALL GSMOVE (TEMP_FLOAT,5.4); /� Move to start of underline. �/
CALL GSLINE (TEMP_FLOAT2,5.4); /� Draw the underline. �/
CALL GSCHAR (TEMP_FLOAT2,5.5,9,' request.'); /� Finish sentence. �/
CALL GSCHAR (16.�,4.�,37,'2. F13: Table of current references.');
/���������������������������������������������������������������������/
/� Draw the first horizontal line. �/
/���������������������������������������������������������������������/
CALL GSCOL (1); /� BLUE. �/
CALL GSMOVE (12.75,22.25);
CALL GSLINE (72.25,22.25);
/���������������������������������������������������������������������/
/� Draw the second horizontal line. �/
/���������������������������������������������������������������������/
CALL GSMOVE (12.75,21.25);
CALL GSLINE (67.5�,21.25);
/���������������������������������������������������������������������/
/� Draw the third horizontal line. �/
/���������������������������������������������������������������������/
CALL GSMOVE (12.75,18.75);
Chapter 6. Program Examples 6-43
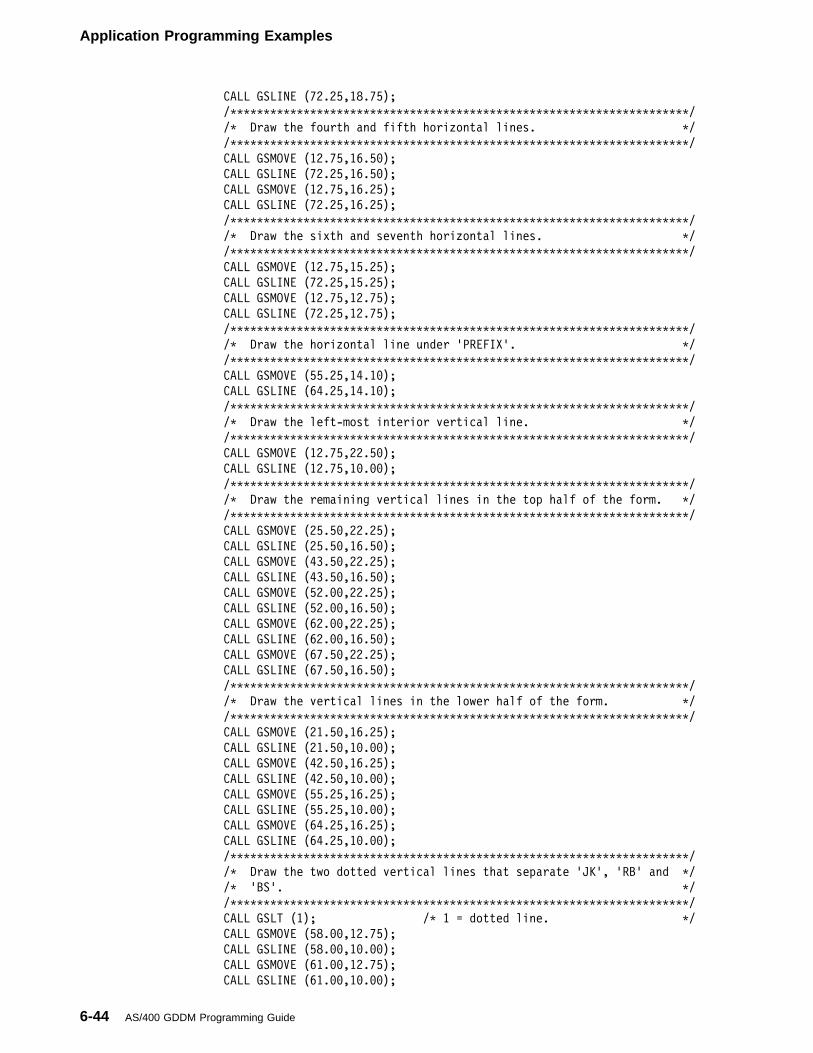
Application Programming Examples
CALL GSLINE (72.25,18.75);
/���������������������������������������������������������������������/
/� Draw the fourth and fifth horizontal lines. �/
/���������������������������������������������������������������������/
CALL GSMOVE (12.75,16.5�);
CALL GSLINE (72.25,16.5�);
CALL GSMOVE (12.75,16.25);
CALL GSLINE (72.25,16.25);
/���������������������������������������������������������������������/
/� Draw the sixth and seventh horizontal lines. �/
/���������������������������������������������������������������������/
CALL GSMOVE (12.75,15.25);
CALL GSLINE (72.25,15.25);
CALL GSMOVE (12.75,12.75);
CALL GSLINE (72.25,12.75);
/���������������������������������������������������������������������/
/� Draw the horizontal line under 'PREFIX'. �/
/���������������������������������������������������������������������/
CALL GSMOVE (55.25,14.1�);
CALL GSLINE (64.25,14.1�);
/���������������������������������������������������������������������/
/� Draw the left-most interior vertical line. �/
/���������������������������������������������������������������������/
CALL GSMOVE (12.75,22.5�);
CALL GSLINE (12.75,1�.��);
/���������������������������������������������������������������������/
/� Draw the remaining vertical lines in the top half of the form. �/
/���������������������������������������������������������������������/
CALL GSMOVE (25.5�,22.25);
CALL GSLINE (25.5�,16.5�);
CALL GSMOVE (43.5�,22.25);
CALL GSLINE (43.5�,16.5�);
CALL GSMOVE (52.��,22.25);
CALL GSLINE (52.��,16.5�);
CALL GSMOVE (62.��,22.25);
CALL GSLINE (62.��,16.5�);
CALL GSMOVE (67.5�,22.25);
CALL GSLINE (67.5�,16.5�);
/���������������������������������������������������������������������/
/� Draw the vertical lines in the lower half of the form. �/
/���������������������������������������������������������������������/
CALL GSMOVE (21.5�,16.25);
CALL GSLINE (21.5�,1�.��);
CALL GSMOVE (42.5�,16.25);
CALL GSLINE (42.5�,1�.��);
CALL GSMOVE (55.25,16.25);
CALL GSLINE (55.25,1�.��);
CALL GSMOVE (64.25,16.25);
CALL GSLINE (64.25,1�.��);
/���������������������������������������������������������������������/
/� Draw the two dotted vertical lines that separate 'JK', 'RB' and �/
/� 'BS'. �/
/���������������������������������������������������������������������/
CALL GSLT (1); /� 1 = dotted line. �/
CALL GSMOVE (58.��,12.75);
CALL GSLINE (58.��,1�.��);
CALL GSMOVE (61.��,12.75);
CALL GSLINE (61.��,1�.��);
6-44 AS/400 GDDM Programming Guide
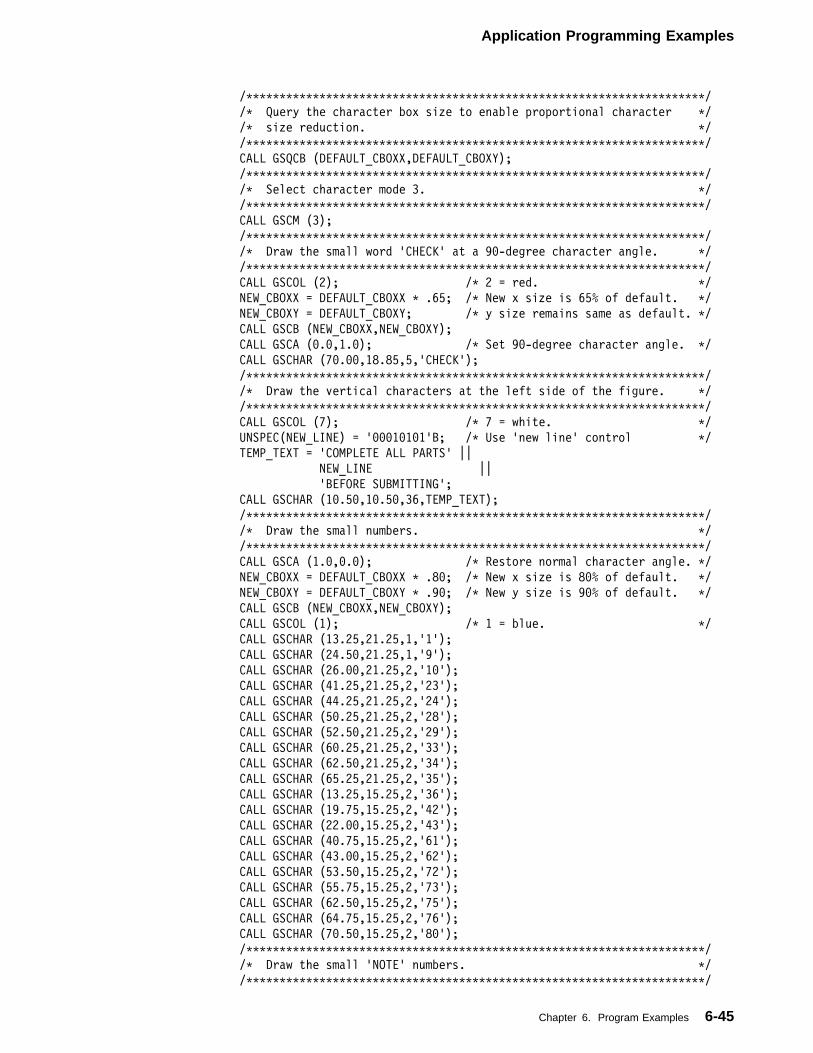
Application Programming Examples
/���������������������������������������������������������������������/
/� Query the character box size to enable proportional character �/
/� size reduction. �/
/���������������������������������������������������������������������/
CALL GSQCB (DEFAULT_CBOXX,DEFAULT_CBOXY);
/���������������������������������������������������������������������/
/� Select character mode 3. �/
/���������������������������������������������������������������������/
CALL GSCM (3);
/���������������������������������������������������������������������/
/� Draw the small word 'CHECK' at a 9�-degree character angle. �/
/���������������������������������������������������������������������/
CALL GSCOL (2); /� 2 = red. �/
NEW_CBOXX = DEFAULT_CBOXX � .65; /� New x size is 65% of default. �/
NEW_CBOXY = DEFAULT_CBOXY; /� y size remains same as default. �/
CALL GSCB (NEW_CBOXX,NEW_CBOXY);
CALL GSCA (�.�,1.�); /� Set 9�-degree character angle. �/
CALL GSCHAR (7�.��,18.85,5,'CHECK');
/���������������������������������������������������������������������/
/� Draw the vertical characters at the left side of the figure. �/
/���������������������������������������������������������������������/
CALL GSCOL (7); /� 7 = white. �/
UNSPEC(NEW_LINE) = '���1�1�1'B; /� Use 'new line' control �/
TEMP_TEXT = 'COMPLETE ALL PARTS' ||
NEW_LINE ||
'BEFORE SUBMITTING';
CALL GSCHAR (1�.5�,1�.5�,36,TEMP_TEXT);
/���������������������������������������������������������������������/
/� Draw the small numbers. �/
/���������������������������������������������������������������������/
CALL GSCA (1.�,�.�); /� Restore normal character angle. �/
NEW_CBOXX = DEFAULT_CBOXX � .8�; /� New x size is 8�% of default. �/
NEW_CBOXY = DEFAULT_CBOXY � .9�; /� New y size is 9�% of default. �/
CALL GSCB (NEW_CBOXX,NEW_CBOXY);
CALL GSCOL (1); /� 1 = blue. �/
CALL GSCHAR (13.25,21.25,1,'1');
CALL GSCHAR (24.5�,21.25,1,'9');
CALL GSCHAR (26.��,21.25,2,'1�');
CALL GSCHAR (41.25,21.25,2,'23');
CALL GSCHAR (44.25,21.25,2,'24');
CALL GSCHAR (5�.25,21.25,2,'28');
CALL GSCHAR (52.5�,21.25,2,'29');
CALL GSCHAR (6�.25,21.25,2,'33');
CALL GSCHAR (62.5�,21.25,2,'34');
CALL GSCHAR (65.25,21.25,2,'35');
CALL GSCHAR (13.25,15.25,2,'36');
CALL GSCHAR (19.75,15.25,2,'42');
CALL GSCHAR (22.��,15.25,2,'43');
CALL GSCHAR (4�.75,15.25,2,'61');
CALL GSCHAR (43.��,15.25,2,'62');
CALL GSCHAR (53.5�,15.25,2,'72');
CALL GSCHAR (55.75,15.25,2,'73');
CALL GSCHAR (62.5�,15.25,2,'75');
CALL GSCHAR (64.75,15.25,2,'76');
CALL GSCHAR (7�.5�,15.25,2,'8�');
/���������������������������������������������������������������������/
/� Draw the small 'NOTE' numbers. �/
/���������������������������������������������������������������������/
Chapter 6. Program Examples 6-45
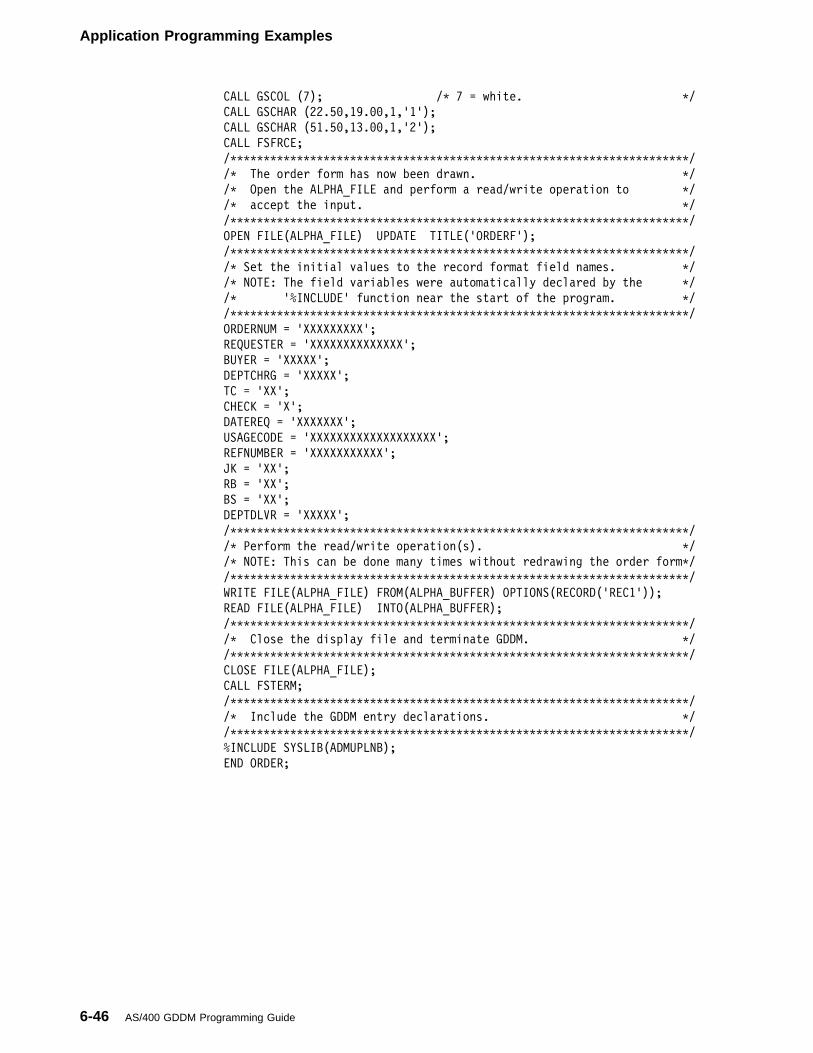
Application Programming Examples
CALL GSCOL (7); /� 7 = white. �/
CALL GSCHAR (22.5�,19.��,1,'1');
CALL GSCHAR (51.5�,13.��,1,'2');
CALL FSFRCE;
/���������������������������������������������������������������������/
/� The order form has now been drawn. �/
/� Open the ALPHA_FILE and perform a read/write operation to �/
/� accept the input. �/
/���������������������������������������������������������������������/
OPEN FILE(ALPHA_FILE) UPDATE TITLE('ORDERF');
/���������������������������������������������������������������������/
/� Set the initial values to the record format field names. �/
/� NOTE: The field variables were automatically declared by the �/
/� '%INCLUDE' function near the start of the program. �/
/���������������������������������������������������������������������/
ORDERNUM = 'XXXXXXXXX';
REQUESTER = 'XXXXXXXXXXXXXX';
BUYER = 'XXXXX';
DEPTCHRG = 'XXXXX';
TC = 'XX';
CHECK = 'X';
DATEREQ = 'XXXXXXX';
USAGECODE = 'XXXXXXXXXXXXXXXXXXX';
REFNUMBER = 'XXXXXXXXXXX';
JK = 'XX';
RB = 'XX';
BS = 'XX';
DEPTDLVR = 'XXXXX';
/���������������������������������������������������������������������/
/� Perform the read/write operation(s). �/
/� NOTE: This can be done many times without redrawing the order form�/
/���������������������������������������������������������������������/
WRITE FILE(ALPHA_FILE) FROM(ALPHA_BUFFER) OPTIONS(RECORD('REC1'));
READ FILE(ALPHA_FILE) INTO(ALPHA_BUFFER);
/���������������������������������������������������������������������/
/� Close the display file and terminate GDDM. �/
/���������������������������������������������������������������������/
CLOSE FILE(ALPHA_FILE);
CALL FSTERM;
/���������������������������������������������������������������������/
/� Include the GDDM entry declarations. �/
/���������������������������������������������������������������������/
%INCLUDE SYSLIB(ADMUPLNB);
END ORDER;
6-46 AS/400 GDDM Programming Guide
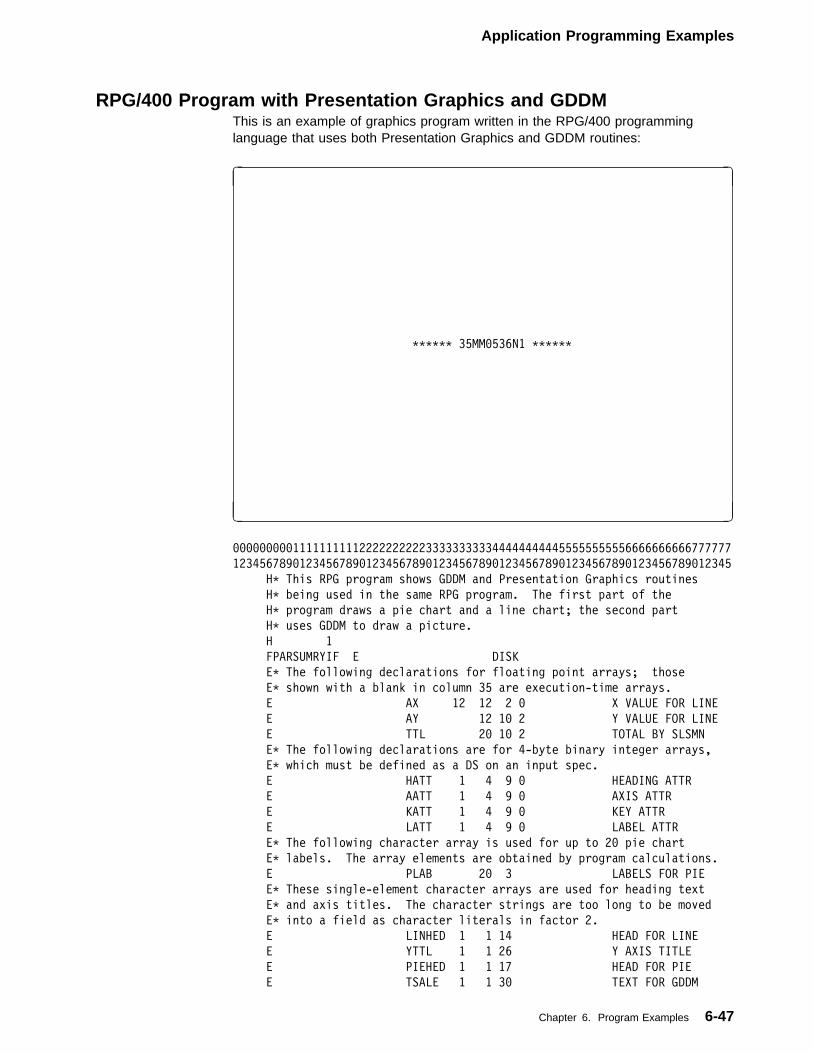
Application Programming Examples
RPG/400 Program with Presentation Graphics and GDDMThis is an example of graphics program written in the RPG/400 programminglanguage that uses both Presentation Graphics and GDDM routines:
�
������ 35MM�536N1 ������
� �
���������111111111122222222223333333333444444444455555555556666666666777777
123456789�123456789�123456789�123456789�123456789�123456789�123456789�12345
H� This RPG program shows GDDM and Presentation Graphics routines
H� being used in the same RPG program. The first part of the
H� program draws a pie chart and a line chart; the second part
H� uses GDDM to draw a picture.
H 1
FPARSUMRYIF E DISK
E� The following declarations for floating point arrays; those
E� shown with a blank in column 35 are execution-time arrays.
E AX 12 12 2 � X VALUE FOR LINE
E AY 12 1� 2 Y VALUE FOR LINE
E TTL 2� 1� 2 TOTAL BY SLSMN
E� The following declarations are for 4-byte binary integer arrays,
E� which must be defined as a DS on an input spec.
E HATT 1 4 9 � HEADING ATTR
E AATT 1 4 9 � AXIS ATTR
E KATT 1 4 9 � KEY ATTR
E LATT 1 4 9 � LABEL ATTR
E� The following character array is used for up to 2� pie chart
E� labels. The array elements are obtained by program calculations.
E PLAB 2� 3 LABELS FOR PIE
E� These single-element character arrays are used for heading text
E� and axis titles. The character strings are too long to be moved
E� into a field as character literals in factor 2.
E LINHED 1 1 14 HEAD FOR LINE
E YTTL 1 1 26 Y AXIS TITLE
E PIEHED 1 1 17 HEAD FOR PIE
E TSALE 1 1 3� TEXT FOR GDDM
Chapter 6. Program Examples 6-47
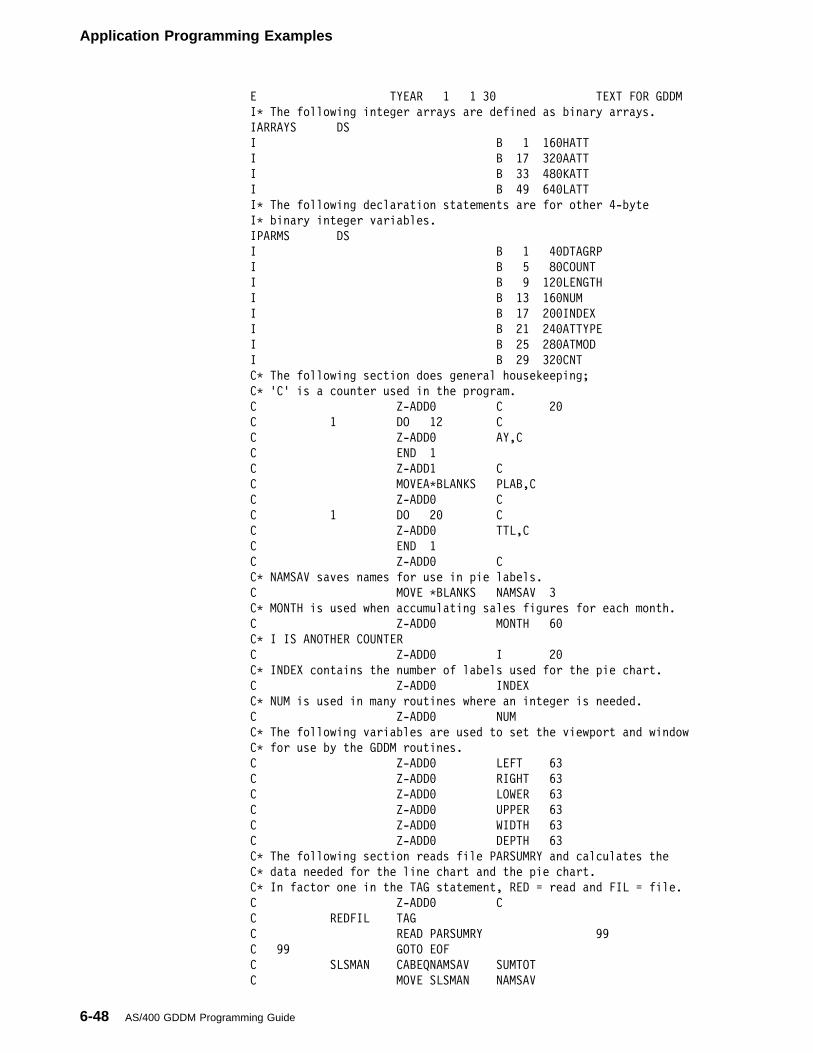
Application Programming Examples
E TYEAR 1 1 3� TEXT FOR GDDM
I� The following integer arrays are defined as binary arrays.
IARRAYS DS
I B 1 16�HATT
I B 17 32�AATT
I B 33 48�KATT
I B 49 64�LATT
I� The following declaration statements are for other 4-byte
I� binary integer variables.
IPARMS DS
I B 1 4�DTAGRP
I B 5 8�COUNT
I B 9 12�LENGTH
I B 13 16�NUM
I B 17 2��INDEX
I B 21 24�ATTYPE
I B 25 28�ATMOD
I B 29 32�CNT
C� The following section does general housekeeping;
C� 'C' is a counter used in the program.
C Z-ADD� C 2�
C 1 DO 12 C
C Z-ADD� AY,C
C END 1
C Z-ADD1 C
C MOVEA�BLANKS PLAB,C
C Z-ADD� C
C 1 DO 2� C
C Z-ADD� TTL,C
C END 1
C Z-ADD� C
C� NAMSAV saves names for use in pie labels.
C MOVE �BLANKS NAMSAV 3
C� MONTH is used when accumulating sales figures for each month.
C Z-ADD� MONTH 6�
C� I IS ANOTHER COUNTER
C Z-ADD� I 2�
C� INDEX contains the number of labels used for the pie chart.
C Z-ADD� INDEX
C� NUM is used in many routines where an integer is needed.
C Z-ADD� NUM
C� The following variables are used to set the viewport and window
C� for use by the GDDM routines.
C Z-ADD� LEFT 63
C Z-ADD� RIGHT 63
C Z-ADD� LOWER 63
C Z-ADD� UPPER 63
C Z-ADD� WIDTH 63
C Z-ADD� DEPTH 63
C� The following section reads file PARSUMRY and calculates the
C� data needed for the line chart and the pie chart.
C� In factor one in the TAG statement, RED = read and FIL = file.
C Z-ADD� C
C REDFIL TAG
C READ PARSUMRY 99
C 99 GOTO EOF
C SLSMAN CABEQNAMSAV SUMTOT
C MOVE SLSMAN NAMSAV
6-48 AS/400 GDDM Programming Guide
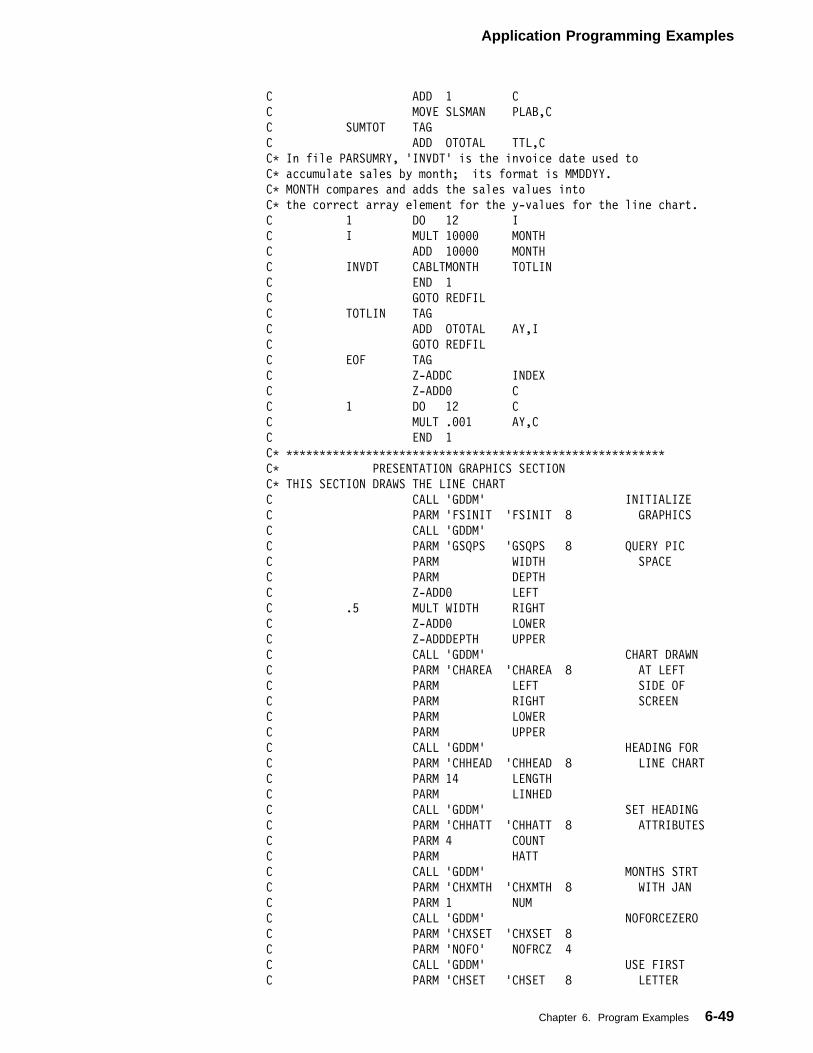
Application Programming Examples
C ADD 1 C
C MOVE SLSMAN PLAB,C
C SUMTOT TAG
C ADD OTOTAL TTL,C
C� In file PARSUMRY, 'INVDT' is the invoice date used to
C� accumulate sales by month; its format is MMDDYY.
C� MONTH compares and adds the sales values into
C� the correct array element for the y-values for the line chart.
C 1 DO 12 I
C I MULT 1���� MONTH
C ADD 1���� MONTH
C INVDT CABLTMONTH TOTLIN
C END 1
C GOTO REDFIL
C TOTLIN TAG
C ADD OTOTAL AY,I
C GOTO REDFIL
C EOF TAG
C Z-ADDC INDEX
C Z-ADD� C
C 1 DO 12 C
C MULT .��1 AY,C
C END 1
C� ���������������������������������������������������������
C� PRESENTATION GRAPHICS SECTION
C� THIS SECTION DRAWS THE LINE CHART
C CALL 'GDDM' INITIALIZE
C PARM 'FSINIT 'FSINIT 8 GRAPHICS
C CALL 'GDDM'
C PARM 'GSQPS 'GSQPS 8 QUERY PIC
C PARM WIDTH SPACE
C PARM DEPTH
C Z-ADD� LEFT
C .5 MULT WIDTH RIGHT
C Z-ADD� LOWER
C Z-ADDDEPTH UPPER
C CALL 'GDDM' CHART DRAWN
C PARM 'CHAREA 'CHAREA 8 AT LEFT
C PARM LEFT SIDE OF
C PARM RIGHT SCREEN
C PARM LOWER
C PARM UPPER
C CALL 'GDDM' HEADING FOR
C PARM 'CHHEAD 'CHHEAD 8 LINE CHART
C PARM 14 LENGTH
C PARM LINHED
C CALL 'GDDM' SET HEADING
C PARM 'CHHATT 'CHHATT 8 ATTRIBUTES
C PARM 4 COUNT
C PARM HATT
C CALL 'GDDM' MONTHS STRT
C PARM 'CHXMTH 'CHXMTH 8 WITH JAN
C PARM 1 NUM
C CALL 'GDDM' NOFORCEZERO
C PARM 'CHXSET 'CHXSET 8
C PARM 'NOFO' NOFRCZ 4
C CALL 'GDDM' USE FIRST
C PARM 'CHSET 'CHSET 8 LETTER
Chapter 6. Program Examples 6-49
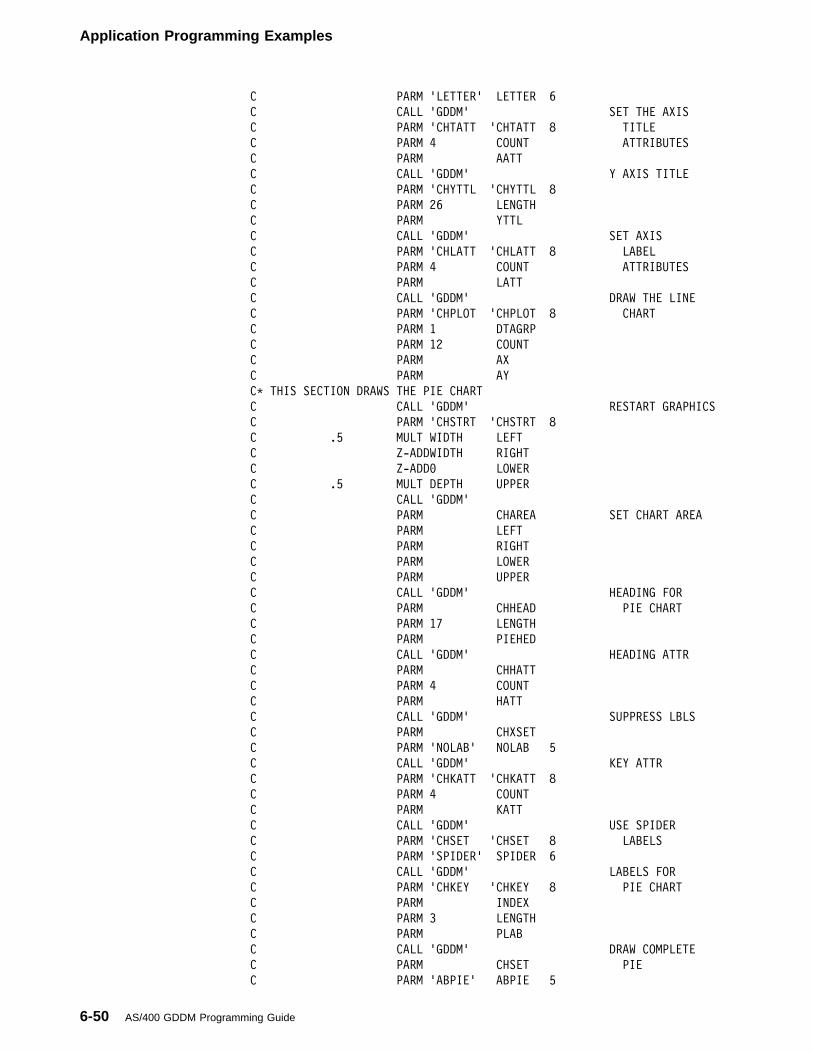
Application Programming Examples
C PARM 'LETTER' LETTER 6
C CALL 'GDDM' SET THE AXIS
C PARM 'CHTATT 'CHTATT 8 TITLE
C PARM 4 COUNT ATTRIBUTES
C PARM AATT
C CALL 'GDDM' Y AXIS TITLE
C PARM 'CHYTTL 'CHYTTL 8
C PARM 26 LENGTH
C PARM YTTL
C CALL 'GDDM' SET AXIS
C PARM 'CHLATT 'CHLATT 8 LABEL
C PARM 4 COUNT ATTRIBUTES
C PARM LATT
C CALL 'GDDM' DRAW THE LINE
C PARM 'CHPLOT 'CHPLOT 8 CHART
C PARM 1 DTAGRP
C PARM 12 COUNT
C PARM AX
C PARM AY
C� THIS SECTION DRAWS THE PIE CHART
C CALL 'GDDM' RESTART GRAPHICS
C PARM 'CHSTRT 'CHSTRT 8
C .5 MULT WIDTH LEFT
C Z-ADDWIDTH RIGHT
C Z-ADD� LOWER
C .5 MULT DEPTH UPPER
C CALL 'GDDM'
C PARM CHAREA SET CHART AREA
C PARM LEFT
C PARM RIGHT
C PARM LOWER
C PARM UPPER
C CALL 'GDDM' HEADING FOR
C PARM CHHEAD PIE CHART
C PARM 17 LENGTH
C PARM PIEHED
C CALL 'GDDM' HEADING ATTR
C PARM CHHATT
C PARM 4 COUNT
C PARM HATT
C CALL 'GDDM' SUPPRESS LBLS
C PARM CHXSET
C PARM 'NOLAB' NOLAB 5
C CALL 'GDDM' KEY ATTR
C PARM 'CHKATT 'CHKATT 8
C PARM 4 COUNT
C PARM KATT
C CALL 'GDDM' USE SPIDER
C PARM 'CHSET 'CHSET 8 LABELS
C PARM 'SPIDER' SPIDER 6
C CALL 'GDDM' LABELS FOR
C PARM 'CHKEY 'CHKEY 8 PIE CHART
C PARM INDEX
C PARM 3 LENGTH
C PARM PLAB
C CALL 'GDDM' DRAW COMPLETE
C PARM CHSET PIE
C PARM 'ABPIE' ABPIE 5
6-50 AS/400 GDDM Programming Guide
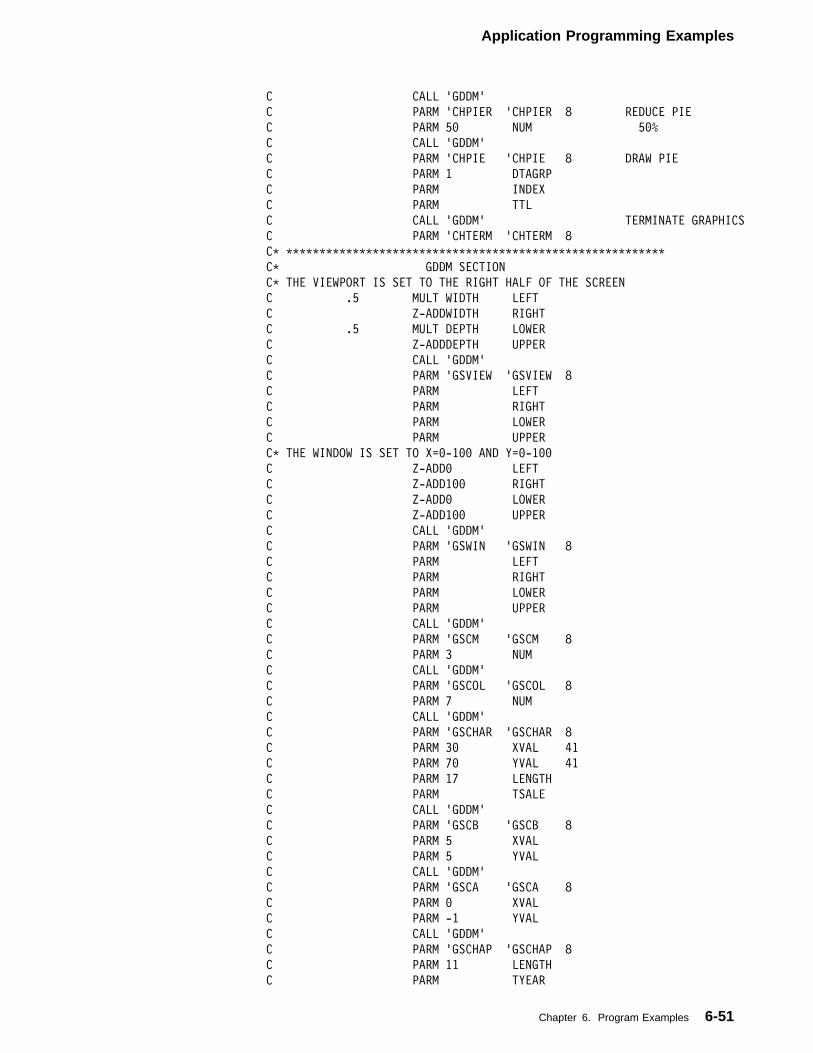
Application Programming Examples
C CALL 'GDDM'
C PARM 'CHPIER 'CHPIER 8 REDUCE PIE
C PARM 5� NUM 5�%
C CALL 'GDDM'
C PARM 'CHPIE 'CHPIE 8 DRAW PIE
C PARM 1 DTAGRP
C PARM INDEX
C PARM TTL
C CALL 'GDDM' TERMINATE GRAPHICS
C PARM 'CHTERM 'CHTERM 8
C� ���������������������������������������������������������
C� GDDM SECTION
C� THE VIEWPORT IS SET TO THE RIGHT HALF OF THE SCREEN
C .5 MULT WIDTH LEFT
C Z-ADDWIDTH RIGHT
C .5 MULT DEPTH LOWER
C Z-ADDDEPTH UPPER
C CALL 'GDDM'
C PARM 'GSVIEW 'GSVIEW 8
C PARM LEFT
C PARM RIGHT
C PARM LOWER
C PARM UPPER
C� THE WINDOW IS SET TO X=�-1�� AND Y=�-1��
C Z-ADD� LEFT
C Z-ADD1�� RIGHT
C Z-ADD� LOWER
C Z-ADD1�� UPPER
C CALL 'GDDM'
C PARM 'GSWIN 'GSWIN 8
C PARM LEFT
C PARM RIGHT
C PARM LOWER
C PARM UPPER
C CALL 'GDDM'
C PARM 'GSCM 'GSCM 8
C PARM 3 NUM
C CALL 'GDDM'
C PARM 'GSCOL 'GSCOL 8
C PARM 7 NUM
C CALL 'GDDM'
C PARM 'GSCHAR 'GSCHAR 8
C PARM 3� XVAL 41
C PARM 7� YVAL 41
C PARM 17 LENGTH
C PARM TSALE
C CALL 'GDDM'
C PARM 'GSCB 'GSCB 8
C PARM 5 XVAL
C PARM 5 YVAL
C CALL 'GDDM'
C PARM 'GSCA 'GSCA 8
C PARM � XVAL
C PARM -1 YVAL
C CALL 'GDDM'
C PARM 'GSCHAP 'GSCHAP 8
C PARM 11 LENGTH
C PARM TYEAR
Chapter 6. Program Examples 6-51
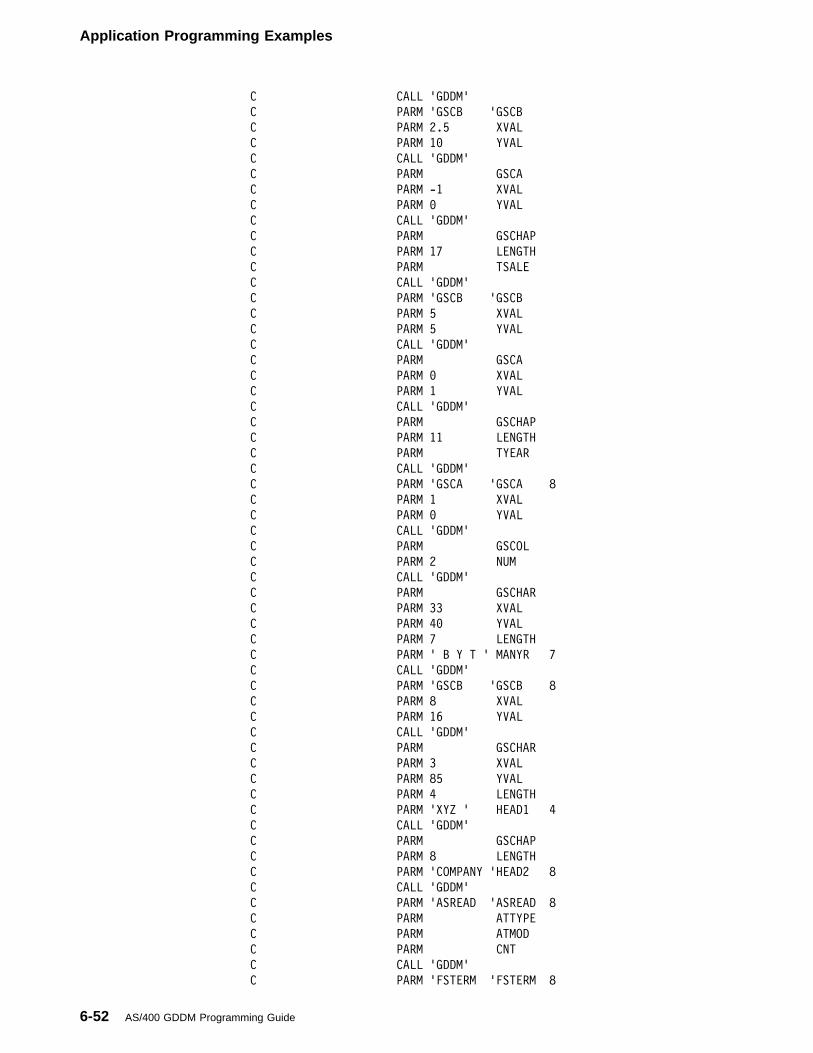
Application Programming Examples
C CALL 'GDDM'
C PARM 'GSCB 'GSCB
C PARM 2.5 XVAL
C PARM 1� YVAL
C CALL 'GDDM'
C PARM GSCA
C PARM -1 XVAL
C PARM � YVAL
C CALL 'GDDM'
C PARM GSCHAP
C PARM 17 LENGTH
C PARM TSALE
C CALL 'GDDM'
C PARM 'GSCB 'GSCB
C PARM 5 XVAL
C PARM 5 YVAL
C CALL 'GDDM'
C PARM GSCA
C PARM � XVAL
C PARM 1 YVAL
C CALL 'GDDM'
C PARM GSCHAP
C PARM 11 LENGTH
C PARM TYEAR
C CALL 'GDDM'
C PARM 'GSCA 'GSCA 8
C PARM 1 XVAL
C PARM � YVAL
C CALL 'GDDM'
C PARM GSCOL
C PARM 2 NUM
C CALL 'GDDM'
C PARM GSCHAR
C PARM 33 XVAL
C PARM 4� YVAL
C PARM 7 LENGTH
C PARM ' B Y T ' MANYR 7
C CALL 'GDDM'
C PARM 'GSCB 'GSCB 8
C PARM 8 XVAL
C PARM 16 YVAL
C CALL 'GDDM'
C PARM GSCHAR
C PARM 3 XVAL
C PARM 85 YVAL
C PARM 4 LENGTH
C PARM 'XYZ ' HEAD1 4
C CALL 'GDDM'
C PARM GSCHAP
C PARM 8 LENGTH
C PARM 'COMPANY 'HEAD2 8
C CALL 'GDDM'
C PARM 'ASREAD 'ASREAD 8
C PARM ATTYPE
C PARM ATMOD
C PARM CNT
C CALL 'GDDM'
C PARM 'FSTERM 'FSTERM 8
6-52 AS/400 GDDM Programming Guide
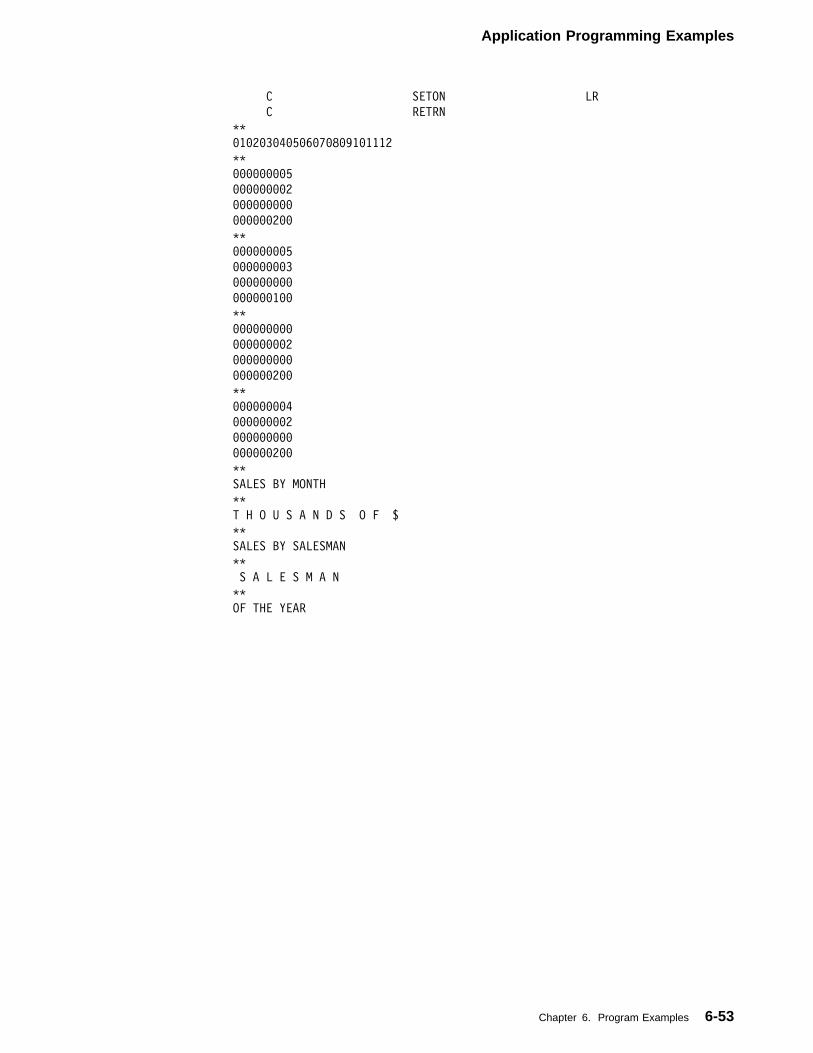
Application Programming Examples
C SETON LR
C RETRN
��
�1�2�3�4�5�6�7�8�91�1112
��
��������5
��������2
���������
������2��
��
��������5
��������3
���������
������1��
��
���������
��������2
���������
������2��
��
��������4
��������2
���������
������2��
��
SALES BY MONTH
��
T H O U S A N D S O F $
��
SALES BY SALESMAN
��
S A L E S M A N
��
OF THE YEAR
Chapter 6. Program Examples 6-53
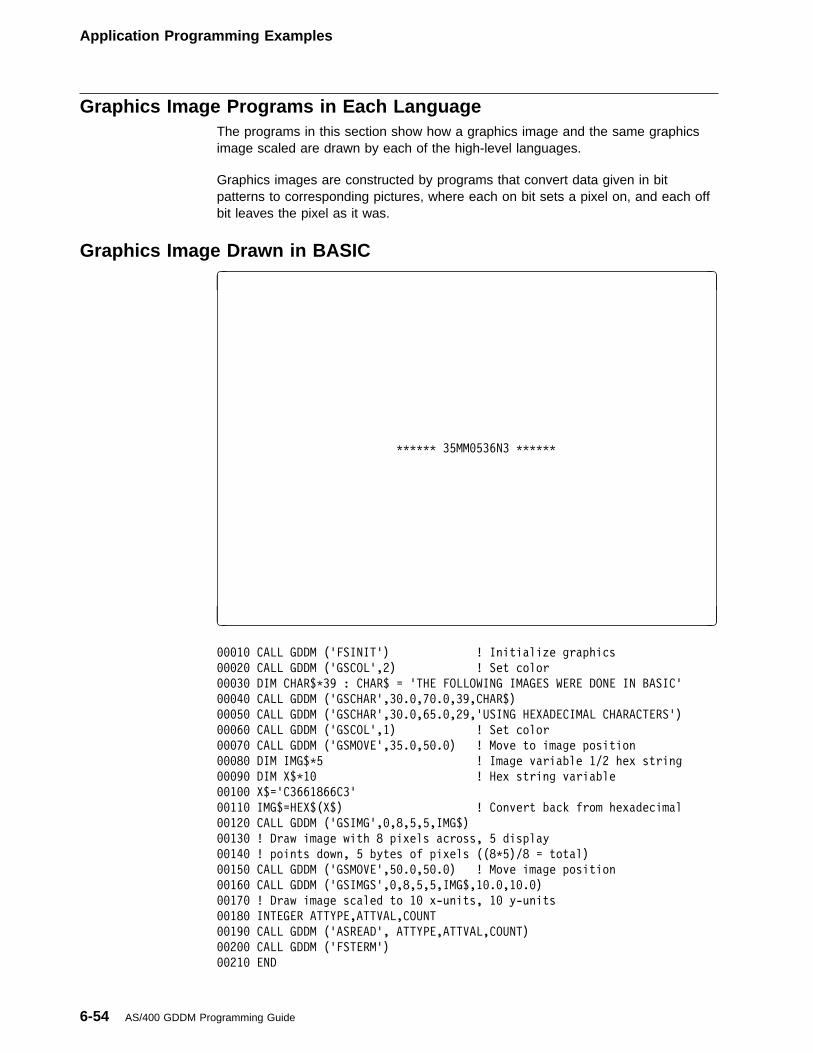
Application Programming Examples
Graphics Image Programs in Each LanguageThe programs in this section show how a graphics image and the same graphicsimage scaled are drawn by each of the high-level languages.
Graphics images are constructed by programs that convert data given in bitpatterns to corresponding pictures, where each on bit sets a pixel on, and each offbit leaves the pixel as it was.
Graphics Image Drawn in BASIC
�
������ 35MM�536N3 ������
� �
���1� CALL GDDM ('FSINIT') ! Initialize graphics
���2� CALL GDDM ('GSCOL',2) ! Set color
���3� DIM CHAR$�39 : CHAR$ = 'THE FOLLOWING IMAGES WERE DONE IN BASIC'
���4� CALL GDDM ('GSCHAR',3�.�,7�.�,39,CHAR$)
���5� CALL GDDM ('GSCHAR',3�.�,65.�,29,'USING HEXADECIMAL CHARACTERS')
���6� CALL GDDM ('GSCOL',1) ! Set color
���7� CALL GDDM ('GSMOVE',35.�,5�.�) ! Move to image position
���8� DIM IMG$�5 ! Image variable 1/2 hex string
���9� DIM X$�1� ! Hex string variable
��1�� X$='C3661866C3'
��11� IMG$=HEX$(X$) ! Convert back from hexadecimal
��12� CALL GDDM ('GSIMG',�,8,5,5,IMG$)
��13� ! Draw image with 8 pixels across, 5 display
��14� ! points down, 5 bytes of pixels ((8�5)/8 = total)
��15� CALL GDDM ('GSMOVE',5�.�,5�.�) ! Move image position
��16� CALL GDDM ('GSIMGS',�,8,5,5,IMG$,1�.�,1�.�)
��17� ! Draw image scaled to 1� x-units, 1� y-units
��18� INTEGER ATTYPE,ATTVAL,COUNT
��19� CALL GDDM ('ASREAD', ATTYPE,ATTVAL,COUNT)
��2�� CALL GDDM ('FSTERM')
��21� END
6-54 AS/400 GDDM Programming Guide
Application Programming Examples
Graphics Image Drawn in the RPG/400 Programming Language
�
������ 35MM�536N4 ������
� �
���������111111111122222222223333333333444444444455555555556666666666777777
123456789�123456789�123456789�123456789�123456789�123456789�123456789�12345
E HEADG1 1 1 45
E HEADG2 1 1 45
E IMAG 8 1
I� Declare the image character string
IIDTA DS
I 1 8 IMAG
I� Declare the image variables as binary 4
IPARAM DS
I B 1 4�ATTYPE
I B 5 8�ATTVAL
I B 9 12�COUNT
I B 13 16�WIDTH
I B 17 2��DEPTH
I B 21 24�BYTES
I B 25 28�ITYPE
I B 29 32�COLOR
C� Set off the 2nd bit of each element of IDTA,
C� necessary because the image data is initially
C� set to blanks (X'4�'):
C BITOF'1' IMAG,1
C BITOF'1' IMAG,2
C BITOF'1' IMAG,3
C BITOF'1' IMAG,4
C BITOF'1' IMAG,5
C� After the image data is set to zeros,
C� use BITON to set the image point bits on:
C BITON'�167' IMAG,1
C BITON'1256' IMAG,2
C BITON'34' IMAG,3
Chapter 6. Program Examples 6-55
Application Programming Examples
C BITON'1256' IMAG,4
C BITON'�167' IMAG,5
C� The following routines draw the image:
C CALL 'GDDM' Initialize
C PARM 'FSINIT' FSINIT 8 Graphics
C Z-ADD2 COLOR
C CALL 'GDDM' Set color
C PARM 'GSCOL' GSCOL 8
C PARM COLOR
C Z-ADD3� XMOV 31
C Z-ADD7� YMOV 31
C Z-ADD45 COUNT
C CALL 'GDDM' Heading
C PARM 'GSCHAR' GSCHAR 8
C PARM XMOV
C PARM YMOV
C PARM COUNT
C PARM HEADG1
C Z-ADD3� XMOV 31
C Z-ADD65 YMOV 31
C CALL 'GDDM' Heading
C PARM 'GSCHAR' GSCHAR 8
C PARM XMOV
C PARM YMOV
C PARM COUNT
C PARM HEADG2
C Z-ADD1 COLOR
C CALL 'GDDM' Set color
C PARM 'GSCOL' GSCOL 8
C PARM COLOR
C Z-ADD35 XMOV 31
C Z-ADD5� YMOV 31
C CALL 'GDDM' Move to
C PARM 'GSMOVE' GSMOVE 8 position
C PARM XMOV
C PARM YMOV
C Z-ADD� ITYPE
C Z-ADD8 WIDTH
C Z-ADD5 DEPTH
C Z-ADD5 BYTES
C Z-ADD1� SCALX 31
C Z-ADD1� SCALY 31
C CALL 'GDDM' Draw image
C PARM 'GSIMG ' GSIMG 8
C PARM ITYPE
C PARM WIDTH
C PARM DEPTH
C PARM BYTES
C PARM IDTA
C Z-ADD5� XMOV
C Z-ADD5� YMOV
C CALL 'GDDM' Move to
C PARM 'GSMOVE' GSMOVE 8 position
C PARM XMOV
C PARM YMOV
C CALL 'GDDM' Draw scaled
C PARM 'GSIMGS' GSIMGS 8 image
C PARM ITYPE
6-56 AS/400 GDDM Programming Guide
Application Programming Examples
C PARM WIDTH
C PARM DEPTH
C PARM BYTES
C PARM IDTA
C PARM SCALX
C PARM SCALY
C CALL 'GDDM' Send images
C PARM 'ASREAD' ASREAD 8 to display
C PARM ATTYPE
C PARM ATTVAL
C PARM COUNT
C CALL 'GDDM' Terminate
C PARM 'FSTERM' FSTERM 8 graphics
C SETON LR
C RETRN
��
THE FOLLOWING IMAGES WERE DONE IN RPG
��
USING THE BITON AND BITOF COMMANDS
Chapter 6. Program Examples 6-57
Application Programming Examples
| Graphics Image Drawn in the COBOL/400 Programming Language
�
������ 35MM�536N5 ������
� �
-A+++B++++++++++++++++++++++++++++++++++++++++++++++++++++++++++++++++
IDENTIFICATION DIVISION.
PROGRAM-ID. CIMAGE.
�----------------------------------------------------------------
� This COBOL program draws an image and a scaled image.
� A BASIC program is called to convert the string to a
� bit pattern.
�----------------------------------------------------------------
ENVIRONMENT DIVISION.
CONFIGURATION SECTION.
SOURCE-COMPUTER. IBM-S38.
OBJECT-COMPUTER. IBM-S38.
INPUT-OUTPUT SECTION.
FILE-CONTROL.
DATA DIVISION.
FILE SECTION.
WORKING-STORAGE SECTION.
�1 PARM-LIST.
�5 IMAGE PIC X(248).
�����������������������������������������������������������������
� Parameters for GDDM routines.
�����������������������������������������������������������������
77 FKTYPE PIC S9(5) COMP-4.
77 FKNUM PIC S9(5) COMP-4.
77 NUM PIC S9(5) COMP-4.
77 STRING-LENGTH PIC S9(5) COMP-4.
77 XMOV PIC S9(4)V9 COMP-3.
77 YMOV PIC S9(4)V9 COMP-3.
77 SCALX PIC S9(4)V99 COMP-3.
77 SCALY PIC S9(4)V99 COMP-3.
77 WIDTH PIC S9(5) COMP-4.
6-58 AS/400 GDDM Programming Guide
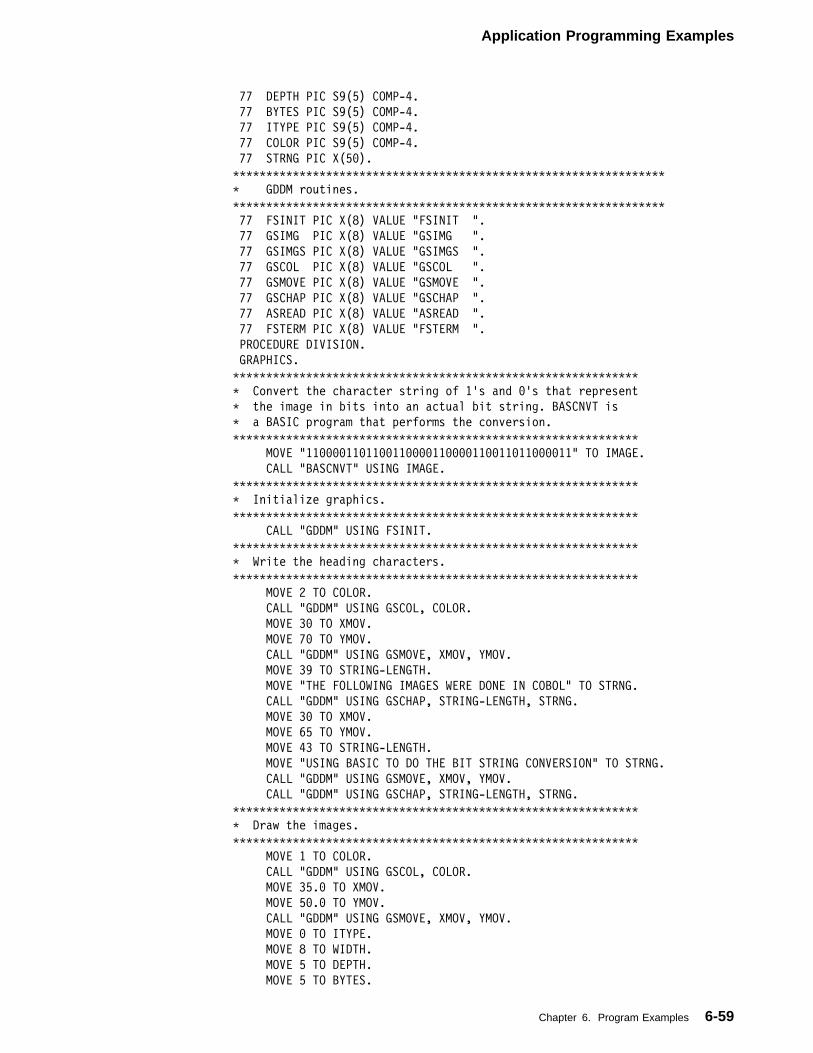
Application Programming Examples
77 DEPTH PIC S9(5) COMP-4.
77 BYTES PIC S9(5) COMP-4.
77 ITYPE PIC S9(5) COMP-4.
77 COLOR PIC S9(5) COMP-4.
77 STRNG PIC X(5�).
�����������������������������������������������������������������
� GDDM routines.
�����������������������������������������������������������������
77 FSINIT PIC X(8) VALUE "FSINIT ".
77 GSIMG PIC X(8) VALUE "GSIMG ".
77 GSIMGS PIC X(8) VALUE "GSIMGS ".
77 GSCOL PIC X(8) VALUE "GSCOL ".
77 GSMOVE PIC X(8) VALUE "GSMOVE ".
77 GSCHAP PIC X(8) VALUE "GSCHAP ".
77 ASREAD PIC X(8) VALUE "ASREAD ".
77 FSTERM PIC X(8) VALUE "FSTERM ".
PROCEDURE DIVISION.
GRAPHICS.
�������������������������������������������������������������
� Convert the character string of 1's and �'s that represent
� the image in bits into an actual bit string. BASCNVT is
� a BASIC program that performs the conversion.
�������������������������������������������������������������
MOVE "11����11�11��11����11����11��11�11����11" TO IMAGE.
CALL "BASCNVT" USING IMAGE.
�������������������������������������������������������������
� Initialize graphics.
�������������������������������������������������������������
CALL "GDDM" USING FSINIT.
�������������������������������������������������������������
� Write the heading characters.
�������������������������������������������������������������
MOVE 2 TO COLOR.
CALL "GDDM" USING GSCOL, COLOR.
MOVE 3� TO XMOV.
MOVE 7� TO YMOV.
CALL "GDDM" USING GSMOVE, XMOV, YMOV.
MOVE 39 TO STRING-LENGTH.
MOVE "THE FOLLOWING IMAGES WERE DONE IN COBOL" TO STRNG.
CALL "GDDM" USING GSCHAP, STRING-LENGTH, STRNG.
MOVE 3� TO XMOV.
MOVE 65 TO YMOV.
MOVE 43 TO STRING-LENGTH.
MOVE "USING BASIC TO DO THE BIT STRING CONVERSION" TO STRNG.
CALL "GDDM" USING GSMOVE, XMOV, YMOV.
CALL "GDDM" USING GSCHAP, STRING-LENGTH, STRNG.
�������������������������������������������������������������
� Draw the images.
�������������������������������������������������������������
MOVE 1 TO COLOR.
CALL "GDDM" USING GSCOL, COLOR.
MOVE 35.� TO XMOV.
MOVE 5�.� TO YMOV.
CALL "GDDM" USING GSMOVE, XMOV, YMOV.
MOVE � TO ITYPE.
MOVE 8 TO WIDTH.
MOVE 5 TO DEPTH.
MOVE 5 TO BYTES.
Chapter 6. Program Examples 6-59
Application Programming Examples
CALL "GDDM" USING GSIMG, ITYPE, WIDTH, DEPTH, BYTES, IMAGE.
MOVE 1� TO SCALX.
MOVE 1� TO SCALY.
MOVE 5�.� TO XMOV.
MOVE 5�.� TO YMOV.
CALL "GDDM" USING GSMOVE, XMOV, YMOV.
CALL "GDDM" USING GSIMGS, ITYPE, WIDTH, DEPTH, BYTES, IMAGE,
SCALX, SCALY.
�������������������������������������������������������������
� Display the images and terminate graphics.
�������������������������������������������������������������
CALL "GDDM" USING ASREAD, FKTYPE, FKNUM, NUM.
CALL "GDDM" USING FSTERM.
STOP RUN.
END-GRAPHICS.
6-60 AS/400 GDDM Programming Guide
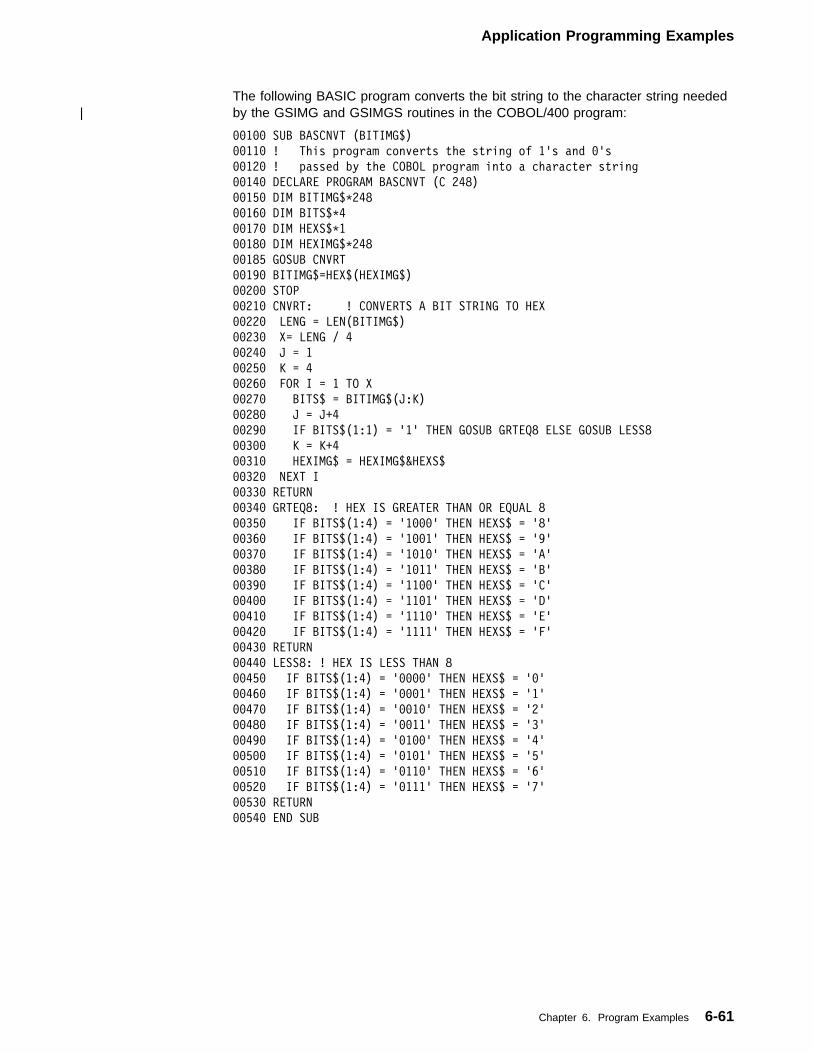
Application Programming Examples
The following BASIC program converts the bit string to the character string needed| by the GSIMG and GSIMGS routines in the COBOL/400 program:
��1�� SUB BASCNVT (BITIMG$)
��11� ! This program converts the string of 1's and �'s
��12� ! passed by the COBOL program into a character string
��14� DECLARE PROGRAM BASCNVT (C 248)
��15� DIM BITIMG$�248
��16� DIM BITS$�4
��17� DIM HEXS$�1
��18� DIM HEXIMG$�248
��185 GOSUB CNVRT
��19� BITIMG$=HEX$(HEXIMG$)
��2�� STOP
��21� CNVRT: ! CONVERTS A BIT STRING TO HEX
��22� LENG = LEN(BITIMG$)
��23� X= LENG / 4
��24� J = 1
��25� K = 4
��26� FOR I = 1 TO X
��27� BITS$ = BITIMG$(J:K)
��28� J = J+4
��29� IF BITS$(1:1) = '1' THEN GOSUB GRTEQ8 ELSE GOSUB LESS8
��3�� K = K+4
��31� HEXIMG$ = HEXIMG$&HEXS$
��32� NEXT I
��33� RETURN
��34� GRTEQ8: ! HEX IS GREATER THAN OR EQUAL 8
��35� IF BITS$(1:4) = '1���' THEN HEXS$ = '8'
��36� IF BITS$(1:4) = '1��1' THEN HEXS$ = '9'
��37� IF BITS$(1:4) = '1�1�' THEN HEXS$ = 'A'
��38� IF BITS$(1:4) = '1�11' THEN HEXS$ = 'B'
��39� IF BITS$(1:4) = '11��' THEN HEXS$ = 'C'
��4�� IF BITS$(1:4) = '11�1' THEN HEXS$ = 'D'
��41� IF BITS$(1:4) = '111�' THEN HEXS$ = 'E'
��42� IF BITS$(1:4) = '1111' THEN HEXS$ = 'F'
��43� RETURN
��44� LESS8: ! HEX IS LESS THAN 8
��45� IF BITS$(1:4) = '����' THEN HEXS$ = '�'
��46� IF BITS$(1:4) = '���1' THEN HEXS$ = '1'
��47� IF BITS$(1:4) = '��1�' THEN HEXS$ = '2'
��48� IF BITS$(1:4) = '��11' THEN HEXS$ = '3'
��49� IF BITS$(1:4) = '�1��' THEN HEXS$ = '4'
��5�� IF BITS$(1:4) = '�1�1' THEN HEXS$ = '5'
��51� IF BITS$(1:4) = '�11�' THEN HEXS$ = '6'
��52� IF BITS$(1:4) = '�111' THEN HEXS$ = '7'
��53� RETURN
��54� END SUB
Chapter 6. Program Examples 6-61
Application Programming Examples
Graphics Image Drawn in PL/I
�
������ 35MM�536N6 ������
� �
IMAGEPLI:PROC;
%INCLUDE SYSLIB (ADMUPLNB);
DCL ATTYPE BIN(31); /� Declare variables �/
DCL ATTVAL BIN(31);
DCL COUNT BIN(31);
DCL IMAGE$ CHAR(5);
/� The following bit string represents the image data �/
UNSPEC(IMAGE$) = '11����11'B||
'�11��11�'B||
'���11���'B||
'�11��11�'B||
'11����11'B;
CALL FSINIT; /� Initialize graphics �/
CALL GSCOL(2); /� Set color �/
CALL GSCHAR(3�.�,7�.�,37,'THE FOLLOWING IMAGES WERE DONE IN PLI');
CALL GSCHAR(3�.�,65.�,37,'USING THE UNSPEC FUNCTION ');
CALL GSCOL(1); /� Set color �/
CALL GSMOVE(35.�,5�.�); /� Move to image position �/
CALL GSIMG(�,8,5,5,IMAGE$); /� Draw image �/
CALL GSMOVE(5�.�,5�.�); /� Move to image position �/
CALL GSIMGS(�,8,5,5,IMAGE$,1�.�,1�.�);/� Draw scaled image �/
CALL ASREAD(ATTYPE,ATTVAL,COUNT); /� Send picture to display �/
END IMAGEPLI;
6-62 AS/400 GDDM Programming Guide
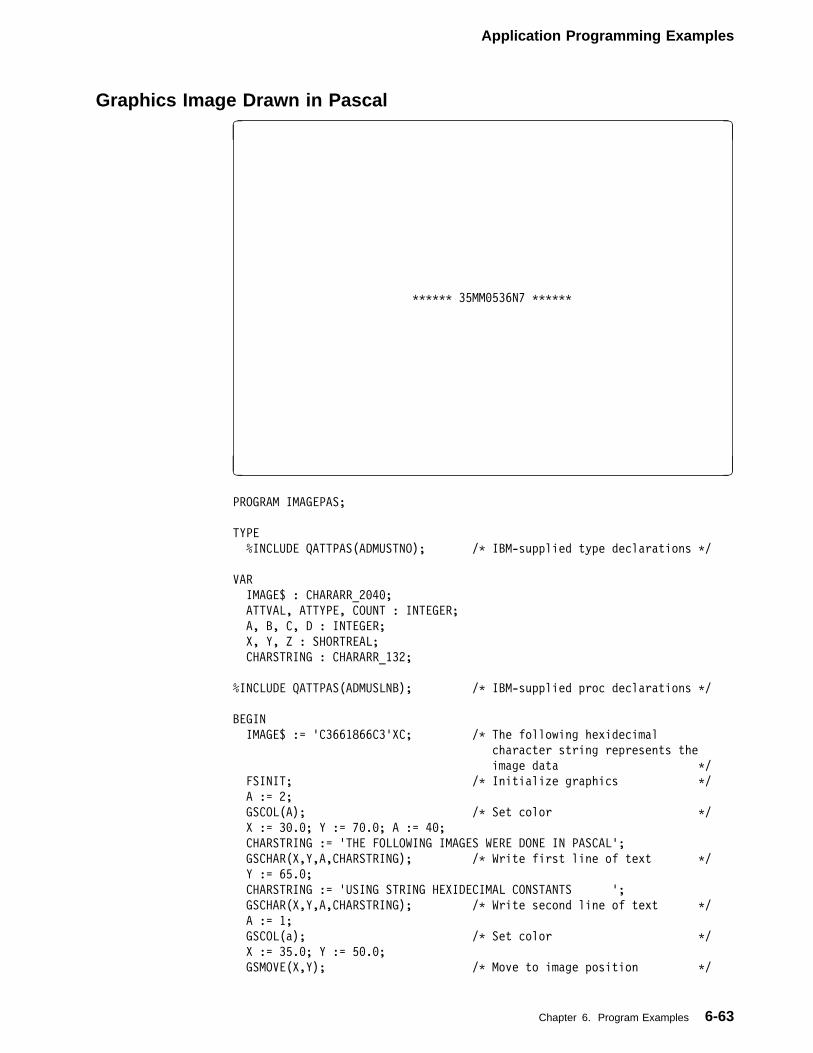
Application Programming Examples
Graphics Image Drawn in Pascal
�
������ 35MM�536N7 ������
� �
PROGRAM IMAGEPAS;
TYPE
%INCLUDE QATTPAS(ADMUSTNO); /� IBM-supplied type declarations �/
VAR
IMAGE$ : CHARARR_2�4�;
ATTVAL, ATTYPE, COUNT : INTEGER;
A, B, C, D : INTEGER;
X, Y, Z : SHORTREAL;
CHARSTRING : CHARARR_132;
%INCLUDE QATTPAS(ADMUSLNB); /� IBM-supplied proc declarations �/
BEGIN
IMAGE$ := 'C3661866C3'XC; /� The following hexidecimal
character string represents the
image data �/
FSINIT; /� Initialize graphics �/
A := 2;
GSCOL(A); /� Set color �/
X := 3�.�; Y := 7�.�; A := 4�;
CHARSTRING := 'THE FOLLOWING IMAGES WERE DONE IN PASCAL';
GSCHAR(X,Y,A,CHARSTRING); /� Write first line of text �/
Y := 65.�;
CHARSTRING := 'USING STRING HEXIDECIMAL CONSTANTS ';
GSCHAR(X,Y,A,CHARSTRING); /� Write second line of text �/
A := 1;
GSCOL(a); /� Set color �/
X := 35.�; Y := 5�.�;
GSMOVE(X,Y); /� Move to image position �/
Chapter 6. Program Examples 6-63
Application Programming Examples
A := �; B := 8; C := 5; D := 5;
GSIMG(A,B,C,D,IMAGE$); /� Draw image �/
X := 5�.�;
GSMOVE(X,Y); /� Move to scaled image position �/
X := 1�.�; Y := 1�.�;
GSIMGS(A,B,C,D,IMAGE$,X,Y); /� Draw scaled image �/
ASREAD(ATTVAL,ATTYPE,COUNT) /� Send picture to display �/
END.
6-64 AS/400 GDDM Programming Guide
Compatible Devices
Appendix A. Devices Compatible with the AS/400 System
An OS/400 graphics program can produce these types of output:
Video color pictures on the following devices:
| � IBM personal computer with work station function (WSF)| � IBM personal computer with work station emulation (WSE)
� 5292 Model 2� IBM personal computer with 5250 emulation
| Plotted color pictures on the following devices:
| � IBM 6180 Plotter| � IBM 6182 Plotter| � IBM 6184 Plotter| � IBM 6185 Plotter| � IBM 6186-1 Plotter| � IBM 6186-2 Plotter| � IBM 7371 Plotter| � IBM 7372 Plotter
Printed black-and-white pictures on the following devices:
� IBM 3812 Printer� IBM 3816 Printer
| � IBM 4028 Printer� IBM 4214 Printer� IBM 4234-2 Printer� IBM 5224 Printer� IBM 5225 Printer
Printed color pictures on the IBM 4224 Printer.
Graphics data format (GDF) file, which can be used to save a constructedpicture for later interpretation, on the AS/400 System or on another systemequipped with the software necessary to interpret GDF files.
No output on a non-graphics work station, which can be useful for testing anddebugging programs when a graphics work station is not available.
A plotter can be attached to the graphics work station as an auxiliary device, andtherefore must be named and addressed in the AUXDEV parameter of theCRTDEVDSP (Create Device Description (Display)) CL command used to describethe graphics work station to the system.
| The 3812, 3816, 4028, 4214, 4224, 4234-2, 5224, and 5225 printers are separatedevices and are configured as normal work station printers.
The same picture produced on a display, a plotter, and a printer may not beidentical. Pictures are associated with a device. When the program encounters aDSUSE routine for the plotter, the picture constructed differs from the graphics workstation picture:
� Chart features, such as the legend and chart notes, are positioned by charactergrid units. The default character grid varies between the display device, printer,and plotter. On a plotter, paper sizes and paper orientation make a difference.
Copyright IBM Corp. 1991 A-1
Compatible Devices
To avoid these differences, set the character grid size with PresentationGraphics routine CHCGRD.
� Charts with default axis scales show more tick marks on a plotted or printedversion of a chart than on one displayed.
� Note, legend, and axis label blanking is not performed for plotted charts unlikedisplayed or printed charts.
� Color tables are not supported for the plotter; regardless of the color defined forthe color table entry number 1 for the display, the plotter uses whatever pen isin position 1 of the plotter carousel.
� Color mixing for plotter pictures is always in overpaint mode, because colorsare etched over the top of previously drawn colors.
� Area-fill patterns are shown in much finer detail on the plotter and printer thanon the display.
� The default character mode for printers is mode-2 (image symbols), while forplotters and displays the default character mode is mode-3 (vector symbols).
� The plotter and printer do not reproduce alphanumeric display file fields writtenover the picture.
For screen copies produced by the 5182 Color Printer, or print files produced for agraphics work station printer:
Color mixing for printer pictures is always in overpaint mode, because colorsare etched over the top of previously drawn colors.
The printer does not produce the colors defined in modified device color tables.It uses the color table indexes and prints the colors accordingly.
The printer does not reproduce display file field attributes. For example,alphanumeric fields entered into input fields displayed with the underlineattribute will be reproduced but not with the underline.
When you call a compiled high-level language graphics program (or a BASICsource program from the BASIC interpreter), the device enters graphics displaymode:
The display is set to reduced line spacing, which cannot be overridden.
The graphics mode indicator (a blue G character two inches from the left sideof the screen) is shown.
The graphics work station must be described to the system by issuing theCRTDEVDSP (Create Device Description (Display)) command. After beingdescribed, it must be varied online.
For more information, refer to the CL Reference manual and the LicensedPrograms and New Release Installation Guide.
The graphics work station from which you start the program is always the defaultcurrent device. Therefore, if no DSOPEN/DSUSE routines exist in the program tosend the program output elsewhere, the picture will be displayed on the graphicswork station.
A-2 AS/400 GDDM Programming Guide
Compatible Devices
The IBM PlottersA plotter can be assigned in the program as the current device. The DSOPENroutine identifies the plotter to the program, and the DSUSE routine makes it thecurrent device. (An ASREAD or FSFRCE routine will then send the current page ofgraphics to the plotter.)
How to Configure a PlotterA plotter must be described to the system by including it as an auxiliary device tothe associated graphics work station. Name the plotter in the AUXDEV parameterof the CRTDEVDSP (Create Device Description (Display)) command used todescribe the graphics work station to the system. For more information, refer to theCL Reference manual and the Licensed Programs and New Release InstallationGuide.
How to Send Pictures to a PlotterTo use a plotter, you must use the DSOPEN routine to identify the device and itscharacteristics to the program.
The DSOPEN routine has these parameters:
� Device identifier. A positive integer greater than 1 that identifies the plotter andis used in the DSUSE routine to make the plotter the current device.
� Family. A positive integer (which must always be 1).
| � Device token. An 8-byte character string that identifies the device type. The| following are valid device tokens for IBM plotters (each ␣ is one blank space):
| – '6180␣␣␣␣'| – '6182␣␣␣␣'| – '6184␣␣␣␣'| – '6185␣␣␣␣'| – '6186M1␣␣'| – '6186M2␣␣'| – '7371␣␣␣␣'| – '7372␣␣␣␣'
� Processing options list count. A positive integer that specifies the number ofprocessing options you want to specify explicitly in the processing options list(described next).
� Processing options list. An integer array that holds option codes and values.| These specify the speed and width of the plotter pens, the size and orientation| of the paper in the plotter, and whether or not form feed is enabled.
The list takes this form:
Option code, Value, Option code, Value, ...
The option group codes and the available options are as follows.
| Valid values for each processing option group and plotter are:
Appendix A. Graphics devices A-3
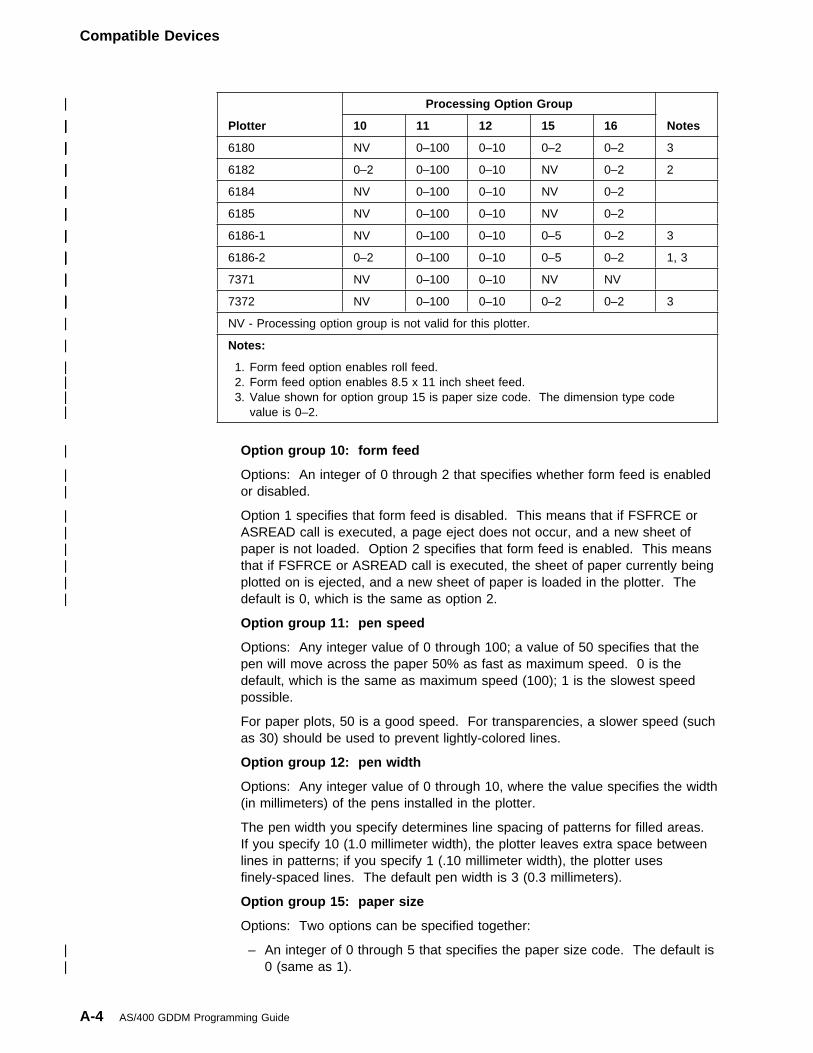
Compatible Devices
| Option group 10: form feed
| Options: An integer of 0 through 2 that specifies whether form feed is enabled| or disabled.
| Option 1 specifies that form feed is disabled. This means that if FSFRCE or| ASREAD call is executed, a page eject does not occur, and a new sheet of| paper is not loaded. Option 2 specifies that form feed is enabled. This means| that if FSFRCE or ASREAD call is executed, the sheet of paper currently being| plotted on is ejected, and a new sheet of paper is loaded in the plotter. The| default is 0, which is the same as option 2.
Option group 11: pen speed
Options: Any integer value of 0 through 100; a value of 50 specifies that thepen will move across the paper 50% as fast as maximum speed. 0 is thedefault, which is the same as maximum speed (100); 1 is the slowest speedpossible.
For paper plots, 50 is a good speed. For transparencies, a slower speed (suchas 30) should be used to prevent lightly-colored lines.
Option group 12: pen width
Options: Any integer value of 0 through 10, where the value specifies the width(in millimeters) of the pens installed in the plotter.
The pen width you specify determines line spacing of patterns for filled areas.If you specify 10 (1.0 millimeter width), the plotter leaves extra space betweenlines in patterns; if you specify 1 (.10 millimeter width), the plotter usesfinely-spaced lines. The default pen width is 3 (0.3 millimeters).
Option group 15: paper size
Options: Two options can be specified together:
| – An integer of 0 through 5 that specifies the paper size code. The default is| 0 (same as 1).
| Plotter
| Processing Option Group
| Notes| 10| 11| 12| 15| 16
| 6180| NV| 0–100| 0–10| 0–2| 0–2| 3
| 6182| 0–2| 0–100| 0–10| NV| 0–2| 2
| 6184| NV| 0–100| 0–10| NV| 0–2
| 6185| NV| 0–100| 0–10| NV| 0–2
| 6186-1| NV| 0–100| 0–10| 0–5| 0–2| 3
| 6186-2| 0–2| 0–100| 0–10| 0–5| 0–2| 1, 3
| 7371| NV| 0–100| 0–10| NV| NV
| 7372| NV| 0–100| 0–10| 0–2| 0–2| 3
| NV - Processing option group is not valid for this plotter.
| Notes:
| 1. Form feed option enables roll feed.| 2. Form feed option enables 8.5 x 11 inch sheet feed.| 3. Value shown for option group 15 is paper size code. The dimension type code| value is 0–2.
A-4 AS/400 GDDM Programming Guide
Compatible Devices
| - 1 specifies 8.5 by 11-inch paper| - 2 specifies 11 by 17-inch paper| - 3 specifies 17 by 22-inch paper| - 4 specifies 22 by 34-inch paper| - 5 specifies 34 by 44-inch paper
| – An integer of 0 through 2 that specifies the dimension type code. The| dimension type code further qualifies the paper size, in terms of a| measurement in millimeters (dimension type code 1) or inches (dimension| type code 2). The default is 0, which is the same as type code 1.
The paper size switches should be adjusted on the plotter to match the papersize specified; otherwise, undesirable results can occur. (A picture to beplotted on an 11 by 17 sheet may exceed the boundaries of an 8.5 by 11sheet.)
Option group 16: paper orientation
Options: An integer of 0 through 2 that specifies whether the picture is plottedvertically on the paper or horizontally.
A picture plotted horizontally (the default 0 or option 1) will be plotted such thatthe x range is plotted in the longest dimension of the paper (11 for 8.5 by 11sheets). Option 2 specifies a vertical orientation. The vertical orientation canchange the default aspect ratio of the picture (making it look taller), unless apicture space is specified explicitly.
� Name list count. A positive integer that specifies the number of names (always0, 1, or 2) in the name list (described next).
� Name list. A character array that specifies the OS/400 device description nameof the device.
If a name is specified for the plotter, use the name in the CRTDEVDSPcommand to describe the associated graphics work station to the system.
If the name list count is 2, the plotter device is selected based on either of thefollowing entries in the second array element:
' nn' The plotter (of the type specified by the device token) ataddress nn is used. The address assigned to the plotter inthe device description for the associated work station isrepresented in this element by two right-justified characters.
'ADMPLOT ' The plotter (of the type specified by the device token) at thelowest address of an available plotter is used.
The DSOPEN parameter must be followed by a DSUSE routine that uses theinteger device identifier specified by the first parameter of the DSOPEN routine.
DSUSE makes the plotter the current device.
The following is an example of the DSOPEN and DSUSE routines used to activatethe IBM 6180 Plotter:
Appendix A. Graphics devices A-5
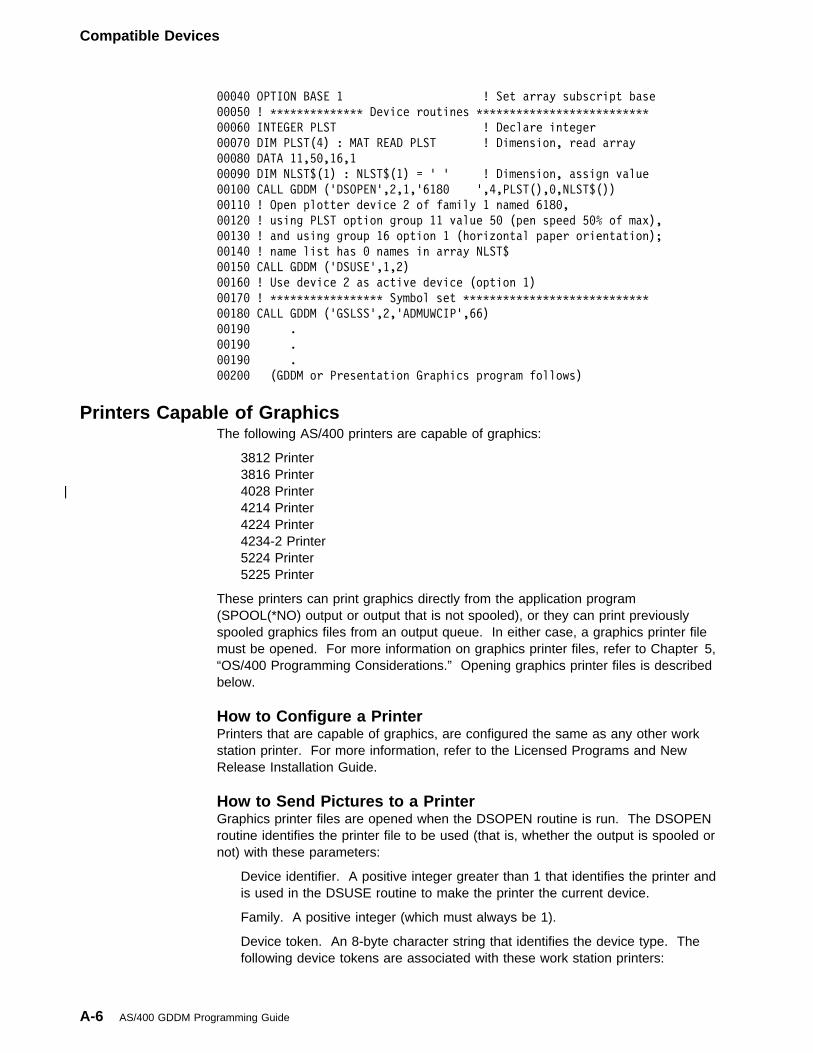
Compatible Devices
���4� OPTION BASE 1 ! Set array subscript base
���5� ! �������������� Device routines ��������������������������
���6� INTEGER PLST ! Declare integer
���7� DIM PLST(4) : MAT READ PLST ! Dimension, read array
���8� DATA 11,5�,16,1
���9� DIM NLST$(1) : NLST$(1) = ' ' ! Dimension, assign value
��1�� CALL GDDM ('DSOPEN',2,1,'618� ',4,PLST(),�,NLST$())
��11� ! Open plotter device 2 of family 1 named 618�,
��12� ! using PLST option group 11 value 5� (pen speed 5�% of max),
��13� ! and using group 16 option 1 (horizontal paper orientation);
��14� ! name list has � names in array NLST$
��15� CALL GDDM ('DSUSE',1,2)
��16� ! Use device 2 as active device (option 1)
��17� ! ����������������� Symbol set ����������������������������
��18� CALL GDDM ('GSLSS',2,'ADMUWCIP',66)
��19� .
��19� .
��19� .
��2�� (GDDM or Presentation Graphics program follows)
Printers Capable of GraphicsThe following AS/400 printers are capable of graphics:
3812 Printer 3816 Printer
| 4028 Printer 4214 Printer 4224 Printer 4234-2 Printer 5224 Printer 5225 Printer
These printers can print graphics directly from the application program(SPOOL(*NO) output or output that is not spooled), or they can print previouslyspooled graphics files from an output queue. In either case, a graphics printer filemust be opened. For more information on graphics printer files, refer to Chapter 5,“OS/400 Programming Considerations.” Opening graphics printer files is describedbelow.
How to Configure a PrinterPrinters that are capable of graphics, are configured the same as any other workstation printer. For more information, refer to the Licensed Programs and NewRelease Installation Guide.
How to Send Pictures to a PrinterGraphics printer files are opened when the DSOPEN routine is run. The DSOPENroutine identifies the printer file to be used (that is, whether the output is spooled ornot) with these parameters:
Device identifier. A positive integer greater than 1 that identifies the printer andis used in the DSUSE routine to make the printer the current device.
Family. A positive integer (which must always be 1).
Device token. An 8-byte character string that identifies the device type. Thefollowing device tokens are associated with these work station printers:
A-6 AS/400 GDDM Programming Guide
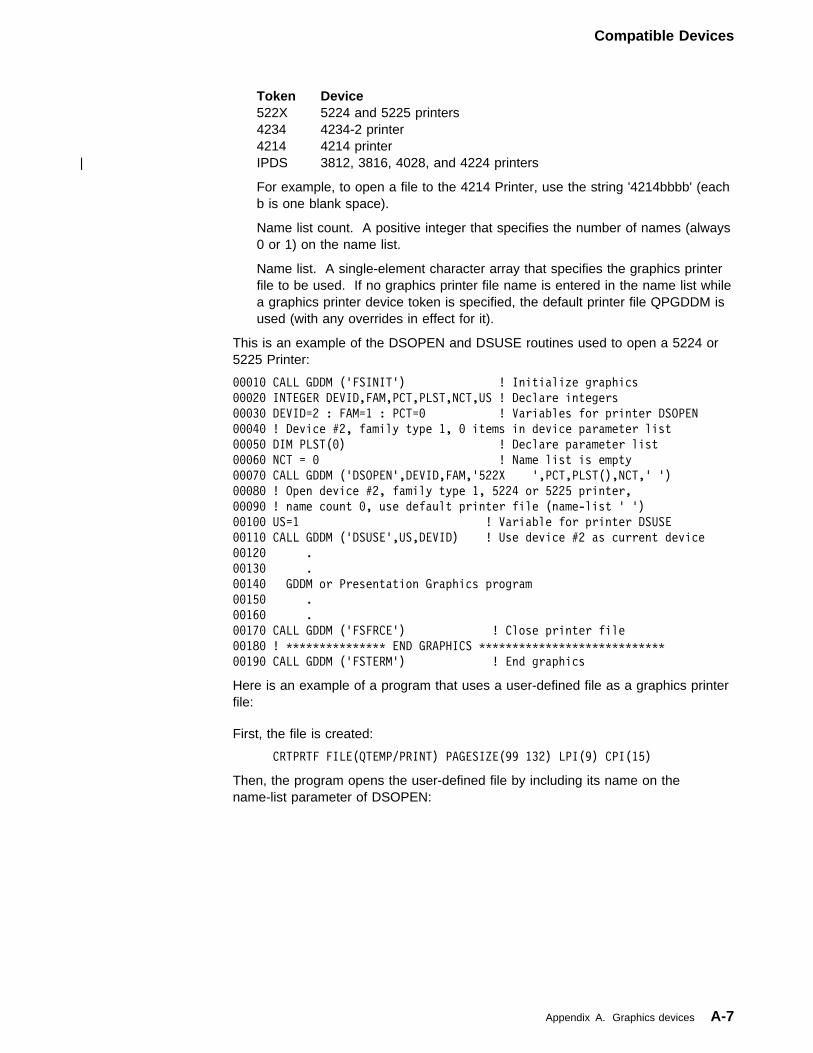
Compatible Devices
Token Device522X 5224 and 5225 printers4234 4234-2 printer4214 4214 printer
| IPDS 3812, 3816, 4028, and 4224 printers
For example, to open a file to the 4214 Printer, use the string '4214bbbb' (eachb is one blank space).
Name list count. A positive integer that specifies the number of names (always0 or 1) on the name list.
Name list. A single-element character array that specifies the graphics printerfile to be used. If no graphics printer file name is entered in the name list whilea graphics printer device token is specified, the default printer file QPGDDM isused (with any overrides in effect for it).
This is an example of the DSOPEN and DSUSE routines used to open a 5224 or5225 Printer:
���1� CALL GDDM ('FSINIT') ! Initialize graphics
���2� INTEGER DEVID,FAM,PCT,PLST,NCT,US ! Declare integers
���3� DEVID=2 : FAM=1 : PCT=� ! Variables for printer DSOPEN
���4� ! Device #2, family type 1, � items in device parameter list
���5� DIM PLST(�) ! Declare parameter list
���6� NCT = � ! Name list is empty
���7� CALL GDDM ('DSOPEN',DEVID,FAM,'522X ',PCT,PLST(),NCT,' ')
���8� ! Open device #2, family type 1, 5224 or 5225 printer,
���9� ! name count �, use default printer file (name-list ' ')
��1�� US=1 ! Variable for printer DSUSE
��11� CALL GDDM ('DSUSE',US,DEVID) ! Use device #2 as current device
��12� .
��13� .
��14� GDDM or Presentation Graphics program
��15� .
��16� .
��17� CALL GDDM ('FSFRCE') ! Close printer file
��18� ! ��������������� END GRAPHICS ����������������������������
��19� CALL GDDM ('FSTERM') ! End graphics
Here is an example of a program that uses a user-defined file as a graphics printerfile:
First, the file is created:
CRTPRTF FILE(QTEMP/PRINT) PAGESIZE(99 132) LPI(9) CPI(15)
Then, the program opens the user-defined file by including its name on thename-list parameter of DSOPEN:
Appendix A. Graphics devices A-7
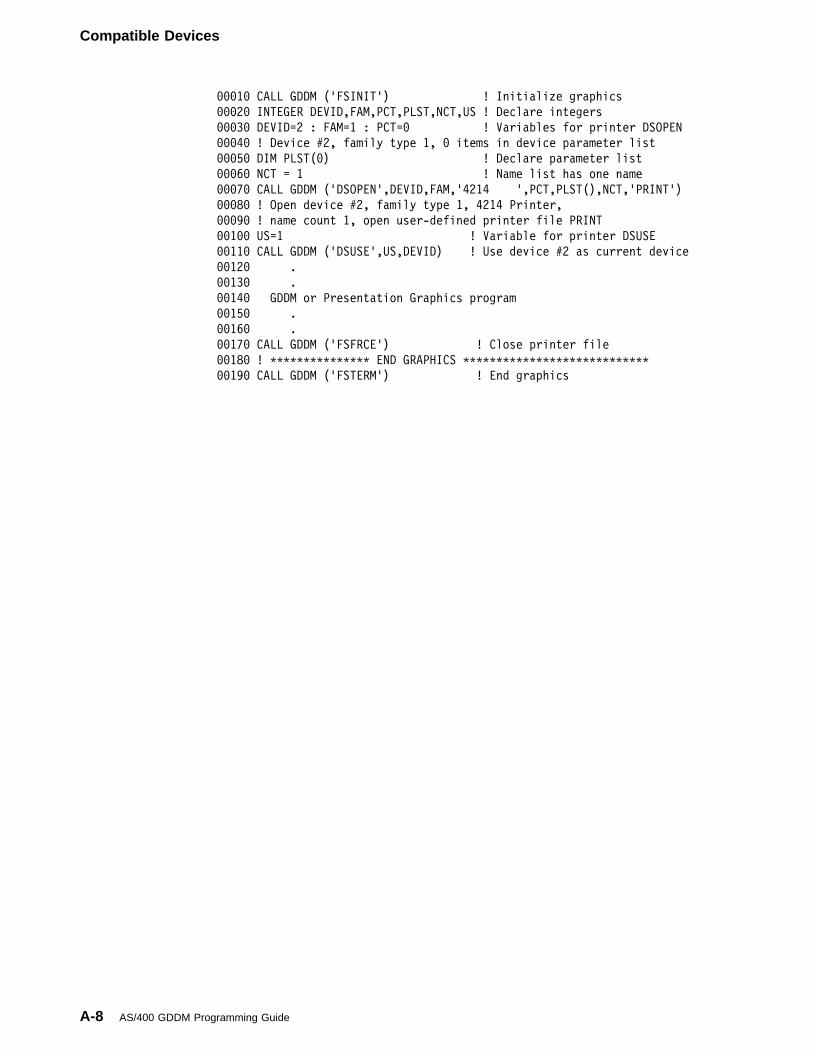
Compatible Devices
���1� CALL GDDM ('FSINIT') ! Initialize graphics
���2� INTEGER DEVID,FAM,PCT,PLST,NCT,US ! Declare integers
���3� DEVID=2 : FAM=1 : PCT=� ! Variables for printer DSOPEN
���4� ! Device #2, family type 1, � items in device parameter list
���5� DIM PLST(�) ! Declare parameter list
���6� NCT = 1 ! Name list has one name
���7� CALL GDDM ('DSOPEN',DEVID,FAM,'4214 ',PCT,PLST(),NCT,'PRINT')
���8� ! Open device #2, family type 1, 4214 Printer,
���9� ! name count 1, open user-defined printer file PRINT
��1�� US=1 ! Variable for printer DSUSE
��11� CALL GDDM ('DSUSE',US,DEVID) ! Use device #2 as current device
��12� .
��13� .
��14� GDDM or Presentation Graphics program
��15� .
��16� .
��17� CALL GDDM ('FSFRCE') ! Close printer file
��18� ! ��������������� END GRAPHICS ����������������������������
��19� CALL GDDM ('FSTERM') ! End graphics
A-8 AS/400 GDDM Programming Guide
Compatible Devices
Merging Text and Graphics for Print FilesYou can merge text and graphics for print files. For the 5224, 5225, 4214, and4234-2 printers, merging text and graphics is only supported for program-describedprint files and the application must be coded in the RPG/400 programminglanguage.
For IPDS printers, merging text and graphics is supported for bothprogram-described print files and externally described print files. For programdescribed print files, the application program must be coded in the RPG/400programming language. For externally described print files, the application program
| can be in BASIC, the COBOL/400 language, Pascal, PL/I, or the RPG/400programming language.
For both program-described and externally described print files, there are somerules that must be followed to merge text and graphics:
1. Open the print file with SHARE(*YES). Specify SHARE(*YES) on theOVRPRTF command. If this is not done, two separate print files (one for text,and one for graphics) are produced.
The name of the print file specified on the GDDM DSOPEN call statement mustbe the same as the name of the print file specified on the RPG OPENstatement when opening the print file for text. In the example below, both arecalled QPGDDM.
2. The print file must be opened for graphics before it can be opened for text.Specify the GDDM DSOPEN statement first before you open the print file withan OPEN statement.
3. PUTs for text may be intermixed with PUTs for graphics. When printinggraphics on a page, use the GDDM FSFRCE statement to print the page. TheGDDM FSFRCE statement will cause any graphics created for the page (andalso text) to be printed. The GDDM FSFRCE statement also causes a pageeject and skips to line one of the next page.
If a page contains text and graphics, you must use the GDDM FSFRCE to ejectthe page. Do not skip to a new page with controls specified from theprogram-described or externally described file.
If a page contains only text (no graphics), do not use the GDDM FSFRCEstatement. Use print controls for program-described or externally describedprint files to skip to a new page.
4. There is no required order for closing the print file. The file is closed forgraphics by using the GDDM FSTERM statement, and for text by using theCLOSE statement of the language you are using.
Appendix A. Graphics devices A-9
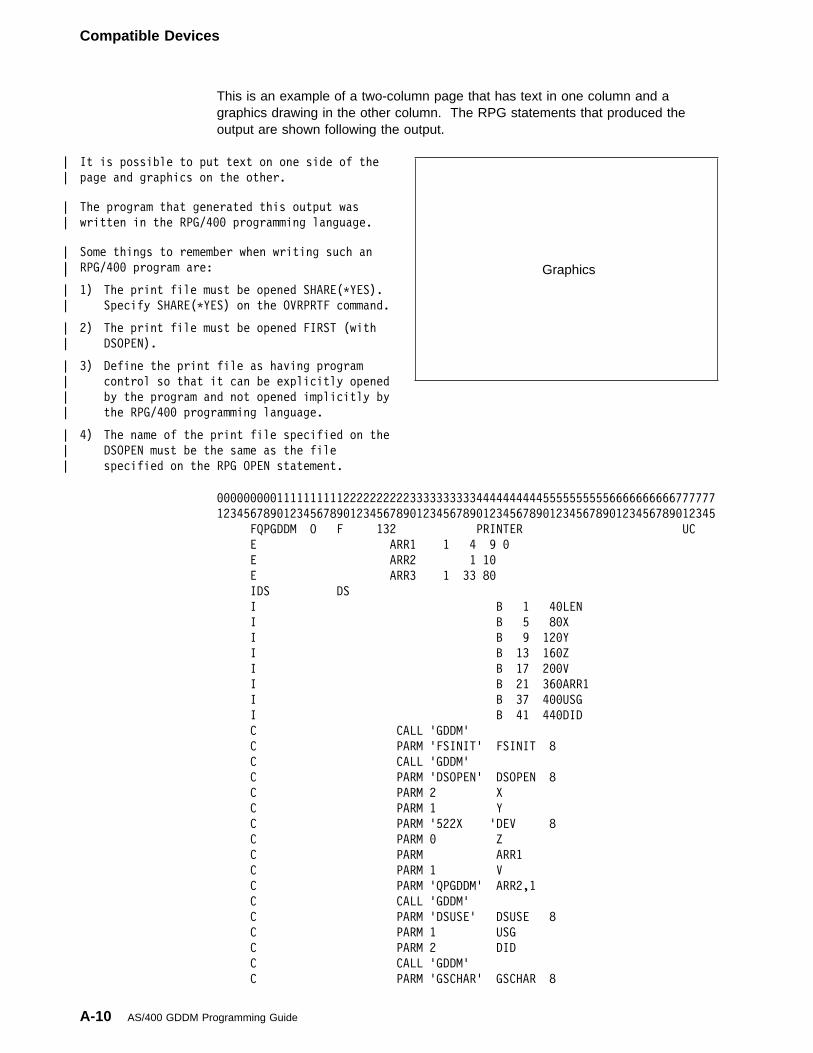
Compatible Devices
This is an example of a two-column page that has text in one column and agraphics drawing in the other column. The RPG statements that produced theoutput are shown following the output.
| It is possible to put text on one side of the
| page and graphics on the other.
| The program that generated this output was
| written in the RPG/4�� programming language.
| Some things to remember when writing such an
| RPG/4�� program are:
| 1) The print file must be opened SHARE(�YES).
| Specify SHARE(�YES) on the OVRPRTF command.
| 2) The print file must be opened FIRST (with
| DSOPEN).
| 3) Define the print file as having program
| control so that it can be explicitly opened
| by the program and not opened implicitly by
| the RPG/4�� programming language.
| 4) The name of the print file specified on the
| DSOPEN must be the same as the file
| specified on the RPG OPEN statement.
| Graphics
���������111111111122222222223333333333444444444455555555556666666666777777
123456789�123456789�123456789�123456789�123456789�123456789�123456789�12345
FQPGDDM O F 132 PRINTER UC
E ARR1 1 4 9 �
E ARR2 1 1�
E ARR3 1 33 8�
IDS DS
I B 1 4�LEN
I B 5 8�X
I B 9 12�Y
I B 13 16�Z
I B 17 2��V
I B 21 36�ARR1
I B 37 4��USG
I B 41 44�DID
C CALL 'GDDM'
C PARM 'FSINIT' FSINIT 8
C CALL 'GDDM'
C PARM 'DSOPEN' DSOPEN 8
C PARM 2 X
C PARM 1 Y
C PARM '522X 'DEV 8
C PARM � Z
C PARM ARR1
C PARM 1 V
C PARM 'QPGDDM' ARR2,1
C CALL 'GDDM'
C PARM 'DSUSE' DSUSE 8
C PARM 1 USG
C PARM 2 DID
C CALL 'GDDM'
C PARM 'GSCHAR' GSCHAR 8
A-10 AS/400 GDDM Programming Guide
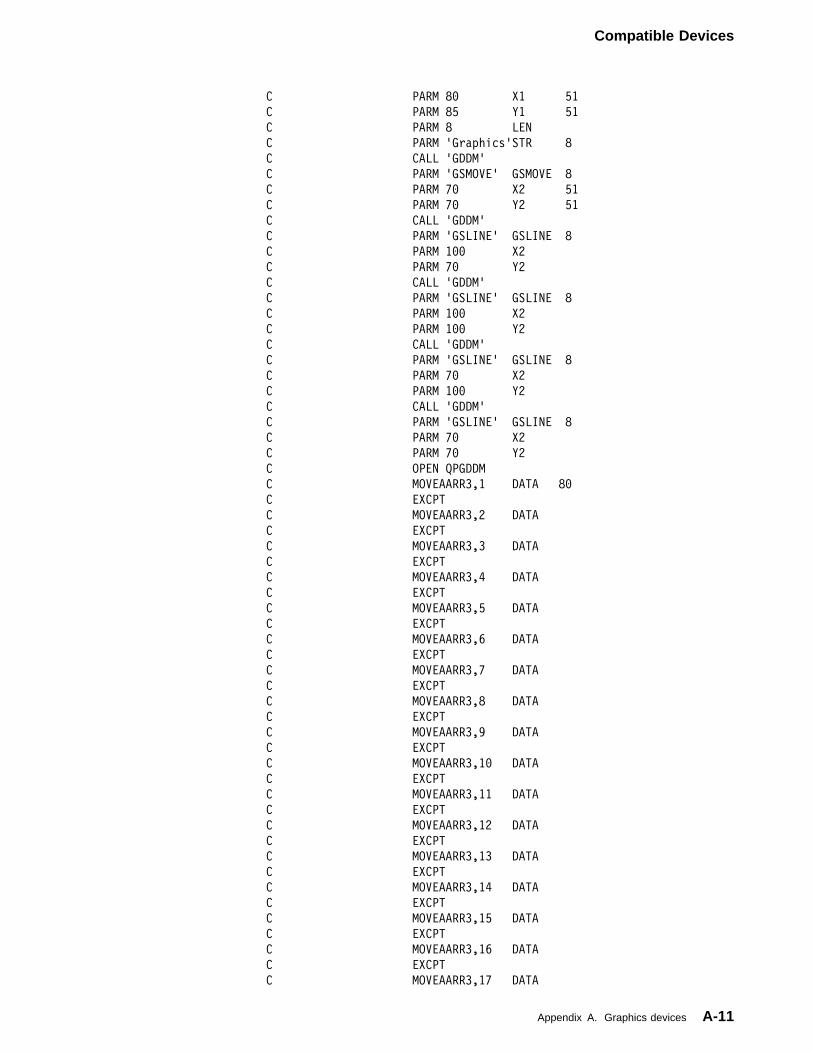
Compatible Devices
C PARM 8� X1 51
C PARM 85 Y1 51
C PARM 8 LEN
C PARM 'Graphics'STR 8
C CALL 'GDDM'
C PARM 'GSMOVE' GSMOVE 8
C PARM 7� X2 51
C PARM 7� Y2 51
C CALL 'GDDM'
C PARM 'GSLINE' GSLINE 8
C PARM 1�� X2
C PARM 7� Y2
C CALL 'GDDM'
C PARM 'GSLINE' GSLINE 8
C PARM 1�� X2
C PARM 1�� Y2
C CALL 'GDDM'
C PARM 'GSLINE' GSLINE 8
C PARM 7� X2
C PARM 1�� Y2
C CALL 'GDDM'
C PARM 'GSLINE' GSLINE 8
C PARM 7� X2
C PARM 7� Y2
C OPEN QPGDDM
C MOVEAARR3,1 DATA 8�
C EXCPT
C MOVEAARR3,2 DATA
C EXCPT
C MOVEAARR3,3 DATA
C EXCPT
C MOVEAARR3,4 DATA
C EXCPT
C MOVEAARR3,5 DATA
C EXCPT
C MOVEAARR3,6 DATA
C EXCPT
C MOVEAARR3,7 DATA
C EXCPT
C MOVEAARR3,8 DATA
C EXCPT
C MOVEAARR3,9 DATA
C EXCPT
C MOVEAARR3,1� DATA
C EXCPT
C MOVEAARR3,11 DATA
C EXCPT
C MOVEAARR3,12 DATA
C EXCPT
C MOVEAARR3,13 DATA
C EXCPT
C MOVEAARR3,14 DATA
C EXCPT
C MOVEAARR3,15 DATA
C EXCPT
C MOVEAARR3,16 DATA
C EXCPT
C MOVEAARR3,17 DATA
Appendix A. Graphics devices A-11
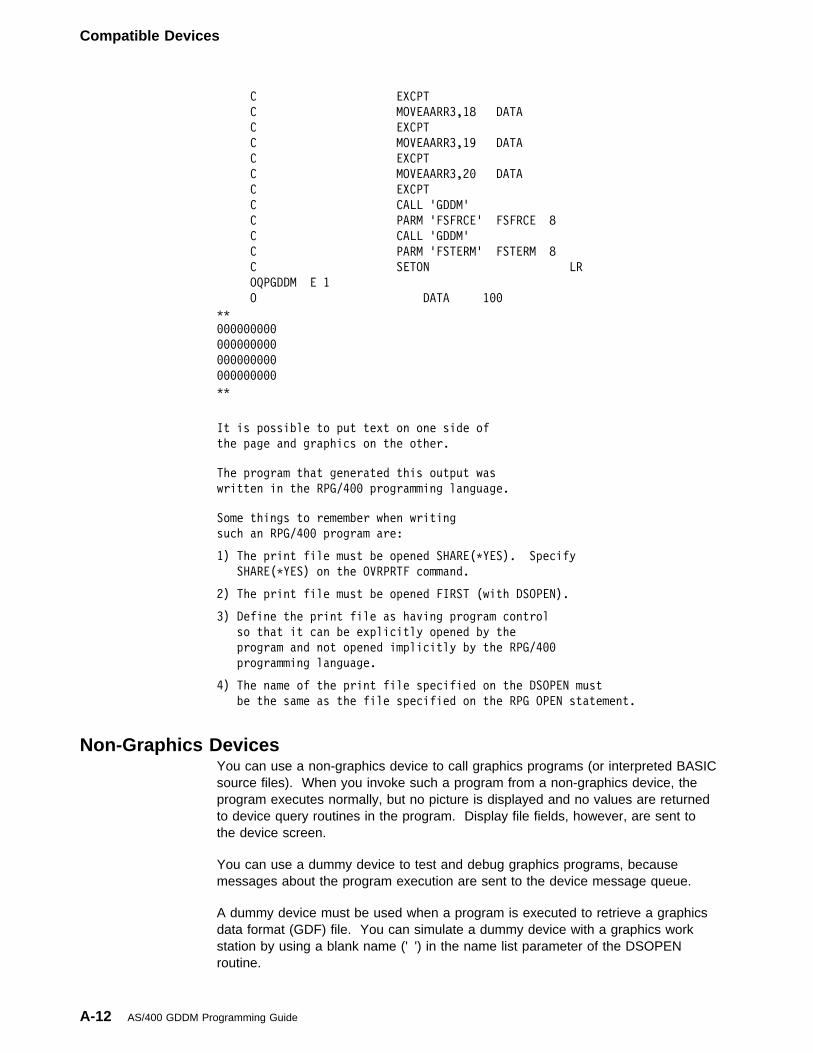
Compatible Devices
C EXCPT
C MOVEAARR3,18 DATA
C EXCPT
C MOVEAARR3,19 DATA
C EXCPT
C MOVEAARR3,2� DATA
C EXCPT
C CALL 'GDDM'
C PARM 'FSFRCE' FSFRCE 8
C CALL 'GDDM'
C PARM 'FSTERM' FSTERM 8
C SETON LR
OQPGDDM E 1
O DATA 1��
��
���������
���������
���������
���������
��
It is possible to put text on one side of
the page and graphics on the other.
The program that generated this output was
written in the RPG/4�� programming language.
Some things to remember when writing
such an RPG/4�� program are:
1) The print file must be opened SHARE(�YES). Specify
SHARE(�YES) on the OVRPRTF command.
2) The print file must be opened FIRST (with DSOPEN).
3) Define the print file as having program control
so that it can be explicitly opened by the
program and not opened implicitly by the RPG/4��
programming language.
4) The name of the print file specified on the DSOPEN must
be the same as the file specified on the RPG OPEN statement.
Non-Graphics DevicesYou can use a non-graphics device to call graphics programs (or interpreted BASICsource files). When you invoke such a program from a non-graphics device, theprogram executes normally, but no picture is displayed and no values are returnedto device query routines in the program. Display file fields, however, are sent tothe device screen.
You can use a dummy device to test and debug graphics programs, becausemessages about the program execution are sent to the device message queue.
A dummy device must be used when a program is executed to retrieve a graphicsdata format (GDF) file. You can simulate a dummy device with a graphics workstation by using a blank name (' ') in the name list parameter of the DSOPENroutine.
A-12 AS/400 GDDM Programming Guide
| Bibliography
| The following AS/400 manuals contain information you| may need. The manuals are listed with their full title| and base order number. When these manuals are| referred to in this manual, the short title is used.
| � Application Development Tools: Source Entry Utility| User’s Guide and Reference, SC09-1338 provides| the application programmer or programmer with| information about using the Application| Development Tools source entry utility (SEU) to| create and edit source members. The manual| explains how to start and end an SEU session and| how to use the many features of this full-screen text| editor. The manual contains examples to help both| new and experienced users accomplish various| editing tasks, from the simplest line commands to| using pre-defined prompts for high-level languages| and data formats.
| Short Title: SEU User’s Guide and Reference
| � Business Graphics Utility User’s Guide and| Reference, SC09-1408 provides the application| programmer, programmer, system administrator, or| business or technical professional with information| about using the AS/400 Business Graphics Utility| (BGU) to create various types of charts. It is| divided into two sections: the first section includes| several exercises that familiarize the user with the| functions of BGU, and the second section contains| reference material.
| Short Title: BGU User’s Guide and Reference
| � Data Description Specifications Reference,| SC41-9620, provides the application programmer| with detailed descriptions of the entries and| keywords needed to describe database files (both| logical and physical) and certain device files (for| displays, printers, and ICF) external to the user’s| programs.
| Short Title: DDS Reference
| � Languages: BASIC User’s Guide and Reference,| SC09-1157, provides the application programmer| with the information needed to write, test, and| maintain AS/400 BASIC programs in both the| AS/400 environment and the System/38| environment.
| Short Title: BASIC User’s Guide and Reference
| � Languages: Pascal User’s Guide, SC09-1209,| provides the application programmer with| information about how to use the AS/400 Pascal| compiler. The manual explains how to enter,| compile, run, and debug AS/400 Pascal programs.| It also describes how to use input and output (I/O)| function and storage.
| Short Title: Pascal User’s Guide
| � Languages: PL/I User’s Guide and Reference,| SC09-1156, provides the application programmer| with information about using AS/400 PL/I in the| System/38 environment. Differences between the| System/38 environment and the AS/400| environment are identified as well as the| enhancements available in the AS/400 environment.
| Short Title: PL/I User’s Guide and Reference
| � Languages: Systems Application Architecture*| AD/Cycle* RPG/400* User’s Guide, SC09-1348,| provides the application programmer with the| information needed to write, test, and maintain| RPG/400 programs on the AS/400 system. The| manual provides information on data organizations,| data formats, file processing, multiple file| processing, automatic report function, RPG| command statements, testing and debugging| functions, application design techniques, problem| analysis, and compiler service information. The| differences between the System/38 RPG III,| System/38-compatible RPG, and RPG/400 are| identified.
| Short Title: RPG/400* User’s Guide
| � Languages: System/38-Compatible COBOL User’s| Guide and Reference, SC09-1159, provides the| application programmer with information about using| System/38-compatible COBOL on the AS/400| system.
| It provides information on how to program in| COBOL on the AS/400 system, like a System/38,| and how to use existing System/38 COBOL| programs.
| Short Title: System/38-Compatible COBOL User’s| Guide and Reference
| � Programming: Control Language Reference,| SC41-0030, provides the application programmer| with a description of the AS/400 control language| (CL) and its commands. Each command| description includes a syntax diagram, parameters,| default values, keywords, and an example. The| information should be used to refer to the control| language commands to request functions of the| Operating System/400 (5728-SS1) licensed program| and of the various languages and utilities.
| Short Title: CL Reference
| � Programming: GDDM Programming Reference,| SC41-0537, provides the application programmer| with information about using OS/400 graphical data| display manager (GDDM) to write graphics| application programs. This manual provides
Copyright IBM Corp. 1991 H-1
| detailed descriptions of all graphics routines| available in GDDM. It also provides information| about high-level language interfaces for GDDM.
| Short Title: GDDM Programming Reference
| � Programming: Reference Summary, SX41-0028| provides the system operator or system
| administrator with quick information about the| organization of the AS/400 commands. This| manual contains an alphabetic list of all AS/400| commands and a list, by command, of error| messages the programmer can monitor for when| writing programs.
| Short Title: Programming Reference Summary
H-2 AS/400 GDDM Programming Guide
Index
Index
Numerics4214 printer
configuring A-1device token A-7symbol set 3-28
5224/5225 printersconfiguring A-1device tokens A-7example program A-7
Aabsolute data
specified for composite bar chart 4-72specified for pie chart 4-79specified for surface chart 4-56
activate device 3-66alarm, sounding device 3-67algorithm for area-fill 3-23ALWGPH DDS keyword
example of 5-4graphics display mode 5-2
angle of character 3-32application programs
CALL GDDM statement 2-2compiling 2-1complex Presentation Graphics program in
BASIC 6-15complex Presentation Graphics program in BASIC
with DDS subfiles 6-21complex Presentation Graphics program in
COBOL/400 6-28complex Presentation Graphics program in
PL/I 6-33composite-bar chart in BASIC 4-72declaring arrays in BASIC 2-12declaring variables 2-5description of 2-1entering 2-1environment 2-5executing 2-1floating surface chart in BASIC 4-60floating-bar chart in BASIC 4-75GDDM color table program in PL/I 6-36GDDM order form program in PL/I 6-40GDF (graphics data format) file 3-69graphics image in BASIC 3-36, 6-54graphics image in COBOL/400 6-58graphics image in Pascal 6-63graphics image in PL/I 6-62graphics image in RPG/400 6-55
application programs (continued)histogram in BASIC 4-88ideas for 1-1, 2-15initializing environment for 2-12line chart in BASIC 4-49multiple-bar chart in BASIC 4-67, 4-69multiple-pie chart in BASIC 4-83, 4-85pie chart in BASIC 4-79pie chart program with GDDM in RPG/400 6-47scatter plot in BASIC 4-53simple GDDM envelope program in BASIC 2-3simple GDDM envelope program in
COBOL/400 6-5simple GDDM envelope program in Pascal 6-9simple GDDM envelope program in PL/I 6-8simple GDDM envelope program in RPG/400 6-2simple Presentation Graphics line chart in
BASIC 2-11simple Presentation Graphics line chart program in
COBOL/400 6-12simple Presentation Graphics line chart program in
Pascal 6-13simple Presentation Graphics line chart program in
PL/I 6-13simple Presentation Graphics line chart program in
RPG/400 6-11single-bar chart in BASIC 4-64surface chart in BASIC 4-58terminating 2-11, 2-13Venn diagram in BASIC 4-90
arcsdrawing 3-17drawing a series of 3-17elliptic 3-19polyfillet 3-19
area-filldefinition 2-9patterns for 3-24primitive 3-22routines specified during 3-22shading algorithm 3-23
area, chart 4-15arrays used in BASIC programs 2-12aspect ratio
default 3-54definition 3-54query graphics window 3-55query picture space 3-50query viewport 3-53specified by graphics window coordinates 3-54specified by picture space 3-48specified by viewport 3-50
Copyright IBM Corp. 1991 X-1
Index
ASREAD (send output to device) 2-10, 3-42attribute-selection tables 3-3, 4-47attributes
chart features 4-18clipping of primitives 3-55definition 3-2for GDDM characters 3-27for GDDM graphics images 3-38for GDDM markers 3-39line types for GDDM 3-12line types for Presentation Graphics charts 4-47line widths for GDDM 3-14marker types Presentation Graphics charts 4-47patterns for GDDM area-fills 3-22patterns for Presentation Graphics charts 4-47setting initial 2-2shading attributes for area-fill 3-24
attributes, for chart featuresaxis labels 4-33axis lines 4-23axis titles 4-30background 4-18bar chart components 4-62composite-bar chart components 4-71data groups (components) 4-47data values on bar charts 4-63data values on pie charts 4-78datum lines 4-40floating surface chart components 4-60floating-bar chart components 4-75framing box 4-18grid lines 4-38heading 4-19histogram components 4-87labels for legend keys 4-42labels for pie chart spider keys 4-42labels for Venn diagrams 4-42legend text 4-41line chart components 4-47multiple-bar chart components 4-65multiple-pie chart components 4-81notes 4-43pie chart components 4-77pie chart spider tags and labels 4-78reference lines 4-23scatter plot components 4-51surface chart components 4-54tick marks 4-29translated axis lines 4-40Venn diagram components 4-89
auto-rangingdefinition 4-26with zero value 4-26
auxiliary devices A-1axes, chart
datum lines 4-39
axes, chart (continued)duplicate 4-22forcing axes 4-22grid lines 4-37independent and dependent variables 4-21intercept 4-23labels 4-32number of axes 4-22orientation 4-24position 4-17, 4-23quadrant 4-24range 4-26scale 4-26secondary 4-23selecting current 4-22setting attributes for 4-23specifying when to draw 4-21suppressing or drawing 4-21tick marks 4-28titles 4-30translated axis lines 4-39user-specified labels 4-36
axisSee axes, chart
axis position in chart-drawing area 4-23axis reference lines, chart 4-20
Bbar charts
blank the data value area 4-63complex chart program in BASIC 6-15, 6-21composite-bar sample program 4-72data values positioned 4-63data values represented 4-63definition 4-7drawing 4-62drawing routine 4-63floating-bar sample program 4-75multiple-bar sample program 4-67multiple-bar sample program using CHNUM 4-69number of bars 4-65number of bars per chart 4-69orientation (horizontal/vertical) 4-24shading, suppressing 4-62single bar sample program 4-64types 4-7uses for 4-7
baseline angle, character 3-32BASIC
CALL GDDM statement 2-2complex Presentation Graphics program 6-15complex Presentation Graphics program with DDS
subfiles 6-21conversion for COBOL/400 image bit pattern 6-58declaring arrays in 2-12
X-2 AS/400 GDDM Programming Guide
Index
BASIC (continued)GDDM envelope program 2-3GDF (graphics data format) file program 3-69graphics image program 3-36, 6-54plotter routines in program A-5program conventions 2-4, 2-12simple line chart program 2-12syntax for character values 2-4syntax for floating-point values 2-4syntax for integer values 2-4syntax for specifying routines 2-4using for graphics 1-3using the interpreter 2-1
BGU (Business Graphics Utility) 4-1binary logic 3-10bit patterns 3-35blanking of area
for axis labels 4-33for chart notes 4-43for data value on bar charts 4-63for data value on pie charts 4-78for legends 4-41shown in Venn diagram example 4-90
boxas frame around chart 4-18as frame around chart note 4-43as frame around legend 4-42character 3-31setting size for character box 4-16size for GDDM characters 3-30
CCALL GDDM statement 2-2CHAATT (set axis line attributes) 4-23character grid 4-16character values in BASIC programs 2-4characters
angle 3-32attributes for axis labels 4-33attributes for axis titles 4-30attributes for GDDM 3-30axis titles for chart 4-31baseline angle 3-33character box 3-30chart notes 4-43direction of 3-30, 3-33drawing 2-10effect of graphics window on 3-30fonts 3-25, 5-10graphics symbol primitives 3-25hardware cell 3-30hardware characters 3-26languages 3-25, 5-7modes 2 and 3 3-26, 5-7mono-spaced 5-9
characters (continued)multinational sets available 5-9multiplier 4-16orientation 3-32proportionally-spaced 5-9punctuation of large numbers on charts 4-34rotation 3-33routines for attributes 3-32routines for drawing 3-29routines for GSS 3-27selecting font 3-29selecting mode 3-29selecting size 3-31setting angle 3-32shear 3-32, 3-34size 2-10size for GDDM 3-30size for Presentation Graphics chart text 4-16string 2-10syntax of symbol set names 5-9text box 3-30
CHAREA (specify chart area) 4-15chart definition
chart attributes 4-18chart headings 4-19chart layout 4-15legends 4-40notes 4-43routines 4-14, 4-45
chart drawing routines 4-46charts
definition routines 4-14, 4-45drawing with Presentation Graphics routines 4-13framing 4-18headings 4-19margin size 4-17notes 4-43orientation (horizontal/vertical) 4-24selecting a type 4-12types 4-4using to show data 4-12
CHBAR (plot a bar chart) 4-63CHBATT (set framing box attributes) 4-18CHCGRD (set character grid) 4-30CHCGRD (set character spacing) 4-16CHCOL (set color table) for bar charts 4-62CHCOL (set color table) for histograms 4-87CHCOL (set color table) for line charts 4-47CHCOL (set color table) for pie charts 4-77CHCOL (set color table) for scatter plots 4-51CHCOL (set color table) for surface charts 4-54CHCOL (set color table) for Venn diagrams 4-89CHDATT (set datum line attributes) 4-40CHDRAX (draw axes) 4-22CHFINE (set curve fitting smoothness) 4-48
Index X-3
Index
CHFINE (set curve-fitting smoothness) 4-55CHGAP (set spacing between bars) 4-63CHGATT (set grid line attributes) 4-38CHGGAP (set gap between bar groups) 4-65CHHATT (set heading text attributes) 4-19CHHEAD (specify heading text) 4-19CHHIST (plot a histogram) 4-87CHHMAR (set horizontal chart margins) 4-17CHKATT (set legend text attributes) 4-42CHKEY (set legend key labels) 4-42CHKEYP (set legend position) 4-41CHKMAX (set maximum legend height/width) 4-41CHKOFF (set legend offset) 4-41CHLATT (set axis label attributes) 4-33CHLT (set component line type table) 4-47CHLW (set component line width table) 4-48CHMARK (set component marker table) 4-48, 4-51CHNATT (set note attributes) 4-43CHNOFF (set note offset) 4-43CHNOTE (specify notes) 4-43CHNUM (set number of components) for bar
charts 4-65, 4-69CHNUM (set number of components) for pie
charts 4-82CHPAT (set component shading pattern table) for
bar charts 4-62CHPAT (set component shading pattern table) for
histograms 4-87CHPAT (set component shading pattern table) for
pie charts 4-77CHPAT (set component shading pattern table) for
surface charts 4-55CHPAT (set component shading pattern table) for
Venn diagrams 4-90CHPIE (plot a pie chart) 4-79CHPIER (reduce pie chart size) 4-82CHPLOT (plot a line graph or scatter plot) 2-13,
4-49, 4-52CHRNIT (reinitialize chart definition options) 4-16,
4-92CHSET (set chart options)
absolute data versus relative data 4-56background for chart 4-18blank axis label area 4-33blank legend area 4-41blank note area 4-43blank values for bar chart components 4-63blank values for pie chart components 4-78composite-bar chart 4-72draw legend or labels for pie chart 4-41, 4-77duplicating axes 4-22floating-bar chart 4-75frame around chart 4-18frame around chart note 4-43frame around legend 4-42labels for pie chart versus legend 4-77
CHSET (set chart options) (continued)multiple-bar chart 4-65orientation for axes 4-24percentage or absolute values shown, pie
chart 4-79position for bar chart values 4-63position heading 4-20proportional size for pie chart 4-82reverse order of legend keys 4-41specify curved lines 4-48spider tag and value text color 4-78suppress heading 4-19suppress legend 4-40suppress lines 4-52suppress markers 4-48suppress punctuation 4-34suppress risers for histogram 4-87suppress shading of histogram 4-87suppress shading patterns 4-55type of shading 4-56values for bar chart components 4-63values for pie charts 4-78when to draw axes 4-21
CHSTRT (reset processing state) 4-16, 4-92CHSURF (plot a surface chart) 4-58CHTATT (set axis title attributes) 4-30CHTERM (terminate Presentation Graphics) 4-16,
4-92CHVATT (set value text attributes) 4-63, 4-78CHVCHR (set number of value text
characters) 4-63, 4-78CHVENN (plot a Venn diagram) 4-90CHVMAR (set vertical chart margins) 4-17CHXDAY (set x-axis day labels) 4-36CHXDTM (set x-axis datum line) 4-40CHXINT (set x-axis intercept) 4-24CHXLAB (specify x-axis label text) 4-36, 4-82CHXLAT (set x-axis label attributes) 4-33CHXMTH (set x-axis month labels) 4-34CHXRNG (set x-axis explicit range) 4-26CHXSCL (set x-axis scale factor) 4-34CHXSEL (select x axis) 4-22CHXSET (set x-axis options)
axis label position 4-33axis label type 4-33axis title position 4-31grid lines 4-38intercept axis 4-23logarithmic axis scale 4-27position axis 4-23position axis labels 4-33position axis title 4-31suppress axis 4-21suppress grid lines 4-38suppress zero as axis range limit 4-26tick mark type 4-29
X-4 AS/400 GDDM Programming Guide
Index
CHXTIC (set x-axis tick mark interval) 4-28CHXTTL (set x-axis title) 4-31CHYDAY (set y-axis day labels) 4-36CHYDTM (set y-axis datum line) 4-40CHYINT (set y-axis intercept) 4-24CHYLAB (specify y-axis label text) 4-36CHYLAT (set y-axis label attributes) 4-33CHYMTH (set y-axis month labels) 4-34CHYRNG (set y-axis explicit range) 4-26CHYSCL (set y-axis scale factor) 4-34CHYSEL (select y axis) 4-22CHYSET (set y-axis options)
See CHXSET (set x-axis options)CHYTIC (set y-axis tick mark interval) 4-28CHYTTL (set y-axis title) 4-31circles that look like ovals 3-54circles, drawing 3-17CL commands for *GSS object management 5-12clearing a page 3-47clearing graphics field 3-48clipping
definition 3-55query clipping status 3-56specific routines 3-56
close a device 3-66close a graphics segment 3-58closure line 3-22COBOL/400
CALL GDDM statement 2-2GDDM envelope program 6-5graphics image program 6-58multiple-pie chart Presentation Graphics
program 6-28simple Presentation Graphics line chart
program 6-12using for graphics 1-3
colorcodes 3-2color tables 3-3colors other than from default table 3-5mixing 3-7overpaint 3-7pie chart spider tag and value text color 4-78primary 3-7setting attributes for 3-2
color definition 3-3color selection 3-2color table
colors other than default table 3-5default 3-3defining 3-3for display 3-4for plotter 3-4mixing 3-7number of entries per table 3-6overpaint 3-7
color table (continued)PL/I program for setting 6-36primary 3-7
color-selection table for bar charts 4-62color-selection table for line chart
components 4-47color-selection table for pie charts 4-77color-selection table for scatter plots 4-51color-selection table for surface charts 4-54coloring in an area 2-9, 3-22commands (CL) for *GSS object management 5-12compiling programs 2-1complex GDDM program in PL/I 6-36, 6-40complex GDDM/Presentation Graphics program in
RPG/400 6-47complex Presentation Graphics program in
BASIC 6-15complex Presentation Graphics program in BASIC,
with DDS subfiles 6-21complex Presentation Graphics program in
COBOL/400 6-28complex Presentation Graphics program in
PL/I 6-33components
attributes 4-47color-selection table for bar charts 4-62color-selection table for pie charts 4-77color-selection table for surface charts 4-54color-selection table line charts 4-47color-selection table scatter plots 4-51curve-fitting attribute 4-48, 4-55data values on bar charts 4-63data values on pie charts 4-78gaps between bars in bar charts 4-63gaps between groups of bars in bar charts 4-65line chart 2-13line-type table for components 4-47line-width table for components 4-48marker-selection table for components 4-48, 4-51pattern-selection table for components 4-55, 4-62,
4-77composite-bar chart
description 4-7example 4-72
compound polyfillet 3-19configuration of display device A-2configuration of plotter A-3constant values in GDDM routines 2-14constant values in Presentation Graphics
routines 4-13construction lines 3-17, 3-19controlling pie chart slices 4-79controls
alter flow of program 3-42clipping 3-55color 3-2
Index X-5
Index
controls (continued)graphics symbol 3-27in Presentation Graphics programs 4-13picture 3-43processing state 4-92shading 3-22sounding alarm 3-67specific device control routines 3-65specific routines for controlling graphics 3-41
coordinatesdefault 2-5effect on characters 3-34picture of 2-6query coordinate system 3-55specifying 3-54too large for viewport 3-55
creating a graphics segment 3-58creating a page 3-45creating graphics field 3-48CRTGSS (create graphics symbol set)
command 5-11current marker symbol 3-39current marker symbol scale 3-39current mode 3-2, 3-40current position 2-6, 3-11current position, moving 3-15curve-fitting attribute 4-48, 4-55curved line
connected 3-17drawing a series of 3-17
Ddata groups
attributes 4-47color-selection table for bar charts 4-62color-selection table for line charts 4-47color-selection table for pie charts 4-77color-selection table for scatter plots 4-51color-selection table for surface charts 4-54curve-fitting attribute 4-48, 4-55data values on bar charts 4-63data values represented 4-78definition 4-1gaps between bars in bar charts 4-63gaps between groups of bars in bar charts 4-65line-type table for components 4-47line-width table for components 4-48marker-selection table for components 4-48, 4-51pattern-selection table for components 4-55, 4-62,
4-77data types
in GDDM routines 2-14in Presentation Graphics routines 4-13temporary and retained 3-63
data valuearea blanked 4-63, 4-78on bar charts 4-63on pie charts 4-78
database files used with graphics 6-21datum lines
attributes for 4-40description 4-39
day-of-the-week labels 4-36DDS files
used with GDDM programs 6-36used with graphics 6-21used with OS/400 Graphics 5-1
declaring variables 2-5declaring variables in BASIC 2-12default symbol set 3-27defining colors 3-3defining the color table 3-3delete symbol set command 5-12deleting a graphics segment 3-58deleting a page 3-47dependent variables 2-13, 4-21depth/width of picture 3-48, 3-50device tokens A-3, A-7devices
attributes for lines 3-13color mixing for devices 3-8color table 3-3configure plotter A-3controls 3-65description of IBM plotters A-3differences in pictures between devices A-1dummy devices 3-65, A-12graphics devices compatible with the AS/400
System A-1hardware character grid 4-16in graphics hierarchy 3-43multiple devices 3-65needed for graphics 1-2plotter routine parameters A-3primary device 3-65query device characteristics 3-67satellite devices A-1setting form feed A-4setting paper size A-4setting pen speed on plotter A-4setting pen width on plotter A-4shading attributes for area-fill 3-25sounding alarm 3-67specific control routines 3-65using a 5251 non-graphics device 3-66using non-graphics display stations A-12with ALWGPH keyword 5-3
diagnostic messages 5-16, 5-17direction of characters 3-33
X-6 AS/400 GDDM Programming Guide
Index
display controls 3-42display device
closing device 3-66color mixing 3-8color table 3-3default device 3-66default size of page 3-46dummy devices 3-65hardware cell 3-30, 3-32hardware character grid 4-16how to configure A-2in graphics hierarchy 3-44interrupt from user 3-42multiple devices 3-65opening device 3-66output from program 3-42primary device 3-65satellite devices A-1sending pictures to A-2sounding alarm 3-67specific device control routines 3-65using a 5251 non-graphics device 3-66using default characters 3-29using non-graphics display stations A-12with ALWGPH keyword 5-3
display files 5-1display points 3-35displaying multiple pictures per screen 3-50displaying the picture 2-10dividing screen 3-50DLTGSS (delete graphics symbol set)
command 5-12drawing graphics symbols 3-29drawing lines 3-12drawing pictures with GDDM 3-2drop a device 3-66DSCLS (close a device) 3-66DSDROP (discontinue device usage) 3-66DSOPEN (open a devise)
description 3-66example A-5plotter parameters A-3
DSQDEV (query device characteristics) 3-67DSQUID (query unique device identifier) 3-66DSQUSE (query device usage) 3-66DSRNIT (reinitialize a device) 3-66DSUSE (specify device usage)
description 3-66example A-5
dummy devices 3-65, A-12duplicate axes 4-22
Eelliptic arc 3-17, 3-19
ending a program 2-11enlarging parts of picture 3-55entering programs 2-1envelope program
in BASIC 2-3in COBOL/400 6-5in Pascal 6-9in PL/I 6-8in RPG/400 6-2
environment, initializing 3-41environment, initializing for GDDM 2-5environment, initializing for Presentation
Graphics 2-12environment, terminating 3-41environment, terminating for GDDM 2-11environment, terminating for Presentation
Graphics 2-13erase parts of the picture 3-58error handling
controls 3-41diagnostic messages 5-16error messages 5-17error record structure 5-17escape messages 5-16in Presentation Graphics programs 4-13overview 5-16recovery 5-16with FSEXIT routine 5-16
escape messages 5-16, 5-17exclusive-OR operations 3-10executing programs 2-1expanding picture sizes 3-55exploded pie chart slices 4-79externally-described display files 5-1
Ffield, graphics
description 3-47specific routines 3-48
filesdatabase 5-7DDS display 5-1externally-described display 5-1printer 5-5QDGDDM display 5-1user-defined A-7
fill patterns 3-24floating surface chart, example 4-60floating-bar chart
description 4-7example 4-75
floating-point values in BASIC programs 2-4fonts, character
image symbols 3-26loading 3-28
Index X-7
Index
fonts, character (continued)vector symbol sets 5-10
force zero for axis range 4-26form feed of plotter, setting A-4fractional lines 3-14frame around chart 4-18free storage, device 3-66freeing storage, device 3-66freeing storage, program 3-41FSALRM (sound the terminal alarm) 3-67FSEXIT (specify error exit) 3-41, 5-17FSFRCE (update the display) 3-42FSINIT (initialize graphics) 3-41, 4-13FSINIT (initialize graphics) for GDDM 2-5FSINIT (initialize graphics) for Presentation
Graphics 2-12FSPCLR (clear the current page) 3-47FSPCRT (create a page) 3-45FSPDEL (delete a page) 3-47FSPQRY (query specified page) 3-47FSPSEL (select a page) 3-46FSQCPG (get the current page number) 3-47FSQDEV (query current device
characteristics) 3-67FSQERR (query last error) 3-42, 5-17FSQUPG (query unique page number) 3-47FSREST (retransmit data) 3-43FSRNIT (reinitialize graphics environment) 3-41FSTERM (terminate graphics) 3-41FSTERM (terminate graphics) for GDDM 2-11FSTERM (terminate graphics) for Presentation
Graphics 2-13
Ggaps between groups of bars in bar charts 4-65gaps between individual bars in bar charts 4-63GDDM 1-1GDDM programs
color table program in PL/I 6-36envelope program in BASIC 2-3envelope program in COBOL/400 6-5envelope program in Pascal 6-9envelope program in PL/I 6-8envelope program in RPG/400 6-2GDF (graphics data format) file 3-69graphics image in BASIC 3-36, 6-54graphics image in COBOL/400 6-58graphics image in Pascal 6-63graphics image in PL/I 6-62graphics image in RPG/400 6-55order form program in PL/I 6-40pie chart program in RPG/400 6-47
GDDM routinesarea-fill 2-9character size 2-10
GDDM routines (continued)character string 2-10for controls 3-41in Presentation Graphics programs 4-13names, syntax of 2-14query, use for 3-7sending picture to device 2-10shading 2-9symbol sets used 3-27, 5-7using 1-1
GDFSee graphics data format (GDF) file
Graphical Data Display ManagerSee GDDM
graphics clipping 3-55graphics data format (GDF) file
description 3-68example of 3-69
graphics devices compatible with the AS/400System A-1
graphics display mode 5-2graphics environment
controls 3-41initialize 3-41, 4-13initialize for GDDM 2-5initialize for Presentation Graphics 2-12terminate 3-41terminate for GDDM 2-11terminate for Presentation Graphics 2-13
graphics field 3-47graphics hierarchy
definition 3-43device 3-43graphics field 3-47graphics window 3-53page 3-44picture space 3-48specific routines 3-45viewport 3-50
graphics image primitiveenlarging 3-55pattern 3-36primitives 3-35sample program in BASIC 3-36, 6-54sample program in COBOL/400 with BASIC
conversion 6-58sample program in Pascal 6-63sample program in PL/I 6-62sample program in RPG/400 6-55scaled 3-36
graphics page size 5-5graphics segment
default 3-43default with viewport 3-53definition 3-43, 3-58functions 3-58
X-8 AS/400 GDDM Programming Guide
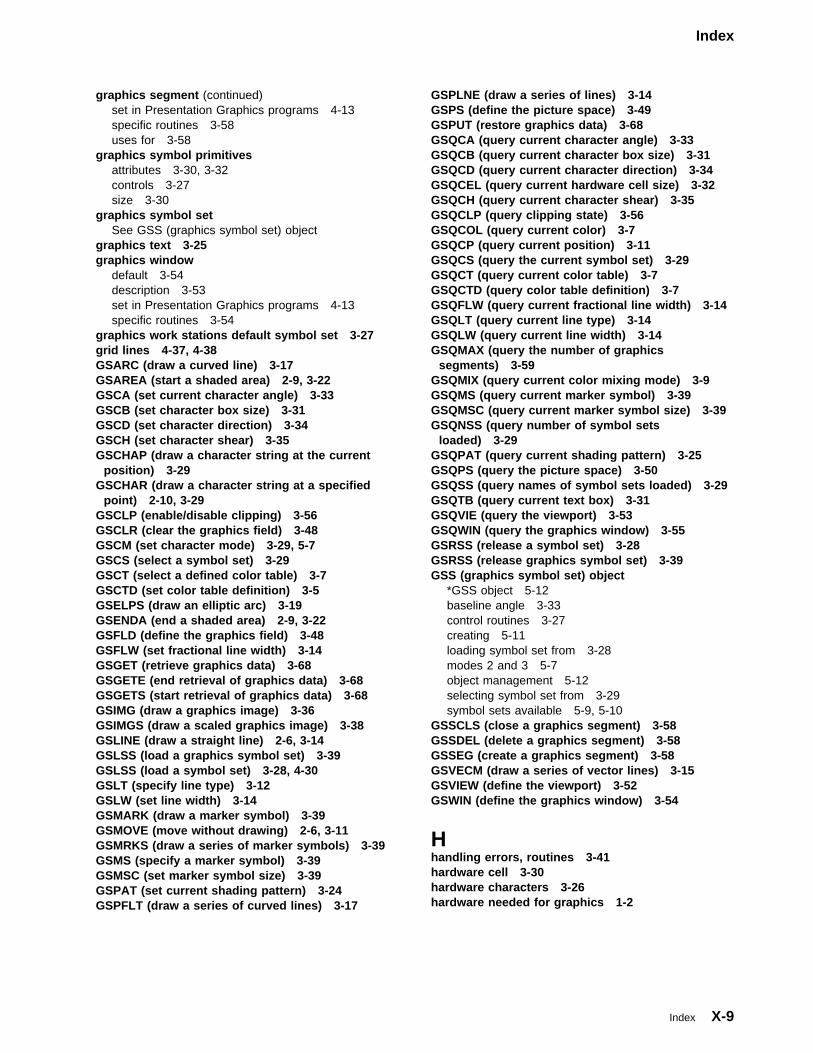
Index
graphics segment (continued)set in Presentation Graphics programs 4-13specific routines 3-58uses for 3-58
graphics symbol primitivesattributes 3-30, 3-32controls 3-27size 3-30
graphics symbol setSee GSS (graphics symbol set) object
graphics text 3-25graphics window
default 3-54description 3-53set in Presentation Graphics programs 4-13specific routines 3-54
graphics work stations default symbol set 3-27grid lines 4-37, 4-38GSARC (draw a curved line) 3-17GSAREA (start a shaded area) 2-9, 3-22GSCA (set current character angle) 3-33GSCB (set character box size) 3-31GSCD (set character direction) 3-34GSCH (set character shear) 3-35GSCHAP (draw a character string at the current
position) 3-29GSCHAR (draw a character string at a specified
point) 2-10, 3-29GSCLP (enable/disable clipping) 3-56GSCLR (clear the graphics field) 3-48GSCM (set character mode) 3-29, 5-7GSCS (select a symbol set) 3-29GSCT (select a defined color table) 3-7GSCTD (set color table definition) 3-5GSELPS (draw an elliptic arc) 3-19GSENDA (end a shaded area) 2-9, 3-22GSFLD (define the graphics field) 3-48GSFLW (set fractional line width) 3-14GSGET (retrieve graphics data) 3-68GSGETE (end retrieval of graphics data) 3-68GSGETS (start retrieval of graphics data) 3-68GSIMG (draw a graphics image) 3-36GSIMGS (draw a scaled graphics image) 3-38GSLINE (draw a straight line) 2-6, 3-14GSLSS (load a graphics symbol set) 3-39GSLSS (load a symbol set) 3-28, 4-30GSLT (specify line type) 3-12GSLW (set line width) 3-14GSMARK (draw a marker symbol) 3-39GSMOVE (move without drawing) 2-6, 3-11GSMRKS (draw a series of marker symbols) 3-39GSMS (specify a marker symbol) 3-39GSMSC (set marker symbol size) 3-39GSPAT (set current shading pattern) 3-24GSPFLT (draw a series of curved lines) 3-17
GSPLNE (draw a series of lines) 3-14GSPS (define the picture space) 3-49GSPUT (restore graphics data) 3-68GSQCA (query current character angle) 3-33GSQCB (query current character box size) 3-31GSQCD (query current character direction) 3-34GSQCEL (query current hardware cell size) 3-32GSQCH (query current character shear) 3-35GSQCLP (query clipping state) 3-56GSQCOL (query current color) 3-7GSQCP (query current position) 3-11GSQCS (query the current symbol set) 3-29GSQCT (query current color table) 3-7GSQCTD (query color table definition) 3-7GSQFLW (query current fractional line width) 3-14GSQLT (query current line type) 3-14GSQLW (query current line width) 3-14GSQMAX (query the number of graphics
segments) 3-59GSQMIX (query current color mixing mode) 3-9GSQMS (query current marker symbol) 3-39GSQMSC (query current marker symbol size) 3-39GSQNSS (query number of symbol sets
loaded) 3-29GSQPAT (query current shading pattern) 3-25GSQPS (query the picture space) 3-50GSQSS (query names of symbol sets loaded) 3-29GSQTB (query current text box) 3-31GSQVIE (query the viewport) 3-53GSQWIN (query the graphics window) 3-55GSRSS (release a symbol set) 3-28GSRSS (release graphics symbol set) 3-39GSS (graphics symbol set) object
*GSS object 5-12baseline angle 3-33control routines 3-27creating 5-11loading symbol set from 3-28modes 2 and 3 5-7object management 5-12selecting symbol set from 3-29symbol sets available 5-9, 5-10
GSSCLS (close a graphics segment) 3-58GSSDEL (delete a graphics segment) 3-58GSSEG (create a graphics segment) 3-58GSVECM (draw a series of vector lines) 3-15GSVIEW (define the viewport) 3-52GSWIN (define the graphics window) 3-54
Hhandling errors, routines 3-41hardware cell 3-30hardware characters 3-26hardware needed for graphics 1-2
Index X-9
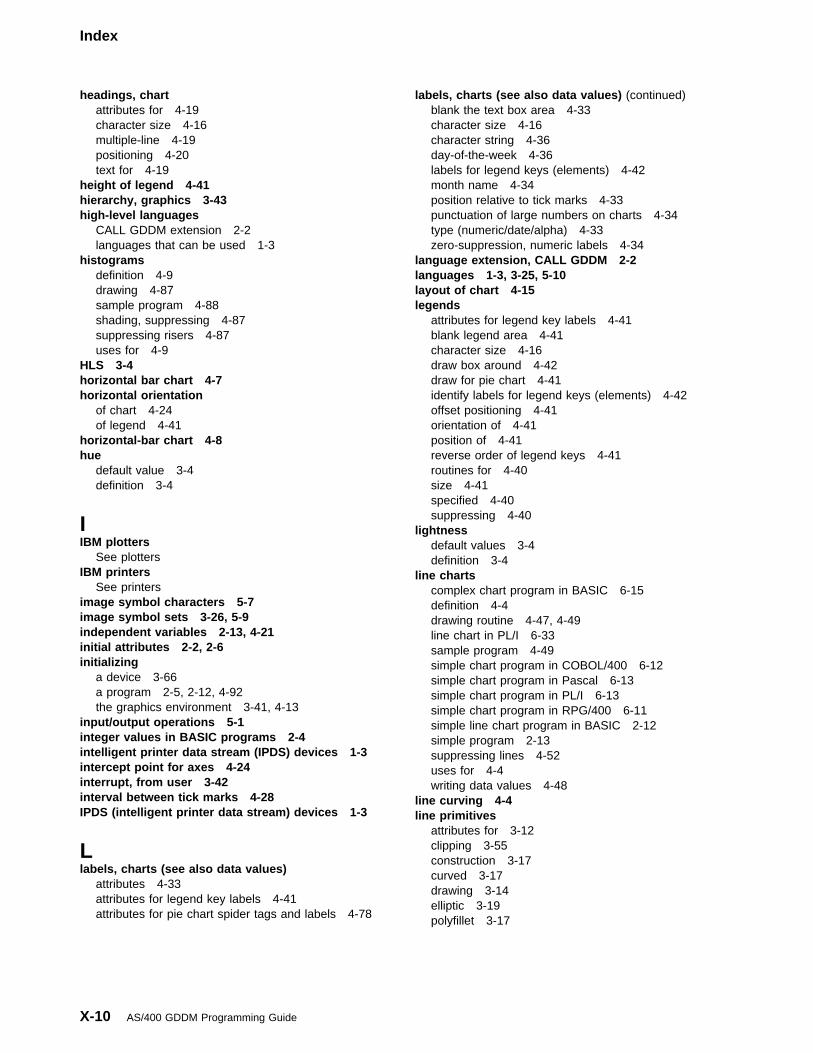
Index
headings, chartattributes for 4-19character size 4-16multiple-line 4-19positioning 4-20text for 4-19
height of legend 4-41hierarchy, graphics 3-43high-level languages
CALL GDDM extension 2-2languages that can be used 1-3
histogramsdefinition 4-9drawing 4-87sample program 4-88shading, suppressing 4-87suppressing risers 4-87uses for 4-9
HLS 3-4horizontal bar chart 4-7horizontal orientation
of chart 4-24of legend 4-41
horizontal-bar chart 4-8hue
default value 3-4definition 3-4
IIBM plotters
See plottersIBM printers
See printersimage symbol characters 5-7image symbol sets 3-26, 5-9independent variables 2-13, 4-21initial attributes 2-2, 2-6initializing
a device 3-66a program 2-5, 2-12, 4-92the graphics environment 3-41, 4-13
input/output operations 5-1integer values in BASIC programs 2-4intelligent printer data stream (IPDS) devices 1-3intercept point for axes 4-24interrupt, from user 3-42interval between tick marks 4-28IPDS (intelligent printer data stream) devices 1-3
Llabels, charts (see also data values)
attributes 4-33attributes for legend key labels 4-41attributes for pie chart spider tags and labels 4-78
labels, charts (see also data values) (continued)blank the text box area 4-33character size 4-16character string 4-36day-of-the-week 4-36labels for legend keys (elements) 4-42month name 4-34position relative to tick marks 4-33punctuation of large numbers on charts 4-34type (numeric/date/alpha) 4-33zero-suppression, numeric labels 4-34
language extension, CALL GDDM 2-2languages 1-3, 3-25, 5-10layout of chart 4-15legends
attributes for legend key labels 4-41blank legend area 4-41character size 4-16draw box around 4-42draw for pie chart 4-41identify labels for legend keys (elements) 4-42offset positioning 4-41orientation of 4-41position of 4-41reverse order of legend keys 4-41routines for 4-40size 4-41specified 4-40suppressing 4-40
lightnessdefault values 3-4definition 3-4
line chartscomplex chart program in BASIC 6-15definition 4-4drawing routine 4-47, 4-49line chart in PL/I 6-33sample program 4-49simple chart program in COBOL/400 6-12simple chart program in Pascal 6-13simple chart program in PL/I 6-13simple chart program in RPG/400 6-11simple line chart program in BASIC 2-12simple program 2-13suppressing lines 4-52uses for 4-4writing data values 4-48
line curving 4-4line primitives
attributes for 3-12clipping 3-55construction 3-17curved 3-17drawing 3-14elliptic 3-19polyfillet 3-17
X-10 AS/400 GDDM Programming Guide
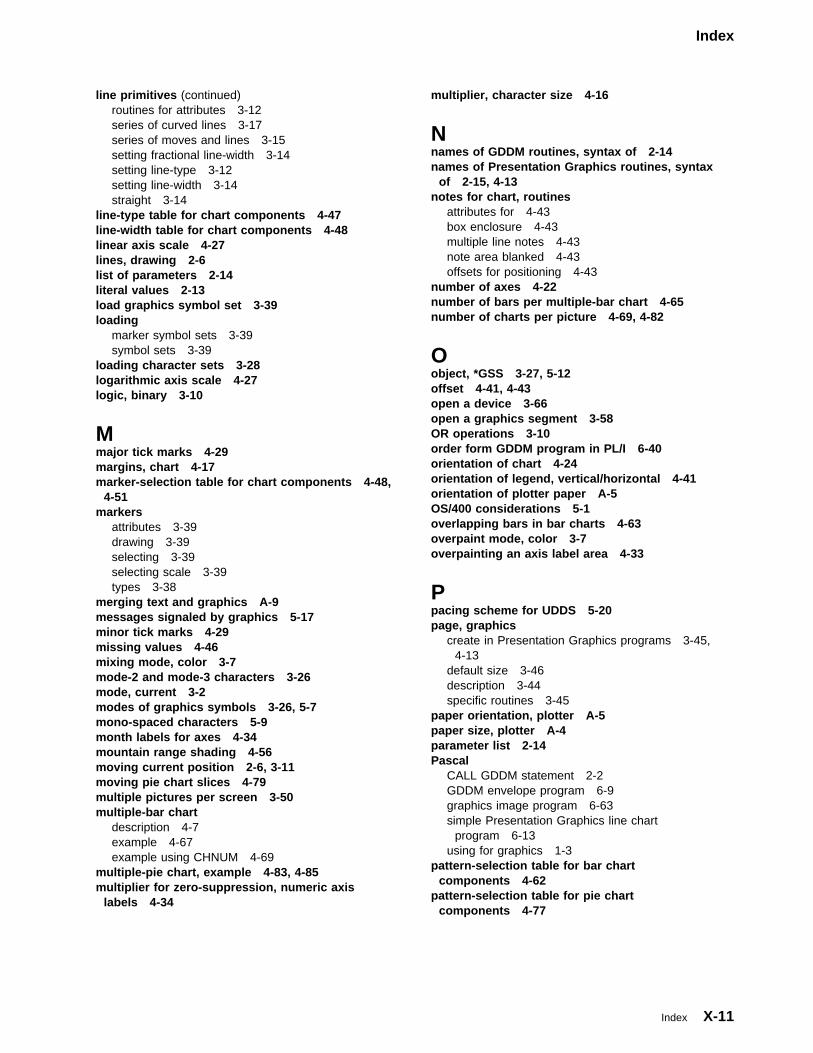
Index
line primitives (continued)routines for attributes 3-12series of curved lines 3-17series of moves and lines 3-15setting fractional line-width 3-14setting line-type 3-12setting line-width 3-14straight 3-14
line-type table for chart components 4-47line-width table for chart components 4-48linear axis scale 4-27lines, drawing 2-6list of parameters 2-14literal values 2-13load graphics symbol set 3-39loading
marker symbol sets 3-39symbol sets 3-39
loading character sets 3-28logarithmic axis scale 4-27logic, binary 3-10
Mmajor tick marks 4-29margins, chart 4-17marker-selection table for chart components 4-48,
4-51markers
attributes 3-39drawing 3-39selecting 3-39selecting scale 3-39types 3-38
merging text and graphics A-9messages signaled by graphics 5-17minor tick marks 4-29missing values 4-46mixing mode, color 3-7mode-2 and mode-3 characters 3-26mode, current 3-2modes of graphics symbols 3-26, 5-7mono-spaced characters 5-9month labels for axes 4-34mountain range shading 4-56moving current position 2-6, 3-11moving pie chart slices 4-79multiple pictures per screen 3-50multiple-bar chart
description 4-7example 4-67example using CHNUM 4-69
multiple-pie chart, example 4-83, 4-85multiplier for zero-suppression, numeric axis
labels 4-34
multiplier, character size 4-16
Nnames of GDDM routines, syntax of 2-14names of Presentation Graphics routines, syntax
of 2-15, 4-13notes for chart, routines
attributes for 4-43box enclosure 4-43multiple line notes 4-43note area blanked 4-43offsets for positioning 4-43
number of axes 4-22number of bars per multiple-bar chart 4-65number of charts per picture 4-69, 4-82
Oobject, *GSS 3-27, 5-12offset 4-41, 4-43open a device 3-66open a graphics segment 3-58OR operations 3-10order form GDDM program in PL/I 6-40orientation of chart 4-24orientation of legend, vertical/horizontal 4-41orientation of plotter paper A-5OS/400 considerations 5-1overlapping bars in bar charts 4-63overpaint mode, color 3-7overpainting an axis label area 4-33
Ppacing scheme for UDDS 5-20page, graphics
create in Presentation Graphics programs 3-45,4-13
default size 3-46description 3-44specific routines 3-45
paper orientation, plotter A-5paper size, plotter A-4parameter list 2-14Pascal
CALL GDDM statement 2-2GDDM envelope program 6-9graphics image program 6-63simple Presentation Graphics line chart
program 6-13using for graphics 1-3
pattern-selection table for bar chartcomponents 4-62
pattern-selection table for pie chartcomponents 4-77
Index X-11
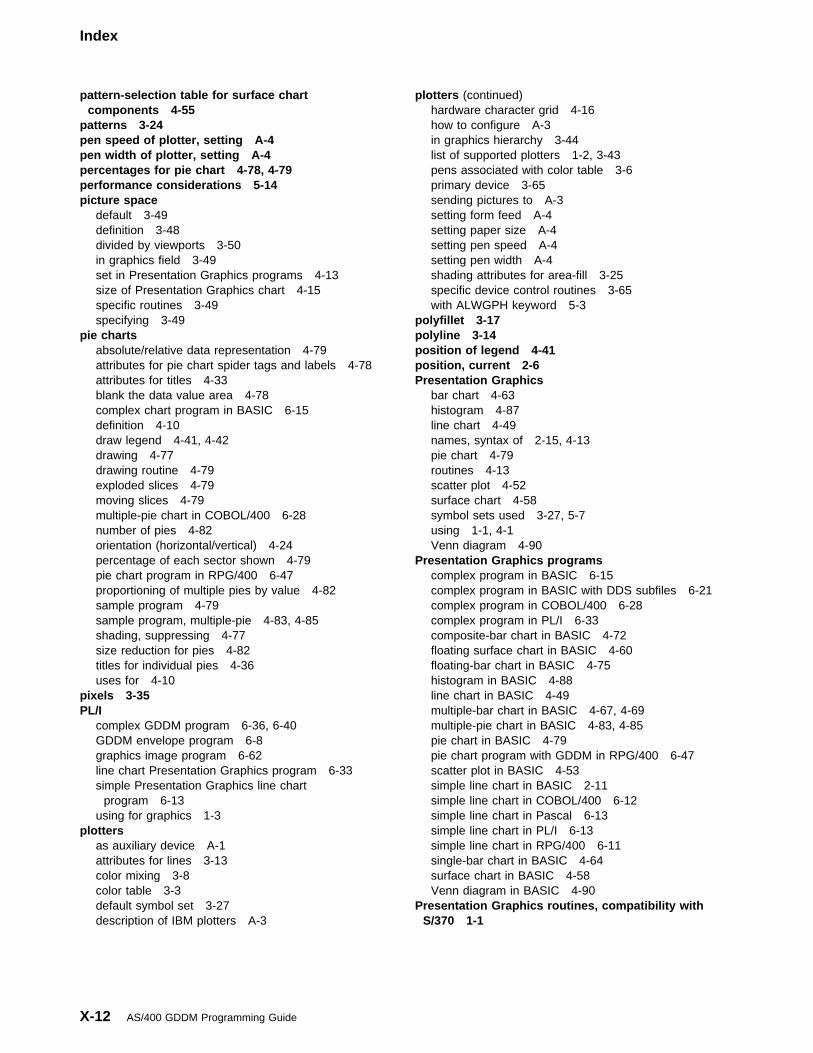
Index
pattern-selection table for surface chartcomponents 4-55
patterns 3-24pen speed of plotter, setting A-4pen width of plotter, setting A-4percentages for pie chart 4-78, 4-79performance considerations 5-14picture space
default 3-49definition 3-48divided by viewports 3-50in graphics field 3-49set in Presentation Graphics programs 4-13size of Presentation Graphics chart 4-15specific routines 3-49specifying 3-49
pie chartsabsolute/relative data representation 4-79attributes for pie chart spider tags and labels 4-78attributes for titles 4-33blank the data value area 4-78complex chart program in BASIC 6-15definition 4-10draw legend 4-41, 4-42drawing 4-77drawing routine 4-79exploded slices 4-79moving slices 4-79multiple-pie chart in COBOL/400 6-28number of pies 4-82orientation (horizontal/vertical) 4-24percentage of each sector shown 4-79pie chart program in RPG/400 6-47proportioning of multiple pies by value 4-82sample program 4-79sample program, multiple-pie 4-83, 4-85shading, suppressing 4-77size reduction for pies 4-82titles for individual pies 4-36uses for 4-10
pixels 3-35PL/I
complex GDDM program 6-36, 6-40GDDM envelope program 6-8graphics image program 6-62line chart Presentation Graphics program 6-33simple Presentation Graphics line chart
program 6-13using for graphics 1-3
plottersas auxiliary device A-1attributes for lines 3-13color mixing 3-8color table 3-3default symbol set 3-27description of IBM plotters A-3
plotters (continued)hardware character grid 4-16how to configure A-3in graphics hierarchy 3-44list of supported plotters 1-2, 3-43pens associated with color table 3-6primary device 3-65sending pictures to A-3setting form feed A-4setting paper size A-4setting pen speed A-4setting pen width A-4shading attributes for area-fill 3-25specific device control routines 3-65with ALWGPH keyword 5-3
polyfillet 3-17polyline 3-14position of legend 4-41position, current 2-6Presentation Graphics
bar chart 4-63histogram 4-87line chart 4-49names, syntax of 2-15, 4-13pie chart 4-79routines 4-13scatter plot 4-52surface chart 4-58symbol sets used 3-27, 5-7using 1-1, 4-1Venn diagram 4-90
Presentation Graphics programscomplex program in BASIC 6-15complex program in BASIC with DDS subfiles 6-21complex program in COBOL/400 6-28complex program in PL/I 6-33composite-bar chart in BASIC 4-72floating surface chart in BASIC 4-60floating-bar chart in BASIC 4-75histogram in BASIC 4-88line chart in BASIC 4-49multiple-bar chart in BASIC 4-67, 4-69multiple-pie chart in BASIC 4-83, 4-85pie chart in BASIC 4-79pie chart program with GDDM in RPG/400 6-47scatter plot in BASIC 4-53simple line chart in BASIC 2-11simple line chart in COBOL/400 6-12simple line chart in Pascal 6-13simple line chart in PL/I 6-13simple line chart in RPG/400 6-11single-bar chart in BASIC 4-64surface chart in BASIC 4-58Venn diagram in BASIC 4-90
Presentation Graphics routines, compatibility withS/370 1-1
X-12 AS/400 GDDM Programming Guide
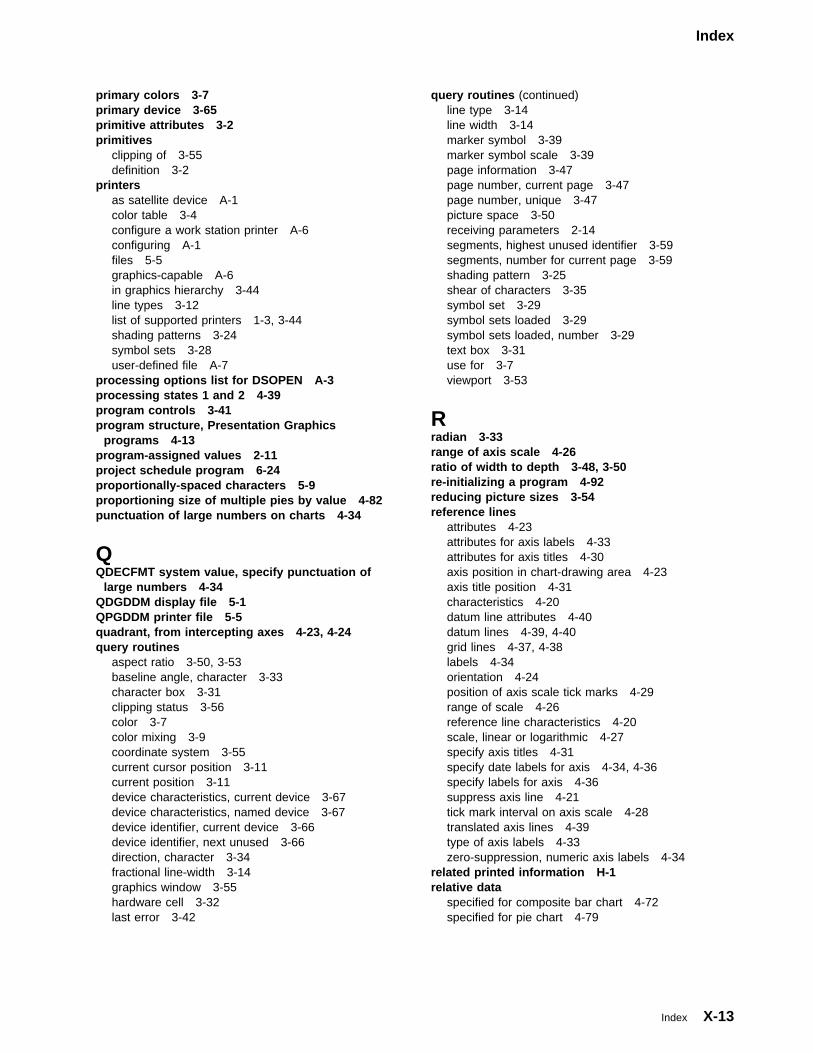
Index
primary colors 3-7primary device 3-65primitive attributes 3-2primitives
clipping of 3-55definition 3-2
printersas satellite device A-1color table 3-4configure a work station printer A-6configuring A-1files 5-5graphics-capable A-6in graphics hierarchy 3-44line types 3-12list of supported printers 1-3, 3-44shading patterns 3-24symbol sets 3-28user-defined file A-7
processing options list for DSOPEN A-3processing states 1 and 2 4-39program controls 3-41program structure, Presentation Graphics
programs 4-13program-assigned values 2-11project schedule program 6-24proportionally-spaced characters 5-9proportioning size of multiple pies by value 4-82punctuation of large numbers on charts 4-34
QQDECFMT system value, specify punctuation of
large numbers 4-34QDGDDM display file 5-1QPGDDM printer file 5-5quadrant, from intercepting axes 4-23, 4-24query routines
aspect ratio 3-50, 3-53baseline angle, character 3-33character box 3-31clipping status 3-56color 3-7color mixing 3-9coordinate system 3-55current cursor position 3-11current position 3-11device characteristics, current device 3-67device characteristics, named device 3-67device identifier, current device 3-66device identifier, next unused 3-66direction, character 3-34fractional line-width 3-14graphics window 3-55hardware cell 3-32last error 3-42
query routines (continued)line type 3-14line width 3-14marker symbol 3-39marker symbol scale 3-39page information 3-47page number, current page 3-47page number, unique 3-47picture space 3-50receiving parameters 2-14segments, highest unused identifier 3-59segments, number for current page 3-59shading pattern 3-25shear of characters 3-35symbol set 3-29symbol sets loaded 3-29symbol sets loaded, number 3-29text box 3-31use for 3-7viewport 3-53
Rradian 3-33range of axis scale 4-26ratio of width to depth 3-48, 3-50re-initializing a program 4-92reducing picture sizes 3-54reference lines
attributes 4-23attributes for axis labels 4-33attributes for axis titles 4-30axis position in chart-drawing area 4-23axis title position 4-31characteristics 4-20datum line attributes 4-40datum lines 4-39, 4-40grid lines 4-37, 4-38labels 4-34orientation 4-24position of axis scale tick marks 4-29range of scale 4-26reference line characteristics 4-20scale, linear or logarithmic 4-27specify axis titles 4-31specify date labels for axis 4-34, 4-36specify labels for axis 4-36suppress axis line 4-21tick mark interval on axis scale 4-28translated axis lines 4-39type of axis labels 4-33zero-suppression, numeric axis labels 4-34
related printed information H-1relative data
specified for composite bar chart 4-72specified for pie chart 4-79
Index X-13
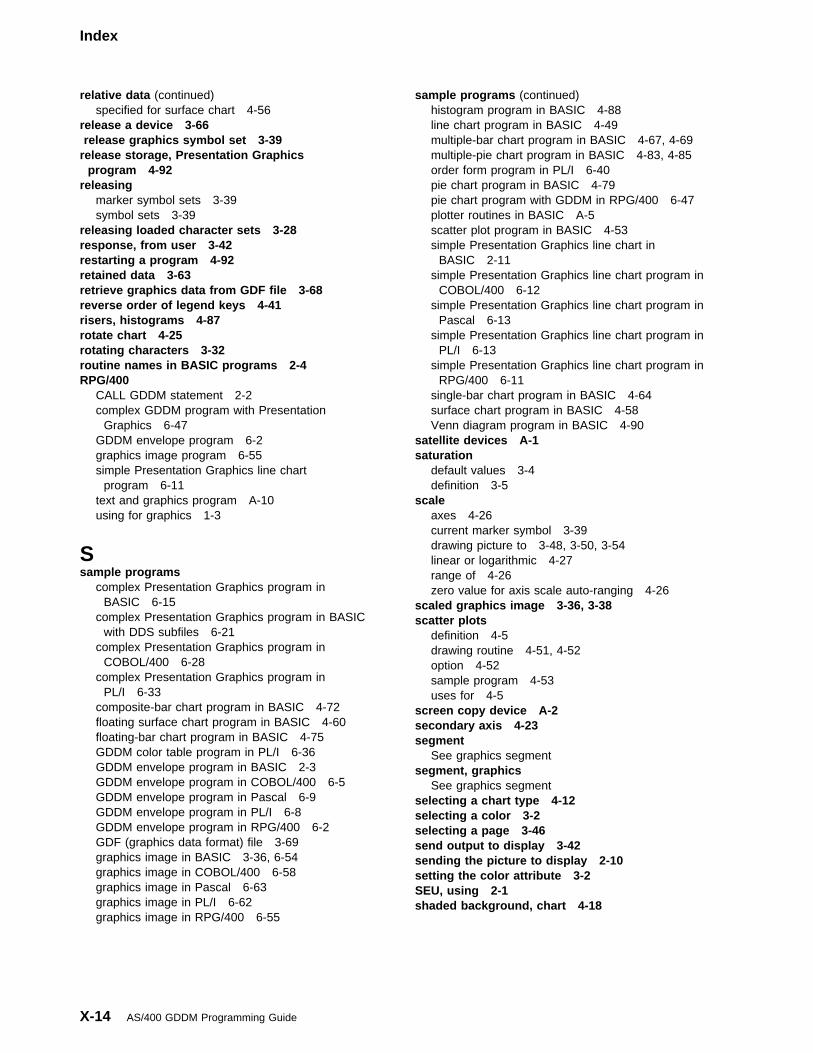
Index
relative data (continued)specified for surface chart 4-56
release a device 3-66 release graphics symbol set 3-39release storage, Presentation Graphics
program 4-92releasing
marker symbol sets 3-39symbol sets 3-39
releasing loaded character sets 3-28response, from user 3-42restarting a program 4-92retained data 3-63retrieve graphics data from GDF file 3-68reverse order of legend keys 4-41risers, histograms 4-87rotate chart 4-25rotating characters 3-32routine names in BASIC programs 2-4RPG/400
CALL GDDM statement 2-2complex GDDM program with Presentation
Graphics 6-47GDDM envelope program 6-2graphics image program 6-55simple Presentation Graphics line chart
program 6-11text and graphics program A-10using for graphics 1-3
Ssample programs
complex Presentation Graphics program inBASIC 6-15
complex Presentation Graphics program in BASICwith DDS subfiles 6-21
complex Presentation Graphics program inCOBOL/400 6-28
complex Presentation Graphics program inPL/I 6-33
composite-bar chart program in BASIC 4-72floating surface chart program in BASIC 4-60floating-bar chart program in BASIC 4-75GDDM color table program in PL/I 6-36GDDM envelope program in BASIC 2-3GDDM envelope program in COBOL/400 6-5GDDM envelope program in Pascal 6-9GDDM envelope program in PL/I 6-8GDDM envelope program in RPG/400 6-2GDF (graphics data format) file 3-69graphics image in BASIC 3-36, 6-54graphics image in COBOL/400 6-58graphics image in Pascal 6-63graphics image in PL/I 6-62graphics image in RPG/400 6-55
sample programs (continued)histogram program in BASIC 4-88line chart program in BASIC 4-49multiple-bar chart program in BASIC 4-67, 4-69multiple-pie chart program in BASIC 4-83, 4-85order form program in PL/I 6-40pie chart program in BASIC 4-79pie chart program with GDDM in RPG/400 6-47plotter routines in BASIC A-5scatter plot program in BASIC 4-53simple Presentation Graphics line chart in
BASIC 2-11simple Presentation Graphics line chart program in
COBOL/400 6-12simple Presentation Graphics line chart program in
Pascal 6-13simple Presentation Graphics line chart program in
PL/I 6-13simple Presentation Graphics line chart program in
RPG/400 6-11single-bar chart program in BASIC 4-64surface chart program in BASIC 4-58Venn diagram program in BASIC 4-90
satellite devices A-1saturation
default values 3-4definition 3-5
scaleaxes 4-26current marker symbol 3-39drawing picture to 3-48, 3-50, 3-54linear or logarithmic 4-27range of 4-26zero value for axis scale auto-ranging 4-26
scaled graphics image 3-36, 3-38scatter plots
definition 4-5drawing routine 4-51, 4-52option 4-52sample program 4-53uses for 4-5
screen copy device A-2secondary axis 4-23segment
See graphics segmentsegment, graphics
See graphics segmentselecting a chart type 4-12selecting a color 3-2selecting a page 3-46send output to display 3-42sending the picture to display 2-10setting the color attribute 3-2SEU, using 2-1shaded background, chart 4-18
X-14 AS/400 GDDM Programming Guide
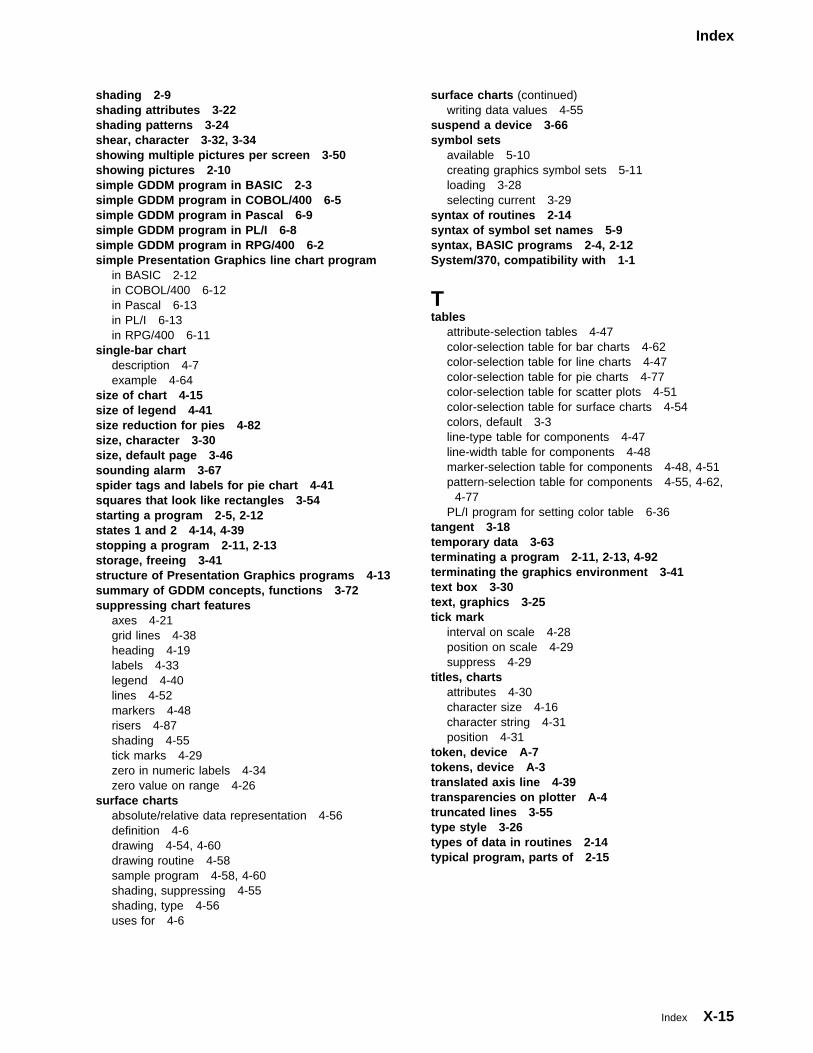
Index
shading 2-9shading attributes 3-22shading patterns 3-24shear, character 3-32, 3-34showing multiple pictures per screen 3-50showing pictures 2-10simple GDDM program in BASIC 2-3simple GDDM program in COBOL/400 6-5simple GDDM program in Pascal 6-9simple GDDM program in PL/I 6-8simple GDDM program in RPG/400 6-2simple Presentation Graphics line chart program
in BASIC 2-12in COBOL/400 6-12in Pascal 6-13in PL/I 6-13in RPG/400 6-11
single-bar chartdescription 4-7example 4-64
size of chart 4-15size of legend 4-41size reduction for pies 4-82size, character 3-30size, default page 3-46sounding alarm 3-67spider tags and labels for pie chart 4-41squares that look like rectangles 3-54starting a program 2-5, 2-12states 1 and 2 4-14, 4-39stopping a program 2-11, 2-13storage, freeing 3-41structure of Presentation Graphics programs 4-13summary of GDDM concepts, functions 3-72suppressing chart features
axes 4-21grid lines 4-38heading 4-19labels 4-33legend 4-40lines 4-52markers 4-48risers 4-87shading 4-55tick marks 4-29zero in numeric labels 4-34zero value on range 4-26
surface chartsabsolute/relative data representation 4-56definition 4-6drawing 4-54, 4-60drawing routine 4-58sample program 4-58, 4-60shading, suppressing 4-55shading, type 4-56uses for 4-6
surface charts (continued)writing data values 4-55
suspend a device 3-66symbol sets
available 5-10creating graphics symbol sets 5-11loading 3-28selecting current 3-29
syntax of routines 2-14syntax of symbol set names 5-9syntax, BASIC programs 2-4, 2-12System/370, compatibility with 1-1
Ttables
attribute-selection tables 4-47color-selection table for bar charts 4-62color-selection table for line charts 4-47color-selection table for pie charts 4-77color-selection table for scatter plots 4-51color-selection table for surface charts 4-54colors, default 3-3line-type table for components 4-47line-width table for components 4-48marker-selection table for components 4-48, 4-51pattern-selection table for components 4-55, 4-62,
4-77PL/I program for setting color table 6-36
tangent 3-18temporary data 3-63terminating a program 2-11, 2-13, 4-92terminating the graphics environment 3-41text box 3-30text, graphics 3-25tick mark
interval on scale 4-28position on scale 4-29suppress 4-29
titles, chartsattributes 4-30character size 4-16character string 4-31position 4-31
token, device A-7tokens, device A-3translated axis line 4-39transparencies on plotter A-4truncated lines 3-55type style 3-26types of data in routines 2-14typical program, parts of 2-15
Index X-15
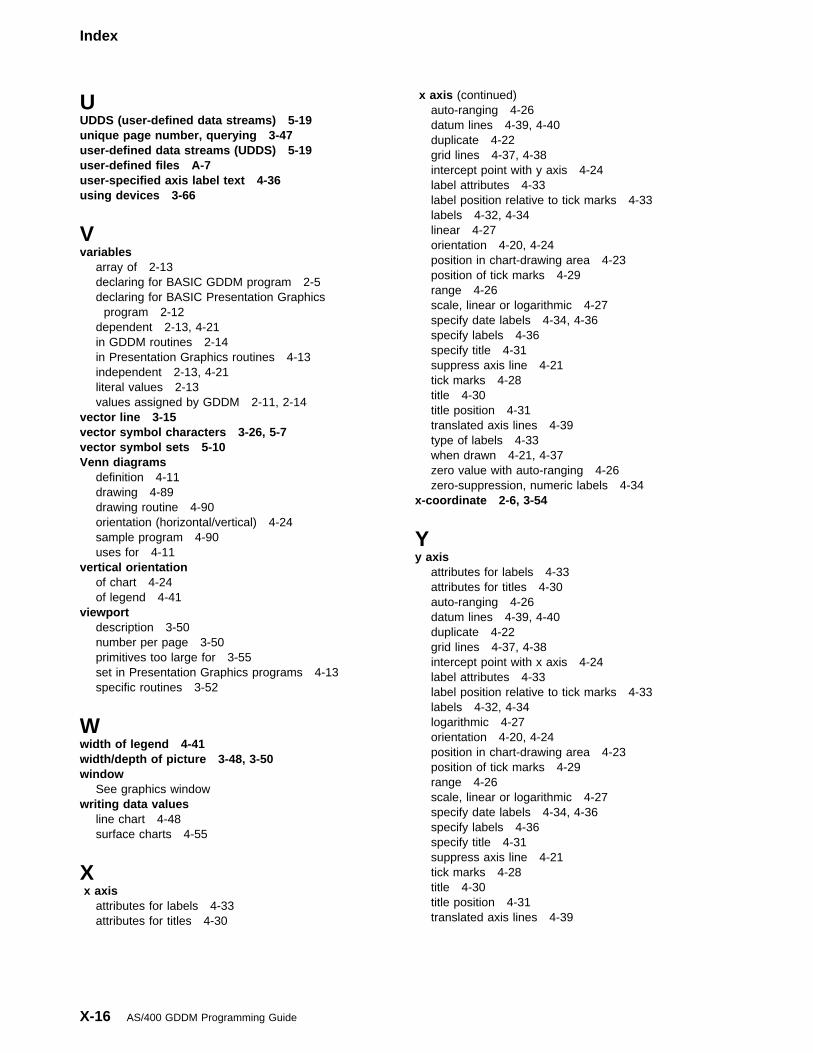
Index
UUDDS (user-defined data streams) 5-19unique page number, querying 3-47user-defined data streams (UDDS) 5-19user-defined files A-7user-specified axis label text 4-36using devices 3-66
Vvariables
array of 2-13declaring for BASIC GDDM program 2-5declaring for BASIC Presentation Graphics
program 2-12dependent 2-13, 4-21in GDDM routines 2-14in Presentation Graphics routines 4-13independent 2-13, 4-21literal values 2-13values assigned by GDDM 2-11, 2-14
vector line 3-15vector symbol characters 3-26, 5-7vector symbol sets 5-10Venn diagrams
definition 4-11drawing 4-89drawing routine 4-90orientation (horizontal/vertical) 4-24sample program 4-90uses for 4-11
vertical orientationof chart 4-24of legend 4-41
viewportdescription 3-50number per page 3-50primitives too large for 3-55set in Presentation Graphics programs 4-13specific routines 3-52
Wwidth of legend 4-41width/depth of picture 3-48, 3-50window
See graphics windowwriting data values
line chart 4-48surface charts 4-55
X x axis
attributes for labels 4-33attributes for titles 4-30
x axis (continued)auto-ranging 4-26datum lines 4-39, 4-40duplicate 4-22grid lines 4-37, 4-38intercept point with y axis 4-24label attributes 4-33label position relative to tick marks 4-33labels 4-32, 4-34linear 4-27orientation 4-20, 4-24position in chart-drawing area 4-23position of tick marks 4-29range 4-26scale, linear or logarithmic 4-27specify date labels 4-34, 4-36specify labels 4-36specify title 4-31suppress axis line 4-21tick marks 4-28title 4-30title position 4-31translated axis lines 4-39type of labels 4-33when drawn 4-21, 4-37zero value with auto-ranging 4-26zero-suppression, numeric labels 4-34
x-coordinate 2-6, 3-54
Yy axis
attributes for labels 4-33attributes for titles 4-30auto-ranging 4-26datum lines 4-39, 4-40duplicate 4-22grid lines 4-37, 4-38intercept point with x axis 4-24label attributes 4-33label position relative to tick marks 4-33labels 4-32, 4-34logarithmic 4-27orientation 4-20, 4-24position in chart-drawing area 4-23position of tick marks 4-29range 4-26scale, linear or logarithmic 4-27specify date labels 4-34, 4-36specify labels 4-36specify title 4-31suppress axis line 4-21tick marks 4-28title 4-30title position 4-31translated axis lines 4-39
X-16 AS/400 GDDM Programming Guide
Index
y axis (continued)type of labels 4-33when drawn 4-21, 4-37zero value with auto-ranging 4-26zero-suppression, numeric labels 4-34
y-coordinate 2-6, 3-54
Zzero value, auto-ranging 4-26zero-suppression, numeric labels 4-34zooming in for larger picture 3-55
Index X-17

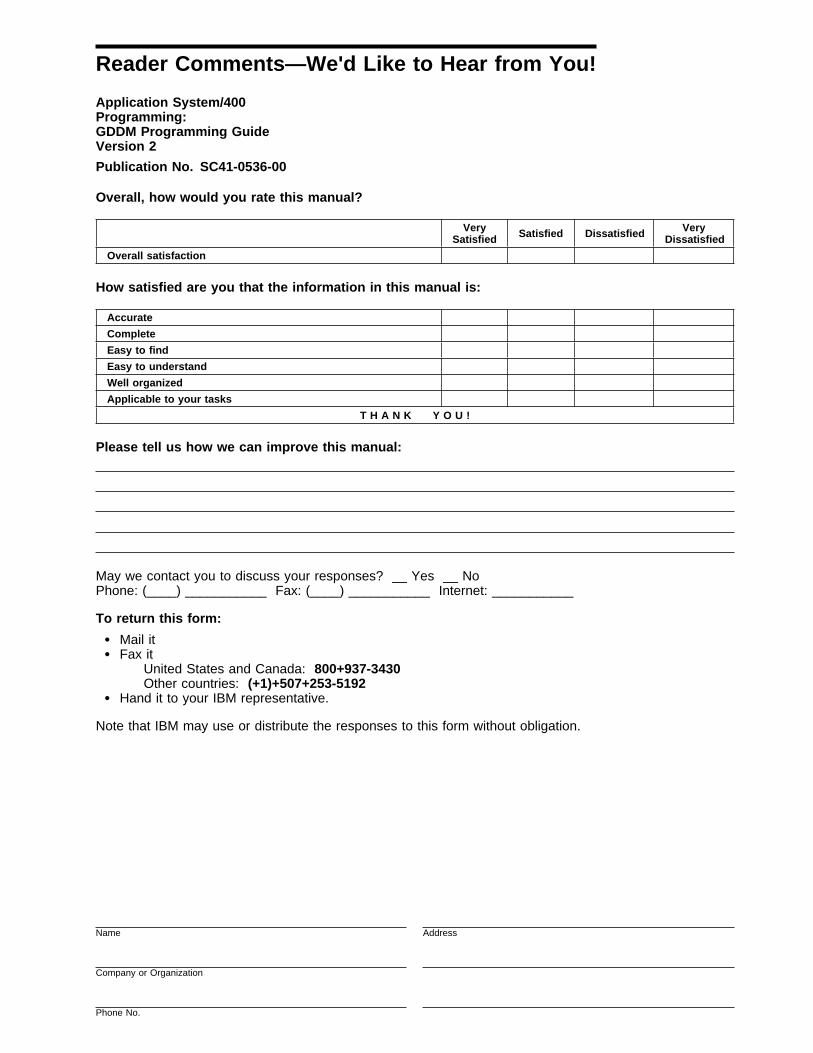
Reader Comments—We'd Like to Hear from You!
Application System/400Programming:GDDM Programming GuideVersion 2
Publication No. SC41-0536-00
Overall, how would you rate this manual?
VerySatisfied Satisfied Dissatisfied Very
Dissatisfied
Overall satisfaction
How satisfied are you that the information in this manual is:
Accurate
Complete
Easy to find
Easy to understand
Well organized
Applicable to your tasks
T H A N K Y O U !
Please tell us how we can improve this manual:
May we contact you to discuss your responses? __ Yes __ NoPhone: (____) ___________ Fax: (____) ___________ Internet: ___________
To return this form:
� Mail it � Fax it
United States and Canada: 800+937-3430 Other countries: (+1)+507+253-5192� Hand it to your IBM representative.
Note that IBM may use or distribute the responses to this form without obligation.
Name Address
Company or Organization
Phone No.
Cut or FoldAlong Line
Cut or FoldAlong Line
Reader Comments—We'd Like to Hear from You!SC41-0536-00 IBM
Fold and Tape Please do not staple Fold and Tape
NO POSTAGENECESSARYIF MAILED IN THEUNITED STATES
BUSINESS REPLY MAILFIRST-CLASS MAIL PERMIT NO. 40 ARMONK, NEW YORK
POSTAGE WILL BE PAID BY ADDRESSEE
ATTN DEPT 542 IDCLERKIBM CORPORATION3605 HWY 52 NROCHESTER MN 55901-9986
Fold and Tape Please do not staple Fold and Tape
SC41-0536-00


IBM
Program Number: 5738-SS1
Printed in the United States of Americaon recycled paper containing 10%recovered post-consumer fiber.
SC41-�536-��
Spine information:
IBM Application System/400GDDM Programming GuideProgramming:
Version 2


