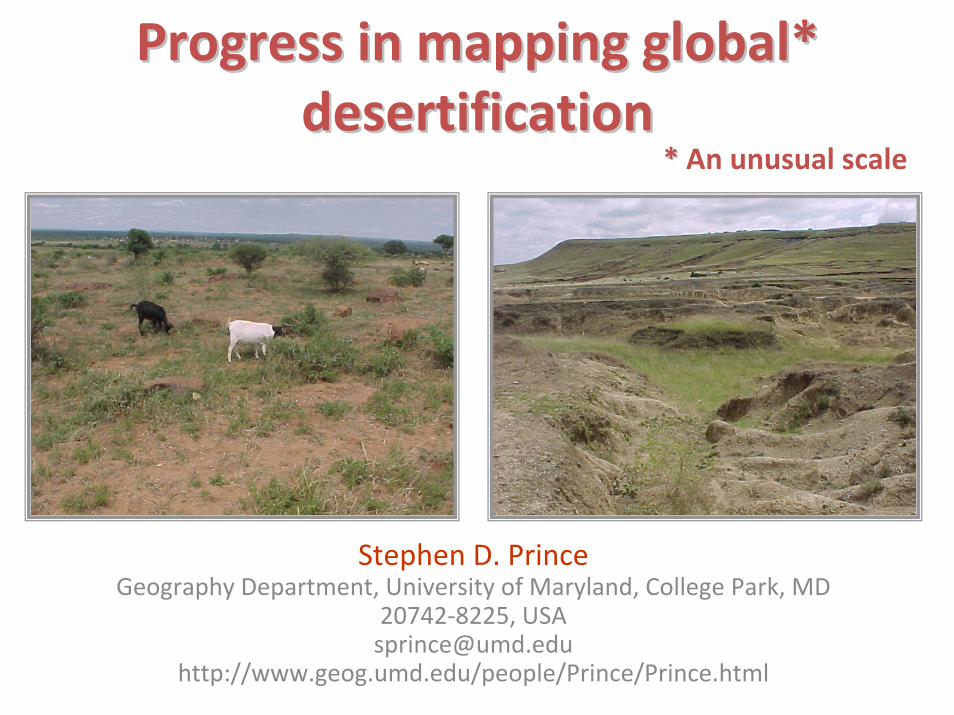
Progress in mapping global* Progress in mapping global* desertification desertification Stephen D. Prince Geography Department, University of Maryland, College Park, MD 20742‐8225, USA [email protected]http://www.geog.umd.edu/people/Prince/Prince.html * * An unusual scale
Transcript
Progress in mapping global* Progress in mapping global* desertificationdesertification
Stephen D. PrinceGeography Department, University of Maryland, College Park, MD
Prince, S.D. (2002). Spatial and temporal scales of measurement of desertification. In M. Stafford‐Smith & J.F. Reynolds (Eds.), Global desertification: do humans create deserts? (pp. 23‐40). Berlin: Dahlem University Press.
Spatial and temporal scales of desertification
Stafford Smith, D.M., McKeon, G.M., Watson, I.W., Henry, B.K., Stone, G.S., Hall, W.B., & Howden, S.M. (2007). Learning from episodes of degradation and recovery in variable Australian rangelands. In (pp. 20690‐20695)
Degradation largely local?
Scale not defined (yet)
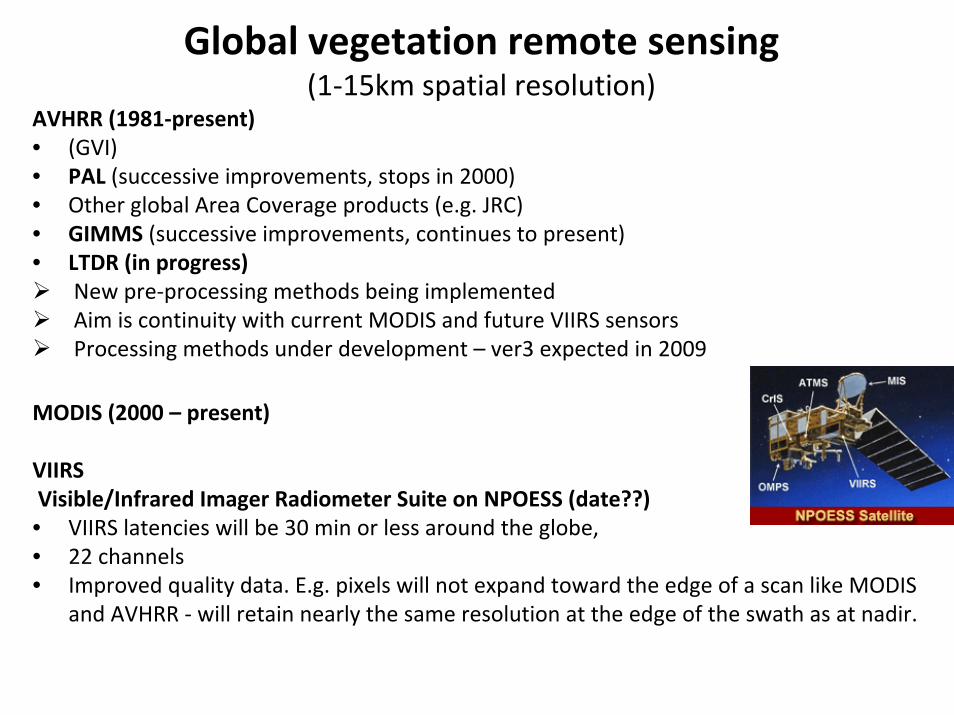
Global vegetation remote sensing(1‐15km spatial resolution)
AVHRR (1981‐present)• (GVI)• PAL (successive improvements, stops in 2000)• Other global Area Coverage products (e.g. JRC)• GIMMS (successive improvements, continues to present)• LTDR (in progress)
New pre‐processing methods being implementedAim is continuity with current MODIS and future VIIRS sensorsProcessing methods under development – ver3 expected in 2009
MODIS (2000 – present)
VIIRSVisible/Infrared Imager Radiometer Suite on NPOESS (date??)• VIIRS latencies will be 30 min or less around the globe, • 22 channels• Improved quality data. E.g. pixels will not expand toward the edge of a scan like MODIS
and AVHRR ‐ will retain nearly the same resolution at the edge of the swath as at nadir.
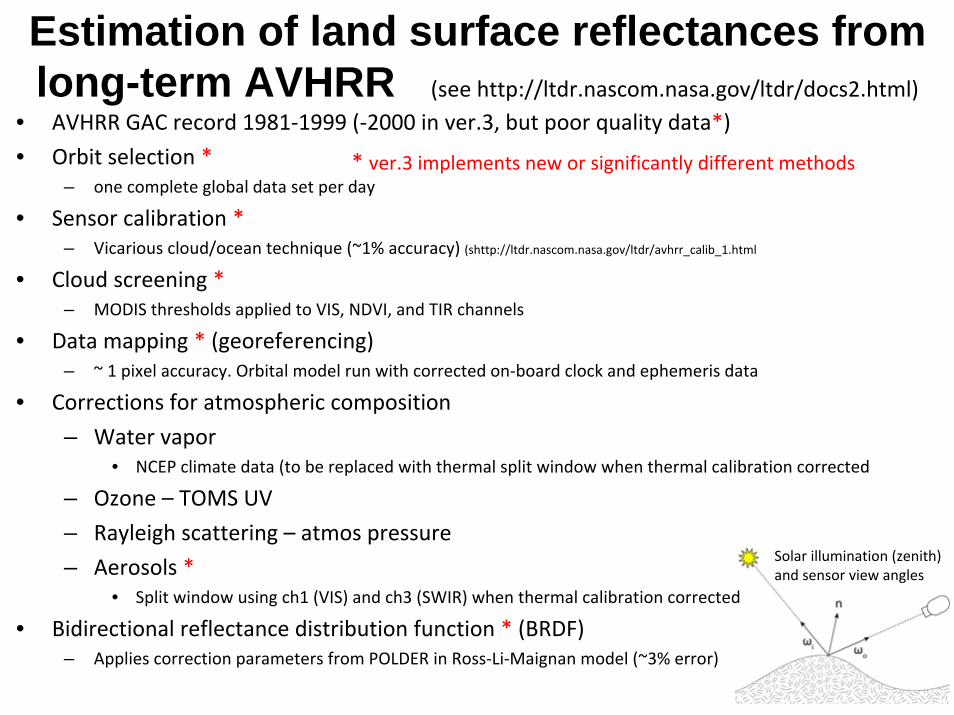
Estimation of land surface reflectances from long‐term AVHRR
• Cloud screening * – MODIS thresholds applied to VIS, NDVI, and TIR channels
• Data mapping * (georeferencing)– ~ 1 pixel accuracy. Orbital model run with corrected on‐board clock and ephemeris data
• Corrections for atmospheric composition
– Water vapor • NCEP climate data (to be replaced with thermal split window when thermal calibration corrected
– Ozone – TOMS UV
– Rayleigh scattering – atmos pressure
– Aerosols *• Split window using ch1 (VIS) and ch3 (SWIR) when thermal calibration corrected
• Bidirectional reflectance distribution function * (BRDF)– Applies correction parameters from POLDER in Ross‐Li‐Maignan model (~3% error)
Estimation of land surface reflectances from long-term AVHRR (see http://ltdr.nascom.nasa.gov/ltdr/docs2.html)
Solar illumination (zenith) and sensor view angles
* ver.3 implements new or significantly different methods
Data mapping (georeferencing)
• 1 pixel accuracy.
• Orbital model using corrected ephemeris data, clock correction and attitude parameters for the different platforms.
Estimation of land surface reflectances from long‐term AVHRR
Bidirectional reflectance distribution function (BRDF)
MODIS BRDF kernels to remove the effect of orbital drift in simulated TOC NDVI data
Corrects spurious trend and seasonality
Estimation of land surface reflectances from long‐term AVHRR
Climate‐Driven Increases in Global Terrestrial Net Primary Production from 1982 to 1999 Ramakrishna R. Nemani,1*† Charles D. Keeling,2 Hirofumi Hashimoto,1,3 William M. Jolly, Stephen C. Piper,2 Compton J. Tucker,4 Ranga B. Myneni,5 Steven W. Running. 6 JUNE 2003 VOL 300, p1560 SCIENCE.
Global trends in veg (Nemani et al. Fig2)Note changes in dry landsRole of rainfall Fig.1
From pattern to process ‐mapping degradation using processes1. Downward trends in productivity – RUE
g row th season19
89-9
0
1990
-91
1991
-92
1995
-96
1996
-97
1997
-98
1998
-99
1999
-200
0
2000
-1
2001
-2
2002
-3
Rai
nfal
l mm
0
200
400
600
800
1000
1200
Bio
mas
s kg
/ha
0
1000
2000
3000
4000
5000
6000
7000
40
50
60
70
80
90
100
R ain fa ll B iom ass ΣN D V I
Σ ND
VI
Rainfall mm
200 300 400 500 600 700 800 900 1000
Σ ND
VI
30
40
50
60
70
80
90
1991-92
1999-2000
2002-3
2001-2
R2 = 0.64y = 0.043x + 37.94
El Nino El Nino La Nina
Skukuza, South Africa
NPP follows rainfall, with some lags• Rain Use Efficiency strongly correlated with rainfall
•Mismatch of temporal scales of rainfall and NPP variation• Different responses to rain by different plant functional types
•Rates of response, e.g., lags, early greening•Differences in responsive developmental stages
• Rainfall and soil moisture – runoff – the water balance
From pattern to process ‐mapping degradation using processes1. Downward trends in productivity – RUE
Rain Use Efficiency
RESTRENDMODIS 2001‐2006
r2 NPP and rainfallMODIS 2001‐2006
Variables other than rainfall might be added or substituted – danger of overfitting
RESTREND Persistent trends in NPP
1982‐1999
Global RESTREND
Red: negative trends in NPP 1982‐1999Green: positive trends in NPP 1982‐1999
Comparison of actual & potential NPPEstimation of potential production
1. Rainfall in RUE equivalent to potential NPP2. Biogeochemical modeling too coarse resolution physical inputs3. Global Vegetation Models
"Potential" doesn't allow for LC/LU change LC/LU change is not necessarily degradationDegraded relative to reasonable human expectations
(Note ‐ Human dimension of deg even at this at scale)
Pasture production cf pasture potential Forest production cf forest potential
Not theoretical "natural” potential production
4. Local Net production scaling (LNS)
b
Land capability units
Local Net Production Scaling (LNS)
LNS Zimbabwe
National Land Degradation map
Degradation change 1988‐2002
Dr. Stephen D. PrinceGeography Department, University of Maryland, College Park, MD 20742‐8225, USATel 301 405 4062
DataAnnual sums of MODIS normalized difference vegetation index
Annual sums of MODIS NPP Annual GPCP 2.5 degree rainfall
From pattern to process ‐mapping degradation using processes4. Stable degraded state ‐ Non‐equilibrium processes
QMORPH NOAA NCEP
Prospects – new and recent data1. Physical
Temperature data setsCPC Merged Microwave, TIR 0.5deg daily
CMORPH/CPC
Merged Microwave, TIR 30 (8) km
6hr
GPCP Reanalysis 2.2deg,1deg
Monthly
NCEP Reanalysis 2 deg 1979, 1997
6hr
CRU Observations interpolated
0.5deg 1951-2003
Monthly
Wilmott GHCN + additional stations interpolated
0.5 deg Monthly
Model (VIC) uses several alternative inputs
Number of meteorological stations reporting 1800‐2008
African Drought Monitor (Shefield et al 2006)
Prospects – new and recent data2. Vegetation cover, functional typesBailey’s ecoregions
GLOBCOVER 300m (MERIS)
Phenology (MOD12Q2)
Graph of NDVI and rainfall
Ellis, Erle and Navin Ramankutty (Lead Authors); Mark McGinley (Topic Editor). 2008. "Anthropogenic biome maps." In: Encyclopedia of Earth. Eds. Cutler J. Cleveland (Washington, D.C.: Environmental Information Coalition, National Council for Science and the Environment). [First published in the Encyclopedia of Earth November 26, 2007; Last revised January 3, 2008; Retrieved November 11, 2008]. <http://www.eoearth.org/article/Anthropogenic_biome_maps>
Prospects – new and recent data3. Human factors
Population. LandScan 2000Haberl, H. et al. (2007). Quantifying and mapping the human appropriation of net primary production in earth’s terrestrial ecosystems. PNAS, 104, 12942‐12947.