41
Progress in the Implementation of the RAPIDC Programme 2005-2009 Kevin Hicks and Johan Kuylenstierna SEI, University of York UK IG11, Dhaka, Bangladesh 20-21 January 2010
| Date post: | 01-Jan-2016 |
| Category: |
Documents |
| Upload: | malcolm-garrett |
| View: | 213 times |
| Download: | 0 times |

Progress in the Implementation of the
RAPIDC Programme 2005-2009
Kevin Hicks and Johan Kuylenstierna SEI, University of York UK
IG11, Dhaka, Bangladesh 20-21 January 2010

RAPIDC Programme Purpose
‘to facilitate the development of agreements and/or protocols to implement measures which prevent and control air pollution through promoting international cooperation and developing scientific information for the policy process’

RAPIDC Approach
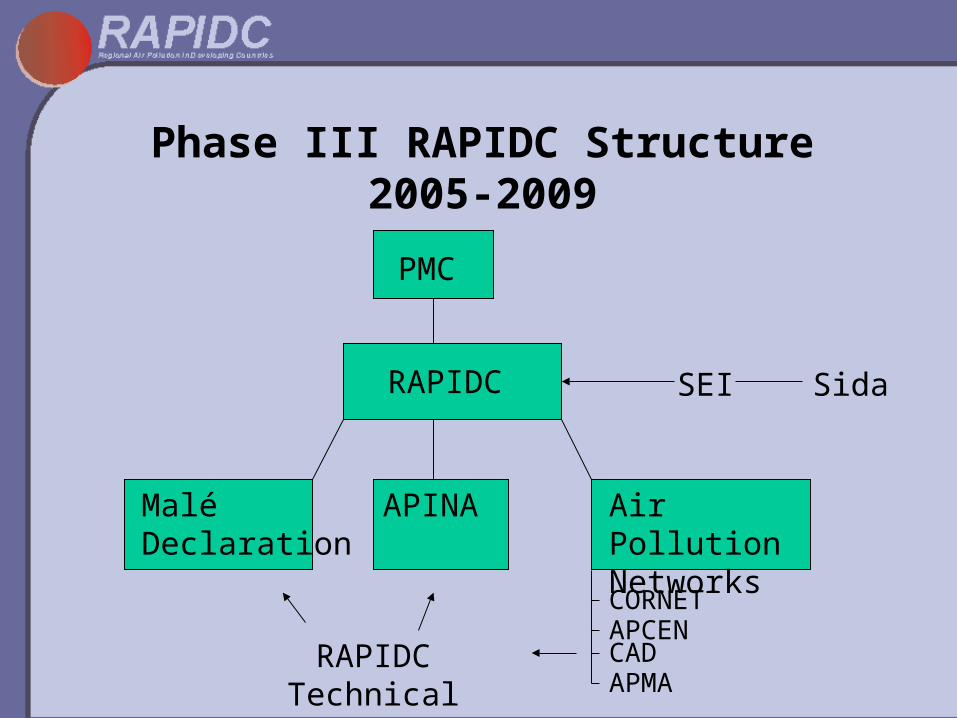
Phase III RAPIDC Structure 2005-2009
RAPIDC SEI Sida
PMC
Malé Declaration
APINA Air PollutionNetworks
CORNETAPCENCADAPMA
RAPIDC Technical support
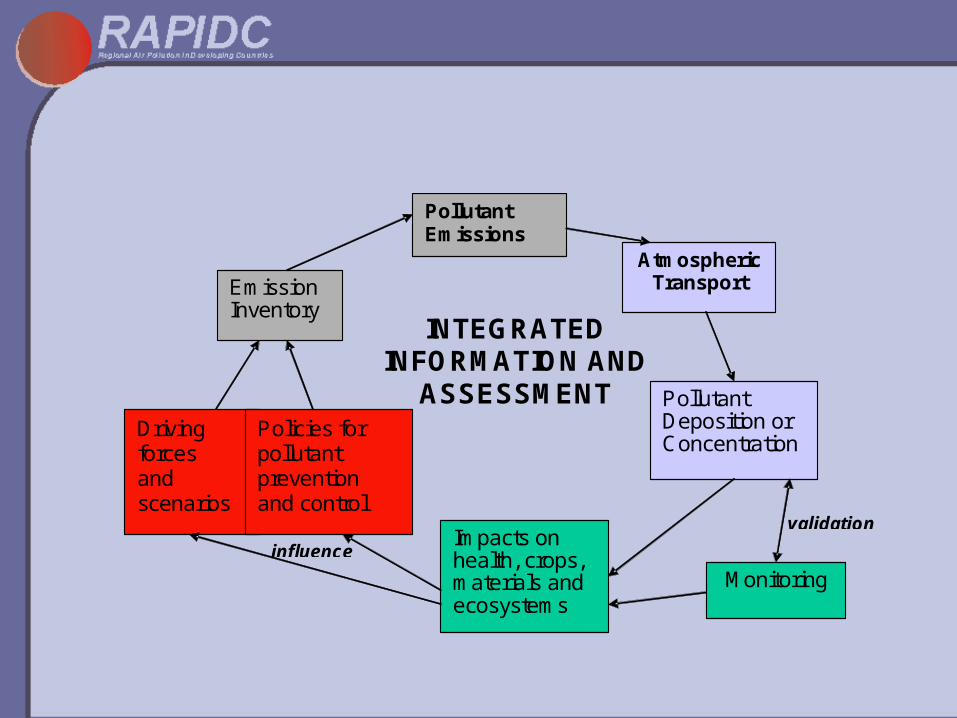
Emission Inventory
Pollutant Emissions
Atmospheric Transport
Pollutant Deposition or Concentration
Monitoring
Impacts on health, crops, materials and ecosystems
Driving forces and scenarios
Policies for pollutant prevention and control
validation
INTEGRATED INFORMATION AND
ASSESSMENT
influence

Impacts of transboundary air pollution
Human health – are PM10 and PM2.5
concentrations high enough in remote areas to cause impacts?
Crops – are ozone concentrations high enough to damage crop yields?
Ecosystems – is the deposition of Nitrogen and Sulphur compounds high enough to cause impacts?
Corrosion of materials – are rates high enough in South Asia to cause economic impacts?

Figure 2.4 Draft emissions inventories combined for Bangladesh, Sri
Lanka and Nepal for baseline year 2000 according to pollutant
0
1000
2000
3000
4000
5000
6000
7000
SO2 NOx CO NMVOC NH3 PM10 PM2.5
Em
issi
on
s (k
t/yr
)
Bangladesh
Sri Lanka
Nepal
Emissions

Emissions
Figure 2.5 Draft emissions inventory for Sri Lanka for baseline year 2000
0
50
100
150
200
250
Power s
tatio
ns
Other
ener
gy se
ctor
Indust
ry c
ombust
ion
Road tr
ansp
ort
Road d
ust
Non-road
tran
sport
Resid
entia
l
Other
fuel
com
bustio
n
Fugitive
em
issi
ons - f
uels
Indust
rial p
roce
sses
Solven
t and o
ther
pro
duct u
se
Crop re
sidue
burnin
g
Other
agric
ulture
Veget
atio
n fire
s
Was
te
Em
issi
on
s kt
/yr
SO2 NOx
NMVOC NH3
PM10

Emissions
Sri Lanka NOx emissions (kt/yr)
0
20
40
60
80
100
120
EDGAR 2000 RAPIDC 2000
Waste
Biomass burning
Agricultural waste burning
Industrial process
Mobile combustion
Small stationary biofuelcombustionSmall stationary fossil fuelcombustionLarge stationary biofuelcombustionLarge stationary fossil fuelcombustion
Figure 2.8 Comparison between EDGAR and RAPIDC emissions inventories for Sri Lanka NOx

Regional haze problem is increasing around the globe

Measured composition of the Atmospheric Brown Cloud over South Asia from the ABC website: (http://www-abc-asia.ucsd.edu)
What are sources an effects of ABC particles?

Hindu Kush-Himalayan-Tibetan Glaciers: Water Fountain of Asia
Black Carbon has an important local effect melting these glaciers
0
100
200
300
400
500
600
Africa LatinAmerica &Caribbean
NorthAmerica
West Asia Europe Asia &Pacific
Att
rib
uta
ble
dea
ths
(Un
it:
Th
ou
san
d I
nh
abit
ants
)
Premature deaths due to outdoor air pollution (PM, including BC)
Source: Cohen et al, 2004, WHO

Atmospheric Transport of Pollutants
• MATCH model in Malé IIAS
S, N, O3, PM2.5
• Training in principles of atmospheric transport
• MATCH model installed at Malé Secretariat
IIAS - Integrated Information and Assessment System

Calculated annual-mean concentration of secondary inorganic aerosols (SIA) – sulphate, nitrate and ammonium (all within the
PM2.5 size category)
10 μg m-3 PM2.5 would result in a 10% increase in the risk of cardiopulmonary mortality and a concentration of 20 μg m-3 in a 20% increase in adults more than 30 years old

School Children Study Dhaka, Bangladesh

Multiple benefit of reducing ground-level / tropospheric ozone
i. Ozone – an important GHG; short residence time – immediate climate benefits from reductions
ii. Ozone – reduces crop yields in Asia by up to 40%
Exposure of wheat to Ozone in Pakistan
Clean airAir with ambient ozone
Source: IPCC 2007


Spinach grown in Lahore, Pakistan, with and without EDU

Provisional economic loss estimates for South Asia
Wheat, Rice, Soybean, Potato
European AOT40 dose-response relationships
FAO crop production, distribution and producer price data for 2000
MATCH modelled O3 concentrations for 2000
Loss estimated at US$ 3.9 BillionIndia (US$ 3.1), Pakistan (US$ 0.35) and Bangladesh (US$ 0.4)

CORNET – Corrosion Network
Global network of scientists looking into the impact of air pollution on the corrosion of materials
i. Exposing standard samples on racksNetwork of sites across Asia and southern Africa
ii. Exposure of kits
iii. Stock at risk study
iv. Heritage impacts

Prediction using Dose Response Functions from Europe: Portland RAPIDC values higher than expected
(256%)
ICP Materials data RAPIDC data
-2 -1 0 1 2
log(Portland)-log(Portland_SO2dom)
0
10
20
30
40
fre
qu
en
cy
-2 -1 0 1 2
log(Portland)-log(Portland_SO2dom)
0
10
20
30
40
fre
qu
en
cy

Kathmandu corrosion kits and tolerable levels for corrosion
0
10
20
30
40
50
60
70
Co
rro
sio
n /
µm
Fe25 x ZnLimestone

Rapid Urban Assessment - the Process
Two parallel processes -monitoring and modelling.
Satellite data and digital maps. Top -down and bottom-up approach for the establishment of an emission database.
EmissionData-base
Emission analysis & modelling
DispersionModelling
Map 1
NOx (µg/m3)
Monitoring
Map 2
NOx (µg/m3)

0 1 2 3 40.5 Kilometers
Legend
SO2 ton/year
0.03
0.04 - 0.06
0.07 - 0.15
0.16 - 0.29
SO2 ton/year Grid cell
0.00000 - 0.00015
0.00016 - 0.00040
0.00041 - 0.00069
0.00070 - 0.00089
0.00090 - 0.00129
SO2 ton/year Grid cell
0.00 - 0.06
0.07 - 0.19
0.20 - 0.39
0.40 - 0.71
0.72 - 1.31
1.32 - 2.31
2.32 - 3.66
3.67 - 5.26
5.27 - 9.63
9.64 - 18.93
Compiled source emissions of S02 from area sources,
line sources and point sources of Kathmandu.
0 1 2 3 40.5 Kilometers
Legend
SO2 ton/year
0.03
0.04 - 0.06
0.07 - 0.15
0.16 - 0.29
SO2 ton/year Grid cell
0.00000 - 0.00015
0.00016 - 0.00040
0.00041 - 0.00069
0.00070 - 0.00089
0.00090 - 0.00129
SO2 ton/year Grid cell
0.00 - 0.06
0.07 - 0.19
0.20 - 0.39
0.40 - 0.71
0.72 - 1.31
1.32 - 2.31
2.32 - 3.66
3.67 - 5.26
5.27 - 9.63
9.64 - 18.93

Terrestrial Ecosystem Sensitivity to Acidic Deposition in South Asia
Source: Kuylenstierna et al. 2001

Overlay G200 Ecoregions with Total N Deposition for 2000 Baseline
Total N = NOy (NO + NO2 + HNO3 + HNO4 + NO3 + 2xN2O5 + PAN + organic nitrates) + NHx (NH3 + NH4)

Overlay G200 Ecoregions with SRES A2 for 2030

Support for the Malé Declaration
Enhancing the Malé Declaration Network
Enhancing the Malé Declaration Monitoring Capacity
Developing emission inventories, scenarios and integrated assessment
Supporting and strengthening impact assessment capacity
Support decision making for prevention and control of air pollution
Raise awareness about air pollution in South Asia
Technical A
ssistance

Emission workbook
Emission Manual
Ecosystem sensitivity (nat.)
Risk areas
Scenario
Emission inventory
Prevention Controloptions options
Policy instruments
Energy, transport and industryscenarios
Emissions by 1ox1o grid
New Deposition
Transfer coefficient (region-to-grid)
S, N Deposition (by grid)
MATCH atmospheric transport model (at SMHI/ UNEP etc.)
Health impacts
Ozone PM2.5
Crop yield losses
PHASE III: Other pollutants and impacts
Malé Declaration IIAS
Integrated Information and Assessment System
Policy Options
• Policy case study manual by IIIEE: ‘Policy Options for Air Pollution Prevention and Control’ in South Asia
• Complemented by ‘Compendium of best practices on Prevention and Control of Air Pollution’ by Ram Shrestha (AIT)
• Perspectives on implementation of international and regional good practice in different Malé countries by SEI
• Three training courses held in 2006, 2007 and 2008

SEI Project:Perspectives on Air Pollution Control Policy in South
Asian Countries
• Case Study Countries: Bangladesh India Nepal
• Qualitative Research: 18 Interviews with
AQM experts Literature Reviews Qualitative data
analysis using NVivo software
City/Country Interview Examples
Delhi, India • CPCB
• MOEF
• CSE
• TERI
Dhaka, Bangladesh
• DOE
• NIPSOM
• BCAS
• BAEC
Kathmandu, Nepal
• MOEST
• Kathmandu Municipality
• ENPHO

Effects of emission control measures on emissions (Amman, 2009)
Reduced emissions
Increased emissions
Structural Measures
Energy savings, efficiency improvements, banning of activities
All pollutants
Increased use of natural gas CO2, SO2, VOC, NO2, PM
CH4
Biomass CO2 VOC, PM, CH4, N2O
Stationary Sources
Fluidised bed combustion SO2, NOX N2O
Combined heat and power All pollutants
Selective and non-selective catalytic reduction
NOX, CO NH3, N2O
Mobile Sources
EURO Emission standards NOX, VOC, PM, CO
NH3, N2O

Air pollutants Direct radiative forcing
Indirect radiative forcing (clouds, ecosystem feedbacks etc.)
Effects to human health
Ecosystem effects
Primary particles (black carbon)
???
Secondary organic particles ?
Secondary inorganic particles (sulphates, nitrates)
Methane (through trop. ozone)
NOx (through trop. ozone)
(Ozone) NOx (methane destruction)
NH3 and NOx(N deposition, C seq. and
biodiversity effects)
-
NH3 and NOx(N deposition and N2O em.)
-
After P. Grennfelt, IVL, Sweden

Conclusions
•We now have the building blocks for further development of agreements and policies in the Malé region
•Serious impacts on health, crop yields and corrosion have been demonstrated
•We can now move confidently into Phase IV where regional frameworks to discuss emission prevention and control can be developed
•Economic analysis and progress on policy development now needs to be a greater focus

THANK YOU
Remember
Your region’s staple diet……..DAL
D – Diligence
A – Accuracy
L - Linkages

Indian CAD stations
10 years of data
Pune
Bhubaneswar

Indian CAD stations10 years of data
Limited records
PuneBhubaneswar
Monitoring – Long-term trends
Sulfate in rainwater at Bhubaneswar 1997-2004

Monitoring – Long-term trends
1984 1988 1992 1996 2000 20040
102030405060
1984 1988 1992 1996 2000 2004
10
20
30
40
1984 1988 1992 1996 2000 200405
1015202530
1984 1988 1992 1996 2000 2004
60
80
100
120
140
1984 1988 1992 1996 2000 2004
6.2
6.4
6.6
6.8
7.0
7.2
SO4
Con
cen
trat
ions
in e
q / l
Year
NO3
NH4
Ca
Year pH
Temporal variations of pH, SO4, NO3, Ca and NH4 in rain water at Pune
urban sites during 1984 – 2004 from the CAD network (source: Rao et al.)
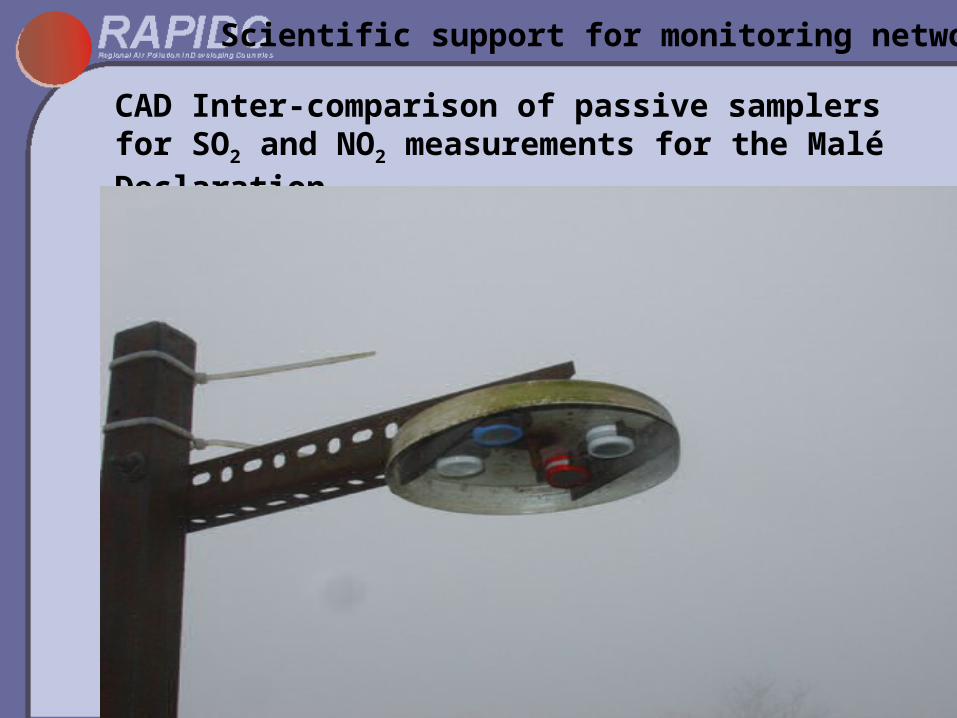
Scientific support for monitoring networks
CAD Inter-comparison of passive samplers for SO2 and NO2 measurements for the Malé Declaration

Scientific support for monitoring networks
CAD Inter-comparison of passive samplers for SO2 and NO2 measurements for the Malé Declaration


