JRC REFERENCE REPORTS Joint Research Centre Report EUR 26376 EN Progress in the management Marc van Liedekerke, Gundula Prokop, Sabine Rabl-Berger, Mark Kibblewhite, Geertrui Louwagie 2014 of Contaminated Sites in Europe
Transcript
J R C R E F E R E N C E R E P O R T S
JointResearchCentre
Report EUR 26376 EN
Progress in the management
Marc van Liedekerke, Gundula Prokop, Sabine Rabl-Berger, Mark Kibblewhite, Geertrui Louwagie
Marc van LiedekerkeEuropean Commission, Joint Research Centre
Gundula Prokop, Sabine Rabl-BergerEnvironment Agency Austria
Mark KibblewhiteCranfield University
Geertrui LouwagieEuropean Environment Agency
January 2014
Progress in the
in Europe
Management of Contaminated Sites
3
Progress in the Management of Contaminated Sites in Europe
EXECUTIVE SUMMARY
This report presents the current state of knowl-edge about progress with the management of contaminated sites in Europe. It directly supports the EU Soil Thematic Strategy (COM(2006) 231), which identifies local soil contamination as an important issue. It presents facts, analyses, and methods on the management of Contaminated Sites, which can inform policy makers, profes-sional practitioners, researchers, citizens and the media. The report is based on data that were collected from the National Reference Centres for Soil in 39 countries belonging to the European Environment Information and Observation Network (EIO-NET) during a cam-paign organised by the JRC European Soil Data Centre in 2011-2012. The information present-ed in this report is based on a set of indica-tors which have been agreed on and used by the EIONET for more than a decade. This set of indicators contributes to the Core Set Indicator “Progress in the Management of Contaminated Sites” (CSI 015) of the European Environment Agency (EEA), which is used for reporting on the State of the Environment.
These indicators aim to answer the following policy-relevant questions: What is the estimat-ed extent of soil contamination? How much pro-gress has been achieved in the management and control of local soil contamination? Which sectors contribute most to soil contamination? What are the main contaminants affecting soil and groundwater in and around Contaminated Sites? How much is spent on cleaning up soil contamination? How much of the public budget is used?
The data request was sent to the then 32 EEA member countries (27 European Union Member States together with Iceland, Liechtenstein, Norway, Switzerland and Turkey) and the seven EEA cooperating countries in the West Balkan: Albania, Bosnia and Herzegovina, Croatia1, the former Yugoslav Republic of Macedonia (FYROM), Montenegro, Serbia as well as Kosovo under the UN Security Council
1 EU Member State since 1st July 2013.
Resolution 1244/992. 27 countries returned the questionnaire.
Key findings are as follows:
Estimated extent of local soil contamination in Europe
Estimates for the extent of local soil contami-nation are available for about one third of the countries surveyed; an average of about 4.2 Potentially Contaminated Sites are reported per 1,000 inhabitants and about 5.7 Contaminated Sites per 10,000 inhabitants. A tentative extrapolation to the whole of Europe produces an estimate for the total number of Potentially Contaminated Sites of 2.5 million, of which about 14 % (340,000 sites) are expected to be contaminated and likely to require remediation.
Identified and remediated local soil contamination versus future work load
Based on the current reporting comprising 27 countries, about 1,170,000 Potentially Contaminated Sites have been identified to date and this is estimated to approximate to about 45 % of the number of possible sites for the EEA-39. About one third of the estimated total of 342,000 Contaminated Sites for the EEA-39 have already been identified and about 15 % of the estimated total have been remedi-ated. However, there are substantial differences in the underlying site definitions and interpreta-tions that are used in different countries.
Progress in the management and control of local soil contamination
Four management steps are defined for the management and control of local soil contami-nation, namely site identification (or prelimi-nary studies), preliminary investigations, main site investigations, and implementation of risk reduction measures. About one third of the
2 The 33 EEA members together with the six EEA
cooperating countries are collectively called the
EEA-39.
4
Progress in the Management of Contaminated Sites in Europe
countries surveyed provided data which allow an assessment of their progress with these management steps.
The results show that 12 out of 39 countries have made significant progress in the mapping of their polluting activities and of Potentially Contaminated Sites, and that seven countries have almost completed this management step.
With regard to the “preliminary investigations” management step, only eight countries were able to measure their progress in relation to a defined target and of these, six countries reported significant progress. 15 countries substantially increased the resources devoted to main site investigations, while 12 countries are monitoring these resources in relation to a defined target.
The data indicate that, since the last data col-lection exercise, 10 countries have increased their implementation of remediation measures, and about one third of the countries surveyed measure their efforts according to a defined quantitative target.
Inventories
28 of the 39 countries in the sample report that they maintain comprehensive inventories for Contaminated Sites; 25 countries have cen-tral national data inventories while four coun-tries, namely Sweden, Belgium, Germany and Italy, manage their inventories at the regional level. Almost all of the inventories include information on polluting activities, Potentially Contaminated Sites and Contaminated Sites.
Remediation techniques
Contaminated soil continues to be commonly managed using “traditional” techniques, e.g. excavation and off-site disposal, which accounts for about one third of management practices. In-situ and ex-situ remediation techniques for contaminated soil are applied more or less equally, while ex-situ physical and/or chemical remediation techniques account for 37 % of the contaminated groundwater treatments.
Polluting activities and sectors
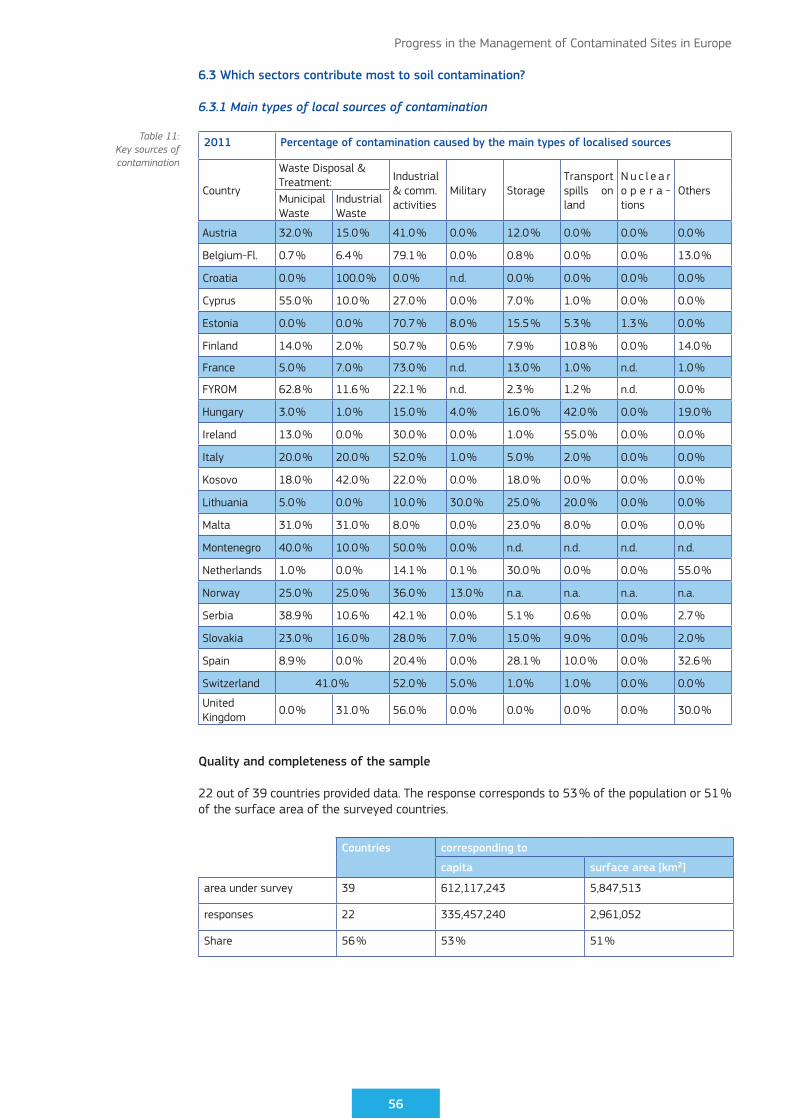
Overall, the production sectors contribute more to local soil contamination than the service sec-tors (60 % compared to 32 %). Mining activities are important sources of soil contamination in some countries (e.g. in Cyprus, Slovakia, FYROM). A closer look at the production sector reveals that the textile, leather, wood and paper industries are of minor importance for local soil contamination, whereas metal industries are those most frequently reported to be impor-tant sources of contamination (13 %). For the service sector, gasoline stations are the most frequently reported sources of contamination (15 %).
Contaminants
The relative importance of different contami-nants as reported in 2011 is similar to that reported in 2006, except for a decrease in the share of sites associated with chlorinated hydrocarbons in groundwater. The distribution of the different contaminants is similar for both liquid and solid matrices. The most frequent contaminants are mineral oils and heavy met-als. Contamination by mineral oil is especially dominant in Belgium (solid matrix: 50 %) and Lithuania (solid matrix: 60 %), while for Austria (solid matrix: 60 %) and the FYROM (solid matrix: 89 %) heavy metals predominate. Generally, phenols and cyanides make a negligible overall contribution to total contamination.
Cost of Contaminated Sites
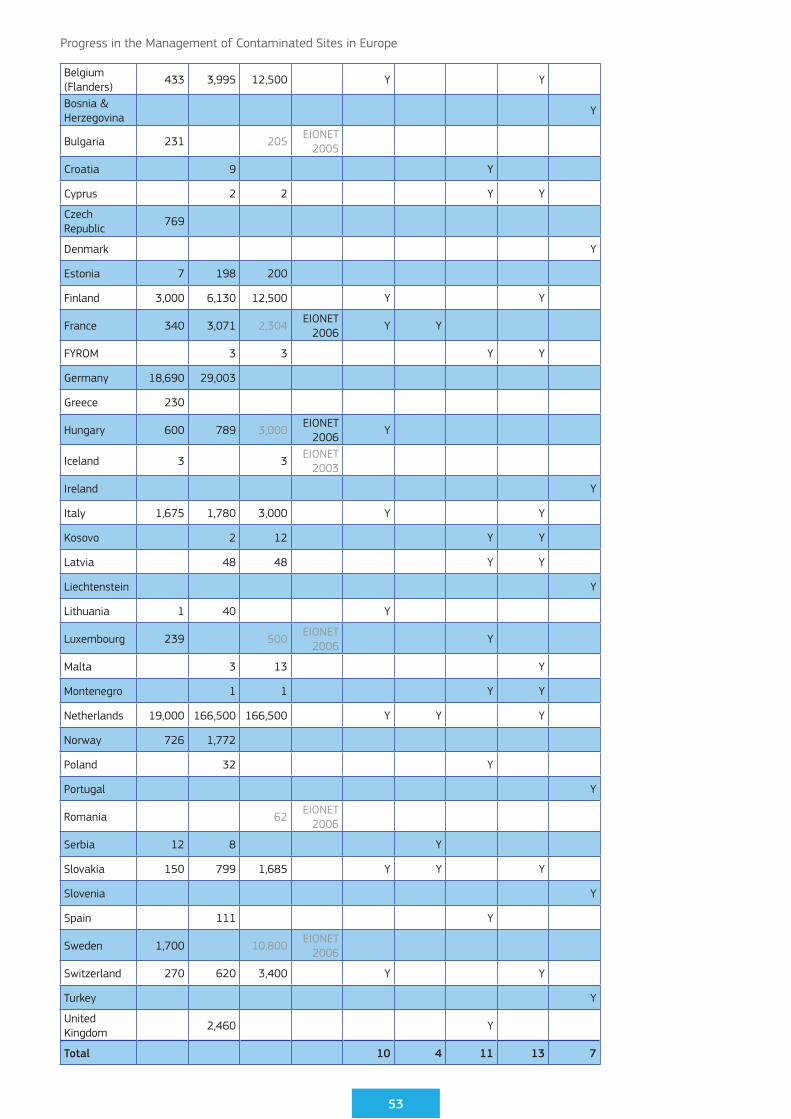
On average, 42 % of total expenditure on the management of Contaminated Sites comes from public budgets in the countries surveyed, ranging from 90 % in Estonia to about 25 % in Belgium (Flanders). Annual national expen-ditures for the management of Contaminated Sites are on average about €10 per capita, ranging from approximately €2 in Serbia to more than €30 in Estonia. This corresponds to an average of €0.4 per million Euros of national GDP. Around 81 % of the annual national expen-ditures for the management of Contaminated Sites is spent on remediation measures, while only 15 % is spent on site investigations. It should be noted that these results derive from data provided by only a small number of countries.
5
Progress in the Management of Contaminated Sites in Europe
About this report
This report prepared by the European Soil Data Centre (ESDAC) of the European Commission’s Joint Research Centre (JRC) proposes an updated version of the EEA indicator CSI 015 “Progress in the management of Contaminated Sites”. It is based on a data collection exer-cise that was launched in EIONET countries by ESDAC in October 2011 and concluded in February 2012, after which a period of analy-sis and assessment followed that resulted in a draft report in August 2012. The report takes into account only the data that have been received up to February 2012 and not the addi-tional data received from some countries after that date.
The report continues the work carried out by the European Environment Agency (EEA) since 1998, namely the collection of data on Contaminated Sites, the responsibility for which was transferred from the EEA to the JRC follow-ing a joint decision by EUROSTAT, the EEA, the European Commission’s Directorate General for the Environment (DG ENV), and the JRC. Data on Contaminated Sites in EIONET countries was previously collected in 2001, 2002, 2003, 2005 and 2006 using a standard questionnaire. The assessment of these data can be found on the EEA website.
The indicator CSI 015 “Progress in the manage-ment of Contaminated Sites” aims to provide answers to the policy-relevant question “How is the problem of Contaminated Sites being addressed (by cleanup of historical contamina-tion and prevention of new contamination)?” and to more specific questions referring to management progress, contributing sectors, the main contaminants and expenditures.
The content of this report is linked to support-ing documents that can be found on the JRC European Soil Portal (http://eusoils.jrc.ec.europa.eu/library/data/eionet/). These documents are: the questionnaire and the guidelines for fill-ing in the questionnaire that were sent out to EIONET countries; a report on the data collected from EIONET countries; an analysis and assess-ment of the data received per country; some suggestions for the improvement of the cur-rent collection of information on Contaminated Sites in Europe; the database that contains all data received during the 2011 data collection exercise together with all the data from previ-ous exercises.
The geographical coverage of the data col-lection encompasses the 33 EEA member countries (28 European Union Member States together with Iceland, Liechtenstein, Norway, Switzerland and Turkey) and the EEA cooper-ating countries in the West Balkan: Albania, Bosnia and Herzegovina, the former Yugoslav Republic of Macedonia (FYROM), Montenegro, Serbia as well as Kosovo under the UN Security Council Resolution 1244/99.
For the collection, analysis and assessment of the data, the JRC collaborated with the Environment Agency of Austria and Cranfield University. The draft report of August 2012 was submitted for review to DG ENV, the EEA and all EIONET countries (National Focal Points, Primary Contact Points Soil, National Reference Centres (NRCs) for Soil). The comments received have been incorporated in this report.
The production of this report has been made possible thanks to the data contribu-tion of organisations in the EIONET NRC Soil Community, as listed in the acknowledgements.
6
Progress in the Management of Contaminated Sites in Europe
Acknowledgements
The authors would like to thank Luca Marmo, Alia Atitar de la Fuente and Thomas Strassburger of the European Commission’s DG Environment for providing guidance and support during the preparation and the execution of the study. The following organisations and persons also need to be mentioned for their data contribution that fuelled this study.
Country Person completing the workbook
Organisation
Albania Loreta Sulovari Agency of Environment and Forestry
Erinda Misho AEF
Austria Stefan Weihs Umweltbundesamt GmbHEnvironment Agency AustriaDietmar Mueller
Sabine RablBerger
Franz Buchebner Bundesministerium für Land und Forstwirtschaft, Umwelt und Wasserwirtschaft
Sebastian Holub Kommunalkredit Public Consulting GmbH
Belgium (Flanders)
Marijke Cardon OVAM
Els Gommeren OVAM
Bosnia & Herzegovina
Hamid Custovic University of Sarajevo, Faculty of Agriculture and Food Sciences
5.1 What is the estimated extent of soil contamination? 25 5.2 How much progress is being achieved in the management and control of
local soil contamination? 26 5.2.1 Identified sites 26 5.2.2 Progress per management step 28 5.2.3 Inventories 30 5.2.4 Remediation techniques 31 5.3 Which sectors contribute most to soil contamination? 32 5.3.1 Main types of local sources of contamination 32 5.3.2 Industrial and commercial activities that cause local soil contamination 34 5.4 Which are the main contaminants affecting soil and groundwater in and
around Contaminated Sites? 36 5.5 How much is being spent on cleaning up soil contamination?
How much of the public budget is being used? 37 5.5.1 Annual remediation expenditures 37 5.5.2 Investigation and remediation 39 5.5.3 Funding mechanisms for orphan sites 41
10
Progress in the Management of Contaminated Sites in Europe
6. Data & Methodology 43 6.1 What is the estimated extent of soil contamination? 43 6.2 How much progress is being achieved in the management and control of
local soil contamination? 45 6.2.1 Identified sites 45 6.2.2 Progress per management step 47 6.2.3 Inventories 54 6.2.4 Remediation techniques 55 6.3 Which sectors contribute most to soil contamination? 56 6.3.1 Main types of local sources of contamination 56 6.3.2 Industrial and commercial activities causing local soil contamination 57 6.4 Which are the main contaminants affecting soil and groundwater in and
around Contaminated Sites? 59 6.5 How much is being spent on cleaning up soil contamination?
How much of the public budget is being used? 61 6.5.1 Annual remediation expenditures 61 6.5.2 Investigation and remediation 62 6.5.3 Funding mechanisms for orphan sites 65 7. References 67 8. ANNEX 68
TABLES
Tab. 1: EEA indicator typology (source: EEA, 1999) 16Tab. 2: Overview of existing policy targets for local soil contamination 20Tab. 3: Progress in the Management of Contaminated Sites. 28Tab. 4: Estimated number of Potentially Contaminated Sites and Contaminated Sites 43Tab. 5: Identified number of Potentially Contaminated Sites, Contaminated Sites and remediated Sites 45Tab. 6: Progress in the “site identification” category. 49Tab. 7: Progress in the “preliminary surveys” management step 50Tab. 8: Progress in the “main site investigations” management step 51Tab. 9: Progress in the “remediation measures” management step 52Tab. 10: Availability of inventories for sites with local soil contamination 54Tab. 11: Key sources of contamination 56Tab. 12: Industrial/commercial activities causing local soil contamination Percentage of industrial or commercial branches 57Tab. 13: Contaminants affecting soil and groundwater 59Tab. 14: Estimated allocation of public and private expenditures for the management of Contaminated Sites 61Tab. 15: Annual expenditures for the management of Contaminated Sites 61
11
Progress in the Management of Contaminated Sites in Europe
Tab. 16: Shares in total annual expenditures for the management of Contaminated Sites for the different management steps 62Tab. 17: Shares of cost categories for site investigation 63Tab. 18: Shares of cost categories for remediation measures 63Tab. 19: Overview: availability of funding mechanisms for orphan sites 65
FIGURES
Fig.1: Proposed indicators for local soil contamination as of 1999 (source EEA 2002) 15Fig.2: Estimates for Potentially Contaminated Sites and Contaminated Sites 26Fig.3: Identified Potentially Contaminated Sites and Contaminated Sites 27Fig.4: Countries with central inventories for Contaminated Sites 30Fig.5: Dominant remediation technologies for contaminated soil 32Fig.6: Key sources of contamination 33Fig.7: Breakdown of activities causing local soil contamination 2011 34Fig.8: Breakdown of sectors causing local soil contamination 35Fig.9: Overview of contaminants affecting soil and groundwater in Europe 36Fig.10: Estimated allocation of public and private expenditures for the management of Contaminated Sites 37Fig.11: Annual national expenditures for the management of Contaminated Sites per unit of GDP and in Euro per capita 38Fig.12: Shares in total expenditure on the management of Contaminated Sites for different management steps 39Fig.13: Average cost categories for site investigations (left) and remediation measures 40Fig.14: Funding mechanisms for orphan sites 41
12
13
Progress in the Management of Contaminated Sites in Europe
1. INTRODUCTION
In 2001, the European Environment Agency (EEA) started to develop a core set of policy- relevant indicators. The key objective was to provide a manageable and stable basis for indicator based reporting on the state of the European environment. The core set, which included 50 indicators, was finally adopted by the EEA Management Board in 2004. Since then, the core set has undergone revisions and, accordingly, existing indicators have been updated and new indicators developed.
With regard to local soil contamination, the first steps for common data collection and pro-posals for possible indicators were taken as early as 1996. In 2001 the Core Set Indicator CSI 015 “Progress in management of contami-nated sites” was launched. Since then the indi-cator has been revised and updated several times. The current report represents the sixth official data collection and subsequent assess-ment exercise for this indicator.
1.1 Previous assessments
Previous assessment reports of this indicator were published in 2005 and 2007 on the EEA website and are available from the following links:
Progress in management of contaminated sites (CSI 015) - Assessment published July 2005
Progress in the Management of Contaminated Sites in Europe
2 INDICATOR DESCRIPTION
2.1 Justification for indicator selection
Emissions of dangerous substances from local sources can have impacts on the quality of soil and water, particularly groundwater. The Core Set Indicator CSI 015 “Progress in the Management of Contaminated Sites” aims to assess the adverse effects caused and meas-ures taken to satisfy environmental standards according to current legal requirements.
No legal standards for soil quality have been set at the EU level, but targets have been set by some EEA member countries. In general, legislation aims to prevent new contamination and to set targets for the remediation of sites where environmental standards have already been exceeded.
The CSI 015 indicator tracks progress in the management of Contaminated Sites, the restriction of land use and use of ground-/sur-face water as a consequence of contamination, and the provision of public and private money for remediation.
A number of activities that cause soil pollution can be clearly identified across Europe, in par-ticular emissions from industrial activities and waste disposal from municipal and industrial sources. However, the range of polluting activi-ties varies considerably from country to coun-try. Apparent variation may also be the result of differing classification schemes or due to incomplete reporting.
The implementation of existing legislative and regulatory frameworks (e.g. the Integrated Pollution Prevention and Control Directive, Landfill Directive, Water Framework Directive) helps to prevent new contamination of soil. However, efforts must still be made to deal with historical soil contamination.
2.2 Type of indicator
The EEA’s reporting on the environment is based on the DPSIR framework (see Figure 1), which distinguishes between the state (S) of the environment, being the result of spe-cific drivers (D) and pressures (P) (positive or negative), and then impact (I) the environment.
Figure 1: Proposed indicators for local soil contamination as of 1999 (source EEA 2002).
16
Progress in the Management of Contaminated Sites in Europe
The responses (R) represent the solutions (e.g. policies, investments) that aim to improve or maintain the current state.
The indicator CSI 015 “Progress in the Management of Contaminated Sites”, which contains various elements, falls under the category “responses” (which aims to provide answers to the question “What is being done to reduce or avoid local contamination?”), and the category “state” (since the indicator provides data on the extent of local soil contamination in Europe).
Descriptive (Type A) indicator. According to the EEA’s indicator typology, which distin-guishes between four major categories (see Table 1), the indicator CSI 015 “Progress in the Management of Contaminated Sites” falls mainly into category A “descriptive” (answering questions related to “What is happening to the environment and to humans?”) and category C “efficiency” (answering the question “Are we improving?”)
2.3 Terminology
The term ‘Contaminated Site’ (CS) refers to a welldefined area where the presence of soil con-tamination has been confirmed and this presents a potential risk to humans, water, ecosystems or other receptors. Risk management measures, e.g. remediation, may be needed depending on the severity of the risk of adverse impacts to recep-tors under the current or planned use of the site.
The term ‘Potentially Contaminated Site’ (PCS) refers to sites where unacceptable soil contam-ination is suspected but not verified, and where detailed investigations need to be carried out to verify whether there is an unacceptable risk of adverse impacts on receptors.
Both of these parameters were introduced for the first time in the 2011 data request. The scale of local soil contamination was also assessed in previous data requests but results were derived from other parameters (in particular the four key management steps as elaborated below); an approach that was abandoned in the 2011 data request.
Management of Contaminated Sites aims to assess and, where necessary, reduce the risk of adverse impacts on receptors to an acceptable level. This management process starts with a basic desk study or historical investigation, which may lead to more detailed site investiga-tions and, depending in the outcome of these, remediation measures.
The indicator shows progress in four key man-agement steps:
• preliminary study/site identification
• preliminary investigation
• main site investigation,
• implementation of risk reduction measures.
Under each management step, two stages can be distinguished:
• estimation of the number of sites in need of this specific step,
• actual counting or completion of this specific management step.
In addition, the indicator reports the costs to society of site management, the main activities responsible for soil contamination and the out-comes of managing Contaminated Sites.
Category type Related question
Type A Descriptive IndicatorsWhat is happening to the environment and to humans?
Type B Performance Indicators Does it matter?Type C Efficiency Indicators Are we improving?Type D Total Welfare Indicators Are we on the whole better off?
Table 1: EEA indicator typology
(source: EEA, 1999)
17
Progress in the Management of Contaminated Sites in Europe
2.4 Units
• Number of sites managed (or requiring man-agement), at the different management steps.
• Percentage of sites: sites where a specific management step is completed over the estimated total number of sites in need of this specific management step.
• Expenditure is provided in Euros per capita per year and million Euros per GDP (expressed in billion Euros).
• Contribution of economic activities to soil contamination is calculated in terms of the percentage of sites in which the activity is present over the total number of investigat-ed sites.
• Percentage of sites per risk reduction meas-ure undertaken by each country.
2.5 Amendments compared to previous assessments
Six data collection exercises have been com-pleted since 2001 to support reporting by the EEA of the indicator CSI 015 “Progress in the Management of Contaminated Sites”. Some adjustments and / or adaptations were intro-duced to the indicator following each previous data collection exercise in the light of experi-ence. As part of the 2011 data collection exer-cise, two major changes were made.
The 2011 data collection exercise was confined to five key topics. The topics “problem areas” and “brownfield management” were aban-doned, due to the very low level of response to data requests in previous exercises. The five key topics retained are:
• Management of Contaminated Sites
• Remediation targets and technologies
• Contribution of polluting activities to local soil contamination
• Environmental impacts
• Expenditure
New parameters were introduced for the indicator “Progress in the Management of Contaminated Sites”. In previous data collection exercises, all parameters focused on the man-agement steps (i.e. preliminary study, prelimi-nary investigation, main site investigation, and implementation of risk reduction measures). In the 2011 data collection exercise, parameters on the number of sites were introduced, specifi-cally the parameters “Potentially Contaminated Sites”, “Contaminated Sites” and “sites under remediation”. The new parameters aim to pro-vide an insight into the current level of man-agement of Contaminated Sites. As opposed to parameters referring to the management steps, the new parameters do not refer to cumulative total numbers but to the number of sites currently undergoing each management step. For example the number of “Potentially Contaminated Sites” could decrease over time in a country. This could be due to the fact that more and more sites were subject to further investigations and classified as “Contaminated Sites”.
19
Progress in the Management of Contaminated Sites in Europe
3 POLICY CONTEXT AND TARGETS
3.1 Context description
The overarching policy objective is to achieve a level of quality of the environment where man-made contaminants on sites do not give rise to significant impacts on or risks to human health and ecosystems.
Legal requirements for the general protection of soil have not been agreed at the European Union (EU) level and only exist in some Member States. However, the Integrated Pollution and Prevention Control Directive (IPPC 2008/1/EC) requires that operations falling under its scope do not create new soil contamination, and legislation not aimed directly at soil pro-tection (e.g. the Water Framework Directive (WFD 2000/60/EC), the Waste Framework Directive (2008/98/EC) and Landfill Directive (99/31/EC)) provides indirect controls on soil contamination and requirements for its man-agement where applicable. Furthermore, the Directive on Industrial Emissions (IED 2010/75/EU) provides a regulatory framework to prevent emissions to soil from large industrial plants; it will repeal the IPPC Directive with effect from 7 January 2014. Notwithstanding these and similar controls in non EU Member States, sig-nificant new site contamination still occurs as a result of accidents and illegal activities.
While the creation of new Contaminated Sites is constrained by regulation, a very large num-ber of sites exist with historical contamination that may present unacceptable risks, and these sites need to be properly managed.
3.2 Targets
No European targets to reduce local soil con-tamination have yet been established. National targets exist in many European Economic Area countries. Table 2 provides an overview of existing national targets. These take a variety of forms, for example by referencing timelines for remediation of historic contamination or specific management steps or lists of nation-al priority sites. Since the last data request in 2006, nine countries have established new policy targets relating to the management of Contaminated Sites and in total 17 countries report official policy targets for the manage-ment of Contaminated Sites.
20
Progress in the Management of Contaminated Sites in Europe
Country Year Political or technical target
Austria 2025 Identification of Contaminated Sites completed
2030-2040 Essential part of the Contaminated Sites problem should be managed
2050 Remediation and re-integration of identified Contaminated Sites into economic and natural cycle
Belgium (Flanders) 2036 Remediation started on sites with potentially contaminating activities and/or that are conside-red to be contaminated
Croatia 2025 Remediation of «hot spots», locations in the envi-ronment which are highly burdened with waste
Czech Rep. 2040 Political/technical level [government decree]: Environmental remediation of uranium and coal facilities DIAMO
Denmark 2016 Site identifications and preliminary investigations are completed nationwide
Estonia 2030 All contaminated areas to be remediated or sustained
FYR of Macedonia 2008-2014 Implementation of the closure/remediation mea-sures for the top three hotspots from the annex 1
Hungary 2050 Handling of all historic Contaminated Sites. The Gov. Decision No. 2205/1996. (VIII.24.) adopted the Natio-nal Environmental Remediation Programme (OKKP), which has three stages: short, medium and long.
Kosovo 2018 Drafting of land cadastre and developing monito-ring system
2025 Re-cultivation and adequate use of agricultural land
Montenegro 2008-2012 Recovery and/or closure of existing dumpsites, remediation of hot-spots (Contaminated Sites), construction of regional sanitary landfills
Netherlands 2015 Bringing risk at sites to an acceptable level for the current land useHandling of sites at risk with current land use
Norway 2012 Handling of (approx. 250) sites completed, where pollution is shown to be most serious, i.e. where pollution is released to priority areas or can pose a human health risk.
Romania 2020 Environmental remediation of the majority pollu-ted areas
Serbia 2014 Priority list for remediation will be established.
2019 20 % of priority sites should be remediated.
Slovakia 2015 Remediation of the Contaminated Sites with the highest risk to human health and environment (to reach «good status of water» with respect to the Water Framework Directive)
Sweden 2050 Environmental objective: a non-toxic environment Remediation of priority sites by 2010Other Contaminated Sites contained or remedia-ted by 2050 at the latest
Switzerland 2025 Remediation or containment of historic soil conta-mination
Table 2: Overview of existing
policy targets for local soil contamination.
Sources: EIONET priority data flows 2006 and 2011
Note: new policy targets (since the last assessment
in 2007) are highlighted; outdated policy targets
have been deleted
21
Progress in the Management of Contaminated Sites in Europe
4 KEY ASSESSMENT
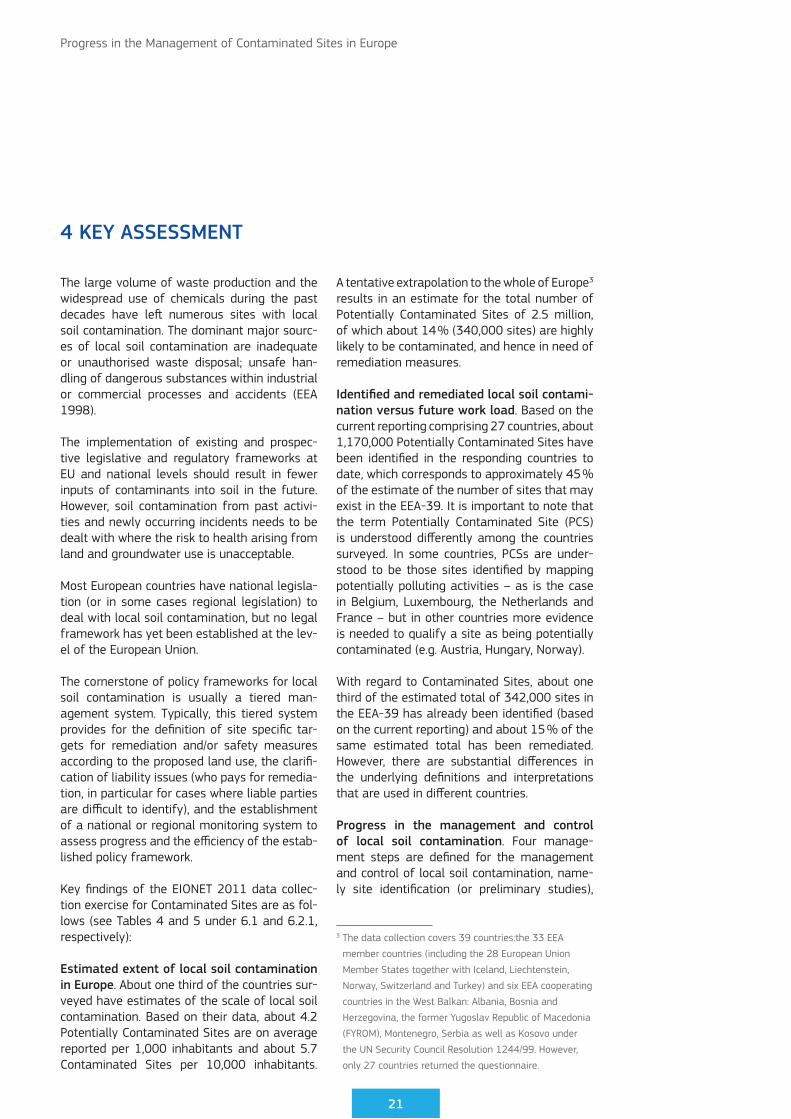
The large volume of waste production and the widespread use of chemicals during the past decades have left numerous sites with local soil contamination. The dominant major sourc-es of local soil contamination are inadequate or unauthorised waste disposal; unsafe han-dling of dangerous substances within industrial or commercial processes and accidents (EEA 1998).
The implementation of existing and prospec-tive legislative and regulatory frameworks at EU and national levels should result in fewer inputs of contaminants into soil in the future. However, soil contamination from past activi-ties and newly occurring incidents needs to be dealt with where the risk to health arising from land and groundwater use is unacceptable.
Most European countries have national legisla-tion (or in some cases regional legislation) to deal with local soil contamination, but no legal framework has yet been established at the lev-el of the European Union.
The cornerstone of policy frameworks for local soil contamination is usually a tiered man-agement system. Typically, this tiered system provides for the definition of site specific tar-gets for remediation and/or safety measures according to the proposed land use, the clarifi-cation of liability issues (who pays for remedia-tion, in particular for cases where liable parties are difficult to identify), and the establishment of a national or regional monitoring system to assess progress and the efficiency of the estab-lished policy framework.
Key findings of the EIONET 2011 data collec-tion exercise for Contaminated Sites are as fol-lows (see Tables 4 and 5 under 6.1 and 6.2.1, respectively):
Estimated extent of local soil contamination in Europe. About one third of the countries sur-veyed have estimates of the scale of local soil contamination. Based on their data, about 4.2 Potentially Contaminated Sites are on average reported per 1,000 inhabitants and about 5.7 Contaminated Sites per 10,000 inhabitants.
A tentative extrapolation to the whole of Europe3 results in an estimate for the total number of Potentially Contaminated Sites of 2.5 million, of which about 14 % (340,000 sites) are highly likely to be contaminated, and hence in need of remediation measures.
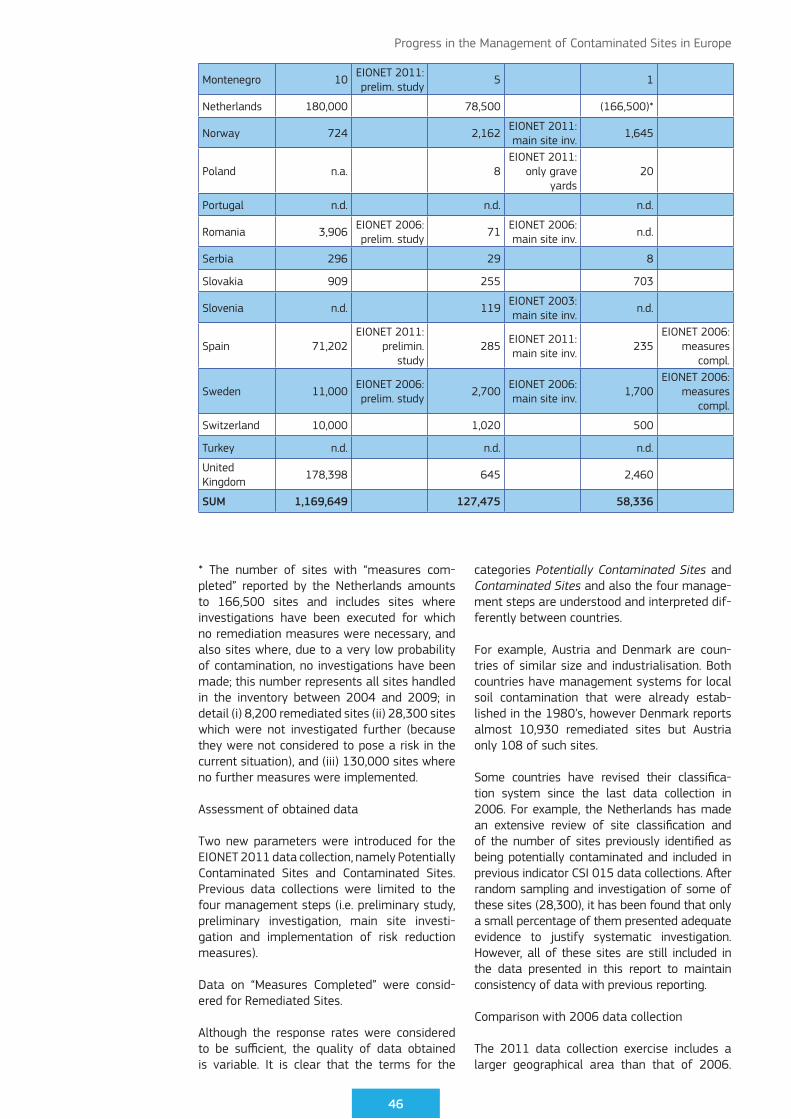
Identified and remediated local soil contami-nation versus future work load. Based on the current reporting comprising 27 countries, about 1,170,000 Potentially Contaminated Sites have been identified in the responding countries to date, which corresponds to approximately 45 % of the estimate of the number of sites that may exist in the EEA-39. It is important to note that the term Potentially Contaminated Site (PCS) is understood differently among the countries surveyed. In some countries, PCSs are under-stood to be those sites identified by mapping potentially polluting activities – as is the case in Belgium, Luxembourg, the Netherlands and France – but in other countries more evidence is needed to qualify a site as being potentially contaminated (e.g. Austria, Hungary, Norway).
With regard to Contaminated Sites, about one third of the estimated total of 342,000 sites in the EEA-39 has already been identified (based on the current reporting) and about 15 % of the same estimated total has been remediated. However, there are substantial differences in the underlying definitions and interpretations that are used in different countries.
Progress in the management and control of local soil contamination. Four manage-ment steps are defined for the management and control of local soil contamination, name-ly site identification (or preliminary studies),
3 The data collection covers 39 countries:the 33 EEA
member countries (including the 28 European Union
Member States together with Iceland, Liechtenstein,
Norway, Switzerland and Turkey) and six EEA cooperating
countries in the West Balkan: Albania, Bosnia and
Herzegovina, the former Yugoslav Republic of Macedonia
(FYROM), Montenegro, Serbia as well as Kosovo under
the UN Security Council Resolution 1244/99. However,
only 27 countries returned the questionnaire.
22
Progress in the Management of Contaminated Sites in Europe
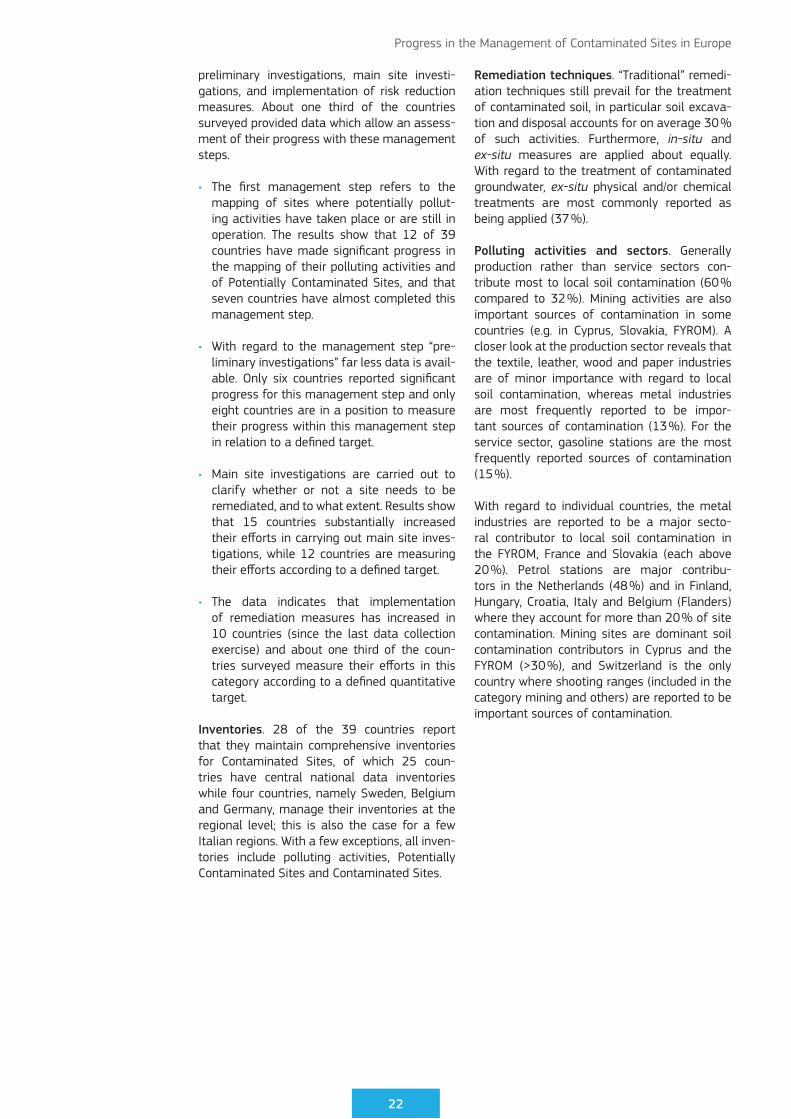
preliminary investigations, main site investi-gations, and implementation of risk reduction measures. About one third of the countries surveyed provided data which allow an assess-ment of their progress with these management steps.
• The first management step refers to the mapping of sites where potentially pollut-ing activities have taken place or are still in operation. The results show that 12 of 39 countries have made significant progress in the mapping of their polluting activities and of Potentially Contaminated Sites, and that seven countries have almost completed this management step.
• With regard to the management step “pre-liminary investigations” far less data is avail-able. Only six countries reported significant progress for this management step and only eight countries are in a position to measure their progress within this management step in relation to a defined target.
• Main site investigations are carried out to clarify whether or not a site needs to be remediated, and to what extent. Results show that 15 countries substantially increased their efforts in carrying out main site inves-tigations, while 12 countries are measuring their efforts according to a defined target.
• The data indicates that implementation of remediation measures has increased in 10 countries (since the last data collection exercise) and about one third of the coun-tries surveyed measure their efforts in this category according to a defined quantitative target.
Inventories. 28 of the 39 countries report that they maintain comprehensive inventories for Contaminated Sites, of which 25 coun-tries have central national data inventories while four countries, namely Sweden, Belgium and Germany, manage their inventories at the regional level; this is also the case for a few Italian regions. With a few exceptions, all inven-tories include polluting activities, Potentially Contaminated Sites and Contaminated Sites.
Remediation techniques. “Traditional” remedi-ation techniques still prevail for the treatment of contaminated soil, in particular soil excava-tion and disposal accounts for on average 30 % of such activities. Furthermore, in-situ and ex-situ measures are applied about equally. With regard to the treatment of contaminated groundwater, ex-situ physical and/or chemical treatments are most commonly reported as being applied (37 %).
Polluting activities and sectors. Generally production rather than service sectors con-tribute most to local soil contamination (60 % compared to 32 %). Mining activities are also important sources of contamination in some countries (e.g. in Cyprus, Slovakia, FYROM). A closer look at the production sector reveals that the textile, leather, wood and paper industries are of minor importance with regard to local soil contamination, whereas metal industries are most frequently reported to be impor-tant sources of contamination (13 %). For the service sector, gasoline stations are the most frequently reported sources of contamination (15 %).
With regard to individual countries, the metal industries are reported to be a major secto-ral contributor to local soil contamination in the FYROM, France and Slovakia (each above 20 %). Petrol stations are major contribu-tors in the Netherlands (48 %) and in Finland, Hungary, Croatia, Italy and Belgium (Flanders) where they account for more than 20 % of site contamination. Mining sites are dominant soil contamination contributors in Cyprus and the FYROM (>30 %), and Switzerland is the only country where shooting ranges (included in the category mining and others) are reported to be important sources of contamination.
23
Progress in the Management of Contaminated Sites in Europe
Contaminants. The distribution of the differ-ent contaminants is similar in the liquid and the solid matrices. The main contaminant categories are mineral oils and heavy metals. Contamination with mineral oil is especially dominant in Belgium (solid matrix: 50 %) and Lithuania (solid matrix: 60 %), while the focus is on heavy metals for Austria (solid matrix: 60 %) and the FYROM (solid matrix: 89 %). Phenols and cyanides make a negligible overall con-tribution to the total contaminant loading. The relative importance of different contaminants as reported in 2011 is similar to that reported in 2006, except for a decrease in the share of sites associated with chlorinated hydrocarbons in groundwater.
Expenditure. In the countries surveyed, on aver-age 42 % of total expenditure is derived from public budgets, ranging from 90 % in Estonia down to a minimum of about 25 % in Belgium (Flanders). The 2006 assessment reported a smaller share for public expenditure at 35 %. A possible explanation for this increase in pub-lic expenditure is the large increase in France, where public expenditure on local soil contami-nation rose from 7 % in 2006 to 30 % in 2010.
Annual national expenditures for the manage-ment of Contaminated Sites are on average about €10 per capita, ranging from approxi-mately €2 in Serbia to more than €30 in Estonia. This corresponds to an average of €0.4 per million Euros of national GDP. Compared to 2006, average national expenditures for the management of Contaminated Sites decreased (€12 per capita; €0.7 per million Euros of national GDP).
On average, 81 % of the annual national expen-ditures for the management of contaminated sites is spent on remediation measures, while only 15 % is spent on site investigations. The expenditures for aftercare measures are often not reported separately but are included in the expenditure on remediation measures. Exceptions are Austria and Denmark with a share of 7–8 % for aftercare measures, and Sweden with a share of 13 % for redevelop-ment measures.
Costs for site investigations generally fall in the range of €5,000 to €50,000 (60 % of reported cases). Investigations that cost more than €5 million are only found in Italy and Switzerland. In the Netherlands, “small standard sites” are included in the Contaminated Sites regime; these account for 10 % of the site investiga-tions, but cost less than €500.
Costs for remediation projects usually fall in the range €50,000 to €500,000 (40 % of the reported cases). Small remediation projects costing less than €5,000 and extremely large remediation projects costing more than €5 mil-lion are rarely reported.
18 European countries have funding mecha-nisms for “orphan” contaminated sites (sites where no liable party can be identified) at the national level. Belgium and Germany fund such sites at the regional level only. In Slovakia this funding mechanism was adopted in 2006.
25
Progress in the Management of Contaminated Sites in Europe
5 SPECIFIC POLICY QUESTIONS
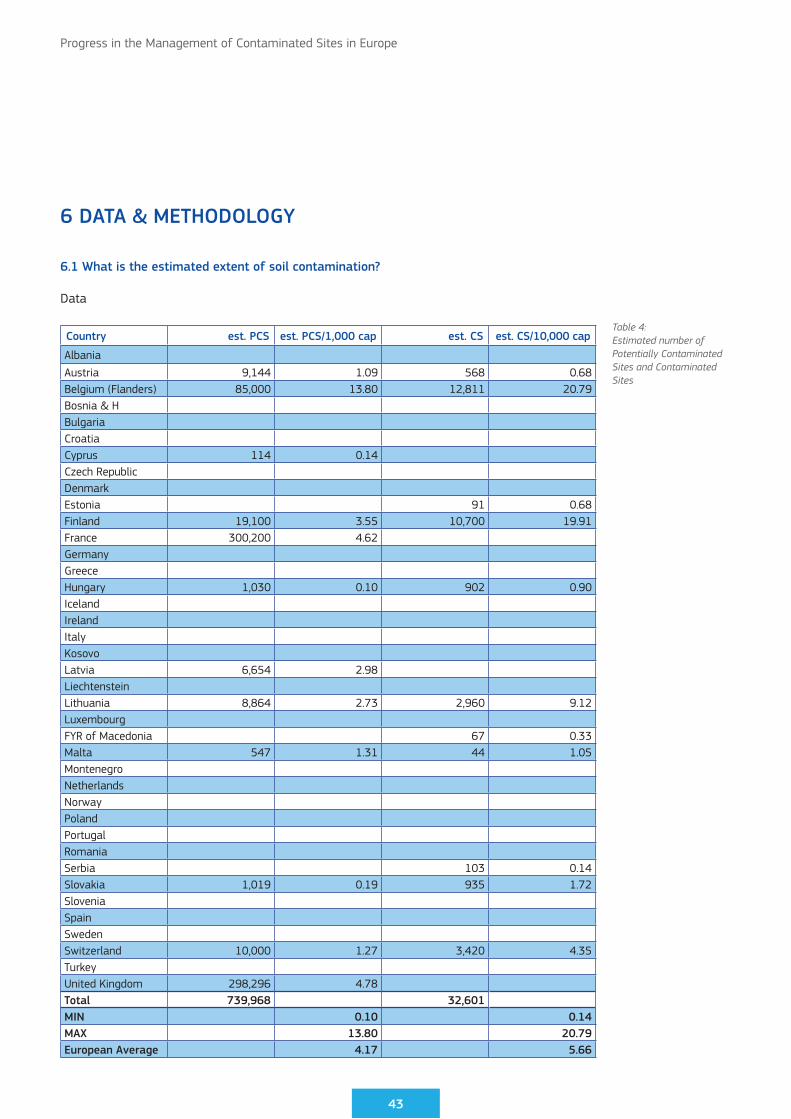
5.1 What is the estimated extent of soil contamination?
The starting point of a policy framework for local soil contamination is a national or region-al estimate of the scale of the problem. Key questions are (1) how many relevant pollut-ing activities (and hence sites with a potential for contamination) exist in the defined region/country, and (2) how many of these sites are in need of remediation. Estimation of the scale of the problem is important to assess the required resources in terms of manpower, finances and time for a defined region. Countries with mature experience in the management of Contaminated Sites are able to estimate the scale of local contamination more accurately and usually revise such estimates on a regular basis.
The following parameters were used for this specific policy question
• estimated number of Potentially Contaminated Sites (per country)
• estimated number of Contaminated Sites (per country)
Both of these parameters were introduced for the first time in the 2011 data request. The scale of local soil contamination was also assessed in previous data requests but results were derived from other parameters (i.e. com-pletion of management steps).
The scale of local soil contamination can be estimated in terms of the estimated number of sites that are potentially contaminated (i.e. sites where there is evidence of polluting activi-ties but where detailed information and assess-ment is lacking) and the estimated total number of Contaminated Sites that are in need of reme-diation. The total number of sites may go down as well as up, within individual countries and in total, as better information becomes avail-able and Potentially Contaminated Sites are found not to be contaminated. The expectation is that more reliable estimates of the extent of soil contamination will become available over time.4
4 The data collection covers 39 countries: the 33 EEA
member countries (including the 28 European Union
Member States together with Iceland, Liechtenstein,
Norway, Switzerland and Turkey) and six EEA cooperating
countries in the West Balkan: Albania, Bosnia and
Herzegovina, the former Yugoslav Republic of Macedonia
(FYROM), Montenegro, Serbia as well as Kosovo under
the UN Security Council Resolution 1244/99. However,
only 27 countries returned the questionnaire.
Key observation
Estimates of the scale of local soil con-tamination are available for about one third of the countries surveyed. Results show clearly that the terms “Potentially Contaminated Site” and “Contaminated Site” are interpreted differently among the European countries.
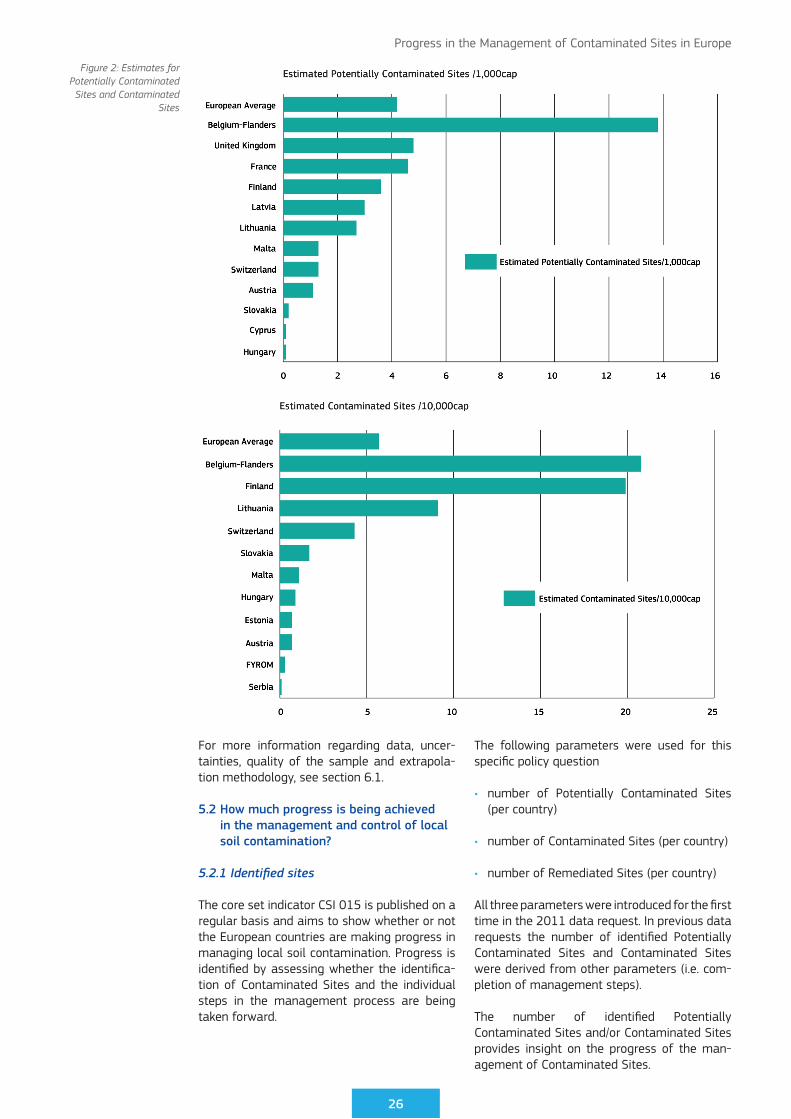
On average about 4.2 Potentially Contaminated Sites are estimated to exist per 1,000 inhabitants and about 5.7 Contaminated Sites per 10,000 inhabitants (Figure 2). A tentative extrapolation to the whole of Europe4 results in an estimated 2.5 million Potentially Contaminated Sites of which about 14 % (340,000 sites) are estimated to be contaminated and in need of remediation measures.
26
Progress in the Management of Contaminated Sites in Europe
For more information regarding data, uncer-tainties, quality of the sample and extrapola-tion methodology, see section 6.1.
5.2 How much progress is being achieved in the management and control of local soil contamination?
5.2.1 Identified sites
The core set indicator CSI 015 is published on a regular basis and aims to show whether or not the European countries are making progress in managing local soil contamination. Progress is identified by assessing whether the identifica-tion of Contaminated Sites and the individual steps in the management process are being taken forward.
The following parameters were used for this specific policy question
• number of Potentially Contaminated Sites (per country)
• number of Contaminated Sites (per country)
• number of Remediated Sites (per country)
All three parameters were introduced for the first time in the 2011 data request. In previous data requests the number of identified Potentially Contaminated Sites and Contaminated Sites were derived from other parameters (i.e. com-pletion of management steps).
The number of identified Potentially Contaminated Sites and/or Contaminated Sites provides insight on the progress of the man-agement of Contaminated Sites.
Figure 2: Estimates for Potentially Contaminated Sites and Contaminated
Sites
27
Progress in the Management of Contaminated Sites in Europe
• Assessment of absolute achievements within the entire process of the current reporting period. The number of identified (Potentially) Contaminated Sites can be compared with the estimated total number of (Potentially) Contaminated Sites. The result reveals, for example, that, in the responding coun-tries, 30 % of the estimated total number of (Potentially) Contaminated Sites have already been identified.
• Achievements/progress compared to the last data observation period. The number of iden-tified (Potentially) Contaminated Sites can be compared with that reported for the last observation period (i.e. in the 2006 EIONET data collection exercise); e.g. the number of identified (Potentially) Contaminated Sites increased by 15 % compared to the previous observation period
For more information regarding data, uncer-tainties, quality of the sample and extrapola-tion methodology, see section 6.2.1. 5.2.2
Figure 3: Identified Potentially Contaminated Sites and Contaminated Sites
Key observation (Figure 3)
In the responding countries, about 1,170,000 Potentially Contaminated Sites have already been identified, which cor-responds to approximately 45 % of the estimated total. The term Potentially Contaminated Site (PCS) is understood dif-ferently in the countries surveyed: while in some countries PCSs are interpreted as meaning those for which potentially pol-luting activities have been mapped – as is the case in Belgium, Luxembourg, the Netherlands and France – in other coun-tries more direct evidence is needed to qualify a site as being potentially contami-nated (e.g. Austria, Hungary, Norway, Italy).
With regard to Contaminated Sites in the reporting countries, about one third of the estimated total of 342,000 sites has already been identified and about 15 % of the estimated total (58,300 sites) remedi-ated. However, very different interpreta-tions of the relevant definitions are applied by individual countries.
28
Progress in the Management of Contaminated Sites in Europe
5.2.2 Progress per management step
Four management steps are distinguished for the management of local contamination, namely: preliminary study/site identification,
preliminary investigation, main site investi-gation, and implementation of risk reduction measures. Progress with each of these steps provides evidence that countries are identify-ing Potentially Contaminated Sites, verifying
Site identification Preliminary Survey
Main Site Investigation
Remediation Measures
Country pro-gress since 2006
target defined
pro-gress since 2006
target defined
pro-gress since 2006
target defined
pro-gress since 2006
target defined
Albania
Austria
Belgium (Flanders)
Bosnia & Herz.
Bulgaria
Croatia
Czech Republic
Cyprus
Denmark
Estonia
Finland
France
FYROM
Germany
Greece
Hungary
Iceland
Ireland
Italy
Kosovo
Latvia
Liechtenstein
Lithuania
Luxembourg
Malta
Montenegro
Netherlands
Norway
Poland
Portugal
Romania
Serbia
Slovakia
Slovenia
Spain
Sweden
Switzerland
Turkey
United Kingdom
Totals 12 17 6 8 16 12 10 13
Tab 3:Progress in the
Management of Contaminated sites
between 2006 and 2011.
29
Progress in the Management of Contaminated Sites in Europe
if these sites are actually contaminated and implementing remediation measures where these are required. The progress can be assessed by:
• monitoring the activities for each manage-ment step and country over time
• measuring the completion of each man-agement step compared to a defined target (provided that such a target is available).
The following parameters were used for this specific policy question
• number of sites with completed site identi-fication (preliminary study)
• estimated number of sites in need of site identification (preliminary study)
• number of sites with completed prelimi-nary investigation
• estimated number of sites in need of a preliminary investigation
• number of sites with completed main site investigation
• estimated number of sites in need of a main site investigation
• number of sites for which remediation measures are completed or in progress
• estimated number of sites for which reme-diation measures are deemed necessary
For each management step, available data were compared either to the results of pre-vious data collection exercises (cf. achieve-ments compared to the last data observation period) or to the estimated total (cf. absolute achievements within the process of the cur-rent reporting period).
Explanation for Table 3:
The table presents the progress achieved in the four management steps (i) prelimi-nary study/site identification, (ii) preliminary investigation, (iii) main site investigation, and (iv) implementation of risk reduction meas-ures for each country.
The column “progress since 2006” refers to a measureable increase in activity since the last data collection exercise in 2006; e.g. 500 main site investigations completed in 2006 and 750 main site investigations completed in 2011.
The column “target defined” refers to the existence of an estimation of the total effort; e.g. 500 main site investigations completed and 2,000 need to be carried out in total.5
5 Austria, Cyprus, Finland, France, FYROM, Lithuania, the
Netherlands, Slovakia, and Switzerland
Key observation (Table 3)
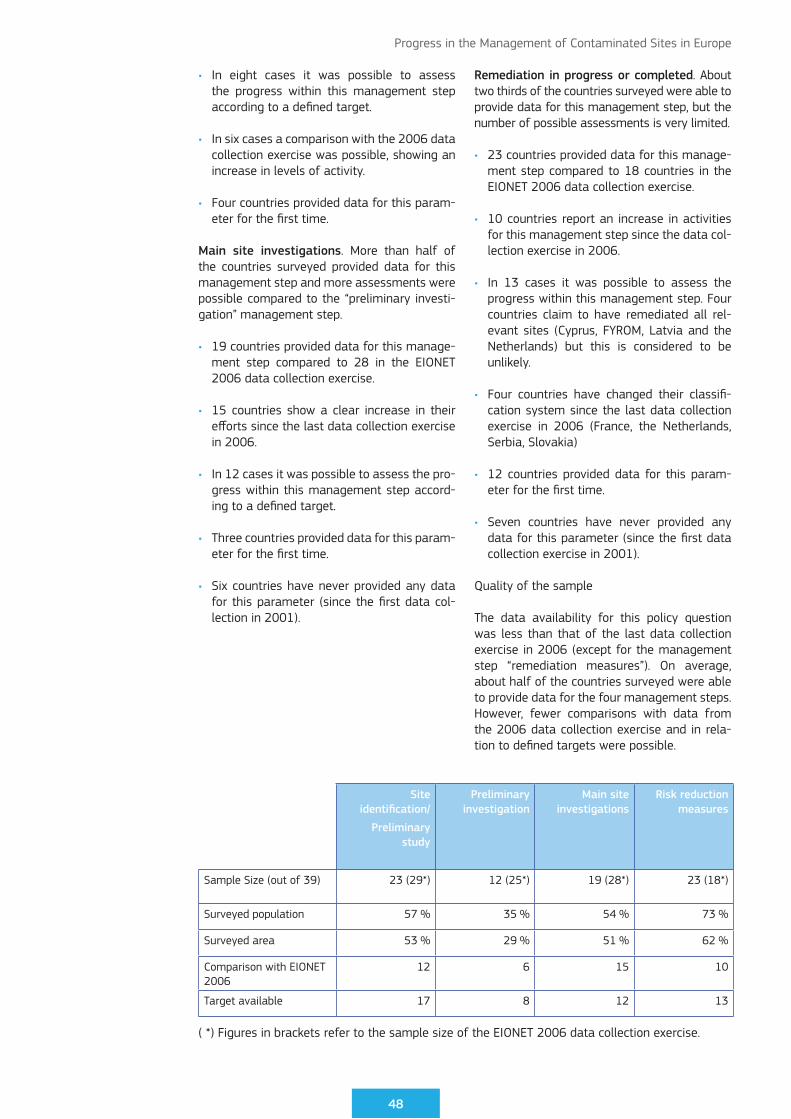
About one third of the countries surveyed provided data to allow an assessment of their progress within the four management steps for local soil contamination (i.e. pre-liminary study/site identification, preliminary investigation, main site investigation and implementation of risk reduction measures).
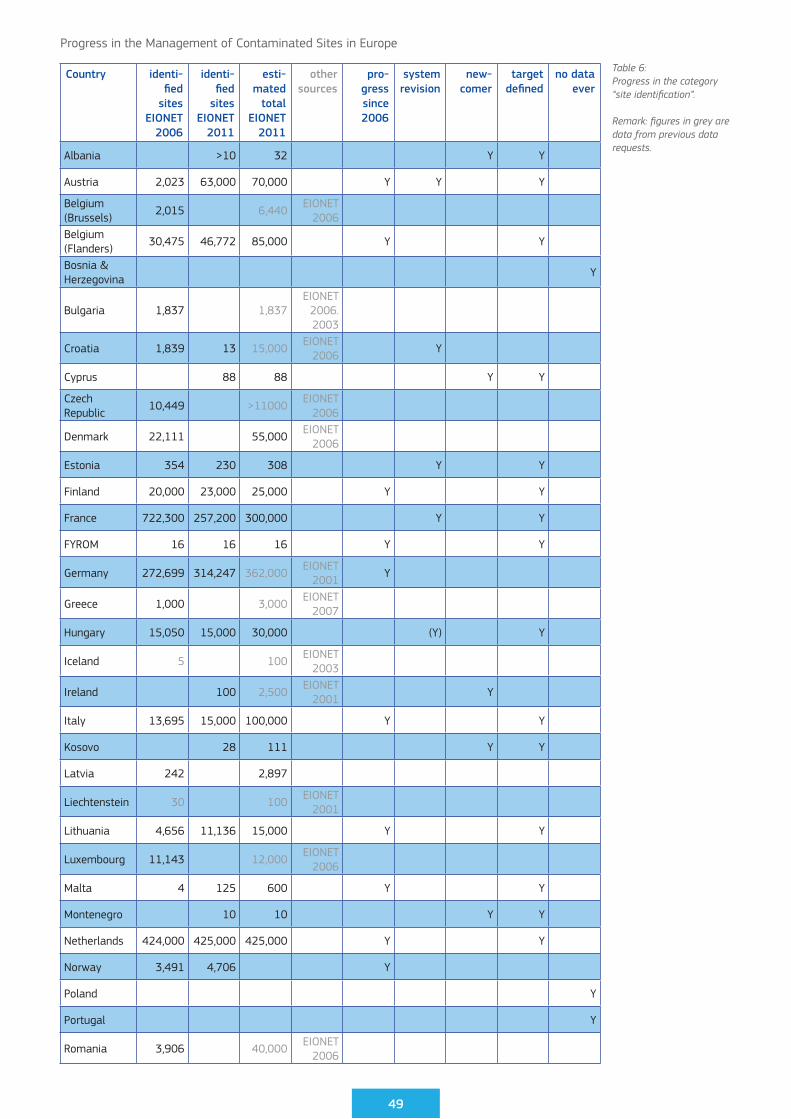
The first management step refers to the mapping of sites where potentially polluting activities have taken place or are still in oper-ation. Results show that 12 countries have made significant progress in the mapping of their polluting activities and Potentially Contaminated Sites. Seventeen countries have defined the estimated total number of sites in need of this investigation step, of which nine5 countries have completed this management step by more than 80 % (see also Table 6 for detailed data).
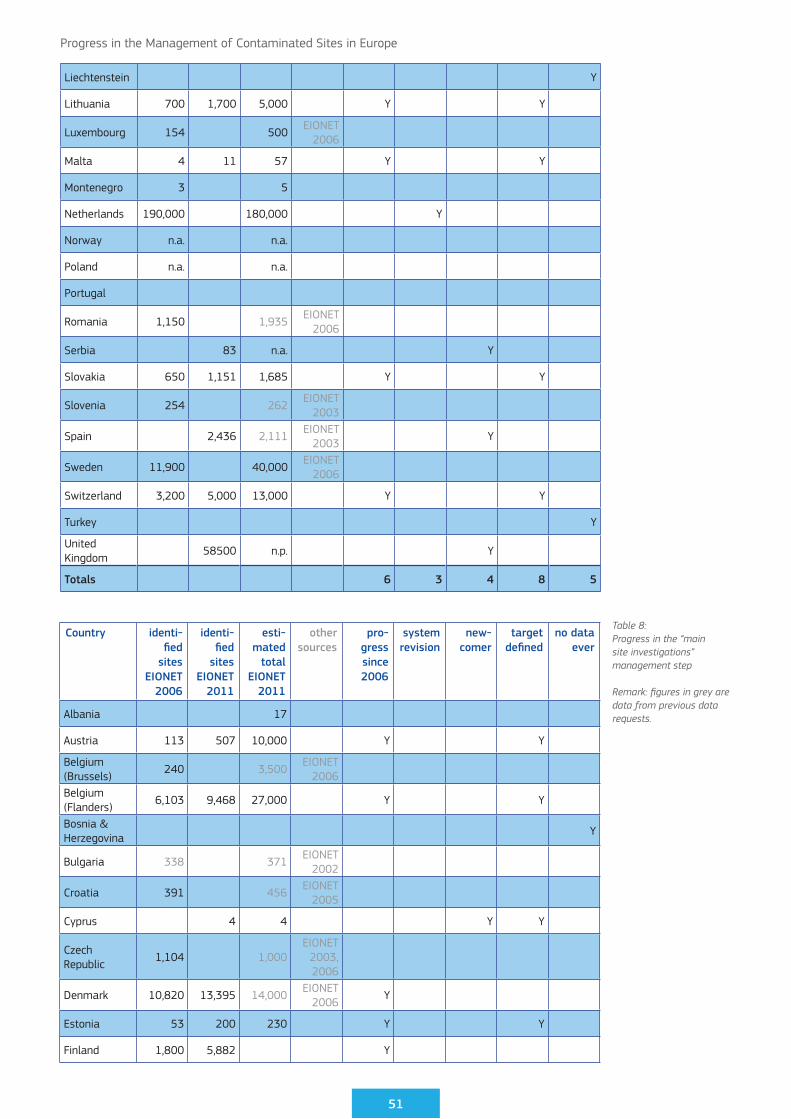
With regard to the “preliminary investiga-tions” management step, far less data are available. Only six countries reported signifi-cant progress in this management step and eight countries are able to measure their pro-gress within this management step in rela-tion to a defined target.
Main site investigations are carried out to clarify whether or not a site needs to be reme-diated and to inform subsequent remediation choices and designs. About half of the sur-veyed countries were able to provide data for this category. However, assessments were not always possible. Results show that 16 coun-tries significantly increased their efforts in car-rying out main site investigations and that 12 countries measure their efforts according to a defined target.
The implementation of remediation meas-ures was reported to have increased in 10 countries (since the last data collection exer-cise) and about one third of the surveyed countries measure their efforts in this cat-egory according to a defined quantitative target.
30
Progress in the Management of Contaminated Sites in Europe
A coloured cell indicates that reported data for this management step and country are suffi-cient to answer either of the two questions:
• “Have efforts for this management step increased since 2006?” (i.e. qualitative assessment)
• “Can the progress within this manage-ment step be quantified?” (quantitative assessment)
For more information regarding data, uncer-tainties, quality of the sample and extrapola-tion methodology, see section 6.2.2.
5.2.3 Inventories
Inventories of polluting activities and Contaminated Sites are indispensable for the monitoring of local soil contamination. However, their nature and level of detail can take many forms e.g. with regard to their geographical coverage. In order to carry out a European data collection exercise, it is impor-tant to identify the type of information most commonly documented in such inventories as a guide to data availability.
The following questions were answered:
• Centralised data inventory at the national level (Yes/No)
• Centralised data inventory at the regional level (Yes/No)
• Centralised data inventory at the local level (Yes/No)
• Mapping of polluting activities (Yes/No)
• Mapping of Potentially Contaminated Sites (Yes/No)
• Mapping of Contaminated Sites (Yes/No)
The answers to the abovementioned ques-tions provide insight to the scale at which inventories are kept, and if the three key cat-egories (i) polluting activities, (ii) Potentially Contaminated Sites, and (iii) Contaminated Sites are included in these inventories.
Figure 4: Countries with central
inventories for Contaminated Sites
31
Progress in the Management of Contaminated Sites in Europe
For more information regarding data, uncer-tainties, quality of the sample and extrapola-tion methodology, see section 6.2.3.
5.2.4 Remediation techniques
Up to the present, the most common remediation technique has been the excavation of contami-nated soil and its disposal as landfill (some-times referred to as ‘dig and dump’). However, increasing regulatory control of landfill opera-tions and associated rising costs, combined with the development of improved ex-situ and in-situ remediation techniques, is altering the pattern of remediation practices.
This specific policy question aims to find out which techniques currently prevail, and if a trend towards innovative techniques can be observed.
Countries were asked to specify the frequency of application as a percentage, for example “in-situ biological treatment = 25 %” means that 25 % of the risk reduction measures implemented in a defined country are in-situ biological treatments. The following techniques were covered (distin-guishing between soil and groundwater treat-ment) for this specific policy question:
• Soil, sediment and sludge: In-Situ Biological Treatment
• Soil, sediment and sludge: In-Situ Physical/Chemical Treatment
• Soil, sediment and sludge: In-Situ Thermal Treatment
• Soil, sediment and sludge: Ex-Situ/Off-site Biological Treatment (assuming Excavation)
• Soil, sediment and sludge: Ex-Situ/Off-site Physical/Chemical Treatment (Assuming Excavation)
• Soil, sediment and sludge: Ex-Situ/Off-site Thermal Treatment (assuming excavation)
Identification of the frequency of application of the abovementioned techniques allows for an assessment of which techniques currently pre-vail. Comparison with results from the previous data collection exercise provides an indication of whether there are trends towards specific innovative techniques.
Key observation (Figure 4)
28 of the 39 countries surveyed reported that they keep comprehensive inventories for Contaminated Sites. 25 countries have cen-tral national data inventories and three coun-tries, namely Sweden, Belgium, Germany and Italy, manage their inventories at the regional level.
Since the last data request in 2006, three countries amended their existing inventories. In Switzerland, a central national inventory is now available in addition to the previously existing regional inventories, while Lithuania and Hungary have complemented their national inventories with regional inventories.
With a few exceptions, all inventories include polluting activities, Potentially Contaminated Sites and Contaminated Sites*.
In Greece, the establishment of a data inven-tory at regional level was in progress in 2006 – but no further information about its status was provided for this data collection.
* Cyprus does not include Contaminated Sites; the FYROM only polluting activities; Spain does not include Potentially Contaminated Sites.
32
Progress in the Management of Contaminated Sites in Europe
Ex-situ physical and/or chemical treatments are reported to be the most common (37 %) tech-niques used in the treatment of contaminated groundwater.
For more information regarding data, uncer-tainties, quality of the sample and extrapola-tion methodology, see section 6.2.4.
5.3 Which sectors contribute most to soil contamination
5.3.1 Main types of local sources of contamination
Local soil contamination can be derived from various activities. This specific policy question aims at finding out which types of sources have contributed most to local soil contamination.
The sources listed below were identified as being relevant for local soil and groundwater contamination. Countries were asked to esti-mate how much each source contributes to local soil contamination in their countries (as a percentage).
• Waste disposal- Municipal waste disposal
- Industrial waste disposal
• Industrial and commercial activities- Mining
- Oil extraction and production
- Power plants
• Military- Military sites
- War affected zones
• Storages- Oil storage
- Obsolete chemicals storage
- Other storages
• Transport spills on land- Oil spills sites
- Other hazardous substance spills sites
• Nuclear- Nuclear operations
• Others- Other sources
Countries were asked to estimate the share of each source accounting for all incidents of local soil contamination as a percentage. The results facilitate the assessment of which are the most dominant sources of local soil contamination.
Figure 5:Dominant remediation
technologies for contaminated soil reported
in 2011
Key observation (Figure 5)
As noted in 2006, “traditional” remediation techniques are most commonly used for the treatment of contaminated soil, in particular the technique of soil excavation and disposal is applied in about 30 % of the relevant sites. In-situ and ex-situ measures are applied with similar frequencies.
33
Progress in the Management of Contaminated Sites in Europe
Figure 6: Key sources of contamination reported in 2011
Key observation (Figure 6)
Waste disposal and treatment, together with industrial and commercial activities, have caused almost two thirds of the local con-tamination that has to be to be dealt with now and in the future.
Nuclear operations contribute only 0.1 % to the reported contamination levels, but there are gaps in the data for this sector, e.g. in France and the United Kingdom.
In general, the distribution of local sources of contamination has not changed since 2006. The data are difficult to compare in detail as the data sample has changed – some coun-tries participating in 2006 did not answer this question in 2011 and vice versa.
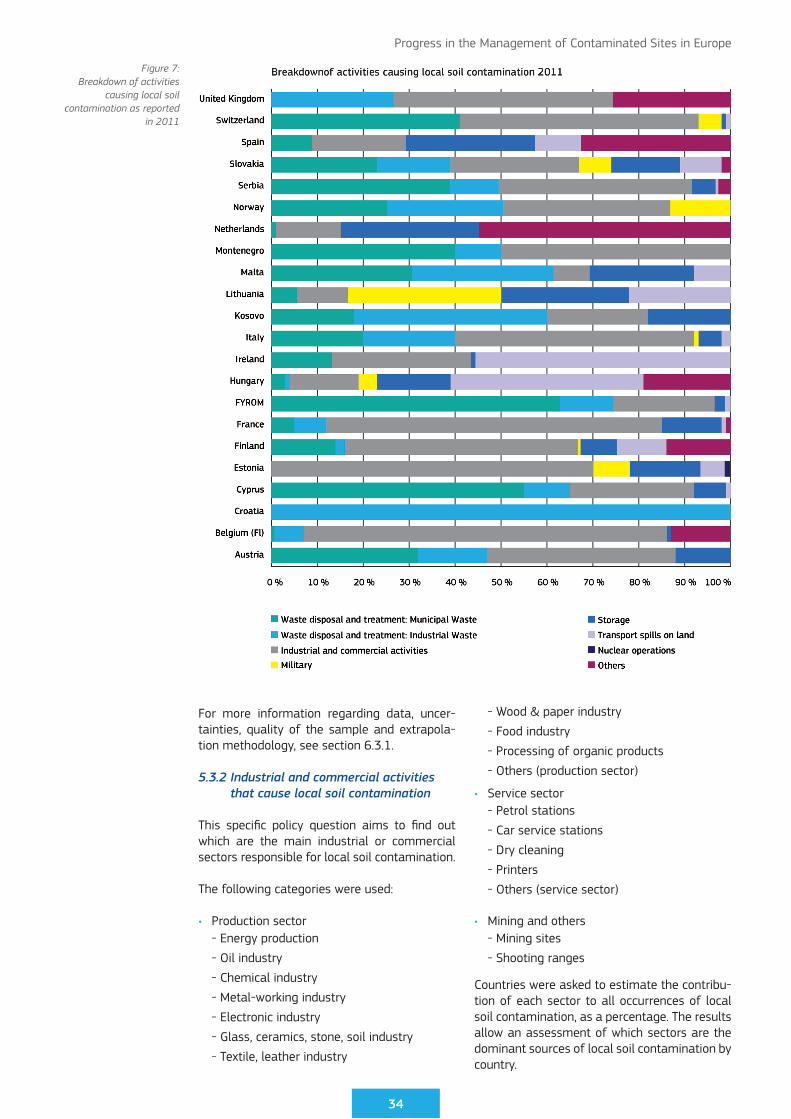
Other observations and details (Figure 7):
• All the soil contamination in Croatia is report-ed to have been caused by waste disposal and treatment. However, this reflects the fact that the response to the questionnaire from Croatia only covered 13 “hot-spots” (which are old landfills / waste disposal sites).
• In Switzerland, 41 % of the soil contamina-tion has been caused by both municipal and industrial waste disposal, where the ratio between “municipal waste disposal” and “industrial waste disposal” is unknown.
• Both for Hungary (39 %) and Ireland (55 %), it is reported that contamination is mainly the result of oil spills from transport operations.
• It is reported that 30 % of the contamina-tion in Lithuania has been caused by military operations, mainly from oil spills and waste disposal on former military sites.
• It is reported that 32 % of the contamination in Belgium (Flanders) has been caused by oil handling and refining within industrial and commercial activities.
34
Progress in the Management of Contaminated Sites in Europe
For more information regarding data, uncer-tainties, quality of the sample and extrapola-tion methodology, see section 6.3.1.
5.3.2 Industrial and commercial activities that cause local soil contamination
This specific policy question aims to find out which are the main industrial or commercial sectors responsible for local soil contamination.
The following categories were used:
• Production sector- Energy production
- Oil industry
- Chemical industry
- Metal-working industry
- Electronic industry
- Glass, ceramics, stone, soil industry
- Textile, leather industry
- Wood & paper industry
- Food industry
- Processing of organic products
- Others (production sector)
• Service sector- Petrol stations
- Car service stations
- Dry cleaning
- Printers
- Others (service sector)
• Mining and others- Mining sites
- Shooting ranges
Countries were asked to estimate the contribu-tion of each sector to all occurrences of local soil contamination, as a percentage. The results allow an assessment of which sectors are the dominant sources of local soil contamination by country.
Figure 7:Breakdown of activities
causing local soil contamination as reported
in 2011
35
Progress in the Management of Contaminated Sites in Europe
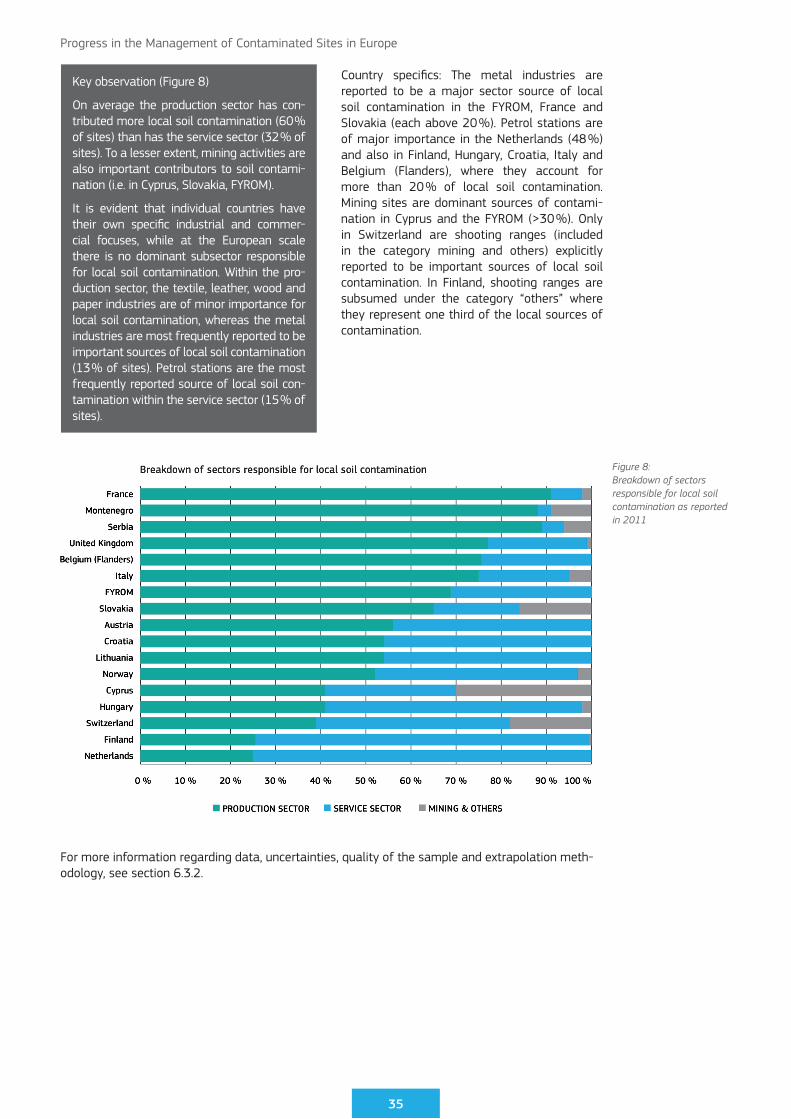
Figure 8:Breakdown of sectors responsible for local soil contamination as reported in 2011
Country specifics: The metal industries are reported to be a major sector source of local soil contamination in the FYROM, France and Slovakia (each above 20 %). Petrol stations are of major importance in the Netherlands (48 %) and also in Finland, Hungary, Croatia, Italy and Belgium (Flanders), where they account for more than 20 % of local soil contamination. Mining sites are dominant sources of contami-nation in Cyprus and the FYROM (>30 %). Only in Switzerland are shooting ranges (included in the category mining and others) explicitly reported to be important sources of local soil contamination. In Finland, shooting ranges are subsumed under the category “others” where they represent one third of the local sources of contamination.
Key observation (Figure 8)
On average the production sector has con-tributed more local soil contamination (60 % of sites) than has the service sector (32 % of sites). To a lesser extent, mining activities are also important contributors to soil contami-nation (i.e. in Cyprus, Slovakia, FYROM).
It is evident that individual countries have their own specific industrial and commer-cial focuses, while at the European scale there is no dominant subsector responsible for local soil contamination. Within the pro-duction sector, the textile, leather, wood and paper industries are of minor importance for local soil contamination, whereas the metal industries are most frequently reported to be important sources of local soil contamination (13 % of sites). Petrol stations are the most frequently reported source of local soil con-tamination within the service sector (15 % of sites).
For more information regarding data, uncertainties, quality of the sample and extrapolation meth-odology, see section 6.3.2.
36
Progress in the Management of Contaminated Sites in Europe
5.4 Which are the main contaminants affecting soil and groundwater in and around contaminated sites?
Different contaminants have different effects on human health and the environment, depend-ing on their properties, for example: their poten-tial for dispersion, their solubility in water or fat, their bioavailability, carcinogenicity, etc. This specific question is of key importance for research and development, the remediation market and related industries; for example, if a specific compound is known to be a major soil contaminant it may be worthwhile to develop new detection methods (e.g. in-situ detection) and more efficient remediation techniques.
The following contaminant categories were used, distinguishing between the solid matrix (soil, sludge and sediments) and the liquid matrix (ground, surface waters, and leachate):
Countries were asked to indicate the share of each contaminant category to all incidents of local soil contamination as a percentage. Distinctions were made between contaminants affecting the solid matrix (soil, sludge, and sedi-ments) and the liquid matrix (ground, surface waters, and leachate). The results allow for an assessment to be made of which are the most dominant contaminants for local soil contamination.
More information regarding data, uncertainties, quality of the sample and extrapolation meth-odology can be found in section 6.4.
Figure 9:Overview of contaminants
affecting soil and groundwater in Europe as
reported in 2011
Key observation (Figure 9)
The distribution of the different contaminants is similar in the liquid and the solid matrix.
The main contaminant categories are mineral oils and heavy metals. Contamination with mineral oil is especially dominant in Belgium (solid matrix: 50 %) and Lithuania (solid matrix: 60 %), while heavy metals are the dominant contaminants in Austria (solid matrix: 60 %) and the FYROM (solid matrix: 89 %).
The data suggests that phenols and cyanides make a negligible contribution to the total contaminant loading.
Compared to the data collection exercise of 2006, the shares of the various pollutants have hardly changed, the only substantial change being a decrease in the contribution of chlorinated hydrocarbons to groundwater contamination.
37
Progress in the Management of Contaminated Sites in Europe
5.5 How much is being spent on cleaning up soil contamination? How much of the public budget is being used?
5.5.1 Annual remediation expenditures
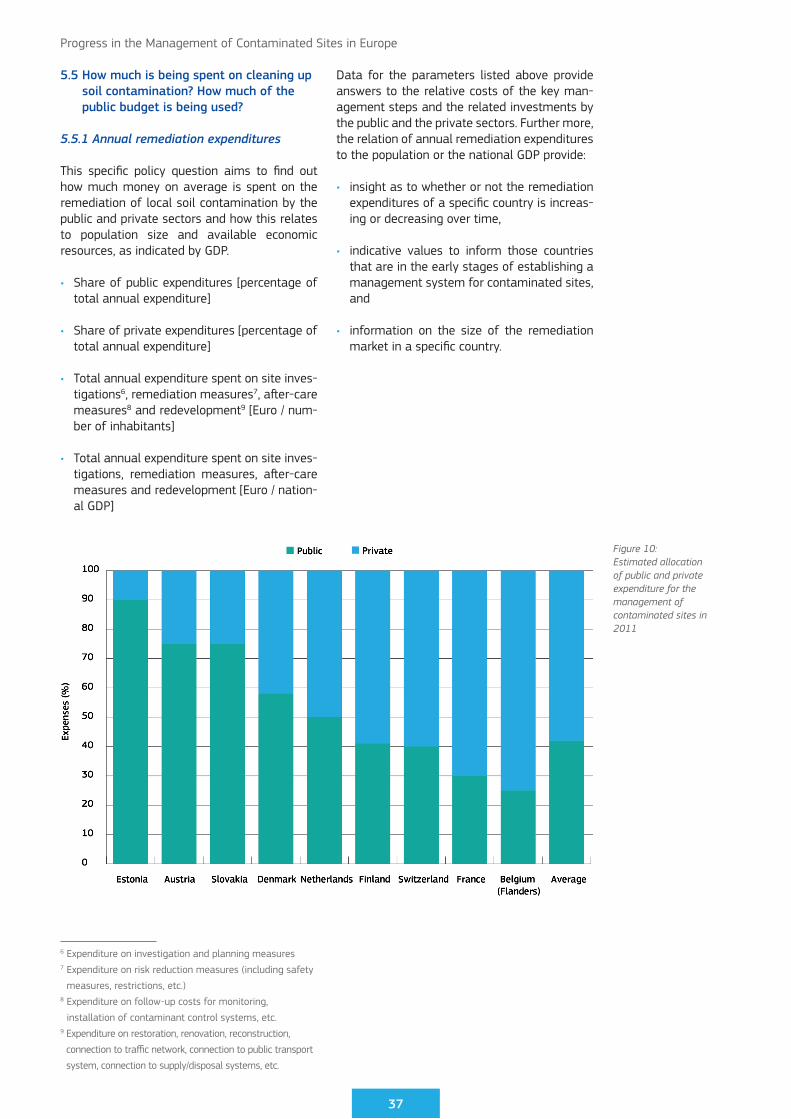
This specific policy question aims to find out how much money on average is spent on the remediation of local soil contamination by the public and private sectors and how this relates to population size and available economic resources, as indicated by GDP.
• Share of public expenditures [percentage of total annual expenditure]
• Share of private expenditures [percentage of total annual expenditure]
• Total annual expenditure spent on site inves-tigations6, remediation measures7, after-care measures8 and redevelopment9 [Euro / num-ber of inhabitants]
• Total annual expenditure spent on site inves-tigations, remediation measures, after-care measures and redevelopment [Euro / nation-al GDP]
6 Expenditure on investigation and planning measures 7 Expenditure on risk reduction measures (including safety
measures, restrictions, etc.) 8 Expenditure on follow-up costs for monitoring,
installation of contaminant control systems, etc. 9 Expenditure on restoration, renovation, reconstruction,
connection to traffic network, connection to public transport
system, connection to supply/disposal systems, etc.
Data for the parameters listed above provide answers to the relative costs of the key man-agement steps and the related investments by the public and the private sectors. Further more, the relation of annual remediation expenditures to the population or the national GDP provide:
• insight as to whether or not the remediation expenditures of a specific country is increas-ing or decreasing over time,
• indicative values to inform those countries that are in the early stages of establishing a management system for contaminated sites, and
• information on the size of the remediation market in a specific country.
Figure 10:Estimated allocation of public and private expenditure for the management of contaminated sites in 2011
38
Progress in the Management of Contaminated Sites in Europe
Figure 11:Annual national
expenditures spent on the management of
contaminated sites per unit of GDP and in Euro per
capita in 2011*Austria: Only expenditures of the national remediation programme are considered.
Key observation (Figures 10 and 11)
In the reporting countries, on average 42 % of total expenditure is derived from public budgets, ranging from 90 % in Estonia down to about 25 % in Belgium (Flanders). In comparison to 2006 the public share of expenditure rose by about 35 %, which can be explained by significant changes in large countries; e.g. the public share in France rose from about 7 % in 2006 to 30 % in 2010.
Annual national expenditure spent on the management of contaminated sites is on average about €10 € per capita, with a range of approximately €2 in Serbia to more than €30 in Estonia. The average expenditure for all countries is €0.4 per million Euros of national GDP. These data indicate a decrease compared to the 2006 average national expenditure on the management of contami-nated sites (€12 per capita; €0.7 per million Euros of national GDP), with wider ranges than in the last data collection exercise.
39
Progress in the Management of Contaminated Sites in Europe
Remarks (Figure 11):
• Belgium (Flanders), Denmark, the Netherlands and Switzerland show a similar high rate of expenditure on remediation measures of approximately €20 per capita per year.
• Finland, France, Hungary and Slovakia are average with approximately €10 per capita.
• The per capita expenditures of Austria and Serbia are rather low compared to other countries.
• The high expenditure rate of Estonia (€30 per capita) still needs to be clarified.
More information regarding data, uncertainties, quality of the sample and extrapolation meth-odology can be found in section 6.5.1.
5.5.2 Investigation and Remediation
This specific policy question aims at finding out how the total money spent on the management of local soil contamination is split across the dif-ferent management steps. In addition, it allows for an assessment of the average distribution of site investigation and remediation “project sizes”.
The following data were used:
Shares of expenditure on investigation and remediation. For this specific policy ques-tion, data from the previous policy question were further analysed. The following data were considered:
• Annual expenditure on site investigations [Euro]
• Annual expenditure on remediation meas-ures [Euro]
• Annual expenditure on after-care measures [Euro]
• Annual expenditure on redevelopment [Euro]
represented as shares in the total annual expenditures [Euro] on site investigations, remediation measures, after-care measures and redevelopment, respectively.
To widen the sample size, data from the previ-ous data request (EIONET 2006) were also used.
Shares of cost categories for investigation and remediation. Countries were asked to pro-vide information on the following:
• Average cost categories for site investiga-tions [share of sites per category]
• Average cost categories for risk reduction measures [share of sites per category]
The answers to these specific policy questions provide:
• information on the average cost distribu-tion between investigation and remediation, which can give an indication of the status of the management of contaminated sites in a specific country, and
• information on the structure of the remedia-tion market in a specific country, as informa-tion about average project sizes are given.
Figure 12:Shares of total expenditure spent on the management of Contaminated Sites for different management steps (combined data 2011 and 2006)
40
Progress in the Management of Contaminated Sites in Europe
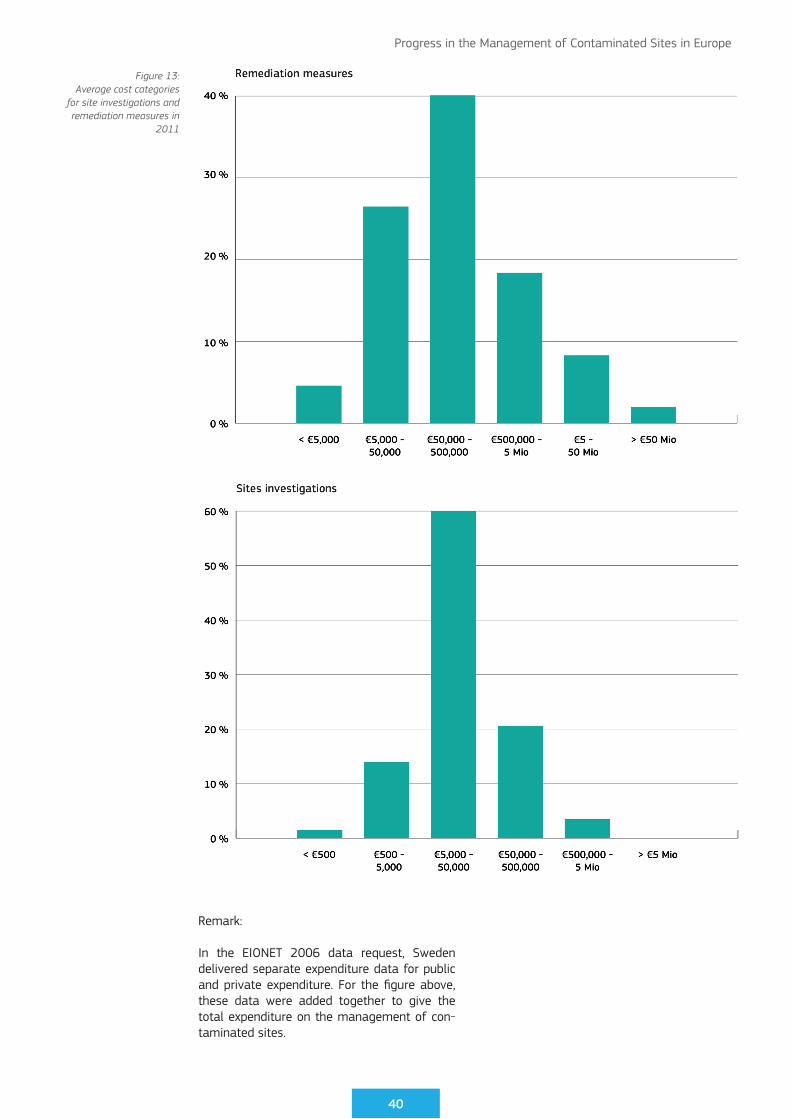
Remark:
In the EIONET 2006 data request, Sweden delivered separate expenditure data for public and private expenditure. For the figure above, these data were added together to give the total expenditure on the management of con-taminated sites.
Figure 13:Average cost categories
for site investigations and remediation measures in
2011
41
Progress in the Management of Contaminated Sites in Europe
Remarks regarding the costs of remediation projects:
In the FYROM, the Netherlands and Slovakia, projects with remediation costs of less than €5,000 represent about 10 % of the total num-ber, but as already noted, this includes, at least for the Netherlands, many “small standard sites”.
In the FYROM, larger, European financed reme-diation projects are being implemented, which explains why 80 % of the current projects cost more than €500,000.
ENI, an Italian multinational oil and gas com-pany, is the owner of many contaminated sites in Italy. Remediation of large industrial sites
belonging to this company leads Italian data to show a relative high percentage (20 %) of pro-jects with costs higher than €50 million.
More information regarding data uncertainties, quality of the sample and extrapolation meth-odology can be found in section 6.5.2.
5.5.3 Funding mechanisms for orphan sites
Orphan sites are contaminated sites where lia-bility cannot be assigned to an identifiable pol-luter. In these cases, the ‘polluter pays’ principle cannot be followed because the original polluter does not exist anymore, is bankrupt or cannot be discovered. Depending on national legisla-tion, liability may fall to the current owner of the land or it may not. There are numerous
Key observation (Figures 12 and 13)
On average, 81 % of the annual national expenditures for the management of contaminated sites is spent on remediation measures, while only 15 % is spent on site investigations. The expenditures for aftercare measures are often not reported separately but included in the expenditures for remediation measures. Exceptions are Austria and Denmark with a share of 7–8 % for aftercare measures, and Sweden with a share of 13 % for redevelopment measures.
Costs for site investigations most frequently fall in the range €5,000 to €50,000 (60 % of reported cases). Investigations that cost more than €5 million have only been reported in Italy and Switzerland. In the Netherlands, 10 % of the site investigations cost less than 500 € per site. These include “small standard sites” handled by certified advisors and contractors without interference of the authorities in the process (report afterwards)
Costs for remediation projects usually range from €50,000 to €500,000 (40 % of the reported cases). Large remediation projects, where the costs exceed €5 million, are reported to have a frequency of 8 %.
Figure 14: Funding mechanisms for orphan sites
42
Progress in the Management of Contaminated Sites in Europe
orphan sites across Europe that pose a threat to human health and the environment. It is clearly important that countries provide either funding mechanisms for orphan sites (e.g. public emer-gency funds) or legal solutions (e.g. shared liability between public funds and developers) to make sure that orphan sites are remediated and can be used safely in the future.
To address this policy question the following question was posed:
• Is there any funding mechanism for the remediation of orphan sites? [Y/N]
The existence of a funding mechanism for orphan sites indicates that a country can pro-vide remediation measures even if a liable party is absent.
More information regarding data, uncertainties, quality of the sample and extrapolation meth-odology can be found in section 6.5.3.
Key observation (Figure 14)
18 European countries have funding mechanisms for “orphan” contaminated sites (sites where no liable party can be identified) at the national level. Belgium and Germany provide this funding at the regional level. In Slovakia this funding mechanism was adopted in 2006.
43
Progress in the Management of Contaminated Sites in Europe
6 DATA & METHODOLOGY
6.1 What is the estimated extent of soil contamination?
Data
Country est. PCS est. PCS/1,000 cap est. CS est. CS/10,000 cap
AlbaniaAustria 9,144 1.09 568 0.68 Belgium (Flanders) 85,000 13.80 12,811 20.79 Bosnia & HBulgariaCroatiaCyprus 114 0.14 Czech RepublicDenmarkEstonia 91 0.68 Finland 19,100 3.55 10,700 19.91 France 300,200 4.62 GermanyGreeceHungary 1,030 0.10 902 0.90 IcelandIrelandItalyKosovo Latvia 6,654 2.98 LiechtensteinLithuania 8,864 2.73 2,960 9.12 LuxembourgFYR of Macedonia 67 0.33 Malta 547 1.31 44 1.05 MontenegroNetherlandsNorwayPolandPortugalRomaniaSerbia 103 0.14 Slovakia 1,019 0.19 935 1.72 SloveniaSpainSwedenSwitzerland 10,000 1.27 3,420 4.35 TurkeyUnited Kingdom 298,296 4.78 Total 739,968 32,601 MIN 0.10 0.14 MAX 13.80 20.79 European Average 4.17 5.66
Table 4: Estimated number of Potentially Contaminated Sites and Contaminated Sites
44
Progress in the Management of Contaminated Sites in Europe
Assessment of obtained data
12 countries provided data for the estimated number of Potentially Contaminated Sites. On average, about 4.2 Potentially Contaminated Sites per 1,000 inhabitants are reported, with a range 0.1 – 13.8 sites per 1,000 inhabit-ants. Belgium (Flanders) indicated very high estimates with on average one site per 100 inhabitants. These large differences among countries’ data reflect the lack of an agreed common definition of the term “Potentially Contaminated Site”.
11 countries provided data for the estimated number of Contaminated Sites. On average about 5.7 Contaminated Sites per 10,000 inhabitants are reported, with a range of 0.1 – 20.8 sites per 10,000 inhabitants.
In general, the results reveal that the term “Potentially Contaminated Site” and “Contaminated Site” are differently understood and interpreted. Whereas some countries focus on large sites of national concern, other coun-tries are more complete in their data collection and include small sites (e.g. leaking under-ground storage tanks).
Extrapolation
Average values derived from the data (e.g. 4.2 Potentially Contaminated Sites per 1,000 inhabitants and 5.7 Contaminated Sites per 10,000 inhabitants) were related to the popula-tion of the whole surveyed area (604.5 million).
The results indicated that there are an estimat-ed 2.5 million Potentially Contaminated Sites and 342,000 Contaminated Sites.
Comparison with 2006 data collection:
The 2011 data collection exercise includes a larger geographical area than did the data request carried out in 2006. The 2006 data collection did not include data from Albania, Bosnia and Herzegovina, Montenegro, Kosovo, Poland, Portugal and Cyprus.
In the 2006 data collection exercise, the scale of the problem was assessed using a different methodology. The estimated num-ber of Potentially Contaminated Sites and Contaminated Sites extrapolations were based on data from the various management steps.
Data availability from the 2011 EIONET data collection for this policy question is relatively low with only about 30 % coverage of the total area and population.
45
Progress in the Management of Contaminated Sites in Europe
6.2 How much progress is being achieved in the management and control of local soil contamination?
6.2.1 Identified sites
Data
Country PCS identified
Source, if not EIONET
2011
CS identified
Source, if not EIONET
2011
Remed. Measures
completed
Source, if not EIONET
2011
Albania n.d. n.d. 2
Austria 2,144 68 108
Belgium (Brussels)
2,015EIONET 2006: prelim. study
240EIONET 2006: main site inv.
184EIONET 2006:
measures compl.
Belgium (Flanders)
46,772 5,016 2,187
Bosnia & Herzegovina
n.d. n.d. n.d.
Bulgaria 1,138EIONET 2003: prelim. study
n.d. 194EIONET 2005:
measures compl.
Croatia 2,264 4 4
Cyprus 84 4 2
Czech Republic
10,449EIONET 2006: prelim. study
1,104EIONET 2006: main site inv.
769EIONET 2006:
measures compl.
Denmark 22,111EIONET 2006: prelim. study
13,395EIONET 2011: main site inv.
10,930EIONET 2006:
measures compl.
Estonia 78 28 184
Finland 17,100 2,200 5,880
France 257,200 969 2,601
FYROM 54 13 0
Germany 314,247EIONET 2011:
prelimin. study
14,209 25,085
Greece 1,000EIONET 2006: prelim. study
8EIONET 2006: main site inv.
230EIONET 2006:
measures compl.
Hungary 200 742 640
Iceland 5EIONET 2003: prelim. study
3EIONET 2003: main site inv.
3EIONET 2003:
measures compl.
Ireland 2,371 30EIONET 2011: main site inv.
n.p.
Italy 15,000EIONET 2011: prelim. study
2,700EIONET 2011: main site inv.
1,780
Kosovo 28EIONET 2011: prelim. study
n.d. 2
Latvia 2,654 243 n.d.
Liechtenstein 30EIONET 2001: prelim. study
n.d. n.d.
Lithuania 5,000 660 40
Luxembourg 11,143EIONET 2006: prelim. study
35EIONET 2006: main site inv.
239EIONET 2006:
measures compl.
Malta 117 5 0
Table 5: Identified number of Potentially Contaminated Sites, Contaminated Sites and remediated Sites
46
Progress in the Management of Contaminated Sites in Europe
Montenegro 10EIONET 2011: prelim. study
5 1
Netherlands 180,000 78,500 (166,500)*
Norway 724 2,162EIONET 2011: main site inv.
1,645
Poland n.a. 8EIONET 2011:
only grave yards
20
Portugal n.d. n.d. n.d.
Romania 3,906EIONET 2006: prelim. study
71EIONET 2006: main site inv.
n.d.
Serbia 296 29 8
Slovakia 909 255 703
Slovenia n.d. 119EIONET 2003: main site inv.
n.d.
Spain 71,202EIONET 2011:
prelimin. study
285EIONET 2011: main site inv.
235EIONET 2006:
measures compl.
Sweden 11,000EIONET 2006: prelim. study
2,700EIONET 2006: main site inv.
1,700EIONET 2006:
measures compl.
Switzerland 10,000 1,020 500
Turkey n.d. n.d. n.d.
United Kingdom
178,398 645 2,460
SUM 1,169,649 127,475 58,336
* The number of sites with “measures com-pleted” reported by the Netherlands amounts to 166,500 sites and includes sites where investigations have been executed for which no remediation measures were necessary, and also sites where, due to a very low probability of contamination, no investigations have been made; this number represents all sites handled in the inventory between 2004 and 2009; in detail (i) 8,200 remediated sites (ii) 28,300 sites which were not investigated further (because they were not considered to pose a risk in the current situation), and (iii) 130,000 sites where no further measures were implemented.
Assessment of obtained data
Two new parameters were introduced for the EIONET 2011 data collection, namely Potentially Contaminated Sites and Contaminated Sites. Previous data collections were limited to the four management steps (i.e. preliminary study, preliminary investigation, main site investi-gation and implementation of risk reduction measures).
Data on “Measures Completed” were consid-ered for Remediated Sites.
Although the response rates were considered to be sufficient, the quality of data obtained is variable. It is clear that the terms for the
categories Potentially Contaminated Sites and Contaminated Sites and also the four manage-ment steps are understood and interpreted dif-ferently between countries.
For example, Austria and Denmark are coun-tries of similar size and industrialisation. Both countries have management systems for local soil contamination that were already estab-lished in the 1980’s, however Denmark reports almost 10,930 remediated sites but Austria only 108 of such sites.
Some countries have revised their classifica-tion system since the last data collection in 2006. For example, the Netherlands has made an extensive review of site classification and of the number of sites previously identified as being potentially contaminated and included in previous indicator CSI 015 data collections. After random sampling and investigation of some of these sites (28,300), it has been found that only a small percentage of them presented adequate evidence to justify systematic investigation. However, all of these sites are still included in the data presented in this report to maintain consistency of data with previous reporting.
Comparison with 2006 data collection
The 2011 data collection exercise includes a larger geographical area than that of 2006.
47
Progress in the Management of Contaminated Sites in Europe
The 2006 data collection exercise did not include data from Albania, Bosnia and Herzegovina, Montenegro, Kosovo, Poland, Portugal and Cyprus.
In the 2006 data collection exercise, the num-ber of identified sites (PCS, CS, RS) was derived from the various management steps, whereas the 2011 data collection exercise introduced new parameters of PCS, CS and RS to allow for more precise estimations.
Data gaps
Data gaps in the 2006 inventory were filled with data from the management steps, i.e.
• PCS = number of completed preliminary investigations (eventually site identifications)
• CS = number of completed main site investigations
• RS = number of measures completed
If data from the 2011 EIONET data collection exercise were not available, data from previous data collections were used.
Quality of the sample
Data availability for this policy question is con-sidered to be sufficient with about 50 % of the data being available from the 2011 EIONET data collection exercise (prior to any use of data from previous collections in order to fill gaps)
• 19 countries provided data on the identified number of Potentially Contaminated Sites. In 10 cases, data from previous data collec-tions were used (i.e. completed preliminary investigations or site identifications).
• 19 countries provided data on the identified number of Contaminated Sites. In seven cas-es, data from previous data collection exer-cises were used (i.e. completion of main site investigations).
• 22 countries provided data on the number of completed remediation measures. In nine cases, data from previous data collection exercises were used.
Potentially Cont. Sites
Contaminated Sites
Remediation Measures
Sample Size (out of 39) 19 19 22
Surveyed population 37 % 49 % 64 %
Surveyed area 39 % 38 % 53 %
6.2.2 Progress per management step
Assessment of obtained data.
Site identification/preliminary studies. Data availability is generally good and covers the majority of the survey area. However, assess-ments are limited with regard to progress since the 2006 data collection exercise or completion of this management step in relation to targets.
• 23 countries provided data for this param-eter in the 2011 data collection (29 in the EIONET 2006 data collection exercise)
• 17 countries provided data on their progress within this management step (six countries more than the 2006 data collection exer-cise), namely information on the number of identified sites versus the estimated total number of sites. Of these countries, nine that have almost completed this management step (completion >80 %).
• 12 countries increased their activities related to this management step since the last data collection in 2006.
• five countries have revised their classifica-tion of “site identification”. In these cases a comparison with data from 2006 is either not possible or meaningless.
• five countries provided data for this param-eter for the first time.
• four countries have never provided any data for this parameter (since the first data collec-tion in 2001).
Preliminary investigations. Only 12 countries provided data for this parameter. Even less data was provided on the number of further assessments.
• 12 countries provided data for this manage-ment step compared to 25 countries in the last data collection exercise in 2006.
48
Progress in the Management of Contaminated Sites in Europe
• In eight cases it was possible to assess the progress within this management step according to a defined target.
• In six cases a comparison with the 2006 data collection exercise was possible, showing an increase in levels of activity.
• Four countries provided data for this param-eter for the first time.
Main site investigations. More than half of the countries surveyed provided data for this management step and more assessments were possible compared to the “preliminary investi-gation” management step.
• 19 countries provided data for this manage-ment step compared to 28 in the EIONET 2006 data collection exercise.
• 15 countries show a clear increase in their efforts since the last data collection exercise in 2006.
• In 12 cases it was possible to assess the pro-gress within this management step accord-ing to a defined target.
• Three countries provided data for this param-eter for the first time.
• Six countries have never provided any data for this parameter (since the first data col-lection in 2001).
Remediation in progress or completed. About two thirds of the countries surveyed were able to provide data for this management step, but the number of possible assessments is very limited.
• 23 countries provided data for this manage-ment step compared to 18 countries in the EIONET 2006 data collection exercise.
• 10 countries report an increase in activities for this management step since the data col-lection exercise in 2006.
• In 13 cases it was possible to assess the progress within this management step. Four countries claim to have remediated all rel-evant sites (Cyprus, FYROM, Latvia and the Netherlands) but this is considered to be unlikely.
• Four countries have changed their classifi-cation system since the last data collection exercise in 2006 (France, the Netherlands, Serbia, Slovakia)
• 12 countries provided data for this param-eter for the first time.
• Seven countries have never provided any data for this parameter (since the first data collection exercise in 2001).
Quality of the sample
The data availability for this policy question was less than that of the last data collection exercise in 2006 (except for the management step “remediation measures”). On average, about half of the countries surveyed were able to provide data for the four management steps. However, fewer comparisons with data from the 2006 data collection exercise and in rela-tion to defined targets were possible.
Table 13: Contaminants affecting soil and groundwater
60
Progress in the Management of Contaminated Sites in Europe
• Remark: Switzerland only offered data about contaminants affecting both the solid and liquid matrices. Finland, Norway and the United Kingdom only provided data for the solid matrix.
• n.d. - no data available
Quality and completeness of the sample
Contaminants affecting solid matrix: 16 out of 39 countries provided data. The response corre-sponds to 40 % of the population or 43 % of the surface area of the surveyed countries.
Contaminants affecting the liquid matrix: 12 out of 39 countries provided data. The response cor-responds to 31 % of the population or 23 % of the surface area of the surveyed countries.
Countries corresponding to
capita surface area [km²]
area under survey 39 612,117,243 5,847,513
responses 16 247,772,795 2,513,975
Share 41 % 40 % 43 %
Countries corresponding to
capita surface area [km²]
area under survey 39 612,117,243 5,847,513
responses 12 190,706,091 1,331,965
Share 31 % 31 % 23 %
61
Progress in the Management of Contaminated Sites in Europe
6.5 How much is being spent on cleaning-up soil contamination? How much of the public budget is being used?
6.5.1 Annual remediation expenditures
Data
* weighted average amount (weighted according to the specific annual expenditure)
Breakdown (%) Annual management
expenditures
(Mio. €)
Reference
YearPublic Private
Country
Estonia 90 % 10 % 42.5 2011
Austria 75 % 25 % 32.6 2011
Slovakia 75 % 25 % 49.5 2006
Denmark 58 % 42 % 118.7 2009
Netherlands 50 % 50 % 324.0 2009
Finland 41 % 59 % 60.0 2011
Switzerland 40 % 60 % 131.0 2011
France 30 % 70 % 470.0 2010
Belgium-Fl. 25 % 75 % 159.6 2011
Average* 42 % 58 % 1,387.94
Table 14: Estimated allocation of public and private expenditure for management of contaminated sites
Table 15: Annual expenditure for management of contaminated sites
Country Reference year
Annual manage-
ment expendi-
ture (€ Mio.)
Capita Annual expendi-ture per
capita (€)
GDP per capita
GDP Expendi-ture
(‰ of GDP)
Austria 2011 32.6 8,404,252 3.9 30,800 2.589E+11 0.13
Progress in the Management of Contaminated Sites in Europe
Quality and completeness of the sample
Public and private expenditure for management of contaminated sites. Nine out of 39 countries provided data. The response corresponds to 20 % of the population or 21 % of the surface area of the surveyed countries.
Annual national expenditure for the management of contaminated sites per unit of GDP and per capita. 11 out of 39 countries provided data. The response corresponds to 23 % of the popula-tion or 24 % of the surface area of the surveyed countries.
6.5.2 Investigation and Remediation
Data
Countries corresponding to
capita surface area [km²]
area under survey 39 612,117,243 5,847,513
responses 9 121,851,568 1,207,488
share 23 % 20 % 21 %
Countries corresponding to
capita surface area [km²]
area under survey 39 612,117,243 5,847,513
responses 11 139,113,485 1,377,990
share 28 % 23 % 24 %
Shares in total expenditures ( %)
Site Investigation Remediaton
Measures
After-Care Measures
Re-developmentCountry
Austria 16 % 77 % 7 % 0 %
Belgium (Flanders) 16 % 84 % 0 % 0 %
Czech Republic (EIONET 2006)
3 % 94 % 1 % 1 %
Denmark (EIONET 2006)
23 % 69 % 8 % 0 %
Estonia 5 % 94 % 1 % 0 %
France 33 % 67 % 0 % 0 %
Hungary 3 % 94 % 2 % 1 %
Norway (EIONET 2006)
7 % 93 % 0 % 0 %
Sweden (EIONET 2006)
20 % 66 % 1 % 13 %
Switzerland 25 % 69 % 3 % 3 %
Average 15 % 81 % 2 % 2 %
min. 3 % 66 % 0 % 0 %
max. 33 % 94 % 8 % 13 %
Table 16: Shares of total
annual expenditure for management of
contaminated sites for the different management
steps
63
Progress in the Management of Contaminated Sites in Europe
Average cost categories for site investigation ( % of sites per category)
Table 17: Shares of cost categories for site investigation
Table 18: Shares of cost categories for remediation measures
64
Progress in the Management of Contaminated Sites in Europe
Quality and completeness of the sample
Share of expenditure on investigation and remediation. In EIONET 2011,six out of 39 countries provided analysable data. The response corresponds to 16 % of the population or 14 % of the sur-face area of the surveyed countries.
Share of cost categories for investigation. 10 out of 39 countries provided analysable data. The response corresponds to 19 % of the population or 17 % of the surface area of the surveyed countries.
Share of cost categories for remediation. 11 out of 39 countries provided analysable data. The response corresponds to 21 % of the population or 23 % of the surface area of the surveyed countries.
Countries corresponding to
capita surface area [km²]
area under survey 39 612,117,243 5,847,504
responses 6 98,810,314 828,424
share 15 % 16 % 14 %
Countries corresponding to
capita surface area [km²]
area under survey 39 612,117,243 5,847,504
responses 10 117,913,602 1,018,610
share 26 % 19 % 17 %
Countries corresponding to
capita surface area [km²]
area under survey 39 612,117,243 5,847,504
responses 11 128,832,281 1,356,744
share 28 % 21 % 23 %
65
Progress in the Management of Contaminated Sites in Europe
6.5.3 Funding mechanisms for orphan sites
Data
Table 19: Overview: availability of funding mechanisms for orphan sites
* only for several regions
Country Funding mechanism Source
Albania
Austria Y EIONET 2006
Belgium-Fl. Y EIONET 2011
Bosnia & H.
Bulgaria
Croatia Y EIONET 2011
Cyprus Y EIONET 2011
Czech Republic Y EIONET 2006
Denmark Y EIONET 2006
Estonia Y EIONET 2006
Finland Y EIONET 2006
France Y EIONET 2011
Germany
Greece
Hungary Y EIONET 2011
Iceland
Ireland Y EIONET 2011
Italy* Y EIONET 2011
Kosovo
Latvia
Liechtenstein
Lithuania
Luxembourg
FYROM
Malta
Montenegro
Netherlands Y EIONET 2011
Norway Y EIONET 2006
Poland
Portugal
Romania
Serbia
Slovakia Y EIONET 2011
Slovenia
Spain
Sweden Y EIONET 2006
Switzerland Y EIONET 2011
Turkey
United Kingdom Y EIONET 2011
Total (Y) 12
66
Progress in the Management of Contaminated Sites in Europe
Quality and completeness of the sample
18 out of 39 countries provided data. The response corresponds to 47 % of the population or 49 % of the surface area of the surveyed countries.
Countries corresponding to
capita surface area [km²]
area under survey 39 612,117,243 5,847,504
responses 18 288,093,582 2,837,287
share 46 % 47 % 49 %
67
Progress in the Management of Contaminated Sites in Europe
7 REFERENCES
European Environment Agency (1998): Europe’s Environment: The Second Assessment, ISBN 92-828-3351-8, Aarhus – Denmark.
European Environment Agency (1999): Environmental indicators: Typology and overview, authors: Edith Smeets and Rob Weterings, Technical report No 25/1999
As the Commission’s in-house science service, the Joint Research Centre’s mission is to provide EU poli-cies with independent, evidence-based scientific and technical support throughout the whole policy cycle.
Working in close cooperation with policy Directorates-General, the JRC addresses key societal challenges while stimulating innovation through developing new methods, tools and standards, and sharing its know-how with the Member States, the scientific community and international partners.