28
Progress on investigation of dynamic vacuum (RF structures only) Sergio Calatroni With Cedric Garion, Chiara Pasquino, Pedro Costa Pinto, Mauro Taborelli
| Date post: | 18-Dec-2015 |
| Category: |
Documents |
| Upload: | cecilia-harrington |
| View: | 218 times |
| Download: | 0 times |

Progress on investigation of dynamic vacuum(RF structures only)
Sergio CalatroniWith Cedric Garion, Chiara Pasquino, Pedro Costa Pinto, Mauro Taborelli

Outline
• Requirements from beam dynamics• Static vacuum• Dynamic vacuum
– Breakdowns– Dark current
• Experimental approach– ESD measurements– Direct measurement
• Outlook and conclusions
IWLC 2010 Sergio Calatroni - 21.10.2010

Requirements from beam dynamics
• The dynamic vacuum threshold for preventing fast ion beam instability (essentially do to direct field ionization and not the usual impact ionization) is:
H2 and CO2 partial pressures < 10-9 Torr
• This happens for practically all the main LINAC length, inside the RF accelerating structures
• For details see G. Rumolo, J-B Jeanneret, D. Schulte and C. Garion (this workshop)
IWLC 2010 Sergio Calatroni - 21.10.2010

Tools for dynamic vacuum calculations
• Several tools have been developed for the calculation of dynamic vacuum:
– Thermal analogy implemented in FEM by Cedric Garion– Monte-Carlo simulations implemented in CASTEM (FEM
code) by Cedric Garion (CLIC09 Workshop)– Electrical analogy implemented in PSpice, with conductance
of single elements calculated by Monte-Carlo by Pedro Costa Pinto (TS Workshop 08)
– Analytical models by Volker Ziemann (Uppsala University)
• All tools have been crosschecked and agree within 10%
IWLC 2010 Sergio Calatroni - 21.10.2010

CATIA Model
Calculations are based on the equivalence of vacuum and thermal conductances, which are evaluated by FE analysis, and using the following outgassing values (H2O):
10-10 mbar.l.sec-1cm-2 for 100h pumping
10-11 mbar.l.sec-1cm-2 for 1000h pumping
Does not take into account re-adsorpion
Static vacuum – thermal analogy
IWLC 2010 Sergio Calatroni - 21.10.2010
J INRAlexandre.Samochkine @ cern.ch
33
CLIC MODULES
High Order Mode damping
TOWARDS TO FINAL DESIGN
3D CATIA Model
From: A. Samoshkin
FE code model
Pumping surfaces

One word on FE analysis based on thermal/vacuum analogy (1D model)
Static vacuum
Tkqt
Tcp
2
2
x
Pca
t
PS
Heat transfer equation:
Gas flow equation (1D):
Static vacuum - Results
IWLC 2010 Sergio Calatroni - 21.10.2010
8x10⁻⁹ ÷ 1x10⁻⁸ mbar
Based on outgassing (H2O): 10-10 mbar.l.sec-1cm-2 for 100h pumping

2.1012 H2 or CO molecules released during breakdown (in a baked system)
Data measured in DC “spark test” reported in PRST-AB12, 092001 (2009)
Dynamic vacuum I - Breakdown
IWLC 2010 Sergio Calatroni - 21.10.2010
FE code model
Pumping surfaces

Calculated with thermal analogy model (and Monte-Carlo model)
Four manifolds
Longitudinal pressure distribution in the cells:
Uniform after ~3 ms
Calculated with Monte-Carlo and thermal analogy model
Maximum pressure vs time:
20 ms to reach 10-9 mbar for H2
20 ms to reach 5x10⁻⁸ mbar for CO
(Note: CLIC repetition rate = 50 Hz
Duty cycle = 20 msec)
Dynamic vacuum I – Results
1.00E-06 1.00E-05 1.00E-04 1.00E-03 1.00E-02 1.00E-011E-10
1E-09
1E-08
1E-07
1E-06
1E-05
1E-04
1E-03
1E-02H2
Thermal 1 Manifold Thermal 4 Manifolds
Time [s]
Pre
ssu
re [m
ba
r]
IWLC 2010 Sergio Calatroni - 21.10.2010
Monte-Carlo

H2 CO
10-3
10-2
10-1
100
101
100 101 102 103 104 105
500 l/s1000 l/s2000 l/s
time[
s]
n x Qspark
10-3
10-2
10-1
100
101
100 101 102 103 104 105
500 l/s1000 l/s2000 l/s
time[
s]
n x Qspark
Dynamic vacuum I – Effect of a manifold• Calculated recovery time to 10-8 mbar with PSpice for a quadrant type structure in a
CTF2 type tank (old data)• For one sparks outgassing Qspark, or multiples of it equal to n x Qspark
• Two regions: first is determined by the filling time of the cavity + tank volume• Second is determined by the applied pumping speed
IWLC 2010 Sergio Calatroni - 21.10.2010

Dynamic vacuum II – Dark currents• Dynamic vacuum due to field emission: the problem
– Electrons are field-emitted from high field regions in absence of a breakdown (dark current).
– They hit the cavity wall releasing gas by Electron Stimulated Desorption (ESD)
– Outgassed molecules are emitted with eV speeds, but after first collision they are thermalized and then travel <1 mm during the 200 ns RF pulse, thus cannot escape from RF structure.
– Timescale of the order of the RF pulse duration: outgassing at the beginning of the pulse may affect bunches within the same train.
– Very difficult to measure: we may have p>10-9 mbar locally during the 200 ns RF pulse (in all structures) in a small volume. When this is diluted and pumped through the conductance of the RF structure, it may not be measureble
IWLC 2010 Sergio Calatroni - 21.10.2010

Dynamic vacuum II – (over-)simplified model
• Only one cell is modelled• Electrons are field-emitted, then accelerated and distributed
uniformly in the cell• Dynamic vacuum by ESD: desorbed molecules fill the whole cell
volume• No pumping
IWLC 2010 Sergio Calatroni - 21.10.2010
e- on faraday cup
e- are uniformly distributed inside the cell
e- on faraday cup
Cell [mm] dimensions outer area beam area copper area cell volume [mm3] beam channel [mm3]
Ext diam 20 1086.99 28.27 1030.44 2293.36 206.40
Iris diam 6 cell volume [liters] beam channel [liters]
Length 7.3 2.29E-03 2.06E-04

Faraday cup measurements - T18_VG24_Disk_2 - KEK
IWLC 2010 Sergio Calatroni - 21.10.2010
40 50 60 70 80 90 100 110 1200.01
0.1
1
10
100
f(x) = 2.23364820812998E-17 x^9.03596372712817
f(x) = 1.31429070987924E-18 x^9.34977881350076
FC-UP [microA]Power (FC-UP [microA])FC-DN [microA]Power (FC-DN [microA])
Eacc [MV/m]
Fara
dy cu
ps cu
urre
nt [µ
A]
Pulse 173 ns
From: T. Higo

ESD data• No much data on unbaked copper(N. Hilleret, CAS Vacuum School 2006 - G. Vorlaufer CERN-Thesis (2002) )
IWLC 2010 Sergio Calatroni - 21.10.2010

Data
IWLC 2010 Sergio Calatroni - 21.10.2010
Total e- current [A] Pulse duration [ns] Total charge [C] Number of electronsSolid angle (one cell, one side)
Total electrons on copper Dose per pulse (e- /cm2)
1.00E-04 200 2.00E-11 1.25E+08 0.027439024 4.56E+09 4.42E+08
ESD coefficient for H2 (unbaked copper)
Total H2 molecules per RF pulse
Equivalent pressure at RT (total volume)
2.00E-01 9.11E+08 1.12E-08
ESD coefficient for CO2 (unbaked copper)
Total CO2 molecules per RF pulse
6.00E-02 2.73E+08 3.37E-09
ESD coefficient for H2 (copper baked 250 C)
Total H2 molecules per RF pulse
1.30E-02 5.92E+07 7.29E-10
ESD coefficient for CO2 (copper baked 250 C)
Total CO2 molecules per RF pulse
6.00E-03 2.73E+07 3.37E-10
ESD coefficient for H2 (copper baked 300 C)
Total H2 molecules per RF pulse
3.00E-03 1.37E+07 1.68E-10
ESD coefficient for CO2 (copper baked 300 C)
Total CO2 molecules per RF pulse
1.60E-03 7.29E+06 8.98E-11
107 pulses to start conditioning(~2 days at 50 Hz)109 pulses for 10 ESD reduction(200 days at 50 Hz)
10 times maximum allowed
3 times maximum allowed
For the dynamic vacuum of breakdowns we were considering 2x10¹² molecules.
G. Vorlaufer CERN-Thesis (2002)
Benvenuti et al LEP2 94-21
MathewsonJVSTA 15 (1997) 3093

Dynamic vacuum I – Results
IWLC 2010 Sergio Calatroni - 21.10.2010
Pressure goes to < 10-9 mbar in less than 1 msec !This is faster than the sampling time of common vacuum gauges...
Same plot as for dynamic vacuum due to breakdowns (2x10¹² molecules released)
Extrapolating to 1000 less molecules released due to ESD
1.00E-06 1.00E-05 1.00E-04 1.00E-03 1.00E-02 1.00E-011E-10
1E-09
1E-08
1E-07
1E-06
1E-05
1E-04
1E-03
1E-02H2
Thermal 1 Manifold Thermal 4 Manifolds
Time [s]
Pre
ssu
re [m
ba
r]

Experimental programme
• Get more precise data on ESD: higher electron energies, effect of surface treatments and of fabrication procedure
• Obtain e- trajectories maps for reasonable assumptions of distributions of field-emitters, and calibrate the intensities with known Farady-cup dark current measurements.
• Couple the above data as input for Monte-Carlo simulations of trajectories and densities of outgassed molecules
IWLC 2010 Sergio Calatroni - 21.10.2010

ESD measurement system
IWLC 2010 Sergio Calatroni - 21.10.2010
Sample Holder plate
Bias Filament
Cu Sample1
2
B-A gaugeRGA
Bias Sample
Electrometer
Butterfly valve
Pumping group
Conductance
Gas Injection Line
Filament
Filament Power Supply
Transport rod
Full Range Gauge

ESD system pictures
IWLC 2010 Sergio Calatroni - 21.10.2010

First results (dummy Cu specimen)
IWLC 2010 Sergio Calatroni - 21.10.2010
The system is operational (Diploma thesis of Chiara Pasquino)
1.00E+14 1.00E+15 1.00E+161.00E-05
1.00E-04
1.00E-03
1.00E-02
1.00E-01
H2
CH4
H2O
CO+N2
C2H6
CO2
Integrated dose [electrons/cm2]
Yiel
d [m
olec
ules
/ele
ctro
n]

Rationale
• We want to study the effect of surface treatments and fabrication on ESD
• Large number of samples have been prepared (will be tested also by “spark-test”, SEM, XPS)
IWLC 2010 Sergio Calatroni - 21.10.2010
w/o etch
Passivation
SLAC etch
w/o etch
Passivation
SLAC etch
w/o etch
Passivation
SLAC etch
w/o etch
Passivation
SLAC etch
w/o etch
Passivation
SLAC etch
w/o etch
Passivation
SLAC etch
w/o etch
Passivation
SLAC etch
w/o etch
Passivation
SLAC etch
w/o etch
Passivation
SLAC etch
CERN 2 2 2 2 2 2 2 2 2 2 2 2 24
Bodycote 2 2 2 2 2 2 2 2 2 18SLAC 2 2 2 2 2 4 14
2 2 2 2 2 2 2 2 2 2 2 2 2 2 2 2 2 2 2 2 2 2 2 2 2 2 4 56
Hydrogen (1 bar)
elliptical
Vacuum REFERENCE Vacuum Argon (mbar) H2 (mbar) H2 (1 bar) Vacuum Argon (mbar) Hydrogen (mbar)
main steps: Machining Cleaning Heat
treatment ESD

Heat treatment under hydrogen• Rationale for the calculations:
– H2 bonding introduces hydrogen in the copper, subsequently outgassed in vacuum annealing.
– Any H2 leftover may influence ESD
IWLC 2010 Sergio Calatroni - 21.10.2010
0 100 200 300 400 500 600 7000
300
600
900
1200
2020 20
1040 1040
800
Time (minutes)
T (°
C)
Bonding at 1040 °C with 1 bar of H2
Annealing at 650 °C for 10 days1x10-8 mbar vacuum

Calculated data (assume Cu sheet 1 cm thick)
IWLC 2010 Sergio Calatroni - 21.10.2010
1 bar H2
1 bar H2650 °C 10-8 mbar vacuum
-0.5 0.0 0.51.194x10-4
1.196x10⁻⁴
1.198x10⁻⁴
1.200x10⁻⁴
C (
% w
t)
x (cm)
1309 K 1305 K 1301 K 1297 K 1293 K 1289 K 1285 K 1281 K 1277 K 1273 K 1269 K
Ramp down, 4K/min
-0.5 0.0 0.51.1782x10-4
1.1784x10⁻⁴
1.1786x10⁻⁴
1.1788x10⁻⁴
C (
% w
t)
x (cm)
1073 K
H in Cu @ 1073 K
-0.5 0.0 0.51.40x10-9
1.45x10⁻⁹
1.50x10⁻⁹
1.55x10⁻⁹
1.60x10⁻⁹
C (
% w
t)
x (cm)
10 d 5 d 2 d 1 d 10 h 8 h
Heat treatment after bonding
-0.5 0.0 0.5
1.1993573x10⁻⁴
1.1993574x10⁻⁴
C (
% w
t)
x (cm)
H in Cu, 1h @ 1313
1 bar H2

Direct measurements, anyway
IWLC 2010 Sergio Calatroni - 21.10.2010
F-Cup+Isolator
Stand alone Test Stand in CTFI I
Concrete block
girder girder girder
ACC
pump
Pump Tee
load
coupler
Circular WG
Mode converter
WG valve
0.5 m
0.5 m
Courtesy: S. Doebert
From: K.M. Schirm
Zone to be instrumented with fast gauges

Outlook 1
• Static vacuum seems to be achieved only marginally with present design– Need more precise data on water re-adsorption (sticking
probability depends on coverage)
• Dynamic vacuum due to breakdowns seem to be under control (recovery time ≤ pulse repetition)– However, data from RF tests are needed for further cross-
checking
IWLC 2010 Sergio Calatroni - 21.10.2010

Outlook 2
• Dynamic vacuum due to dark currents: still open question
• Experimental programme:– ESD data on unbaked copper at high e- energy from CERN– Dark current simulations from SLAC – ACE3P– Introduce these into MC+FEM models and get gas
distribution– Direct measurements will be attempted in 12 GHz test
bench (although feasibility is questionable)
IWLC 2010 Sergio Calatroni - 21.10.2010
IWLC 2010 Sergio Calatroni - 21.10.2010
IWLC 2010 Sergio Calatroni - 21.10.2010
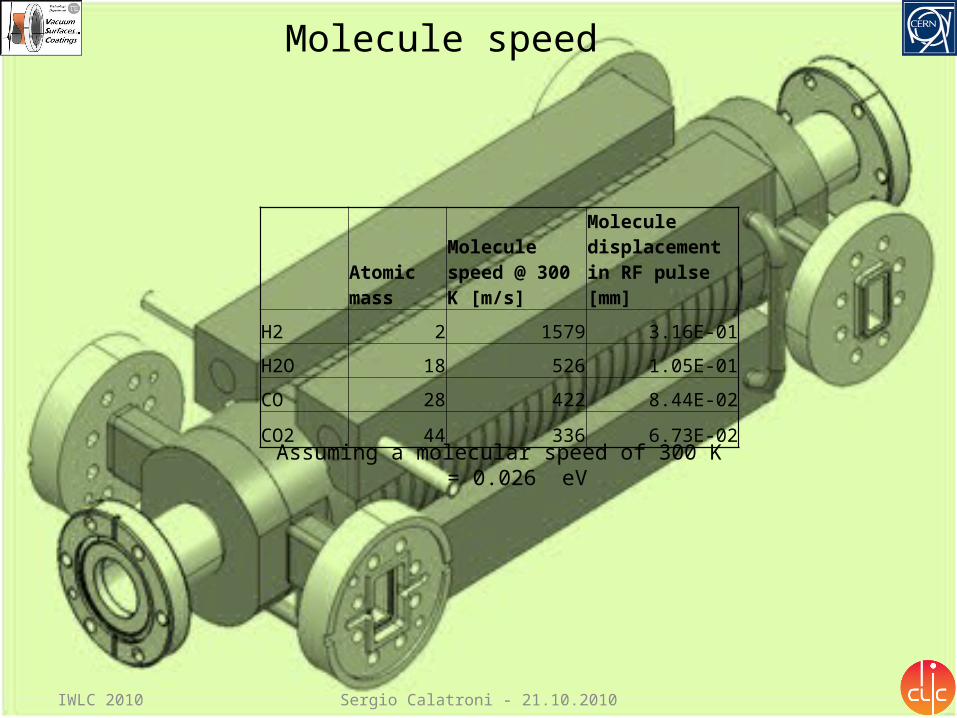
Molecule speed
Atomic mass
Molecule speed @ 300 K [m/s]
Molecule displacement in RF pulse [mm]
H2 2 1579 3.16E-01
H2O 18 526 1.05E-01
CO 28 422 8.44E-02
CO2 44 336 6.73E-02
Assuming a molecular speed of 300 K = 0.026 eV

IWLC 2010 Sergio Calatroni - 21.10.2010
10-9
10-8
10-7
10-6
-1 0 1 2 3 4 5
CTF2 pressure burst
100xQspark sim
10xQspark sim
1xQspark sim
pre
ssu
re[T
orr]
time[s]
Tentatively crosschecked with CTF2 data + Montecarlo simulations


![Technology Department (TE)€¦ · A. VIDAL N. ZELKO Engineering & Insulation Vacuum Section [EIV] Section Leader Paul CRUIKSHANK Engineers & Physicists M. GALLILEE C. GARION N. KOS](https://static.documents.pub/doc/80x56/5ffe02a675d6e274ac53bab9/technology-department-te-a-vidal-n-zelko-engineering-insulation-vacuum.jpg)


