November 2015 Goal 2: Support and help meet the private-sector goal of eliminating deforestation from the production of agricultural commodities such as palm oil, soy, paper and beef products by no later than 2020, recognizing that many companies have even more ambitious targets www.forestdeclaration.org Progress on the New York Declaration on Forests Technical Annexes
Transcript
November 2015
Goal 2: Support and help meet the private-sector goal of eliminating deforestation from the production of agricultural commodities such as palm oil, soy, paper and beef products by no later than 2020, recognizing that many companies have even more ambitious targets
www.forestdeclaration.org
Progress on theNew York Declaration on Forests
Technical Annexes
An electronic copy of the full report is available at www.forestdeclaration.org.
Climate Focus. 2015. Progress on the New York Declaration on Forests – An Assessment Framework and Initial Report: Technical Annexes. Goal 2: Support and help meet the private-sector goal of elimi-nating deforestation from the production of agricultural commodities such as palm oil, soy, paper and beef products by no later than 2020, recognizing that many companies have even more ambitious targets. Prepared by Climate Focus, in collaboration with Environmental Defense Fund, Forest Trends, Global Alliance for Clean Cookstoves, Global Canopy Program and The Sustainability Consortium.
ContentsDescription of the Goal and the Indicators 1
Main Concepts and Definitions 2
Key Messages 4
Data Gaps and Limitations 5
Findings 6
Technical Annex 16
Bibliography 21
Endnotes 23
Progress on the New York Declaration on Forests - Goal 21
Description of the Goal and the IndicatorsGoal 2 targets the elimination of deforestation from the production of a defined set of agricultural com-modities by 2020 and reflects a pledge by the Consumer Goods Forum (CGF), a private sector network of the managers of some 400 retailers and manufacturers 1. It is estimated that around two-thirds of all deforestation in tropical countries is caused by agriculture of which commercial agriculture accounts for 40% and subsistence agriculture accounts for 33% of the total tropical forest loss (Hosonuma et al. 2012). Agricultural commodities have varying levels of impact on tropical deforestation. The increasing relevance of commercial agriculture as the main driver of tropical forest loss is closely linked to the growing demand for a relatively small group of agricultural commodities including soy, beef, palm oil, and timber and pulp 2 (Boucher et al. 2011). Similarly, Cuypers et al. (2013) have identified that 60% of global gross deforestation is explained by the conversion of forest land to land for crop production (34%),3 ruminant livestock production (24%) and the production of industrial round wood (logging) (2%) between 2000 and 2008.
Both public and private sector efforts have recently emerged to address deforestation from commercial agriculture. Governments in producer countries have instituted measures, for example, a moratorium on new concessions in Indonesia, and in buyer countries procurement policies have been introduced, for example the EU Forest Law Enforcement, Governance and Trade (FLEGT) Facility. In the private sector, individual or groups of companies have made commitments to produce and/or source sustainable commodities through changes in supply chain practices, certification, improved chain of custody and enhanced monitoring.
To assess progress on the private sector goal of eliminating deforestation from agricultural commodi-ties, we select two indicators. Indicator 1 measures the market share of certified sustainable palm oil, soy, paper, and beef production. Indicator 2 measures private companies’ and governments’ support for the production of low deforestation, or deforestation-free commodities.
Progress on the New York Declaration on Forests - Goal 2 2
INDICATOR 1Market share of certified commodities
INDICATOR 2Support for the production of low deforestation, or deforestation-free commodities by companies and governments
The fragmented and uncertain nature of corporate and public commitments highlights the challenge of developing comparable indicators toward eliminating deforestation in commodity supply chains (Stan-ley et. al 2015). Given the limited availability of information on corporate and public performance on deforestation-related efforts, the indicators outlined above are only able to act as proxies rather than measurements of progress towards meeting Goal 2.
It is important to note that the various commitments vary significantly in scope and ambition. For ex-ample, some commitments may not explicitly address deforestation, but rather point to increasing sus-tainable production practices or conservation of high conservation value areas as proxies for meeting deforestation reduction targets. Of the commitments that do explicitly address deforestation, pledges range from reducing deforestation by a certain percentage (e.g., 50% by 2020), or meeting deforesta-tion-free, zero deforestation or zero-net deforestation targets across an entire company or a specific commodity.
Certification schemes have become useful tools and popular mechanisms to help meet targets linked to deforestation-free supply chains (Milder et al. 2014). For example, the CGF offers guidance to its mem-bers on achieving zero deforestation in relevant sectors (paper and pulp, palm oil and soy) by apply-ing standards of the Forest Stewardship Council (FSC), the Programme for the Endorsement of Forest Certification (PEFC), the Roundtable for Sustainable Palm Oil (RSPO), and the Round Table for Respon-sible Soy (RTRS). However, it should be noted that different certification standards have varying levels of stringency on deforestation requirements, with uneven levels of effectiveness (Stanley et al. 2015). Table 5 in the Technical Annex provides provides examples of company and certification targets and requirements related to deforestation.
Progress on the New York Declaration on Forests - Goal 23
Powerbrokers ‘Powerbrokers’ are private companies, jurisdictions, or financial institutions under-stood to be the most influential for decreasing deforestation risk in commodity supply chains (definition according to Forest 500).
Sustainability commitments
Sustainability commitments are overarching environmental commitments that seek to produce, source, and procure commodities in a way that is efficient while protecting and improving the natural environment (definition according to Con-sumer Goods Forum). Many private and public sector actors use this term and deforestation-related commitments interchangeably.
Zero deforestation ‘Zero deforestation’, ‘no deforestation’, ‘deforestation-free’ or similar language that implies ‘no deforestation anywhere’ (Consumer Goods Forum; WWF).
Zero net deforestation
This target acknowledges that some forest loss could be offset by forest resto-ration (see Goal 1). Zero net deforestation targets require monitoring of the net quality of conserved forests in order to avoid conversion of primary or natural forests into plantations.
Main Concepts and Definitions
Progress on the New York Declaration on Forests - Goal 2 4
INDICATOR 1: MARKET SHARE OF CERTIFIED COMMODITIES• The market share of certified palm oil increased considerably from 2008 to 2013. However,
the share of certified production of soybeans and the area of certified forests supplying the paper industry have remained constant and without significant increases since 2008. Certified sustainable soy is only 2% of the global market. Half the forests providing wood fiber for paper are under sustainability certified production.
• There is currently no global certification standard on sustainably produced beef with market share information, leaving a monitoring gap in one of the major deforestation risk commodities.
INDICATOR 2: SUPPORT FOR THE PRODUCTION OF LOW DEFORESTATION, OR DEFORESTATION-FREE COMMODITIES BY COMPANIES AND GOVERNMENTS• Since 2009, the number of pledges by companies to reduce the deforestation risk in the
production, supply, and procurement of commodities has risen rapidly, from single digits to 307 by September 2015. However, the overall percentage of private sector actors in the major commodity supply chains that have made pledges remains low. Companies to have endorsed the NYDF score on average far better in sustainability terms than those that have not.
• Financial institutions have made the least progress in supporting low deforestation or deforestation-free commodity production. To date less than 20% of major investors have developed deforestation policies or commodity specific pledges (i.e. to finance companies that source individual commodities sustainably).
• Of the 25 major agricultural commodity-exporting countries, only seven have signed the NYDF. Of these only three have made commitments to reduce and/or eliminate deforestation from commodity production.
• Of the 15 major agricultural commodity buyer, or importing jurisdictions—including the United States, the European Union, Russia, and China—, almost 50% have made public zero or zero-net deforestation commitments. Only three are currently signatories of the NYDF.
Key Messages
Progress on the New York Declaration on Forests - Goal 25
Data Gaps and Limitations• The lack of transparency and availability of data is one of the main limitations to tracking prog-
ress towards Goal 2. Data for the different certification schemes is generally not publicly available, which makes tracking progress difficult and prevents comparability across different certification standards. Further, most countries lack spatially explicit data that would link deforestation to com-mercial agriculture.
• Deforestation-related requirements vary greatly across voluntary certification schemes. In many cases these requirements are not clearly defined or stated in the standards and certification manu-als.
• The voluntary commodity-specific sustainability commitments and deforestation pledges made by companies, jurisdictions and financial institutions vary greatly across the different organizations and countries. This reflects the fragmented nature of corporate and public commitments, and the need of developing a set of comparable indicators.
Progress on the New York Declaration on Forests - Goal 2 6
FindingsIndicator 1: Market share of certified commoditiesThe following paragraphs describe trends in the certified production of key commodities. We present numbers for palm oil, soybean and paper. We are unable to present numbers for beef since there is currently no global certification scheme with market share information for beef. Initiatives such as the Sustainable Agriculture Network (SAN)/Rainforest Alliance Standard for sustainable cattle production systems, which focuses on Brazil, have aimed to reduce deforestation in the cattle supply chain. Howev-er it currently has limited use and no information about the success of the program is publicly available.
Subindicator 1.1: Share of certified production for palm oilThe main certification standard for palm oil is overseen by the Roundtable on Sustainable Palm Oil (RSPO).4 From 2008 to 2013, the production of certified palm oil increased from 0.6 to 9.8 Million tons (Mt), representing 18% of global palm oil production (Figure 1). This positive trend is expected to con-tinue. RSPO targets are for certified production to reach 15 Mt by 2020, accounting for 28% of total production. Opportunities for expansion remain in major producing countries like Indonesia, Malaysia and Thailand where most of the production is still uncertified (Potts et al. 2014). It is important to note that a large proportion of sustainable production is currently certified through sustainability offsets,5 which means that forest may still be lost in production.6
Figure 1: Global total and certified palm oil production (2008-13)
Production refers to the global production of palm oil. Certified Production refers to the production with a certification from the Roundtable on Sustainable Palm Oil.
Source: Climate Focus calculations based on data from the Roundtable on Sustainable Palm Oil (2015), and FAOSTAT for the global production data for palm oil.
% Share of C
ertified Production
2008 2009 2010 2011 2012 20130
20
10
30
50
70
40
60
0 %
20 %
10 %
30 %
50 %
40 %
60 %
70 %
Production Certified Production (RSPO) % Share of Certified Production
Palm
Oil
Prod
uctio
n (M
t)
Progress on the New York Declaration on Forests - Goal 27
Subindicator 1.2: Share of certified production for soybeanThe main certification standard for soy is the Round Table on Responsible Soy (RTRS)7 , though there are other major certifiers including Naturland and International Federation of Organic Agriculture Movements. The share of sustainable certified soybean production remained relatively constant be-tween 2008 and 2012, reaching 2.1% of total production in 20128 (Figure 2). A KPMG report in 2013 has identified several barriers for increasing the market share of certified soy including: lack of con-sumer demand for an ‘invisible ingredient’, fluctuations in certified supply, fragmented certification schemes, and high transaction costs for producers. Despite these barriers, the RTRS expects a dou-bling in market share based on the projected production of its members in the coming years. Recent sustainable soy commitments from some EU Member States are expected to increase the demand for certified soy. For 2014, the RTRS reported a 50% increase in purchases compared to 2013. According to the RTRS, the Scandinavian countries (Denmark, Norway and Sweden) and the Netherlands were the largest buyers of certified soy with 0.48 and 0.62 Mt respectively. Brazil and Argentina remain the largest producers of certified soy, while the Round Table certified producers from Canada and China for the first time.
Subindicator 1.3: Share of certified production for paperThere are two main certification standards for paper: Forest Stewardship Council (FSC) and Programme for the Endorsement of Forest Certification (PEFC). From 2009 to 2014, global paper and paperboard production increased from 389 Mt to 399 Mt (FAOSTAT 2015). The International Council of Forest and Paper Associations (ICFPA) maintains that between 2009 and 2014 the total forest area under FSC or PEFC-certification supplying the paper industry remained relatively stable at 277 - 302 Mha. Approxi-mately 50% of the total industry managed forest area supplying paper is certified (ICFPA 2015)9 (Figure 3). According to the ICFPA, most of the certified forest areas are in North America and Western Europe representing about 75% of the world’s forest certified area. Thus, the performance of this indicator is expected to plateau considering that the rest of the available wood supply is located in developing countries or owned by private landowners.
Figure 2: Global total and certified soybean production (2008-12)
Production refers to the global production of soybean. Certified Production (RTRS) refers to the production with a certification from the Round Table on Responsible Soy.
Source: Climate Focus calculations based on data from Pots et al. (2014).
Soy
prod
uctio
n (M
t)
Production
2008 2009 2010 2011 20120
50
100
150
200
250
300
0%
5%
10%
15%
20%
25%
30%
Certified Production (Pro Terra, RTRS, Organic) % Share of Certified Production
Progress on the New York Declaration on Forests - Goal 2 8
Indicator 2: Support for the production of low deforestation, or deforesta-tion-free commodities by companies and governmentsWe consider two proxies to measure support for the production of low deforestation or deforesta-tion-free commodities: (1) the number of deforestation related commitments on commodity production and sourcing and; (2) progress towards meeting these commitments. We analyze these two proxies differentiating between companies, financial institutions and governments –so called jurisdictions. To measure the number of commitments we use two sources: The Forest 500 initiative10 from the Global Canopy Programme and the Supply-Change initiative11 from Forests Trends. For measuring the progress towards corporate commitments we rely on data from Forest 500 and The Sustainability Consortium (TSC).12 Currently, Forest 500 is the only data source that provides information on deforestation com-mitments and policies made by national and subnational jurisdictions.13 We provide the number of total commitments. However we are unable to provide information on progress made towards com-modity-specific commitments due to a lack of data.
Subindicator 2.1: The number of corporate no-deforestation supply chain commitmentsOver time the total number of companies making deforestation commitments has increased steadily. Data from Forest Trends’ Supply Change report (2015) indicates that the number of commitments from companies to reduce or eliminate deforestation from supply chains has increased from around 20 com-panies in 2009, to 307 total commitments by 2014 (Figure 4). At least one-third of these new pledges were made in 2014, nearly doubling 2013’s announcements. This spike in new commitments can be partly attributed to new institution-scale targets set by members of The Consumer Goods Forum (tar-get: pursue ‘zero net deforestation’ by 2020) and/or signatories of the New York Declaration on Forests (target: halve forest loss by 2020). The largest number of new commitments are linked to sustainable palm oil, and timber and pulp production. Conversely, relatively few companies have made general de-forestation pledges, or deforestation commitments in cattle or soy commodities.
Figure 3: Total and certified forest area used to supply industry members of ICFPA, 2008-13
Source: The International Council of Forest and Paper Association (2015) ICFPA Sustainability Progress Report
Mill
ions
of h
ecta
res
2009
543
51%
591 580
48% 52%
2010 2011 2012 2013Global forest area supplying the paper industry
Certified forest area supplying the paper industry (PEFC and/or FSC)% certified
100
300
200
400
500600
20%
0%
60%
40%
80%
100%
Progress on the New York Declaration on Forests - Goal 29
With data taken from Forest 500, Table 1 presents the percentage of companies that have made specif-ic sustainability pledges on reducing deforestation in their supply chains. Of the 250 major companies evaluated—representing a mix of retailers, producers, traders, processors, and manufacturers— only 7% of companies identified as ‘powerbrokers’ in these agricultural supply chains have zero or zero net deforestation commitments that cover all agricultural commodities that they produce or procure. De-spite this somewhat pessimistic picture, it is encouraging that a large proportion of companies identi-fied by the Forest 500 have commodity-specific production or procurement policies in place. However, a greater number of palm oil and pulp and paper companies have commodity-specific commitments relative to those that operate in soy or cattle supply chains.
Figure 4: Number of commitments to reduce deforestation
Source: Courtesy of Supply Change, a project of Forest Trends. 2015. www.supply-change.org
pre-2009 2009 2010 2011 2012 2013 2014
0
10
20
30
40
50
60
70
80
50
100
150
200
250
300
YearUnknown
Ann
ual c
omm
itmen
t co
unt
Cum
ulative Com
mitm
ent count
GeneralCattleSoyTimber and PulpPalm Cumulative
Progress on the New York Declaration on Forests - Goal 2 10
Table 1: Company commitments to reduce deforestation in commodity supply chains
TYPE OF COMPANY COMMITMENT ALL FOREST 500 POWERBROKERS
Sustainable use/production/procurement of Palm Oil
95 out of 162 59% 21 out of 21 100%
Sustainable use/production/procurement of Soy
25 out of 133 19% 5 out of 15 33%
Sustainable use/production/procurement of Pulp and Paper
78 out of 250 31% 15 out of 21 71%
Sustainable use/production/procurement of Beef and Leather
21 out of 96 22% 3 out of 3 100%
Source: Data provided by the Global Canopy Programme based on personal communication.
Subindicator 2.2: Progress towards corporate deforestation-related supply chain commit-ments According to Forest 500, of the companies that have made commodity-specific commitments those op-erating in the palm oil sector had the most comprehensive policies scoring on average, 64.5 points out of 100 followed by companies operating in beef (58.6), soy (55.9), and paper (48.2) supply chains (Figure 5).
Progress on the New York Declaration on Forests - Goal 211
Figure 5: Forest 500 average policy score awarded for companies’ performance on their commodity-specific deforestation policies and commitments across four commodity supply chains (Forest 500 2015)
Source: Data provided by the Global Canopy Programme based on personal communication
Aver
age
polic
y sc
ore
50
20
30
40
50
60
70
0
Palm Soy Paper Beef
64.5 55.9 48.2 58.6
Conversely, The Sustainability Consortium14 develops key sustainability performance indicators used by Walmart and other companies to evaluate supplier performance on issues including commodity-specific deforestation commitments. Focused on product categories such as paper, beef, and seed oils, these indicators enable retailers and other users to track progress on product-level environmental and social impacts.
Although companies may source certified fiber and palm oil, less than 20% can report that their sup-ply is 100% certified or 100% deforestation free. Additionally, only 20% of companies can report zero deforestation in their dairy and beef feed supply chain and the majority of companies have no data on deforestation for either feed or cattle.15 Availability of data and visibility into long supply chains is important in understanding how companies score on these indicators. Data availability may improve as systems are put in place for annual reporting.
Figure 6 shows key performance indicator (KPI) results on commodity-specific deforestation commit-ments by retailers as compiled by The Sustainability Consortium.
Progress on the New York Declaration on Forests - Goal 2 12
Figure 6: The Sustainability Consortium Key Performance Indicators scores (TSC KPI) from retail supplier surveys on certification and deforestation
Source: Figure provided by The Sustainability Consortium based on personal communication. The KPIs evaluate the success of the companies in meeting their deforestation-related commitments. Soy-based feed is included in the Beef and Dairy Feed KPI. These scores are based on supply chain reporting conducted by companies.
0
No data to report (0) Score (75-100)Score (0-25) Score (25-50) Score (50-75)
% o
f tot
al c
ompa
ny re
spon
ses
20%
40%
60%
80%
Palm oil Paper Products Beef & Dairy feed Beef Palm oil* Paper Products
TSC KPI Score
Certification Deforestation
(161 total responses) (101 total responses) (167 total responses) (53 total responses) (45 total responses) (90 total responses)
*For the Deforestation KPIs, the Palm Oil category includes palm oil and other seed oils
Subindicator 2.3: The number of financial institutions’ no-deforestation commitmentsTable 2 outlines the number and percentage of the 150 investors—such as banks, insurance compa-nies, pension funds, and governments— identified as ‘powerbrokers’ by Forest 500, that have made zero or zero-net deforestation commitments or commodity specific pledges. When compared to compa-nies from other sectors, financial institutions have made the least progress in supporting sustainable, low deforestation or deforestation-free commodity production. Less than 20% of major investors have developed deforestation policies or made commodity specific pledges. A number of major banks have however signed up to the Banking Environment Initiative and the Natural Capital Declaration suggest-ing that the risks associated with investing in companies involved in deforestation are beginning to be acknowledged.
Progress on the New York Declaration on Forests - Goal 213
Table 2: Percentage of major investors making specific types of pledges related to reducing deforestation
MAJOR INVESTORS ALL FOREST 500 POWERBROKERSNY
DECLARATION SIGNATORIES
Type of pledge Number Percentage Number Percentage
Source: Data provided by the Global Canopy Programme based on personal communication.
Subindicator 2.4: Progress towards financial institutions’ deforestation-related commitmentsFigure 7 presents the Forest 500 average policy scores for different types of financial institutions, which are scored based on the extent to which an investor has committed and enacted deforestation poli-cies. Policy scores vary greatly across the different type of investors, with banks as the best performing group, followed by national development banks. These results contrast greatly with hedge fund manag-ers and sovereign wealth funds, which received average policy scores of zero.
Progress on the New York Declaration on Forests - Goal 2 14
Subindicator 2.5: Number of deforestation-related commitments and/or policies made by exporting jurisdictions Table 3 shows the number and percentage of countries and major sub-national jurisdictions that are major exporters of the agricultural commodities covered by this Goal and that have made zero or ze-ro-net deforestation pledges. Representing over 88% of tropical forest cover and approximately 87% of tropical deforestation between 2000 and 2012, the 25 national forest jurisdictions included in the For-est 500 powerbrokers are key to addressing tropical deforestation (Rautner et al. 2015). These jurisdic-tions contribute a significant proportion of forest risk commodity production in tropical regions includ-ing 99.12% of soy, 96.58% of palm oil, and 61.63% of cattle production (ibid). It is important to stress that pledges are not equal, and represent different levels of commitment to reduce deforestation. Six of the 25 national jurisdictions considered to be powerbrokers have made some type of commitment to reduce deforestation while three of seven of the NYDF signatories have made a commitment (Table 3). Examples of these commitments include Colombia’s zero deforestation commitment by 2020 in the Amazon region, Brazil’s zero deforestation commitment for the Atlantic Forest, and Liberia’s zero defor-estation commitment in commodity production throughout the country (ibid).
Figure 7: Total scores for by type of institution
Source: Rautner, M., Lawrence, L., Bregman, T., and Leggett, M. (2015). The Forest 500. Global Canopy Programme
Investor type
Bank
Governmen
t
Hedge F
und M
anager
Insurance
Company
Investm
ent A
dvisor
National D
evelo
pment B
ank
Pensio
n Fund
Sove
reign W
ealth
Fund
Ove
rall
scor
e (/
100)
0
5
10
15
20
25
30
35 35
3
40
7 7
669
2
21
Progress on the New York Declaration on Forests - Goal 215
Table 3: Major exporting countries and sub-national jurisdictions with public deforestation pledges for commodity supply chains or exclusion of production in vulnerable forest landscapes
MAJOR EXPORTING ACTOR ALL FOREST 500 POWERBROKERSNY
DECLARATION SIGNATORIES
Number Percentage Number Percentage
National exporting jurisdiction (countries) 6 out of 25 24% 3 out of 7 43%
Sub-national exporting jurisdiction 2 out of 10 20% 0 out of 1 0%
Source: Data provided by the Global Canopy Programme based on personal communication.
Subinidicator 2.6: Number of deforestation-related commitments and/or policies made by importing jurisdictions Table 4 shows the percentage of the 15 major buyer (or importer, or trading) countries—including the United States, the European Union, Russia, and China—that have made public deforestation pledges. Currently, seven of the 15 powerbroker countries and two of the three NYDF signatories have made de-forestation pledges and/or policies. Note that these commitments are not all equal, but represent some type of pledge to reduce deforestation from commodity supply chains. Examples of these commitments include the EU’s FLEGT policy to source deforestation-free timber and the UK’s public procurement poli-cy on palm oil.
Table 4: Public deforestation commitments from major importing jurisdictions
MAJOR BUYER COUNTRY ALL FOREST 500 POWERBROKERSNY
DECLARATION SIGNATORIES
Number Percentage Number Percentage
National importin jurisdiction 7 out of 15 47% 2 out of 3 67%
Source: Data provided by the Global Canopy Programme based on personal communication.
Progress on the New York Declaration on Forests - Goal 2 16
Technical AnnexSelection of IndicatorsWe use both input and output indicators for this goal in order to gauge support, as well as progress toward eliminating deforestation from commodity supply chains.
The first indicator measures the market share of certification standards in high deforestation risk commodities. We chose this first metric given the reliance on certification by the private sector to meet deforestation-related targets and commitments. A limitation of this indicator is that while certification standards have deforestation rules, the extent to which certification avoids deforestation depends on the scope, design and implementation of the standard (Stanley et al. 2015). Another major limitation of this indicator is that we present the share of certified production compared to the global production for the different commodities. By doing so, we include the production of certain countries or regions that may not pose a threat to deforestation. For instance, the US produced approximately 30% of the global soy supply yet does not pose a significant threat to deforestation. However, for comparability reasons and data limitations we decided to provide global figures for the different commodities included in this indicator.
The remaining indicator and its respective subindicators indirectly measure the level of support of the private-sector for eliminating deforestation from commodity production. We present the number of deforestation-related commitments made by companies, financial institutions, and national and subna-tional jurisdictions. Additionally for Indicator 2, we present scoring data that measures the progress in meeting the latter commitments. The main limitation with these indicators is that some commitments are more robust and ambitious than others, yet data is only available on whether a commitment has been made or not.
Progress on the New York Declaration on Forests - Goal 217
Methodology
Indicator 1: Market share of certified commodities This quantitative indicator calculates the market share of sourced commodities that are certified under major sustainability standards between 2008 and 2013. We focus on the commodities explicitly stated in the goal: palm oil, soy, paper and beef. Beef was omitted from the analysis given that no global cer-tification standard for beef production has sufficient reach or data to be included. For the total produc-tion of palm oil, soybean and paper, we consider the global production of those commodities.
Indicator 2: Support for the production of low deforestation, or deforestation-free commodities by companies and governments
Subindicator 2.1: This indicator counts the number of commitments made by companies to produce/procure/use agricul-tural commodities free of deforestation risk.
Subindicator 2.2:This indicator presents policy or Key Performance Indicator scores on company performance based on their deforestation commitments.
Subindicator 2.3:This indicator counts the number of investors that have made an overall zero deforestation pledge or a net zero deforestation pledge (not specific to commodities), or have made a commitment to sustain-ably use/produce/procure commodities that are free of deforestation risk.
Subindicator 2.4:This indicator presents policy or Key Performance Indicator scores on financial institution performance based on their deforestation commitment.
Subindicator 2.5:This indicator counts the number of producing jurisdictions (national and subnational) that have made a public deforestation pledge, or similar commitment for the production of one or more forest risk com-modities. Given the limitations of information, for this indicator we rely exclusively on the data provided by Forest 500.
Subindicator 2.6: This indicator counts the number of buying jurisdictions that have made a public zero or net zero defor-estation pledge. Given the availability of information, we rely exclusively on the data provided by Forest 500.
Data sources
Market share:Data for Indicator 1 is based on self-reporting of sustainability standard initiatives, and was comple-mented by Sustainability Report, Potts et al. (2014) and Stanley et al. (2015). Data for palm oil is avail-able from 2008 and is reported annually by the Roundtable on Sustainable Palm Oil (RSPO). Data for
Progress on the New York Declaration on Forests - Goal 2 18
soy was gathered from Potts et al. (2014). Global production data for palm oil and soybean was re-trieved from FAOSTAT. Information is available until year 2013. Information for paper is compiled from the International Council of Forest and Paper Associations (ICFPA), and starting from 2009, the Forest Stewardship Council (FSC) and the Programme for the Endorsement of Forest Certification (PEFC). The ICFPA data includes information from 8 paper associations, namely AF&PA (USA), CEPI (Europa), COR-MA (Chile), FPAC (Canada), Ibá (Brazil), JPA (Japan) and PAMSA (South Africa).
Commitments and progress:Data for indicator 2, including respective subindicators, is based on information collected by three re-cent initiatives: Forest500.org, Supply-change.org., and The Sustainability Consortium.
The Forest 500 is an initiative that identifies, ranks and tracks the top forest-relevant governments, companies and financial institutions –so-called powerbrokers– to facilitate the monitoring of NYDF Goal 2. (Forest 500 2015). The Forest 500 initiative calculates an average commodity specific policy score for those companies with commodity specific pledges. For this, Forest 500 bases its assessment on a set of questions made to every company to evaluate its commodity specific policies. The score for every question ranges from 0 to 10. According to Rautner et al. (2015), the companies listed by Forest 500 represent 250 biggest companies with the biggest supply chain forest risk commodity. For measuring progress towards reducing deforestation risk, Forest 500 have assigned policy scores to the different companies and financial institutions –so called powerbrokers– that have public zero or zero net defor-estation policies or have made public sustainability commodity-specific commitments. The scale ranges from 0 to 100. Further details of the scoring process can be found in the Scoring methodology in the Methodology section of the Forest 500 platform available at: http://forest500.org/sites/default/files/scoring_methodology_january_2015.pdf.
The Supply Change project is an initiative that provides information on the extent of commodity specific commitments made by governments, companies, investors and civil society. The project is in the early stages of development and so far only provides information on the number of commodity specific com-mitments made by businesses (supply-change.org 2015).
The Sustainability Consortium (TSC) is a private global organization dedicated to improving the sus-tainability of consumer products while representing the 100+ of the world’s largest organizations. TSC brings together Sector and Consortium Working Groups to work collaboratively to create sustainabili-ty-related knowledge about particular product categories. TSC continuously adds to the scope of prod-ucts covered by TSC’s Sustainability Measurement and Reporting System (SMRS) and creates sustain-ability-related knowledge about particular product categories. (TSC, 2015).
A main limitation of the data is the varying sources of information. The collection of data for palm oil, soybean and paper is cumbersome and, except for RSPO, is not publicly available on the websites of the certifying standards. The data for soy were collected indirectly from Potts et al. (2015). It was not possible to collect information for certified paper production directly, and therefore data on the certi-fied forest area supplying the paper industry had to be used as a proxy. This information was retrieved from the 2015 ICFPA Sustainability Report.
Finally, a commodity-specific initiative to define or certify sustainable beef production was not identi-fied. SAN’s Sustainable Standard for Cattle Production is currently only operational in Brazil and the Global Roundtable for Sustainable Beef (GRSB) provides a multi-stakeholder platform to promote sus-
Progress on the New York Declaration on Forests - Goal 219
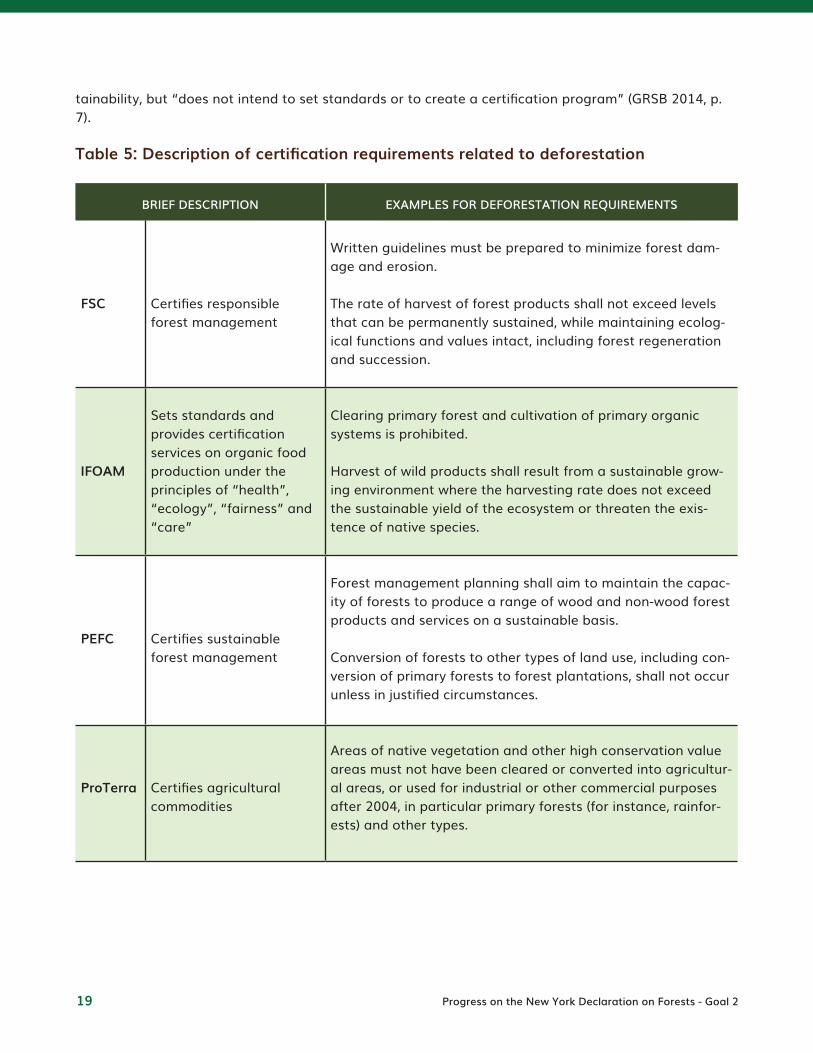
tainability, but “does not intend to set standards or to create a certification program” (GRSB 2014, p. 7).
Table 5: Description of certification requirements related to deforestation
BRIEF DESCRIPTION EXAMPLES FOR DEFORESTATION REQUIREMENTS
FSC Certifies responsible forest management
Written guidelines must be prepared to minimize forest dam-age and erosion.
The rate of harvest of forest products shall not exceed levels that can be permanently sustained, while maintaining ecolog-ical functions and values intact, including forest regeneration and succession.
IFOAM
Sets standards and provides certification services on organic food production under the principles of “health”, “ecology”, “fairness” and “care”
Clearing primary forest and cultivation of primary organic systems is prohibited.
Harvest of wild products shall result from a sustainable grow-ing environment where the harvesting rate does not exceed the sustainable yield of the ecosystem or threaten the exis-tence of native species.
PEFC Certifies sustainable forest management
Forest management planning shall aim to maintain the capac-ity of forests to produce a range of wood and non-wood forest products and services on a sustainable basis.
Conversion of forests to other types of land use, including con-version of primary forests to forest plantations, shall not occur unless in justified circumstances.
ProTerra Certifies agricultural commodities
Areas of native vegetation and other high conservation value areas must not have been cleared or converted into agricultur-al areas, or used for industrial or other commercial purposes after 2004, in particular primary forests (for instance, rainfor-ests) and other types.
Progress on the New York Declaration on Forests - Goal 2 20
BRIEF DESCRIPTION EXAMPLES FOR DEFORESTATION REQUIREMENTS
RSPO
Promotes and certifies sustainable production, procurement, finance and use of palm oil products
Replacement of primary forest or any area required to main-tain or enhance High Conservation Value (HCV) areas is pro-hibited for plantings after November 2005.
Comprehensive HCV assessments are required before any con-version or new planting, along with a land use change analysis to determine changes to vegetation since November 2005.
RTRS Promotes and certifies sustainable production
After May 2009 expansion for soy cultivation must not have occurred on land cleared of “native habitat”, with some excep-tions.
Source: Climate Focus based on information from Stanley et al. 2015 and Standard Websites.
Table 6: Certified production of palm oil, soy, and area of certified forests; Mt: Million tonnes. Mha: Million hectares. Information is reported in calendar years, with exceptions for global production.16
YEAR PALM OIL PRODUCTIONSOY PRODUCTION
(MT)
PRODUCTION FOREST AREA USED TO SUPPLY INDUSTRY (ICPFA) (MHA)
FOREST AREA(MHA)
Production (M.T.)*
Certified Production (RSPO)
% certifiedProduction (Mt)*
Certified Production (ProTer-ra, RTRS, Organic)
Certified Production
Global Forest Area (in million ha)
Global forest area supplying the paper industry
Certified forest area supplying the paper industry**
*Production values of the top 30 countries with major net forest emissions of CO2. **Certified by PEFC and FSC.
Source: Climate Focus calculations based on FAOSTAT, RSPO Website, Pots et al. 2014, ICFPA 2015, FSC 2015, PEFC website.
Progress on the New York Declaration on Forests - Goal 221
BibliographyBrown, S. & D. Zarin. (2013). What does zero deforestation mean? Science, 342, 805 - 807.
Cuypers, D., Geerken, T., Gorissen, L., Lust, A., Peters, G., Karstensen, J., Prieler, S., Fisher, G. Hizsnyik, E., and Van Velthuizen, H. (2013). The Impact of EU Consumption on Deforestation: Comprehensive Analysis of the Impact of EU Consumption on Defor-estation. Technical Report 2013-063 (Final Report), European Commission, Brussels, Belgium, Available at: http://ec.europa.eu/environment/forests/impact_deforestation.htm
FAO .(2005). Global Forest Resource Assessment 2005, available from: http://www.fao.org/forestry/fra/fra2005/en/
Hosonuma, N., Herold, M., De Sy, V., De Fries, R. S., Brockhaus, M., Verchot, L., Angelsen, A., Romijin, E. (2012). An assessment of deforestation and forest degradation drivers in developing countries. Environmental Research Letters, Available at: http://iop-science.iop.org/article/10.1088/1748-9326/7/4/044009/meta;jsessionid=03D12C683F049D0F6C7C2C766F71787C.c1
IFOAM. (2015). IFOAM website, Principles of Organic Agriculture, http://www.ifoam.bio/en/organic-landmarks/principles-organ-ic-agriculture
InPOP. Indonesian Palm Oil Platform. (2015). Indonesia Palm Oil Platform (InPOP) Newsletter. Issue 01 Year 15, Available at: http://www.undp.org/content/undp/en/home/librarypage/environment-energy/green-commodities-programme/indone-sia-palm-oil-platform-newsletter-june-2015.html
International Council of Forests & Paper Associations. (2015). ICFPA Sustainability Progress Report. IFCPA
KPMG. (2013). Sustainable Insight - A roadmap to responsible soy: Approaches to increase certification and reduce risk.
Milder, J., Arbuthnot, M., Blackman, A., Brooks, S.E., Giovannucci, D., Gross, L., Kennedy, E.T., Komives, K., Lambin, E.F., Lee, A., Meyer, D., Newton, P., Phalan, B., Schroth, G., Semroc, B.,Van Rikxoort, H. and Zrust, M. (2014). An agenda for assessing and im-proving conservation impacts of sustainability standards in tropical agriculture. Conservation Biology (00)0: 1-12.
PEFC. (2015). Global Certification, http://www.pefc.org/resources/webinar/747-pefc-global-certification-forest-manage-ment-chain-of-custody
Potts, J., Lynch, M., Wilkings, A., Huppé, G., Cunningham, M., Voora, V.(2014). The State of Sustainability Initiatives Review: Stan-dards and the Green Economy. State of Sustainability Initiatives SSI
Progress on the New York Declaration on Forests - Goal 2 22
PROTERRA Foundation. (2015). Proterra Foundation website, ProTerra Certification Scheme, http://www.proterrafoundation.org/index.php/certification
Rautner, M., Lawrence, L., Bregman, T., and Leggett, M. (2015). The Forest 500. Global Canopy Programme.
RSPO. (2013). Principles and criteria, www.rspo.org/publications/download/90f321ec61fa3a2
RSPO. (2015). RSPO website, About Us, http://www.rspo.org/about
RTRS. (2013). RTRS Standard for Responsible Soy Products, http://www.responsiblesoy.org/documentos/rtrs-standard-for-respon-sible-soy-production/
RTRS. (2015). Demand for responsible soy increases by 50 % in 2014, Available at: http://www.responsiblesoy.org/en/demand-in-creases-50-in-2014/ (Accessed 20 August 2015)
Stanley, L., Roe, S., Broadhead, J., Parker, C. (2015). The Potential of Voluntary Sustainability Initiatives to Reduce Emissions from Deforestation and Forest Degradation. Produced by Climate Focus for USAID’s LEAF Program. Available at: http://www.climatefo-cus.com/sites/default/files/VSI 20Executive 20Summary 20FINAL.pdf
Supply-Change. (2015). Supply Change: Corporations, Commodities, and Commitments that Count, http://forest-trends.org/re-leases/uploads/Supply%20Change_Report.pdf
UNDESA. United Nations Department of Economic and Social Affairs, Population Division. (2012). World Population Prospects. The 2012 Revision. Volume I: Comprehensive Tables, Available at: http://esa.un.org/unpd/wpp/Publications/
Progress on the New York Declaration on Forests - Goal 223
Endnotes1 See Consumer Goods Forum, Board of Directors, Resolution on Deforestation, November 2010, available at http://www.thecon-sumergoodsforum.com/sustainability-strategic-focus/sustainability-resolutions/deforestation-resolution
2 Timber and pulp includes the production of paper and other wood products like furniture and other building materials.
3 “Soybean and oil palm, and their derived products, represent the largest share (63%) of deforestation embodied traded crop commodities” (Cuypers et al., 2013, P. 22)
4 The RSPO is integrated by oil palm producers, processors or traders, consumer goods manufacturers, retailers, banks/investors, and environmental and social non-governmental organizations, in order to develop and implement global standards for sustain-able palm oil.
5 Under this approach, companies purchase credits (e.g., Green Palm) representing a quantity of sustainably produced palm oil, which companies can report as offsetting the unsustainable element in their own supply chains. The revenue from credit sales is used to fund sustainable production.
6 Separately from the RSPO, Indonesia has established a government-led certification program in 2009 called the Indonesian Sustainable Palm Oil (ISPO). This obliges all palm oil growers in Indonesia to adopt its standards by the end of 2014. The national certification standard is based on existing national legislation in Indonesia (SPOP 2015) and seeks to support Indonesia’s defor-estation and emissions reduction goals. The Indonesian Sustainable Palm Oil standard seeks to certify smallholder plantations, with an aim to engage around 2,200 smallholders holding 4,356,000 hectares (42%) of Indonesian plantations (InPOP 2015). Despite the objective of reaching extensive certification of all smallholder plantations by 2014, there is currently no public data available to verify whether progress has been made.
7 Similar to the RSPO, the RTRS is integrated by different stakeholders of the soy value chain.
8 This number is calculated taking into account the production of soybeans certified by Proterra, RTRS and Organic.
9 Calculations of The International Council of Forests and Paper Association (ICFPA) are based on the data provided by seven ICFPA member associations: AF&PA (United States), CEPI (Europe), CORMA (Chile), FPAC (Canada), Ibá (Brazil), JPA (Japan) and PAMSA (South Africa), representing 24 countries with a forest certified area of 302 million ha.
10 The Forest 500 is an initiative that identifies, ranks and tracks governments, companies and financial institutions –so-called powerbrokers– around the globe that could virtually eradicate tropical forest loss by committing to deforestation risk free policies and procurement of sustainable production of soybean, palm oil, beef and pulp and paper commodities (Forest 500 2015).
11 The Supply Change project is an initiative that provides information on the extent of commodity specific commitments made by governments, companies, investors and civil society. The project is on its first stage of development and so far only provides information on number of commodity specific commitments made by businesses (supply-change.org 2015).
12 The Sustainability Consortium (TSC) is a multi-stakeholder, science-based, global organization dedicated to improving the sustainability of consumer products while representing nearly 100 members from some of the world’s largest consumer goods manufacturing companies, civil society organizations, retailers, and universities. TSC brings their stakeholders together to work collaboratively to create sustainability-related tools for over 117 product categories across diverse sectors. TSC continuously adds to the scope of products covered and provides implementation services to enable companies and organizations to integrate TSC tools and to improve the sustainability of consumer goods.
13 National producing jurisdictions covered by The Forest 500 initiative: Angola, Argentina, Bolivia, Brazil, Cameroon, Central Afri-can Republic, Colombia, Congo, Democratic Republic of Congo, Ecuador, Gabon, Guyana, Indonesia, Laos, Liberia, Madagascar, Malaysia, Mexico, Myanmar, Nigeria, Papua New Guinea Paraguay, Peru, Venezuela and Zambia. Subnational producing jurisdic-tions covered by The Forest 500 initiative: Bolivar (Venezuela), Caqueta (Colombia), Campeche (Mexico), Kalimantan (Indonesia), Loreto (Peru), Para (Brazil), Orientale (Democratic Republic of Congo), Santa Cruz (Bolivia), Shan (Myanmar) and Western Province (PNG).
14 The Sustainability Consortium (TSC) is a private global organization dedicated to improving the sustainability of consumer products while representing the 100+ of the world’s largest organizations. TSC brings together Sector and Consortium Working Groups to work collaboratively to create sustainability-related knowledge about particular product categories.
15 The Sustainability Consortium. Personal communication Sept-Nov 2015 on data as well as information retrieved from the web-site: www.sustainabilityconsortium.org.