34
Progress towards building a truly customer-centric bank Ross McEwan, Chief Executive Bank of America Merrill Lynch Banking & Insurance CEO Conference 30 th September 2014

Progress towards building a truly customer-centric bank Ross McEwan, Chief Executive Bank of America Merrill Lynch Banking & Insurance CEO Conference 30th September 2014

1
Our blueprint

Contents
Our ambition 1
Our values 3
Our purpose 2
Our brands 4
Our 2014 focus 5

#1 for customer service, trust and advocacy by 2020
#1 Net Promoter Score for each of our segments Customers
#1 trusted bank in the UK
People
Return on Tangible Equity 12+%
Investors Cost:income ratio ~50%
CET1 ratio ≥12%2
Leverage ratio ≥4%3
Loan:deposit ratio ~100%
Attractive and consistent returns
Unquestioned safety & soundness
Great place to work
Service
Trust
Engagement Index ≥ Global Financial Services norm1
1 Global Financial Services norm currently stands at 82%. Source: Towers Watson. 2 Common Equity Tier 1 ratio. 3 Under review pending completion of the PRA consultation process.
2

1*
- 8
Customers are beginning to respond to the change
Source (Personal)1: GFK FRS : Base: All main current account holders: Period: 6-month rolling figures. Net Promoter Score (NPS) – a measure of main current account customers’ likelihood to recommend the current account service (Business): Charterhouse Research GB Business Banking Survey, based on interviews with businesses with annual turnover between £0m and £2m (687 NatWest main bank customers, 335 RBS, 301, weighted by region and turnover to be representative of businesses in GB (Commercial): Charterhouse Research GB Business Banking Survey, based on interviews with businesses with annual turnover between £2m and £25m (522 NatWest main bank customers, 224 RBS, 329 weighted by region and turnover to be representative of businesses in GB. Net Promoter Score (NPS) – a measure of main bank customers’ likelihood to recommend the bank.
3
Internal surveys run by an external market research company show: - Strong personal customer satisfaction and advocacy in our fast growing Mobile channel - Improving scores in other personal channels such as Branch and Telephony
Personal 1
Net Promoter Score (NPS) performance
Commercial
12 months ending June
2013
12 months ending June
2014
Feb-14 Aug-14
12 months ending June
2013 Feb-14 Aug-14
Business
-10 -16*
-14 -15
12 months ending June
2013
-26 -14*
12 months ending June
2013
6 months ending June
2014
6 months ending June
2014
12 months ending June
2014
- 2
14*
* = Significant increase or decrease

Contents
Our ambition 1
Our values 3
Our purpose 2
Our brands 4
Our 2014 focus 5

7 4
Fairer pricing Same pricing across all channels.
Rewarding loyalty We have stopped teaser rates – best
rates offered to new and existing customers.
Simpler products
We have reduced the number of personal and business products by one third since
2012. This will reach half in 2014.
Faster processes We are speeding up account opening and loan decisions.
Our goal: #1 for customer service, trust and advocacy by 2020
Serve customers well… Good early progress delivering upon our purpose

5
We are becoming simpler and clearer
Personal account opening time SME product range
Personal current accounts Personal savings accounts
7
27 -74%
# of products on offer
5
23 -78%
# of products on offer
1
5 -80%
# of days
251-52%
2014 target: 120
# of products on offer

Our actions are beginning to have an impact
6
1
11 -91%
# of products on offer
Case study: Instant saver product rationalisation
+50% +£10bn
Sales Balances
Fair pricing and simplification supporting greater customer take-up
We provide the support and tools to help our customers become better savers
We are the first bank to be awarded a 5 star Fairbanking Mark accreditation

55% Active Online and Mobile Customers
£40bn Annual Digital
Payments
30k Web-chats per week
95m Page clicks per week
26m Digital Logins
per week
We’re starting from a strong base…
7
Building on our innovative mobile and channel offering
Integrate our online channels for seamless
customer support
Digital experts in our branches
Connecting our personal and business
customers online
Connecting services for our customers
around key life events, such as buying a house
And we have a clear plan to build on it…

Contents
Our ambition 1
Our values 3
Our purpose 2
Our brands 4
Our 2014 focus 5

Our values are being embedded with staff
% of staff that agree1…
83%
“RBS delivers excellent customer service”
85%
“We work well together”
89%
“I am encouraged to
do the right thing at work.”
63% “Decisions in my business area are based on
what’s best in the long term.”
Serve customers well. This is our purpose.
8
1 Staff feedback, Our View 2013 survey.
Serving customers
Working together
Doing the right thing
Thinking long term

Contents
Our ambition 1
Our values 3
Our purpose 2
Our brands 4
Our 2014 focus 5

Personal & Business Banking
Commercial & Private Banking
Corporate & Institutional Banking
9
We have market leading franchises
#2 GB Personal current accounts1
23% share of GB Business Banking main bank relationships2
- ~800k customers
- 24%2 share of business
start-ups
#1 Northern Ireland
#3 Republic of Ireland
#1 UK Commercial bank
- 79,000 customers
Market-leading share of relationships (31%)
3
Local presence in over 100 UK locations served by over 7,000 employees
#1 UK Private Bank
#1 UK Large Corporates, #4 in Europe4
#1 UK Cash Management, #4 in Europe4
Best Trade Finance Bank in UK and Western Europe5
Strong capabilities in FX, and Rates - Top 3 in UK, Top 10 in EMEA
1 GfK FRS, RBS and NatWest market share, 6 months ending August 2014. 2 Charterhouse Research GB Business Banking Survey, 6 months ending June 2014, based on 6397 businesses with annual turnover of £0 -£2m (1713 start-ups), weighted by region and turnover to be representative of businesses in GB (GB – UK excluding Northern Ireland). 3 PH data, primary banked Q2 2014. 4 Greenwich Associates 2014 (Large Corporate Banking & Large Corporate Cash Management Survey) Tied 4th in cash management. 5 Global Finance Awards, 2014.

Commercial & Private Banking
Personal & Business Banking
Corporate & Institutional
Banking
#1 in Commercial market share, but we can still deepen these relationships and do more for our customers
Better connect Coutts UK to successful business owners and entrepreneurs
17% current account market share but only 8% in mortgages
1
~40% of our business customers do not have an active Personal banking relationship with RBSG
2
Maintain market leadership with UK Large Corporates
Improve connectivity across the global network
We need to leverage our strengths
RBSG market share
Mortgage market share GB3
Main Current account market
share GB3
8%
17% RBSG market share
#2 #4
UK Large Corporate Banking Total Relationships
85% RBS product penetration and rank
#1
1 GfK FRS, RBS and NatWest market share, 6 months ending August 2014. 29,659 main current account and 6,984 mortgage holders interviewed. 2 Internal analysis; business customer numbers excludes Clubs & Societies and accounts in Collections & Recoveries. 3 GB – UK excluding Northern Ireland.
3 PH data, primary banked Q2 2014.
#4 27%
4
European Top-Tier Large Corporate Cash Mgmt Mkt Penetration
4 Greenwich Associates 2014 Greenwich Leaders European Corporate Banking and Transactions. Tied 4th in cash management.
10
31% 3
#1 Commercial lead
relationships

Contents
Our ambition 1
Our values 3
Our purpose 2
Our brands 4
Our 2014 focus 5

Today’s trading update
Economic recovery continues to support a benign impairment outlook
RCR making excellent progress, well geared to execute
Ulster – improving economic conditions and higher real estate prices
Asset pricing supporting provision releases on some RCR asset sales
11

FY13
8.6%
+150bps
2016 target
≥12%
2015 target
c.11%
Q214
10.1%
Capital plan CET1 target ≥12%, well on track
CET1 ratio up 150bps in H1 2014
Leverage ratio at 3.7%, up 30bps in H1, well positioned for potential higher leverage ratios
12

Capital plan RCR’s progress is well ahead of plan
Non-Core’s reputation for delivery…
… is being continued in RCR
Experienced and efficient execution is key:
Excellent progress continued in Q3
Improving environment supported further releases
>150 deals
completed in H1’14
Non-Core reduced funded assets by £230bn (89%) over 5 years – well below the original £40bn target
£44bn£65bn
£116bn
£21bn£28bn£38bn
H114
-62%
-45%
FY13 H114 FY13 Perimeter Perimeter
Funded Assets
300k documents added to
data rooms
>100% P/BV
achieved in H1
>13m data points
collected
RWA Equivalent
13

Good progress in reducing NPLs, down 20% from peak – RCR (60% of total NPLs) key driver of accelerated run-down
Recent results benefitted from no major impairments in RCR, alongside a number of provision releases
Leading credit indicators continue to improve, with geared exposure to both Irish and UK recoveries
1 NPLs (non-performing loans) = Risk Elements in Lending (REiL) per RBS results disclosures. 2 Q311.
Capital plan Supportive credit environment, exposure risk remains
34.137.4
42.7-20%
Q214 Q114 Peak NPLs
NPLs, £bn
22.424.220.7
Provisions, £bn
Remainder
Ulster
8.8
4.9
Ireland: 10.3
RoW: 2.1 UK: 8.0
Coverage, %
48% 66% 65%
RBS Capital Resolution
(RCR)
1
2
71%
68%
54%
14

Capital plan Cautious on litigation / conduct cost outcomes
PPI – continue to provide to best estimates, closely monitoring claims
Swaps – agreed outcomes with the independent reviewer relating to over 95%1 of cases
Continue to work through RMBS litigation, FHFA and other material RMBS related matters remain outstanding
Significant risks and uncertainty remains around the scale and timing of future specific conduct and litigation costs
Work continues on putting past conduct issues behind us
FX – timeline and potential extent still to be clarified
15
1 As at 30 June 2014.

14.0
~(1.0)
Disposals & run-off
~(3.1) (0.3)
FY13 Inflation2 Medium-term target3
~8bn ~0.7
Future reduction1
~(2.3)
2014 reduction
£1bn costs on track to be removed in 2014 Operating expenses including bank levy and excluding restructuring and conduct & litigation costs £bn
Our historic scale and complexity left us inefficient; we are aligning our cost base to our new more focused and smaller operating model
Reductions to be delivered over a 4-year period
Continue to anticipate £5bn total restructuring costs 2014-17
Long-term cost:income ratio target: ~50%
Non-repeat of Q413 intangibles
write-down
On track to meet £1bn cost reduction target in 2014, £0.5bn delivered in H114 1 2015-17. 2 Including bank levy. 3 Medium-term defined as 2017.
16

We remain focussed on our vision of a resilient, efficient and simple technology estate with fewer applications to better serve our customers
Resilient systems An efficient, simple technology estate
17
Reducing the number of platforms
IT Resilience
Upgraded and improved infrastructure
Able to process >90% of card transactions during outages
Made over 20,000 changes to simplify and strengthen the batch environment
Our batch scheduler now runs twice as fast as previously
Developed and delivered real time visualisation for batch monitoring
Simplification
>50% fewer platforms reducing
complexity, cost, error rates and
wasted front line effort
>50%
2016 target 2013

18
Resilient systems Our infrastructure is becoming simpler
Fewer, more strategic supplier relationships
Change portfolio rationalised Property exits in progress
150214247
550-73%
2015 target Today Jan-14 2013
# of projects # of London offices
5
911
-55%
2016 target Today 2013
# of RBS suppliers (‘000’s)
1923
42
2012
-55%
2015 target Today
Spend with 3rd parties has reduced
by 14% Y/Y

Les Matheson
Support & Control
IT & Ops
Bank-wide service platforms and functions allow us to deliver the whole bank to our customers through their lifecycle and to drive hard on cost efficiency
ICB implications being assessed currently
19
RWA Op. Profit RoE2
35% 50% 15+%
RWA Op. Profit RoE2
30% 30% 15+%
RWA Op. Profit RoE2
35% 20% ~10%3
Personal & Business Banking
Commercial & Private Banking
Corporate & Institutional Banking
Alison Rose Donald Workman
1 Steady state defined as 2018 to 2020. 2 For the purposes of computing segmental return on equity, notional equity is calculated as 12% of the monthly average of segmental RWAs. 3 7-8% medium-term target (2016/17).
Go-forward target business profile1
Implemented new organisation design We are now managed as one bank

H114 returns supported by lower impairments, notably in Ireland, and lower deleveraging losses
Short-term performance will remain sensitive to delivery of RCR and CIB de-risking, restructuring charges and conduct & litigation headwinds
Delivery of cost reductions fundamental to achieving 12+% RoTE target. CIB costs down 20% Y/Y
RoTE1, %
+4.3%
+5.1%
4.3% 2.7%
12.9%
H113
(1.6%)
H113 H114 H113
17.0%
+13.7%
7.0%
H113 H114 H114
+4.8%
H114
7.8% 2.2%
Personal & Business Banking
Commercial & Private Banking
Corporate & Institutional Banking
Target: 15+% Target: 15+%
Target: ~10%
Target: 12+%
1 For the purposes of computing segmental return on equity, notional equity is calculated as 12% of the monthly average of segmental RWAs.
20
Medium-term plans Returns improving, but much more to be done

Source: Industry statistics. Forecast data from RBS economics consensus view
Housing market activity and HPIs increasing Business investment is increasing
GDP growth firmly anchored
0
20
40
60
80
100
120
140
2007 2009 2011 2013 2015
Reb
ased
to 1
00
UK Ireland
0
20
40
60
80
100
120
2007 2009 2011 2013 2015
Reb
ased
to 1
00
UK mortgage approvals Irish housing completions
85
90
95
100
105
110
2007 2009 2011 2013 2015
Reb
ased
to 1
00
UK Ireland
Forecast Forecast
Forecast
Unemployment lower
02468
10121416
2007 2009 2011 2013 2015
%
UK Ireland
Forecast
Medium-term plans Underpinned by upturn in UK and Irish economies
21

Lending
Deposits
Funding
Encouraging early signs of lending demand in UK franchises Loan:deposit ratio 96%, geared to support balance sheet growth Front-book margins remain attractive, low margin legacy assets
continue to run off (RCR, Irish tracker mortgages)
Excellent funding profile Continue to attract quality deposit flow, UK demand deposits up 10% Y/Y Substantial volume of non-interest bearing liabilities; demand deposits
£81bn1, total ‘free-funds’ £141bn1
Funds available to lend, supported by strong liquidity position Expensive post-Crisis funding now maturing, £21bn H214 – FY152
Limited issuance requirements funded at lowest spreads since the onset of the Crisis
1
3
2
Medium-term plans Well positioned to support increasing client activity
1 H114 reported average balance sheet. 2 Debt securities and subordinated liabilities issued with original maturities of >1 year. Maturity classed as final maturity, ignoring call options.
22

Medium-term plans Early signs of UK loan growth
Mortgages – strong net lending growth with continued market share gains SME – continued positive trend
Q214 Y/Y growth in mortgage loans outstanding in PBB UK
H114 SME gross new lending of £5bn, ahead of target. Strong application flow. Run-off remains at similar levels to previous years
Momentum continues on mortgages with gross new business market share now up to 10.4% in Q214 driven by a 20% expansion in new business Q/Q
Q214 performance reflecting good progress made in Mortgage Market Review implementation
Applications (‘000s) Gross new lending (£bn)
1%
Market RBS
4% 12%
Q213
40.0 45.0
Q214
2.61.9
38%
Q214 Q213
23
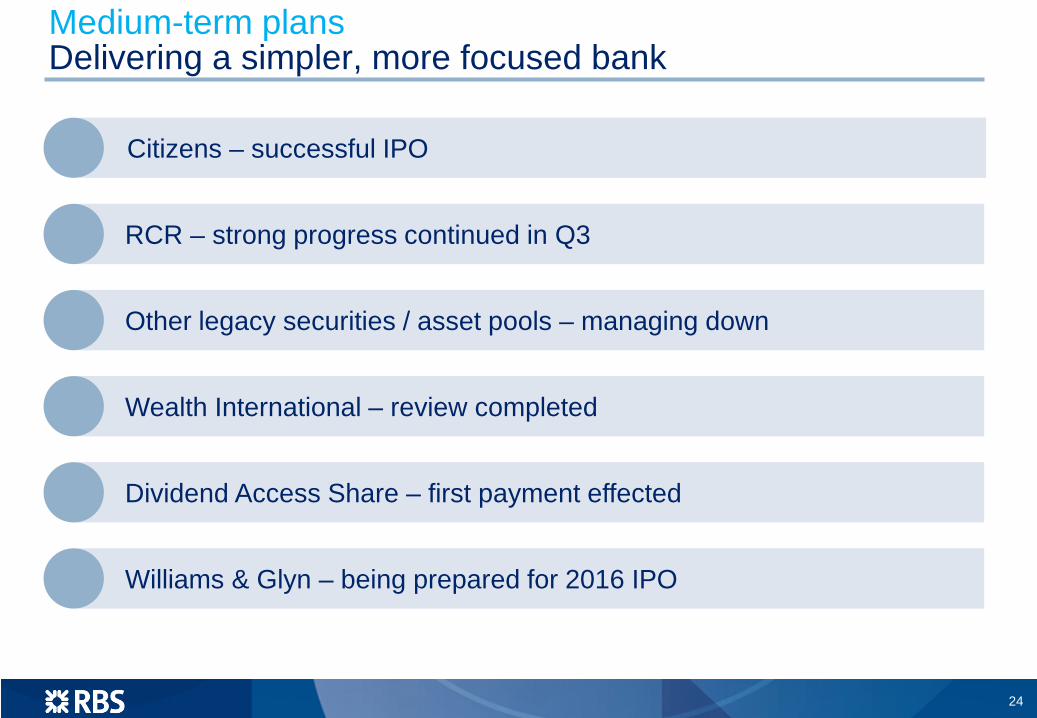
Medium-term plans Delivering a simpler, more focused bank
Citizens – successful IPO
RCR – strong progress continued in Q3
Wealth International – review completed
Other legacy securities / asset pools – managing down
Dividend Access Share – first payment effected
Williams & Glyn – being prepared for 2016 IPO
24

Medium-term plans More efficient capital reallocation to underpin returns
Proportion of RWAs committed to each business, %
26% 27% 35%
25% 27%30%
49% 46% 35%
Personal & Business Banking
Corporate & Institutional Banking
Steady state1
Commercial & Private Banking
H114 FY13 1 Steady state defined as 2018 to 2020.
25
Steady state1
~80%
~20%
H114
~60%
~40%
2008
~40%
~60%
Steady state1
~85%
~15%
H114
~80%
~20%
2008
~50%
~50%
R&C Wholesale UK Non-UK Illustrative split by total income Illustrative split by RWAs
Business mix shift towards the UK… Clear emphasis on Retail & Commercial
Strategic plan redeploys capital to high return businesses

Early progress in making our bank simpler, clearer and fairer
UK and Ireland showing growth, impairment trends significantly better
Costs consistently reduced
Attractive returns and distributions in the medium-term
On track to achieve strong CET1 ratio targets
26
Summary
Our goal: #1 for customer service, trust and advocacy by 2020
Business restructuring from 7 to 3 businesses with support functions

Q&A

Certain sections in this presentation contain ‘forward-looking statements’ as that term is defined in the United States Private Securities Litigation Reform Act of 1995, such as statements that include the words ‘expect’, ‘estimate’, ‘project’, ‘anticipate’, ‘believes’, ‘should’, ‘intend’, ‘plan’, ‘could’, ‘probability’, ‘risk’, ‘Value-at-Risk (VaR)’, ‘target’, ‘goal’, ‘objective’, ‘will’, ‘endeavour’, ‘outlook’, ‘optimistic’, ‘prospects’ and similar expressions or variations on such expressions.
In particular, this presentation includes forward-looking statements relating, but not limited to: the Group’s restructuring and new strategic plans, divestments, capitalisation, portfolios, net interest margin, capital ratios, liquidity, risk-weighted assets (RWAs), return on equity (ROE), profitability, cost:income ratios, leverage and loan:deposit ratios, funding and risk profile; discretionary coupon and dividend payments; implementation of legislation of ring-fencing and bail-in measures; sustainability targets; litigation, regulatory and governmental investigations; the Group’s future financial performance; the level and extent of future impairments and write-downs; and the Group’s exposure to political risks, including the referendum on Scottish independence, credit rating risk and to various types of market risks, such as interest rate risk, foreign exchange rate risk and commodity and equity price risk. These statements are based on current plans, estimates and projections, and are subject to inherent risks, uncertainties and other factors which could cause actual results to differ materially from the future results expressed or implied by such forward-looking statements. For example, certain market risk disclosures are dependent on choices about key model characteristics and assumptions and are subject to various limitations. By their nature, certain of the market risk disclosures are only estimates and, as a result, actual future gains and losses could differ materially from those that have been estimated.
Other factors that could cause actual results to differ materially from those estimated by the forward-looking statements contained in this presentation include, but are not limited to: UK and global economic and financial market conditions and other geopolitical risks, and their impact on the financial industry in general and on the Group in particular; the ability to implement strategic plans on a timely basis, or at all, including the simplification of the Group’s structure, rationalisation of and investment in its IT systems, the divestment of Citizens Financial Group and the exiting of assets in RBS Capital Resolution as well as the disposal of certain other assets and businesses as announced or required as part of the State Aid restructuring plan; the achievement of capital and costs reduction targets; ineffective management of capital or changes to capital adequacy or liquidity requirements; organisational restructuring in response to legislation and regulation in the United Kingdom (UK), the European Union (EU) and the United States (US); the implementation of key legislation and regulation including the UK Financial Services (Banking Reform Act) 2013 and the EU Recovery and Resolution Directive; the ability to access sufficient sources of capital, liquidity and funding when required; deteriorations in borrower and counterparty credit quality; litigation, government and regulatory investigations including investigations relating to the setting of interest rates and foreign exchange trading and rate setting activities; costs or exposures borne by the Group arising out of the origination or sale of mortgages or mortgage-backed securities in the US; the reliability and resilience of its IT system, the extent of future write-downs and impairment charges caused by depressed asset valuations; the value and effectiveness of any credit protection purchased by the Group; unanticipated turbulence in interest rates, yield curves, foreign currency exchange rates, credit spreads, bond prices, commodity prices, equity prices and basis, volatility and correlation risks; changes in the credit ratings of the Group; changes to the valuation of financial instruments recorded at fair value; competition and consolidation in the banking sector; the ability of the Group to attract or retain senior management or other key employees; regulatory or legal changes (including those requiring any restructuring of the Group’s operations) in the UK, the US and other countries in which the Group operates or a change in UK Government policy; changes to regulatory requirements relating to capital and liquidity; changes to the monetary and interest rate policies of central banks and other governmental and regulatory bodies; changes in UK and foreign laws, regulations, accounting standards and taxes, including changes in regulatory capital regulations and liquidity requirements; impairments of goodwill; pension fund shortfalls; general operational risks; HM Treasury exercising influence over the operations of the Group; reputational risk; the conversion of the B Shares in accordance with their terms; limitations on, or additional requirements imposed on, the Group’s activities as a result of HM Treasury’s investment in the Group; and the success of the Group in managing the risks involved in the foregoing.
The forward-looking statements contained in this presentation speak only as of the date of this announcement, and the Group does not undertake to update any forward-looking statement to reflect events or circumstances after the date hereof or to reflect the occurrence of unanticipated events.
The information, statements and opinions contained in this presentation do not constitute a public offer under any applicable legislation or an offer to sell or solicitation of any offer to buy any securities or financial instruments or any advice or recommendation with respect to such securities or other financial instruments.
Forward Looking Statements


