E Methods: E Participants identified by intake centres (e.g., Contact Hamilton) E 500 mothers and 500 fathers of 4-12 year old children referred to children’s mental health services E BCFPI Internalizing or Externalizing t-scores greater than 65 E Discrete Choice Conjoint Experiments E 20 4-Level Waiting List Reduction Attributes (from focus groups) E 30 choice tasks per participant E Computerized administration Project 2: Consumer Preference Modeling
Transcript
Methods:
Participants identified by intake centres (e.g., Contact Hamilton)
500 mothers and 500 fathers of 4-12 year old children referred to children’s mental health services
BCFPI Internalizing or Externalizing t-scores greater than 65
Discrete Choice Conjoint Experiments
20 4-Level Waiting List Reduction Attributes (from focus groups)
30 choice tasks per participant
Computerized administration
Project 2: Consumer Preference Modeling
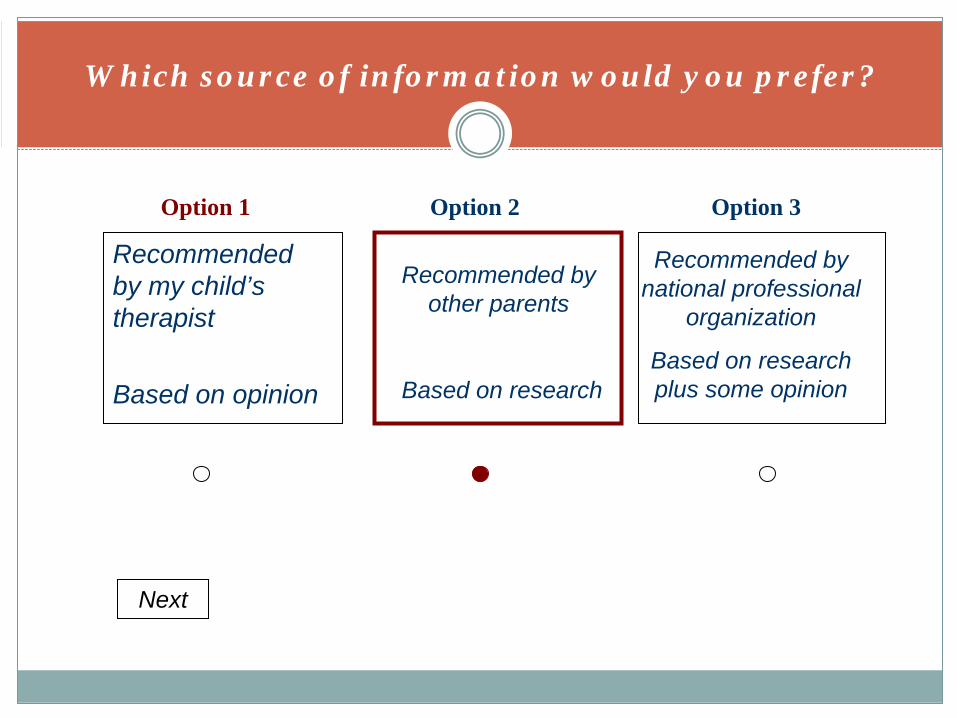
Recommended by my child’s therapist
Based on opinion
Which source of information would you prefer?
Option 1 Option 2 Option 3
Recommended by other parents
Based on research
Recommended by national professional
organization
Based on research plus some opinion
Next
Recommended by my child’s therapist
Based on opinion
Which source of information would you prefer?
Option 1 Option 2 Option 3
Recommended by other parents
Based on research
Recommended by national professional
organization
Based on research plus some opinion
Next
Recommended by my child’s therapist
Based on opinion
Which source of information would you prefer?
Option 1 Option 2 Option 3
Recommended by other parents
Based on research
Recommended by national professional
organization
Based on research plus some opinion
Next
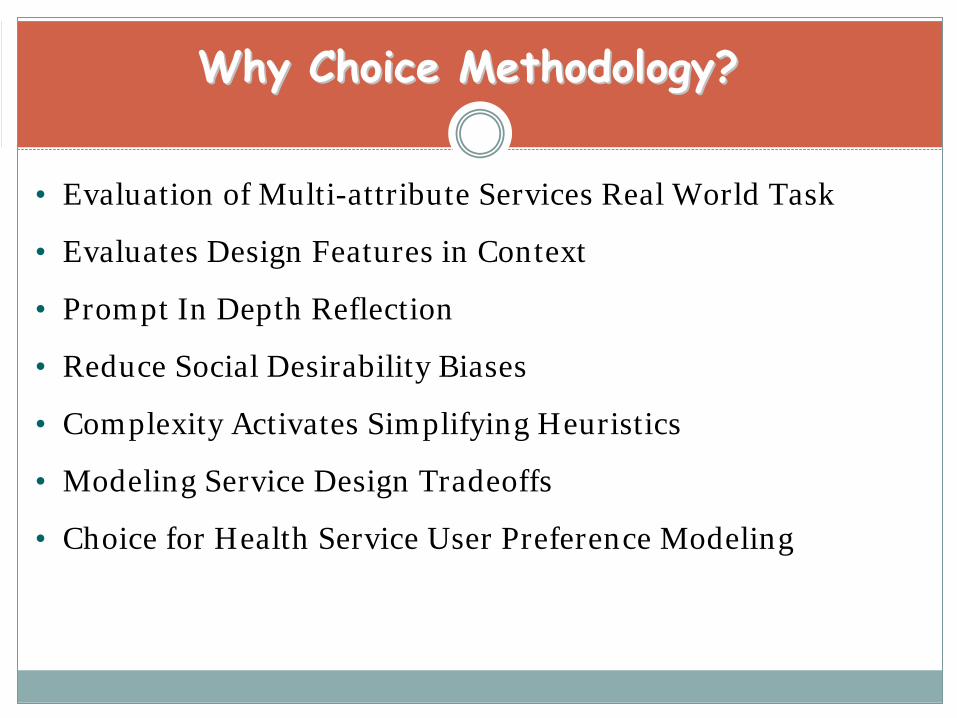
Why Choice Methodology? Why Choice Methodology?
• Evaluation of Multi-attribute Services Real World Task
• Evaluates Design Features in Context
• Prompt In Depth Reflection
• Reduce Social Desirability Biases
• Complexity Activates Simplifying Heuristics
• Modeling Service Design Tradeoffs
• Choice for Health Service User Preference Modeling
Individual Parameter Estimates with Hierarchical Bayes
Latent Class Segmentation Analysis
Multinomial Logit ->Standardized Utility Values
Standardized Importance Scores
Randomized First Choice Simulations
Project 2: Consumer Preference Modeling
Group vs Individual Approaches
-60
-40
-20
0
20
40
60
80
Me Alone Group of 10 Group of 20 Group of 50
Information Transfer Process
Utilit
y Va
lues
Group vs Individual Approaches
-60
-40
-20
0
20
40
60
80
Me Alone Group of 10 Group of 20 Group of 50
Information Transfer Process
Utilit
y Va
lues
All Groups Prefer to Work Alone
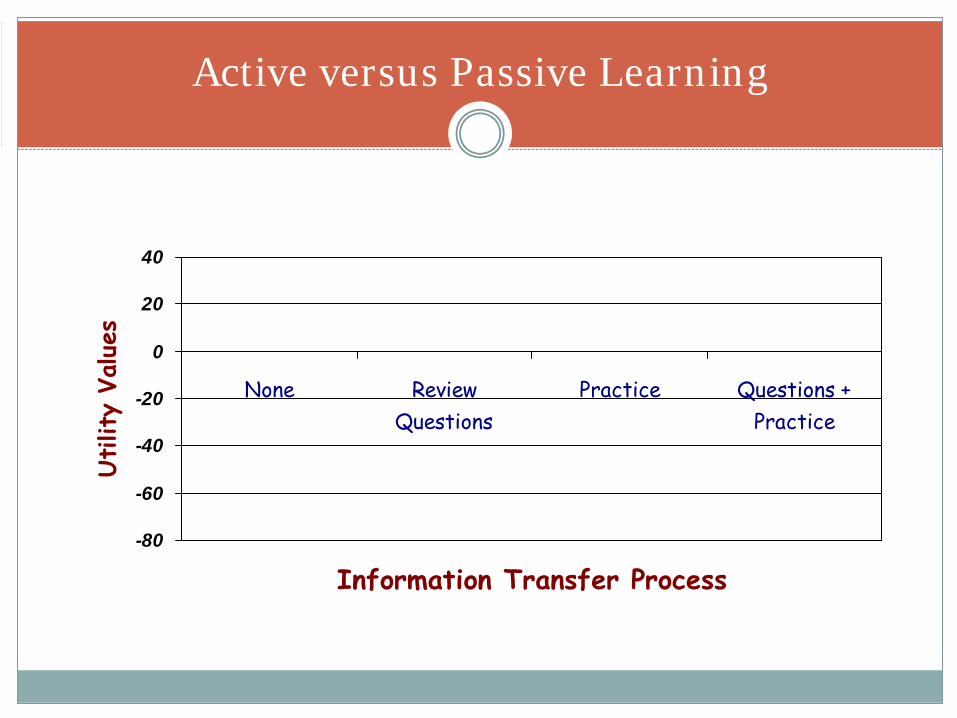
Active versus Passive Learning
-80
-60
-40
-20
0
20
40
None ReviewQuestions
Practice Questions +Practice
Information Transfer Process
Utilit
y Va
lues
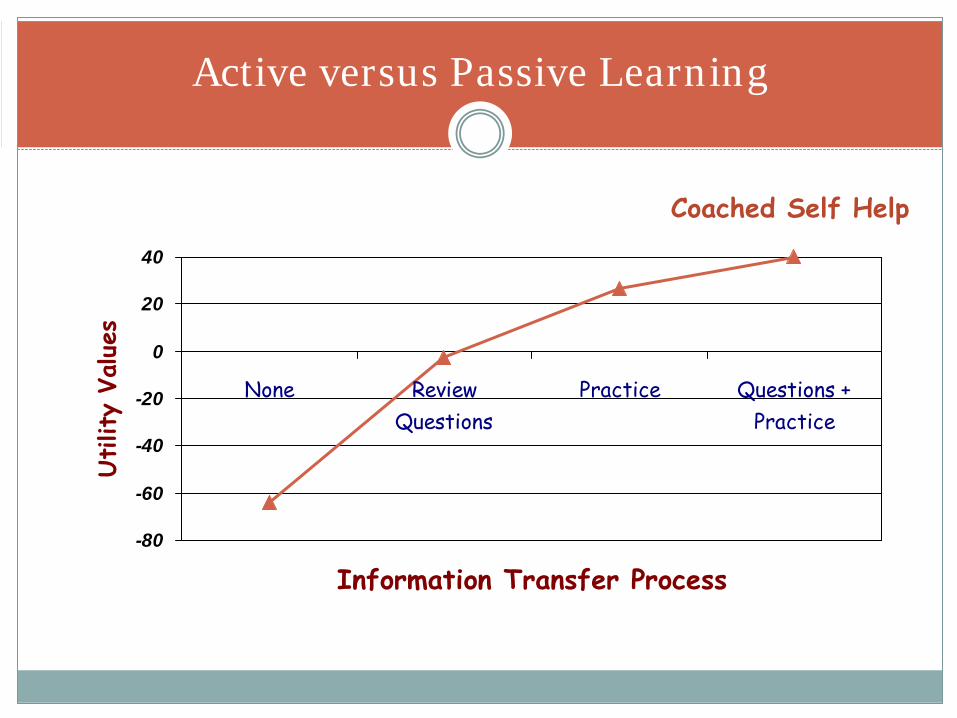
Active versus Passive Learning
-80
-60
-40
-20
0
20
40
None ReviewQuestions
Practice Questions +Practice
Information Transfer Process
Utilit
y Va
lues
Coached Self Help
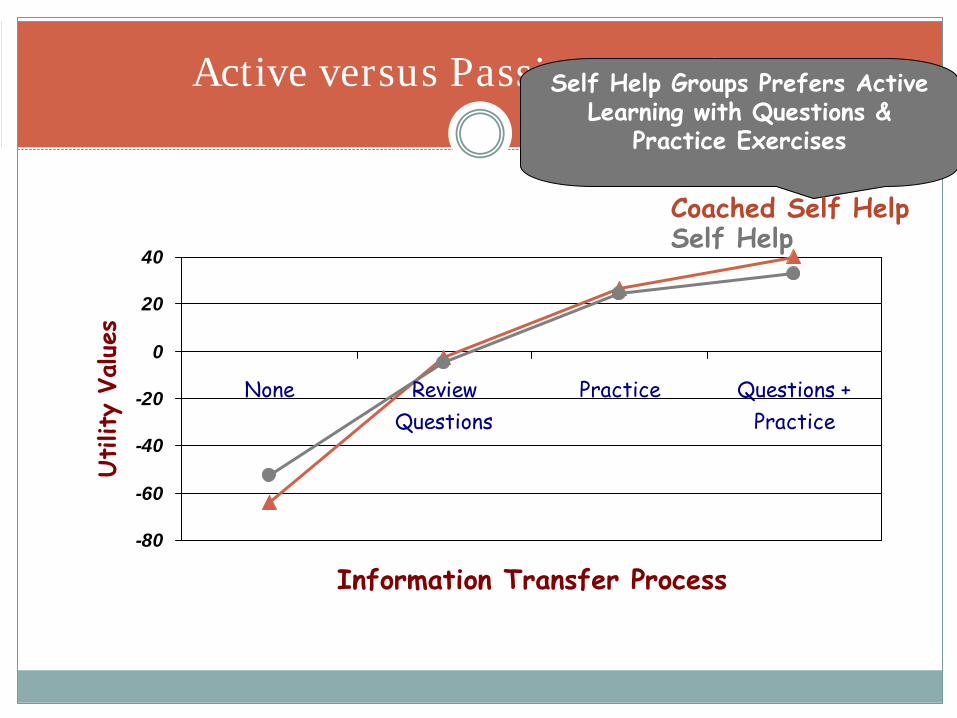
Active versus Passive Learning
-80
-60
-40
-20
0
20
40
None ReviewQuestions
Practice Questions +Practice
Information Transfer Process
Utilit
y Va
lues
Self Help Groups Prefers Active Learning with Questions &
Practice Exercises
Coached Self Help Self Help
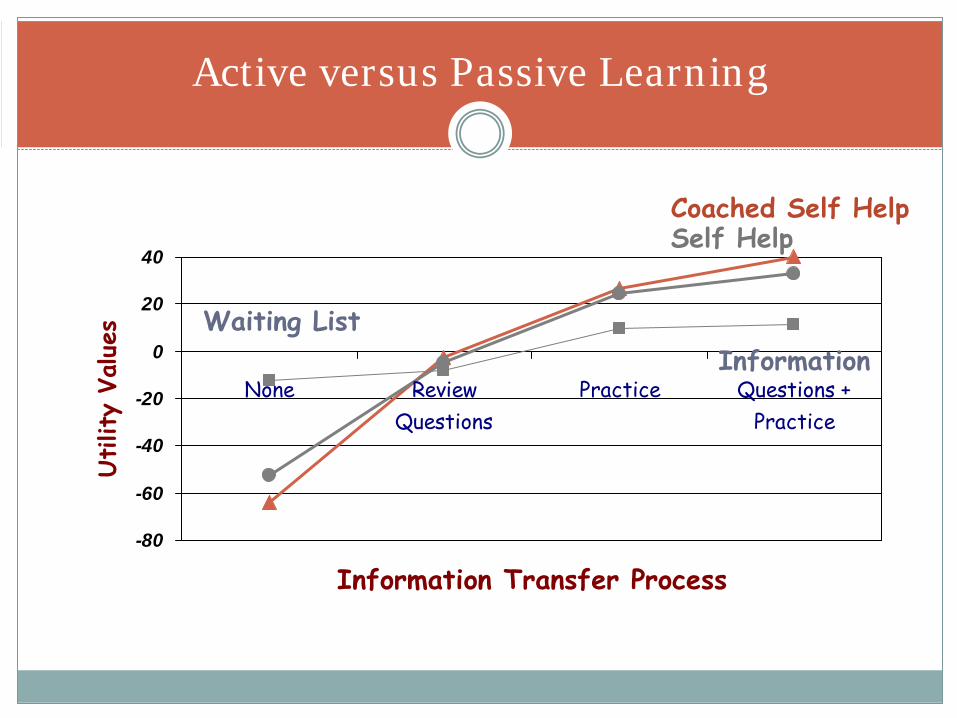
Active versus Passive Learning
-80
-60
-40
-20
0
20
40
None ReviewQuestions
Practice Questions +Practice
Information Transfer Process
Utilit
y Va
lues Waiting List
Information
Coached Self Help Self Help
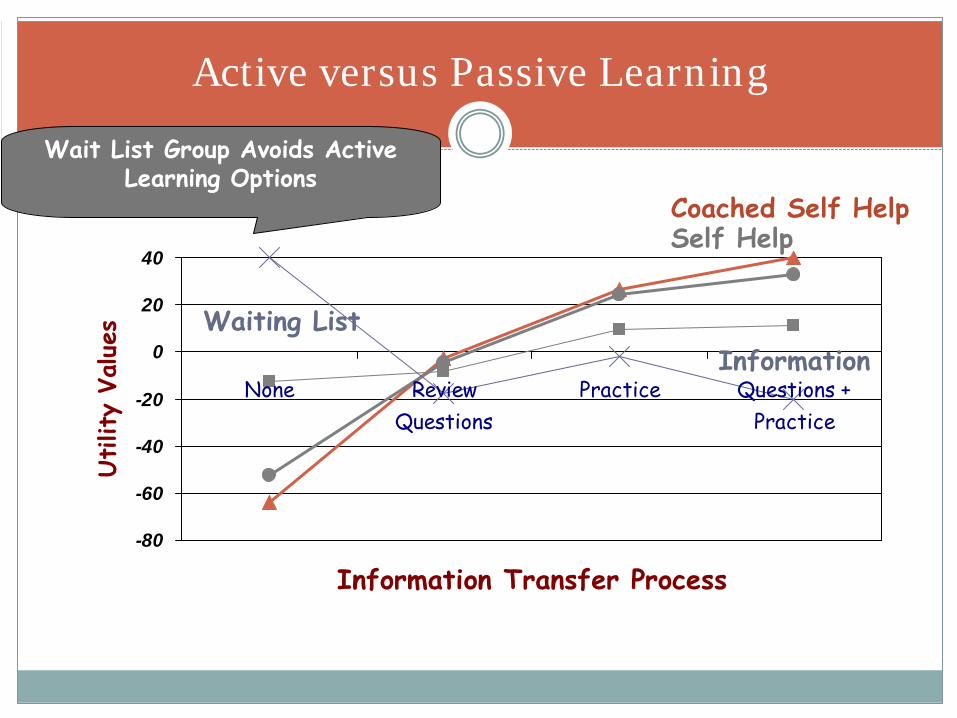
Active versus Passive Learning
-80
-60
-40
-20
0
20
40
None ReviewQuestions
Practice Questions +Practice
Information Transfer Process
Utilit
y Va
lues Waiting List
Information
Coached Self Help Self Help
Wait List Group Avoids Active Learning Options
-100
-75
-50
-25
0
25
50
Doesn't Help HelpsUnderstand
DescribesSolutions
Step-by-StepSolutions
Information Transfer Process
Utilit
y Va
lues
Information vs Step-by-Step Solutions
-100
-75
-50
-25
0
25
50
Doesn't Help HelpsUnderstand
DescribesSolutions
Step-by-StepSolutions
Information Transfer Process
Utilit
y Va
lues
Coached Self Help Prefers Step-by-Step Solutions
Coached Self Help
Information vs Step-by-Step Solutions
-100
-75
-50
-25
0
25
50
Doesn't Help HelpsUnderstand
DescribesSolutions
Step-by-StepSolutions
Information Transfer Process
Utilit
y Va
lues
Coached Self Help Self Help
Information vs Step-by-Step Solutions
-100
-75
-50
-25
0
25
50
Doesn't Help HelpsUnderstand
DescribesSolutions
Step-by-StepSolutions
Information Transfer Process
Utilit
y Va
lues
Information
Coached Self Help Self Help
Information vs Step-by-Step Solutions
-100
-75
-50
-25
0
25
50
Doesn't Help HelpsUnderstand
DescribesSolutions
Step-by-StepSolutions
Information Transfer Process
Utilit
y Va
lues
Waiting List Group Avoids Step-
by-Step Solutions
Waiting ListInformation
Coached Self Help Self Help
Information vs Step-by-Step Solutions
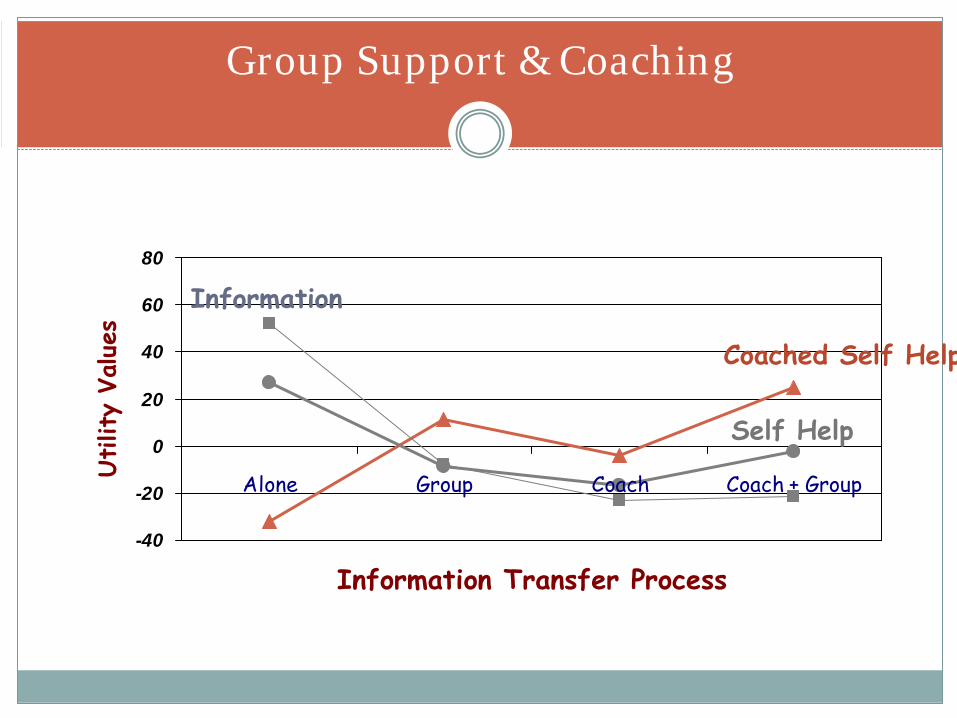
Group Support & Coaching
-40
-20
0
20
40
60
80
Alone Coach Group Coach + Group
Information Transfer Process
Utilit
y Va
lues
Coached Self Help Prefers Coach & Group supported Programs
Waiting ListCoached Self Help
Group Support & Coaching
-40
-20
0
20
40
60
80
Alone Group Coach Coach + Group
Information Transfer Process
Utilit
y Va
lues
Coached Self Help
Self Help
Group Support & Coaching
-40
-20
0
20
40
60
80
Alone Group Coach Coach + Group
Information Transfer Process
Utilit
y Va
lues
Information
Coached Self Help
Self Help
Group Support & Coaching
-40
-20
0
20
40
60
80
Alone Group Coach Coach + Group
Information Transfer Process
Utilit
y Va
lues
Self Help, Information, & Waiting List Prefer Working Alone
Information
Coached Self Help
Self Help
Waiting List
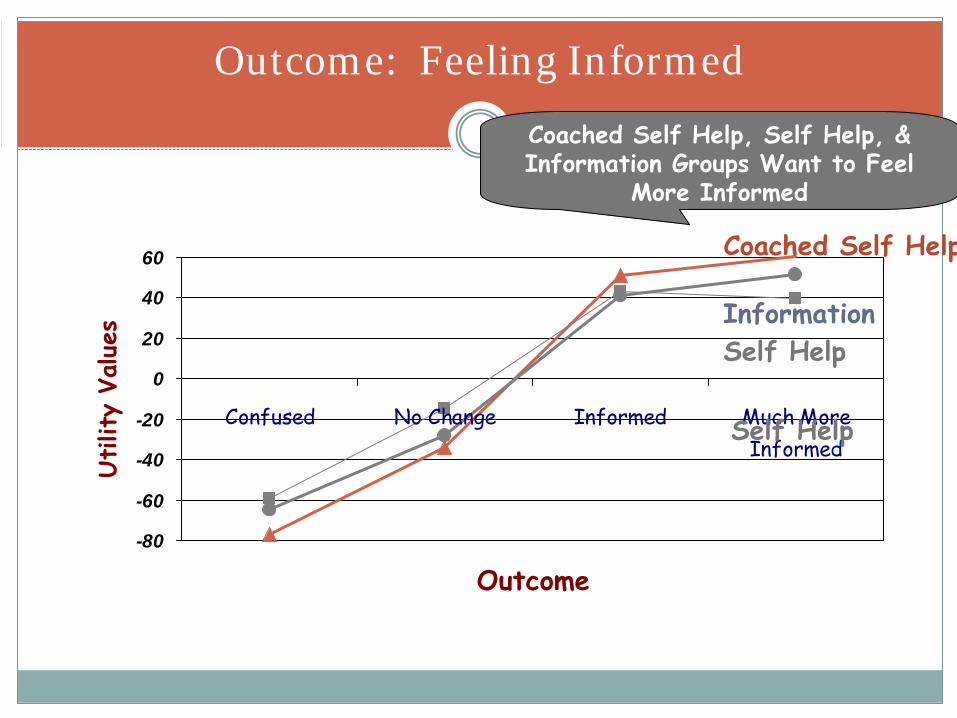
Outcome: Feeling Informed
-80
-60
-40
-20
0
20
40
60
Confused No Change Informed Much MoreInformed
Outcome
Utilit
y Va
lues
Outcome: Feeling Informed
-80
-60
-40
-20
0
20
40
60
Confused No Change Informed Much MoreInformed
Outcome
Utilit
y Va
lues
Coached Self Help
Outcome: Feeling Informed
-80
-60
-40
-20
0
20
40
60
Confused No Change Informed Much MoreInformed
Outcome
Utilit
y Va
lues
Self Help, Information, & Waiting List Prefer Working Alone
Information
Waiting ListCoached Self Help
Self Help Information
Outcome: Feeling Informed
-80
-60
-40
-20
0
20
40
60
Confused No Change Informed Much MoreInformed
Outcome
Utilit
y Va
lues
Coached Self Help, Self Help, & Information Groups Want to Feel
More Informed
Self Help
Coached Self Help
Information Self Help
Outcome: Feeling Informed
-80
-60
-40
-20
0
20
40
60
Confused No Change Informed Much MoreInformed
Outcome
Utilit
y Va
lues
Waiting List Prefers No Change in Feeling Informed
Information
Coached Self Help
Self Help
Waiting List
Feel Professionals Withhold Information
Feel Information Would Be Less Useful
Higher BCFPI Externalizing Scores
BCFPI Internalizing Scores Don’t Differ
Higher BCFPI Child Functional Impairment Scores
Higher BCFPI Impact on Family Scores
Higher BCFPI Parent Mood Scores
More Likely to Use the Internet
Characteristics of Those Preferring Waiting Lists
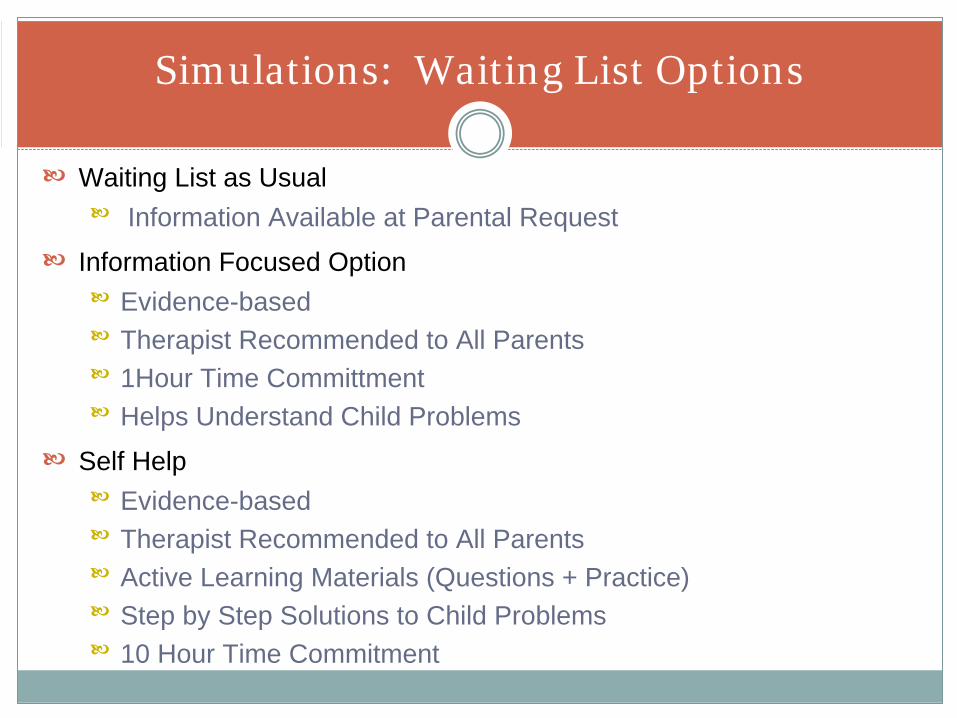
Waiting List as UsualInformation Available at Parental Request
Information Focused OptionEvidence-based Therapist Recommended to All Parents1Hour Time CommittmentHelps Understand Child Problems
Self HelpEvidence-based Therapist Recommended to All ParentsActive Learning Materials (Questions + Practice)Step by Step Solutions to Child Problems10 Hour Time Commitment
Simulations: Waiting List Options
Coach Supported Self-HelpEvidence-based
Therapist Recommended to All Parents
Active Learning Materials (Questions + Practice)
Step-by-Step Solutions to Child Problems
Weekly Calls from a Therapist Coach
Simulations: Waiting List Options
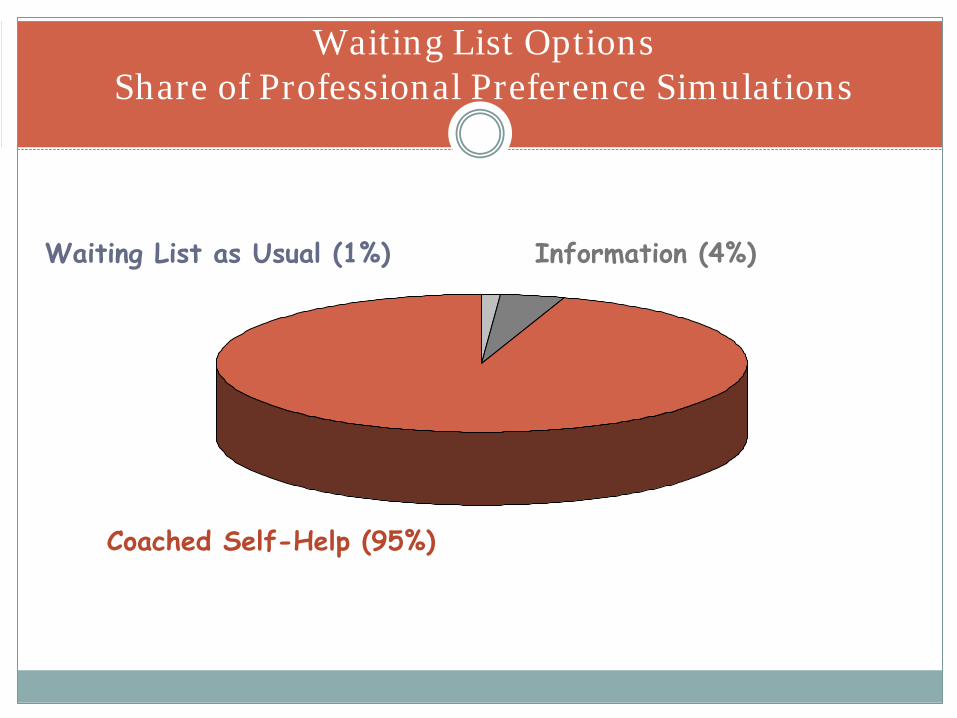
Waiting List Options Share of Professional Preference Simulations
Information (4%)Waiting List as Usual (1%)
Coached Self-Help (95%)
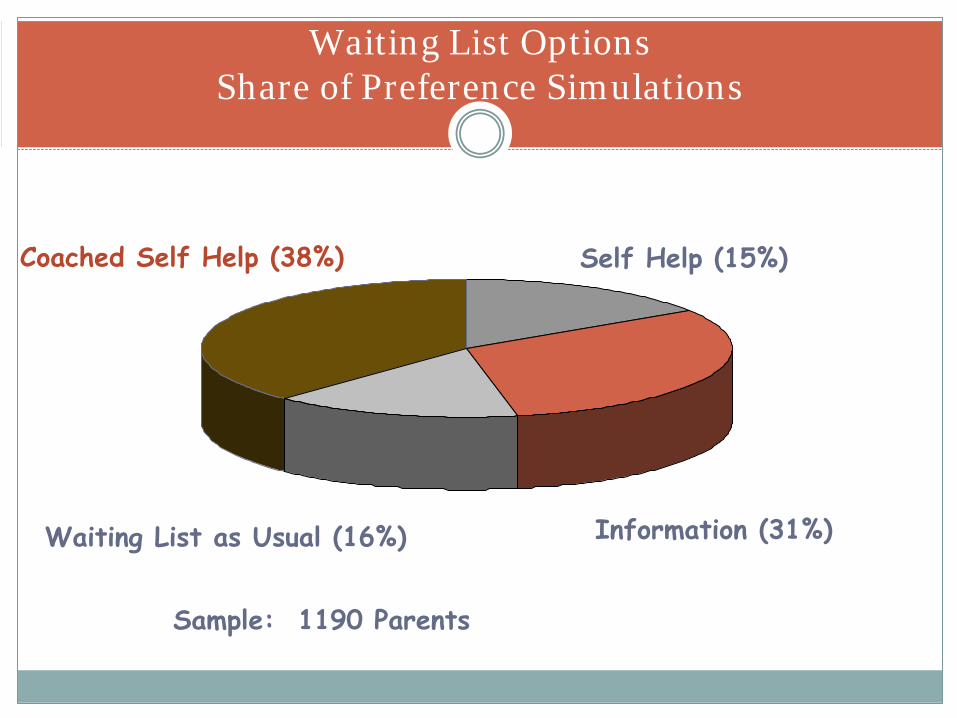
Waiting List Options Share of Preference Simulations
Waiting List as Usual (16%)
Coached Self Help (38%) Self Help (15%)
Information (31%)
Sample: 1190 Parents
Waiting Compounds Problems for Many Families
Families Pursue Many often Counterproductive Options
Logistical Burden May Compromise Utilization & Outcome
Multiple Contacts May Limit Engagement with Other Agencies
Frustration While Waiting Compromise Relations with Organizations
Multiple Agency Contacts Increase Cost Per Case – Limit Availability
Simulations Suggest Need for a Range of Waiting List Options
Parental and Professional Waiting List Option Preferences Differ
Systematic Reviews Support Parental Waiting List Preferences
Conclusions
Development and Evaluation of Family Help
Family Help Program: Bringing Health Home
Decision makers/clinicians/ researchers
Formal advisory groups
Informal discussion
Membership on management team
Have changed what is done
Mutual respect and communication
Family Help Program: Bringing Health Home
Primary Care, Distance Education Model
Treatment is delivered to families in the comfort and privacy of their own homes at times convenient to them
Early Intervention (mild -> moderate severity)
Goal: Intervene early before the problem gets worse
Uptake: Referrals Who Utilized Family HelpUptake: Referrals Who Utilized Family Help
Failed to Enroll (9.3%)
Enrolled (90.7%)
Source: McGrath 2006
Evaluation of Family Help
Number of children with ODD diagnosis in treatment & standard care
Evaluation of Family Help
Number of children with ADHD diagnosis in treatment & standard care
Evaluation of Family Help
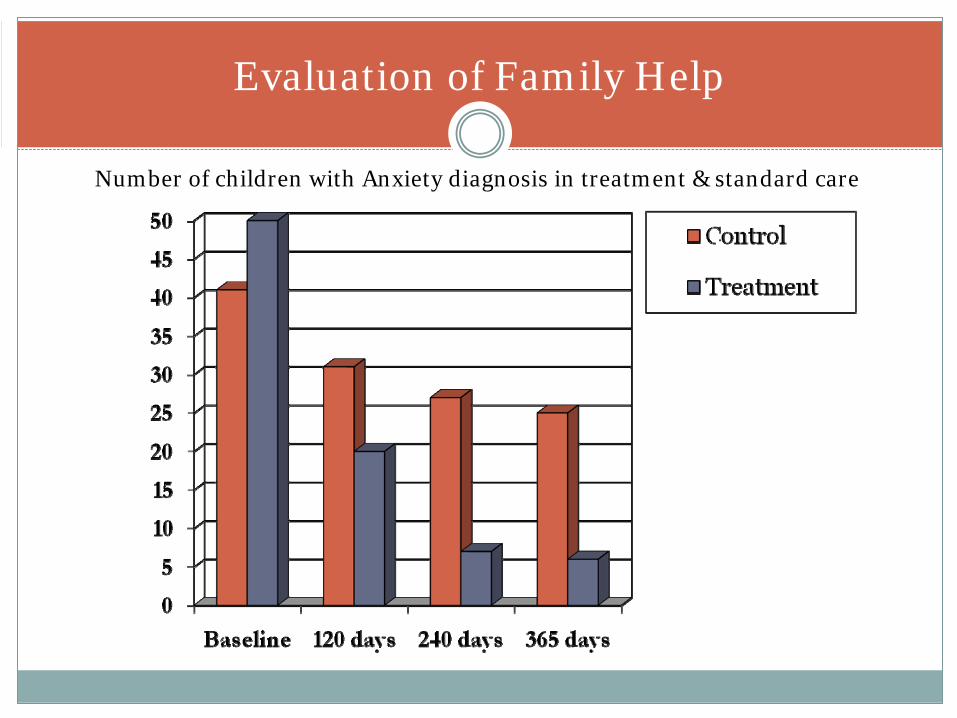
Number of children with Anxiety diagnosis in treatment & standard care
Family Help Service Program
Contracts with Mental Health Services in 2 NS health districtsReferred from waiting lists (self, physician or school referral) Screened using Brief Child Family Phone Interview (BCFPI) (Cunningham et al.)
Low self or other harmDisruptive behavior 3-12 yearsEnuresis (in one health district)
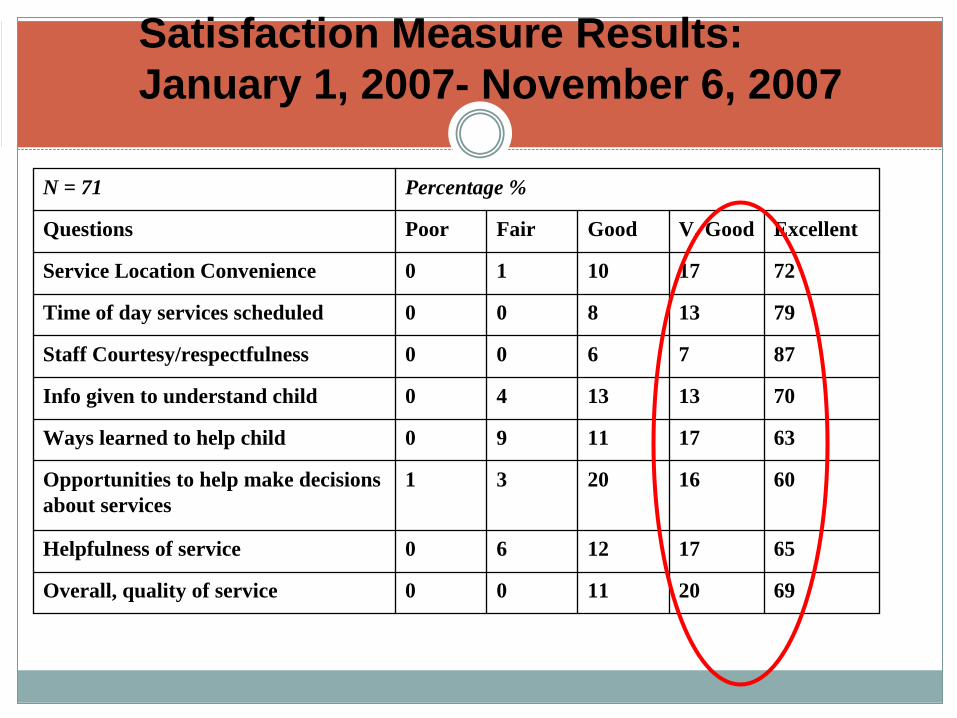
Satisfaction Measure Results: January 1, 2007- November 6, 2007
N = 71 Percentage %
Questions Poor Fair Good V. Good Excellent
Service Location Convenience 0 1 10 17 72
Time of day services scheduled 0 0 8 13 79
Staff Courtesy/respectfulness 0 0 6 7 87
Info given to understand child 0 4 13 13 70
Ways learned to help child 0 9 11 17 63
Opportunities to help make decisions about services
1 3 20 16 60
Helpfulness of service 0 6 12 17 65
Overall, quality of service 0 0 11 20 69
Research ProgramsResearch Programs Service ProgramsService Programs
Mom (Managing Our Mood)
Sleep Disorders
University student: Stress Anxiety Depression
Cancer in children
Juvenile arthritis
Obesity in children
IWK Family Help ProgramReferred by self, physician, IWK Central Referral Service