Page 1
Project Acronym and Title:
M4ShaleGas - Measuring, monitoring, mitigating and managing the
environmental impact of shale gas
Subsurface risks and impacts of shale gas operations
Authors and affiliation:
Jan ter Heege1
1TNO Petroleum Geosciences, Princetonlaan 6, Utrecht, the Netherlands
E-mail of lead author:
[email protected]
Project deliverable number: D6.2
Status: definitive
Disclaimer This report is part of a project that has received funding by the European Union’s Horizon 2020 research
and innovation programme under grant agreement number 640715.
The content of this report reflects only the authors’ view. The Innovation and Networks Executive Agency
(INEA) is not responsible for any use that may be made of the information it contains.
Published December 2017 by M4ShaleGas Consortium
Page 2
D6.2 Subsurface risks and impacts of shale gas operations Copyright © M4ShaleGas Consortium 2015-2017
Public introduction
M4ShaleGas stands for Measuring, monitoring, mitigating and managing the environmental impact of
shale gas and is funded by the European Union’s Horizon 2020 Research and Innovation Programme.
The main goal of the M4ShaleGas project is to study and evaluate potential risks and impacts of shale gas
exploration and exploitation. The focus lies on four main areas of potential impact: the subsurface, the
surface, the atmosphere, and social impacts.
The European Commission's Energy Roadmap 2050 identifies gas as a critical fuel for the transformation
of the energy system in the direction of lower CO2 emissions and more renewable energy. Shale gas may
contribute to this transformation.
Shale gas is – by definition – a natural gas found trapped in shale, a fine grained sedimentary rock
composed of mud. There are several concerns related to shale gas exploration and production, many of
them being associated with hydraulic fracturing operations that are performed to stimulate gas flow in the
shales. Potential risks and concerns include for example the fate of chemical compounds in the used
hydraulic fracturing and drilling fluids and their potential impact on shallow ground water. The fracturing
process may also induce small magnitude earthquakes. There is also an ongoing debate on greenhouse gas
emissions of shale gas (CO2 and methane) and its energy efficiency compared to other energy sources
There is a strong need for a better European knowledge base on shale gas operations and their
environmental impacts particularly, if shale gas shall play a role in Europe’s energy mix in the coming
decennia. M4ShaleGas’ main goal is to build such a knowledge base, including an inventory of best
practices that minimise risks and impacts of shale gas exploration and production in Europe, as well as
best practices for public engagement.
The M4ShaleGas project is carried out by 18 European research institutions and is coordinated by TNO-
Netherlands Organization for Applied Scientific Research.
Executive Report Summary
This report provides an integrated summary of the main hazards, impacts and risks of subsurface shale
gas operations. Risks assessment was based on a framework that consists of three components: (1) a
Markov Chain-type approach to describe the transition from a properly operating shale gas well (base
state) to absorbing states where incidents have caused contamination of shallow aquifers or problematic
seismicity, (2) a bow-tie approach to describe incidents that lead to a transition between states in terms of
its causes and effects with associated preventive and control measures, and (3) a risk assessment matrix
that classifies risks according to their probability of occurrence and effects. Probabilities of incidents (or
state transitions) and effects of incidents are based on the review of data from subsurface shale gas
operations in the U.S.A. and Canada as only for those countries sufficient data is available for a
meaningful statistical analysis. Limitations of the statistical analysis are that it does not take into account
differences in geological settings, regulatory frameworks and practices for hydrocarbon exploitation
between regions in the U.S.A. and Canada, or between North America and Europe. Also, causal relations
between operational characteristic and the occurrence of incidents are not taken into account. High
probabilities were found for out of zone fluid migration during stimulation or waste water injection, and
for problematic induced seismicity (M > 2) during waste water injection. Significant probabilities were
found for well damage or barrier failure that may lead to along well migration and leakage. Minor
probabilities were found for widespread surface contamination and for damaging induced seismicity that
may lead to risks for human health, safety and natural environment. Decommissioned, abandoned and
orphaned wells are a particular concern. Impacts of induced seismicity can be major and lead to highest
risks, in particular in relation to high volume fracturing or extensive waste water injection. The risk
assessment indicates that the main risks of operations in the subsurface are (1) contamination of shallow
aquifers, groundwater or drinking water resources due to upward migration of hazardous substances along
damaged or improperly constructed wells, and (2) structural damage to subsurface infrastructure as a
result of induced seismicity associated with waste water injection or hydraulic fracturing.
Page 3
D6.2 Subsurface risks and impacts of shale gas operations Copyright © M4ShaelGas Consortium 2015-2017
TABLE OF CONTENTS
Page
1 INTRODUCTION ................................................................................................................... 2
1.1 Context of M4ShaleGas ............................................................................................... 2
1.2 Study objectives for this report ..................................................................................... 3
1.3 Aims of this report ........................................................................................................ 3
1.4 Scope ............................................................................................................................ 3
2 DEFINITIONS, METHODOLOGY & DATA ....................................................................... 5
2.1 Definition of impacts, hazards, footprint and risks ...................................................... 5
2.2 Risk assessment methodology & framework ............................................................... 5
2.3 Data compilation, application & limitations .............................................................. 15
3 RESULTS & DISCUSSION ................................................................................................. 17
3.1 Risk assessment based on data from U.S.A. and Canada ........................................... 17
3.2 Surface contamination– Subsurface processes & risks .............................................. 18
3.3 Induced seismicity – Subsurface processes & risks ................................................... 19
3.4 Risk mitigation measures ........................................................................................... 20
3.5 Application to Europe ................................................................................................. 20
4 SUMMARY & CONCLUSIONS ......................................................................................... 24
5 REFERENCES ...................................................................................................................... 26
APPENDIX ................................................................................................................................... 30
Page 4
Page 2
D6.2 Subsurface risks and impacts of shale gas operations Copyright © M4ShaleGas Consortium 2015-2017
1 INTRODUCTION
1.1 Context of M4ShaleGas
Shale gas source rocks are widely distributed around the world and many countries have
now started to investigate their shale gas potential. Some argue that shale gas has
already proved to be a game changer in the U.S. energy market (EIA 20151). The
European Commission's Energy Roadmap 2050 identifies gas as a critical energy source
for the transformation of the energy system to a system with lower CO2 emissions that
combines gas with increasing contributions of renewable energy and increasing energy
efficiency. It may be argued that in Europe, natural gas replacing coal and oil will
contribute to emissions reduction on the short and medium terms.
There are, however, several concerns related to shale gas exploration and production,
many of them being associated with the process of hydraulic fracturing. There is also a
debate on the greenhouse gas emissions of shale gas (CO2 and methane) and its energy
return on investment compared to other energy sources. Questions are raised about the
specific environmental footprint of shale gas in Europe as a whole as well as in
individual Member States. Shale gas basins are unevenly distributed among the
European Member States and are not restricted within national borders, which makes
close cooperation between the involved Member States essential. There is relatively
little knowledge on the footprint in regions with a variety of geological and geopolitical
settings as are present in Europe. Concerns and risks are clustered in the following four
areas: subsurface, surface, atmosphere and society. As the European continent is
densely populated, it is most certainly of vital importance to understand public
perceptions of shale gas and for European publics to be fully engaged in the debate
about its potential development.
Accordingly, Europe has a strong need for a comprehensive knowledge base on
potential environmental, societal and economic consequences of shale gas exploration
and exploitation. Knowledge needs to be science-based, needs to be developed by
research institutes with a strong track record in shale gas studies, and needs to cover the
different attitudes and approaches to shale gas exploration and exploitation in Europe.
The M4ShaleGas project is seeking to provide such a scientific knowledge base,
integrating the scientific outcome of 18 research institutes across Europe. It addresses
the issues raised in the Horizon 2020 call LCE 16 – 2014 on Understanding, preventing
and mitigating the potential environmental risks and impacts of shale gas exploration
and exploitation.
1 EIA (2015). Annual Energy Outlook 2015 with projections to 2040. U.S. Energy Information
Administration (www.eia.gov).
Page 5
Page 3
D6.2 Subsurface risks and impacts of shale gas operations Copyright © M4ShaleGas Consortium 2015-2017
1.2 Study objectives for this report
The main objective of this report is to provide an analysis of quantified subsurface risks
and impacts of shale gas operations, specifically for geological and geopolitical settings
in Europe. The relations between incidents, probability of incident occurrence, effects or
impacts of incidents and risks are explored. The risk assessment need to account for
both causes and effects of incidents. Mitigation measures that lower risks are also
investigated. In evaluating measures to reduce the risks associated with incidents, both
measures that prevent the causes of incidents and measures that mitigate the impacts are
considered. In order to quantify and compare subsurface impacts and risks, consistent
risk assessment concepts are developed and applied to data of operations in the U.S.A.
and Canada. As commercial shale gas exploitation is mainly limited to the U.S.A. and
Canada, probabilities of incident occurrence and impacts are largely based on
experience and data from shale gas operations in North America. Where possible,
European data and implications for Europe are incorporated. The analysis aids in
identifying potential knowledge gaps related to impacts and risks of subsurface shale
gas operations, specifically when applied to Europe. The results will feed into the full
inventory of environmental risks and impacts of subsurface and surface operations for
shale gas exploration and exploitation. Accordingly, the work contributes to building a
European knowledge base on all risks, impacts and scientific recommendations for best
practices of shale gas operations.
1.3 Aims of this report
The report aims to (1) develop a consistent risk assessment framework for quantification
and comparison of impacts and risks of shale gas operations, (2) review data on impacts
and probability of occurrence for incidents related to subsurface shale gas operations in
the U.S.A. & Canada, and (3) compare incidents, impacts and risks with (conventional
gas) operations in Europe, and (4) discuss implications for subsurface shale gas
operations in Europe.
1.4 Scope
The M4ShaleGas project studies and evaluates the potential risks and impacts of shale
gas exploration and exploitation in four main areas of potential impact: the subsurface,
the surface, the atmosphere, and social impacts. This report focusses on the potential
incidents, impacts and risks of subsurface operations. It deals with subsurface
operations that start when drilling of the first shale gas well is commenced and end after
the well is decommissioned and long abandoned. The analysis focusses on potential
risks for human health, safety and natural environment that are can be associated with
subsurface operations. Other risks, such as economic risks associated with subsurface
shale gas operations are sometimes mentioned but not fully covered in the report. This
report focusses on comparing the most important incidents, impacts and mitigation
measures that have been identified in North America. This focus is chosen to keep the
report concise and avoid overlap with more comprehensive reviews of the individual
risks and mitigation measures in the subsurface that are also performed in the
Page 6
Page 4
D6.2 Subsurface risks and impacts of shale gas operations Copyright © M4ShaleGas Consortium 2015-2017
M4ShaleGas project (see for example Bohnhoff and Malin 2015; Cuss et al. 2015;
Garcia et al. 2015; Gawel et al. 2015; Osinga et al. 2015). Although there are strong
links with surface operations, for example concerning transport and handling of
fracturing fluids or methane emissions from pipelines, risks associated with surface
activities are not explicitly incorporated in the report. Analysis and integration of risks
associated with surface activities is the prime objective of other research activities in the
M4ShaleGas project2.
2 M4ShaleGas (http://www.m4shalegas.eu).
Page 7
Page 5
D6.2 Subsurface risks and impacts of shale gas operations Copyright © M4ShaleGas Consortium 2015-2017
2 DEFINITIONS, METHODOLOGY & DATA
2.1 Definition of impacts, hazards, footprint and risks
Within the context of this report, impacts are considered as direct effects resulting from
operations, hazards as potential incidents caused by operations that may affect human
health, safety and natural environment, and footprints as the permanent long term
effects on the natural environment. To define an appropriate risk assessment framework,
it is important to emphasize the difference between hazards or incidents, risks, the
likelihood or probability of an incident, and the causes and effects of an incident (e.g.,
Okrent 1980; Smith 2013). Throughout the report risks are defined as the combination
of the likelihood of an incident or hazardous event (e.g., loss of zonal isolation) and the
impacts or effects the incident has on human health, safety and natural environment
(e.g., the contamination of a shallow aquifer).
2.2 Risk assessment methodology & framework
In this study, risks are assessed for the full life cycle of a shale gas project, starting with
an exploration, planning and permitting phase and ending long (decades) after
decommissioning and abandonment up to the point in time when potential footprints
can no longer be recognized (Figure 1).
Figure 1 Full life cycle of a shale gas project with approximate timeline, starting with an exploration,
planning and permitting phase and ending long (decades) after decommissioning.
As much as possible, risks are based on available data from subsurface shale gas
operations in the U.S.A and Canada on the occurrence of incidents and their effects on
human health, safety and natural environment. If data is available, the probability of
incidents is based on the number of incidents in relative to the total number of shale
drilled or hydraulically fractured. If data is not available, the relative importance of risks
is assessed by comparison with risks for which data is available.
The risks assessment framework used to quantify and compare subsurface risks consists
of three components (cf. Van Thienen-Visser et al. 2013): (1) a Markov Chain-type
approach to describe the transition from a properly operating shale gas well (base state)
to absorbing states where incidents have caused contamination of shallow aquifers or
abandonmentde-commissioning
production & maintenance
completion & stimulation
drilling & cementing
well site construction
exploration, planning & permitting
10-30 yearsmonths - years months months weeks months decades
Page 8
Page 6
D6.2 Subsurface risks and impacts of shale gas operations Copyright © M4ShaleGas Consortium 2015-2017
problematic seismicity (Grimmett and Stirzaker 2003; Grinstaed and Snel 2009), (2) a
bow-tie approach to describe incidents that lead to a transition between states in terms
of its causes and effects with associated preventive and control measures (Figure 2, Van
Thienen-Visser et al. 2013), and (3) a risk assessment matrix that classifies risks
according to their probability of occurrence and effects (Figure 3, Energy Institute 2008;
De Mong et al. 2010; King 2012).
Figure 2 Bow-tie approach for risk assessment with incidents (I) leading to a transition between
states (Si to Sj). Risks associated with incidents are described in terms of its potential causes
(C) and effects (E) with associated preventive (PM) and control (CM) measures (seen Van
Thienen-Visser et al. 2013).
Figure 3 Risk assessment matrix that classifies risks (minor-intolerable) according to their
probability or likelihood of occurrence (class A-E) and severity of impacts or effects (class
1-5). Modified after Energy Institute (2008); De Mong et al. (2010); King (2012).
In the Markov Chain approach, the transition from a base state to (final) absorbing
states via different transient states (S) are considered (Grimmett and Stirzaker 2003;
po
ten
tial
effe
cts
(E)
incidentsor
hazards (I)
state (Si) prior toincident
state (Sj) after
incident
design inherent safety
organizational preventive measures
technical preventive measures
pre
ven
tive
mea
sure
s(P
M)
organizational control
measures
technical
control
measures
po
ten
tia
lcau
ses
(C)
con
tro
l m
easu
res
(CM
)
consequences increasing probability or likelihood
Operations Health Safety Environment
A B C D E
No known cases
Several known cases
1% of wells 1-10% of wells > 10% of wells
LEGEND
incr
eas
ing
eff
ect
or
seve
rity
1minor effect (only affects efficiency)
no effect no effect no effect
2
minor effect(changes in operations
required)
minor effect (no measures
required)
minor effects (existing
regulations
suffice)
minor damage (no
remediation
required)
minor risks(standard
monitoring & mitigation protocols)
3
moderate effect (some remediation
required)
moderate effect (some
measures required)
moderate effects (some precautions
required)
moderate damage
(remediation required)
moderate risks (additional
monitoring &
mitigation measures)
4
major effect (major
remediation required)
major effect (major
measures required)
major effects (major
precautions required)
major damage (extensive
remediation required)
high risks (implement risk
control & mitigation)
5catastrophic effect (failed operations)
major injuries or fatalities
loss of safe living
environment
irreversible damage
intolerable risks(shut-down,
remediation &
mitigations)
Page 9
Page 7
D6.2 Subsurface risks and impacts of shale gas operations Copyright © M4ShaleGas Consortium 2015-2017
Grinstaed and Snel 2009). A properly operating (incident-free) shale gas well is
considered as the base state (S = 0). The term “base state” should not be confused with
“baseline”. A “baseline” may be defined as a dynamic set of environmental conditions
that represent the expected range in conditions describing the natural state of a
particular region (hence before the construction of a well site and drilling, E. Hough
pers. comm.). In the Markov Chain approach defined here, the “base state” refers to the
incident-free status of a well after drilling, completion or decommissioning.
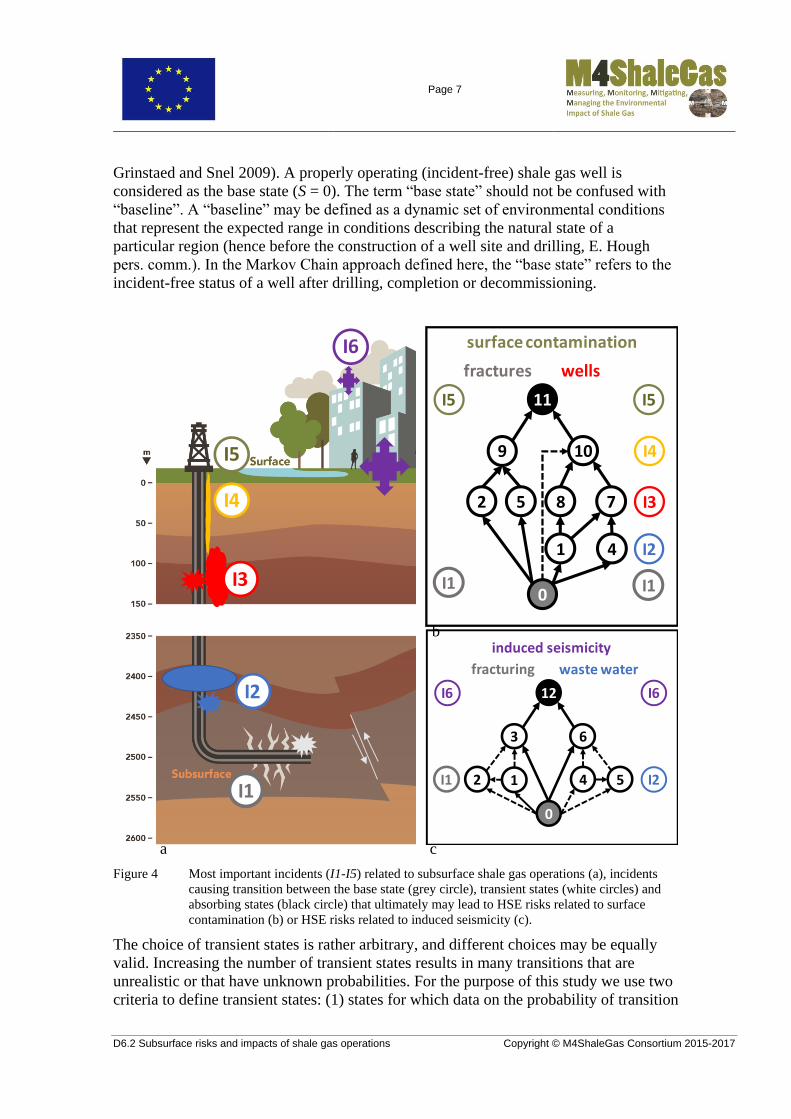
Figure 4 Most important incidents (I1-I5) related to subsurface shale gas operations (a), incidents
causing transition between the base state (grey circle), transient states (white circles) and
absorbing states (black circle) that ultimately may lead to HSE risks related to surface
contamination (b) or HSE risks related to induced seismicity (c).
The choice of transient states is rather arbitrary, and different choices may be equally
valid. Increasing the number of transient states results in many transitions that are
unrealistic or that have unknown probabilities. For the purpose of this study we use two
criteria to define transient states: (1) states for which data on the probability of transition
2
9 10
11
5 8 7
1
0
4
surface contamination
fractures wells
I5
I1 I1
I2
I3
I4
I5
I1
I2
I3
I5
I6
I4
I1
12
3 6
0
2 1 4 5
I6
induced seismicity
fracturing waste water
I2
I6
a
b
c
Page 10
Page 8
D6.2 Subsurface risks and impacts of shale gas operations Copyright © M4ShaleGas Consortium 2015-2017
from/to other states could be collected, (2) states which are considered important in
current shale gas operations (based on literature review). We tried to limit the number of
incidents and transient states as much as possible to focus on the main incidents and
risks, hence preventing blurry results with many states of uncertain occurrence (Figure
4; Table 1).
Table 1 Incidents (I), potential causes (C), potential effects (E), and states (S) considered for risk
assessment of subsurface operations in this study (cf. Figure 2).
The rationale behind the choice of transient states is explained in sections describing the
different scenarios that may lead to the absorbing states. The rationale between the
choice of absorbing states stems from previous reviews of best practices shale gas
operations in U.S.A. and Canada that have shown that the main risks of operations in
the subsurface on human health, safety and natural environment (HSE) are (1)
contamination of shallow aquifers, groundwater or drinking water resources due to
upward migration of hazardous substances (Darrah et al. 2014; Davies et al. 2014), and
(2) structural damage or damage to surface or subsurface infrastructure as a result of
induced seismicity caused by the reactivation of existing large-scale faults (Ellsworth
2013; Davies et al. 2013; Osinga et al. 2016; Wassing et al. 2016). Both risks can have
multiple causes. For example, upwards migration of hazardous substances may occur
along wellbores that are damaged or improperly constructed (more likely), or by
(induced) natural pathways of enhanced migration between stimulated fracture
disturbed rock volume and shallow aquifers (less likely, see TerHeege et al. 2016; U.S.
EPA 2016). Similarly, felt or problematic seismicity may result from large scale waste
water injection (more likely, Keranen et al. 2014) or high volume hydraulic fracturing
(less likely, NRC 2014). Accordingly, we consider states where incidents have caused
severe contamination of shallow aquifers (S = 11) or damaging seismicity (S = 12) as
two absorbing states. A total of 10 transient states describes the transition (S = i to S = j,
noted as i-j) between a properly operating well to a leaking well that potentially leads to
HSE risks related to surface contamination, or to a well that potentially leads to HSE
risks related to induced seismicity. The choice of transient states reflects these different
causal relations between shale gas operations and leakage or induced seismicity (Figure
IncidentI
Description Potential CausesC
Potential EffectsE
StatesS
base state* 0
1 problematic stimulation operations
12
subsurface response to stimulationimproper stimulation operations
123
well damage/barrier failureout of zone fluid migrationproblematic seismicity
123
2 problematic waste water injection (WWI)
34
subsurface response to WWIimproper WWI operations
123
well damage/barrier failureout of zone fluid migrationproblematic seismicity
456
3 well damage or integrity/barrier failure
51-4
well design, construction, P&Aoperational damage
22
along well fluid migrationalong well fluid migration
78
4 loss of fluid containment 67
leakage along fracturesleakage along wells
44
surface contaminationsurface contamination
910
5 surface contamination** 6-7 widespread leakage to surface 5 HSE risks (pollution) 11
6 problematic seismicity** 1-4 subsurface response to operations 6 HSE risks (structural damage) 12
Page 11
Page 9
D6.2 Subsurface risks and impacts of shale gas operations Copyright © M4ShaleGas Consortium 2015-2017
4). Hence, these choices lead to a total of 13 states with, theoretically, 169 transitions (i-
j). Transient states are considered to progressively evolve to the absorbing states if no
control measures are implemented (a “no intervention” scenario). It means that in theory
78 transitions (i-j with j > i) describe the transition from the base state to one of the
absorbing states. Of these, 39 are considered relevant (i.e. the transitions are associated
with specific processes that are relevant for shale gas operations). The full set of
realistic progressive state transitions with specific processes leading to the transition is
given in Appendix A1.
The probability of transition between states i and j is described by a transition
probability matrix Pi-j of dimension i x j (i = j = 13 for the total number of states Stot =
13 considered). All probabilities are based on a review of data from shale gas operations
in the U.S.A. and Canada (Figure 5). As all states are considered to evolve from the
base state (S = 0) towards the absorbing states (S = 11, S =12) without control measures,
probabilities are only considered progressive state transitions (Pi-j with j > i). Note that
even for the relative limited number of states chosen, several transitions can be
considered irrelevant, or have probabilities that are unknown or only be given relative to
known probabilities for other transitions. A total of 39 transitions are considered to be
relevant, despite the absence of data to estimate for transition probabilities (Appendix
A1). Transition probabilities are considered for the full lifetime of a well in a shale gas
project (Figure 1), and are based on to the number of wells considered (Figure 5).
States may fall back to a previous state (i-j with j < i) if control measures are
implemented (Figure 5). The general control measures considered in this study (Table 2)
result in 18 fall back transients (Figure 5). As state transitions are considered for the full
lifetime of a well in a shale gas project, it means that without control measures states
remain occupied over the full lifetime of the project. Preventive measures (Table 2) may
avoid occupation of states (Figure 5). Some risk assessment studies adopt a Markov
Chain approach with certain retention times assigned to states to account for the fact
that states may fall back without intervention over characteristic timescales (Van
Thienen-Visser et al. 2013). Although this type of fall back may be relevant for some
states, this type of fall back is no considered in this study. As an example, no control
measure may be required if seismicity only occurs during hydraulic fracturing after
which a well falls back to the base state and operates without incidents.
One of the advantages of the Markov Chain approach is that the direct transition from
the base to adsorbing state can be compared with the transitions between base, transient
and adsorbing states (Grimmett and Stirzaker 2003; Grinstaed and Snel 2009; Van
Thienen-Visser et al. 2013). If transition probabilities between the base and adsorbing
states are known, they can be used as additional constraints on probabilities of
transitions between transient states should data be lacking (e.g., Pi-m = Pi-jPj-kPk-lPk-m for
a transition between base state i and absorbing state m via transient states j, k, l). Further
constraints on transition probabilities can be incorporated by considering that the well
must be in one of the states considered (j Pi-j = 1 for all i).
Page 12
Page 10
D6.2 Subsurface risks and impacts of shale gas operations Copyright © M4ShaleGas Consortium 2015-2017
Figure 5 Transition probability matrix for all 13 states with estimates of probabilities (Pi-j) for
transitions between different states (in percentage of wells or events relative to total number
of wells investigated. Lower (top numbers) and upper bounds (lower numbers) on
probabilities are quoted. In some cases, a range of values is given for a bound (for example
if analysis for different regions are available). Lower bounds mainly reflect the number of
incidents associated with wells relative to the total number of wells drilled in the U.S.A.
(for example, as used in NRC 2013 and reflected by U.S. EPA 2016). Upper bounds mainly
reflect the number of wells with incidents relative to the total number of wells in certain
regions that show elevated number of incidents (for example, as analysed by Walsh and
Zoback 2015 or Atkinson et. al 2016 for induced seismicity). Numbers between brackets in
italics are inferred from other values: (1) upper bounds for well damage/barrier failure and
out of zone fluid migration for hydraulic fracturing are taken for waste water injection
wells, (2) surface contamination due to well damage or out of zone fluid migration (related
to hydraulic fracturing or waste water injection) is assumed to occur by along well fluid
migration (P1-10 = P2-10 = P4-10 = P7-10) as no evidence for direct fracture-related pathways to
surface have been found for shales below ~1.5 km (U.S. EPA 2016), (3) no known cases
for contamination resulting from seismic events related to hydraulic fracturing in
accordance with absence for waste water injection (see U.S. EPA 2016, no cases for P3-9,
P3-10, P6-9). See section 3.1 for definition of barrier failure. Data is based on the following
studies (superscripts are mostly first letter of first author linking values in table to studies
below, USDEPP- US Department of Environmental Protection of Pennsylvania online
database of oil and gas wells):
state i
state j
0 1 2 3 4 5 6 7 8 9 10 11 12
LEGEND
0PM
1CM
1CM2, 3
CM2
CM1
CM2, 3
CM2
base state
12.3u-2.4c
6.0u-6.3d
PM3, 4
absorbingstates
21.0t
17.0t (> P0-2)PM2, 4
CM1, 3
CM1, 3
Pi-j [%]transitionprobability
31 casen
0.3a ( P0-3) (> P0-3)PM
2, 4, 6CM2, 5
Pi-j [%]no cases (A)/somecases (B)
4 (6.3) N/A N/A N/APM3, 4
Pi-j [%] 1% of wells (C)
5 (17) N/A N/A N/A (> P0-5)PM2, 4
CM1, 3
CM1, 3
Pi-j [%]1-10% of wells (D)
69 casesn
1a-32w N/A N/A N/A ( P0-6) ?PM
2, 4, 6CM2, 5
Pi-j [%]> 10% of wells (E)
7 (< P1-7) 0.2v-0.3u (> P1-7) N/A (> P1-7) (> P1-7) N/APM3, 4
CM4, 6
CM4, 6
CM4, 6
?unkown
probability
8 ( P1-7) (< P1-7) 1.0u ? (< P1-7) ? ? N/APM3, 4
CM4, 6
CM4, 6
CM4, 6
N/Anot
applicable
9 N/A* N/Ano
casesU N/A N/Ano
casesU N/A N/A N/APM4, 5
10 0.1-0.2k (< P7-10) (< P7-10)(no
cases)? 1 casez no
casesU
casesk,z
0.2b,c-1.3d
10 casesu N/A
PM3, 5
CMcontrol
measures
11 N/A N/A N/A N/A N/A N/A N/A N/A N/Acausal
relations?
causalrelations
?
PM5
PMpreventivemeasures
12 N/A N/A N/Asome
casesa,n N/A N/Asome
casesa,n,w N/A N/A N/A N/A N/APM
6
Page 13
Page 11
D6.2 Subsurface risks and impacts of shale gas operations Copyright © M4ShaleGas Consortium 2015-2017
a Atkinson et al. (2016) induced seismicity of M 3 associated with hydraulic fracturing (S
= 3) for 39 out of 12289 hydraulically fractured wells (upper bound P0-3 = 0.3%) or
associated with and waste water disposal (S = 6) for 17 out of 1236 disposal wells (upper
bound P0-6 = 1% associated with M 3) in Western Canada (~454000 km2 foothills region
of the Western Canada Sedimentary Basin near the border between Alberta and British
Columbia). The values are based on statistical spatiotemporal relationship between shale
gas operations and seismicity. The data includes well-studied cases for (1) the Horn River
Basin (131 events with ML 3.6 in 2011, Farahbod et al. 2015), (2) the Exshaw Formation
near Cardston (60 events with ML 0.7-3.0 between December 2011 and March 2012,
Schultz et al. 2015a), (3) the Duvernay Formation near Fox Creek (>184 events with
maximum ML 4.4 between November 2013 and January 2015, Schultz et al. 2015b;
Atkinson et al. 2015), the Montney Basin (193 events attributed to hydraulic fracturing with
maximum ML 4.6 and 38 attributed to waste water injection, BCOGC 2012; 2014; 2015).
See also the summaries in Osinga et al. (2015); Wassing et al. (2016).
b Brantley et al. (2014) based on USDEPP for 3533 Marcellus Shale wells in Pennsylvania
drilled from 2005-2013, well construction violations (S = 1) for 3.4% of wells (P01 =3.4%),
and methane migration into groundwater (S = 10) for 0.2% of wells (P7-10 =0.2%). See also
Davies et al. (2014); U.S. EPA 2016).
c Considine et al. (2014) based on USDEPP for Marcellus Shale wells in Pennsylvania
drilled from 2008-2011, well barrier or integrity failure in ~2.6% of 3533 wells, of which
~2.4% well damage (S = 1) in the form of casing or cementing failures (lower bound P0-1 =
2.4%) and ~0.2% surface contamination (S = 10) in the form of blowouts, venting or gas
migration (bound on P1-7 = 0.2%). See also summaries in Davies et al. (2014) and U.S. EPA
(2016).
` d Davies et al. (2014) based on USDEPP for 8030 Marcellus Shale wells in Pennsylvania
drilled from 2005-2013, well barrier or integrity failure in ~6.3% (upper bound P0-1 = 6.3%)
with ~1.3% of wells leaking to the surface (S = 10, upper bound on P7-10 = 1.3%). Similar
number for loss of structural integrity in 211 out of 3391 (P0-1 = 6.2%) wells from 2000-
2012 (Ingraffea et al. 2014, see also U.S. EPA 2016). We assume that values for “well
barrier or integrity failure” and “loss of structural integrity” are representative of well
damage after hydraulic fracturing that does not necessarily has caused along well fluid
migration (S = 1).
f Fleckenstein et al. (2015), well barrier failure (S = 1) in 401 out of 16828 wells (P01 =
2.4%) and catastrophic well failure leading to drinking water contamination in 10 out of
16828 wells (P7-10 = 0.06%) for unplugged vertical wells in the Wattenberg field, Colorado,
U.S.A. drilled between 1970-2013 (see also U.S. EPA 2016). Note that no evidence for
hydrocarbon migration was found for horizontal wells used for shale development, but the
numbers are relevant for vertical shale wells that may be drilled.
k Kell (2011), groundwater contamination incidents (S = 10) related to drilling &
completion, plugging & site reclamation, and orphaned wells & sites for (1) the state of
Ohio during a 25 year (1983-2007) study period for ~65000 producing wells (1991 high)
showing 120 incidents (out of total 185 incidents, lower bound on P0-10 = 0.2%), (2) the
state of Texas during a 16 year (1983-2008) study period for ~250000 producing wells (in
2008) showing 41 incidents (out of total 211 incidents, lower bound on P0-10 = 0.1%). No
incidents were found that were associated with hydraulic fracturing. See also King (2012)
and U.S. EPA (2016).
n NRC (2013), potentially problematic seismicity associated with (1) hydraulic fracturing (S
= 3) in the U.S.A. based on 16 M > 2 events (Mmax 2.8, ML 2.9) that occurred in the Eola
Field, South-Central Oklahoma in 2011 (Holland 2013) for estimated total of 35000
hydraulically fractured wells in the U.S.A (lower bound on P03), (2) waste water disposal (S
= 6) in the U.S.A. based on 9 felt induced events (moment magnitude Mmax 4.8) that
occurred in different states (lower bound on P06).
Page 14
Page 12
D6.2 Subsurface risks and impacts of shale gas operations Copyright © M4ShaleGas Consortium 2015-2017
t This study, based on probability that the height (Hf) of fractures (i.e. the top of upward
propagating fractures mapped using microseismic events) exceed the maximum thickness
(Tmax) of different shales in the U.S.A. (upper bound Tmax from EIA 2017, Hf from Fisher
and Warpinski 2012; probability that Hf exceed Tmax from Davies et al. 2012). Analysis
based on Eagle Ford (~1% larger than Tmax = 180 m), Woodford (~10% larger than Tmax =
125 m), Barnett (~1% larger than Tmax = 275 m), Marcellus (~17% larger than Tmax = 215
m), Niobrara (<1% larger than Tmax = 500 m) giving lower and upper bounds for out of
zone fluid migration (S = 2) of P02 = 1% and P02 = 17%. Note that these values represent
lower estimates for upward fracture propagation beyond the top of the shale as in many
locations T << Tmax. Also, fracture propagation distance does not necessarily equate to fluid
migration distance; Hf may be larger than migration distance if fractures are non-conductive
or it may be smaller if micro-seismicity does not reflect the full upward propagation of
fractures (e.g., due to detection limits or aseismic deformation). A case study by Hammack
et al. (2014) of 6 horizontal Marcellus Shale wells found fractures extending 300-580 m
above the top of the shale in 3 wells (50%), and 40% of the micro-seismic events above the
overlying Tully Limestone (still maintaining a minimum of 2000 meter separation between
the events and drinking water aquifers).
u U.S. EPA (2016), well file review of 323 hydraulically fractured oil and gas production
that are statistically representative of ~23200 onshore oil and gas production wells (cf.
Figure 6) hydraulically fractured (~28500 hydraulic fracturing jobs) in 2009-2010 by nine
service companies: (1) Mechanical integrity failure (S = 1) in 800 frac jobs (2.8% giving a
lower bound on P0-1 = 2.3% for hydraulically fractured wells), (2) loss of fluid containment
(S = 7) in 100 frac jobs (0.4% giving a bound P1-7 = 0.3% for hydraulically fractured wells),
(3) well failure rates (S = 1) highest (6%) for re-completed or re-fractured wells (upper
bound for P0-1 = 6.0%), (4) no known cases of surface contamination by leakage along fault
and fractures (S = 9) if the vertical and lateral separation between the production zone and
drinking water resources is above ~1.5 km (no cases for P2-9, note that 1.5 km is a relevant
separation for most shales in Europe, and that half of wells in the review have > 2000 m
separation between wellbore and operator-reported base of the protected groundwater
resource, Figure 7), (5) 10 cases of surface contamination (spills, (S = 10) due to migration
along fractures and offset wells (P8-10), (6) 280 wells with along well fluid migration (S = 8)
due to well communication by fractures interconnecting nearby wells (P28 = 1.0%), (6) no
known cases for contamination resulting from seismic events related to injection in class II
disposal wells (statement in U.S. EPA 2016, no cases for P6-10).
v Vidic et al. (2013) based on USDEPP for Marcellus Shale wells in Pennsylvania drilled
from 2008-2013, well barrier leakage (S = 1) in 219 out of 6466 wells (P01 = 3.4%), and 16
out of 6466 well required prevention measures for fluid migration (S = 7, P17 = 0.2%). See
also Davies et al. (2014); U.S. EPA (2016).
w Walsh and Zoback (2015), potentially problematic seismicity associated with waste water
disposal (S = 6) in Oklahoma based on increase number of events in 2011-2015 that is
mainly attributed to 5- to 10-fold increases in the rates of saltwater disposal (~2250 events
M > 2.5 for total number of 7000 disposal wells between 2011 and 2015). We use these
data as an upper bound on P0-6 = 32%). Note that this probability does not indicate that 32%
of the wells can be associated with M > 2.5 seismicity (in contrast to Atkinson et al. 2016
who determined a spatiotemporal relationship between shale gas operations and seismicity).
Seismicity in Oklahoma is related to the large injected volumes of waste water disposal,
and the number merely relates the number of events to the scale of disposal operations (in
terms of number of wells) in Oklahoma. Seismicity is concentrated in specific areas
including the area near Prague with maximum Mw 5.7 that injured 2 people and caused
damage to a large number of buildings and pavement (Ellsworth 2013; Keranen et al.
2013).
z Several cases of surface water contamination related to shale gas operations (S = 10): (1)
Cases related to Marcellus Shale gas wells include contamination of nearby drinking water
Page 15
Page 13
D6.2 Subsurface risks and impacts of shale gas operations Copyright © M4ShaleGas Consortium 2015-2017
wells (cases for P7-10) with (a) elevated methane, ethane and propane concentrations in the
vicinity of gas wells with isotopic and chemical signatures characteristic of a Marcellus-like
source (Jackson et al. 2013), (b) hydrocarbons and noble gas isotopic compositions that was
linked to gas leakage by failure of cement at depth (Darrah et al. 2014), (c) chemical
signatures consisting of organic compounds and a chemical compound also identified in
flow-back (Llewellyn et al. 2015), (2) U.S. EPA (2016) gives several examples of
contamination associated with hydraulic fracturing of wells in other areas, mainly in wells
with (a) insufficient or improperly placed cement, (b) limited vertical separation between
the production zone and drinking water resources, and (c) limited distance to improperly
constructed offset wells or conductive natural faults or fractures (cases for P7-10), (3) Akob
et al. (2016) give an example of surface water contamination around a disposal facility,
which could have been caused by waste water injection although the hydrological pathway
could not be assessed (1 case for P5-10).
The current approach may be extended by considering retention times (tr) or
uninterrupted occupation time of transient states, providing quantified constraints on the
diagonal elements of the transition probability matrix (Pi-i = 1- tr-1, Van Thienen-Visser
et al. 2013). As the current Markov Chain approach is based on available data from
shale gas operations in the U.S.A. and Canada, focus was on incorporating and these
additional constraints were not considered.
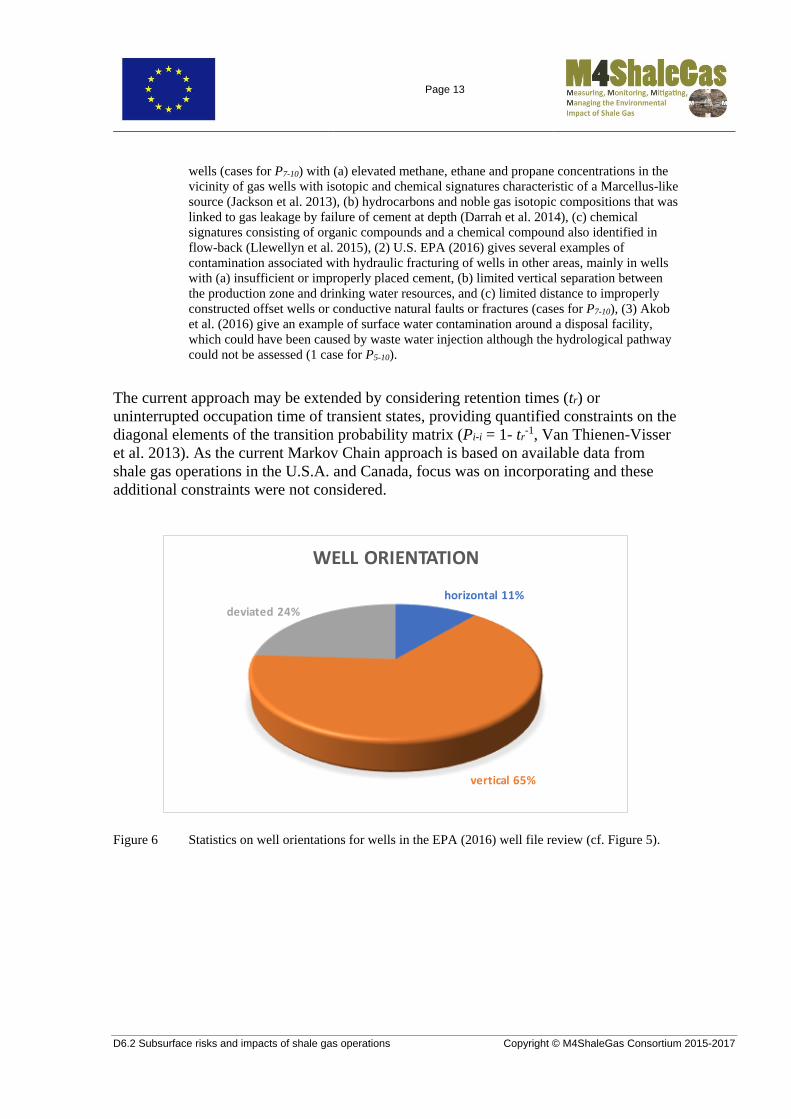
Figure 6 Statistics on well orientations for wells in the EPA (2016) well file review (cf. Figure 5).
horizontal 11%
vertical 65%
deviated 24%
WELL ORIENTATION
Page 16
Page 14
D6.2 Subsurface risks and impacts of shale gas operations Copyright © M4ShaleGas Consortium 2015-2017
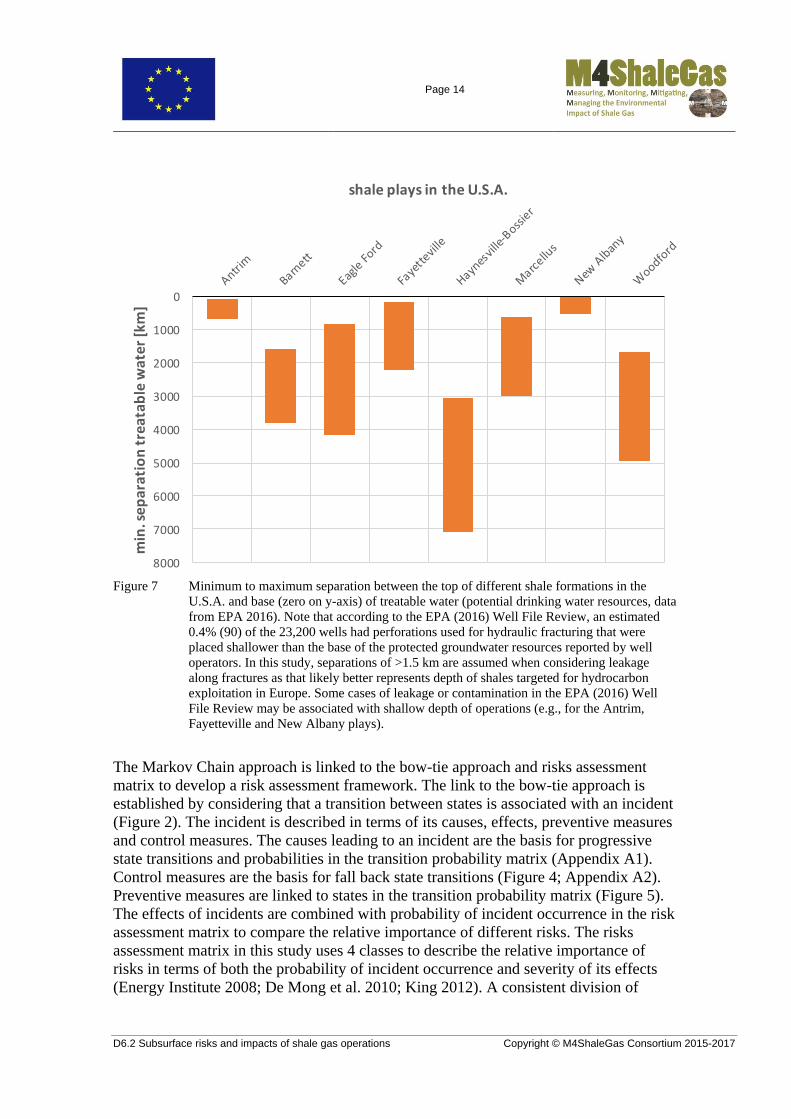
Figure 7 Minimum to maximum separation between the top of different shale formations in the
U.S.A. and base (zero on y-axis) of treatable water (potential drinking water resources, data
from EPA 2016). Note that according to the EPA (2016) Well File Review, an estimated
0.4% (90) of the 23,200 wells had perforations used for hydraulic fracturing that were
placed shallower than the base of the protected groundwater resources reported by well
operators. In this study, separations of >1.5 km are assumed when considering leakage
along fractures as that likely better represents depth of shales targeted for hydrocarbon
exploitation in Europe. Some cases of leakage or contamination in the EPA (2016) Well
File Review may be associated with shallow depth of operations (e.g., for the Antrim,
Fayetteville and New Albany plays).
The Markov Chain approach is linked to the bow-tie approach and risks assessment
matrix to develop a risk assessment framework. The link to the bow-tie approach is
established by considering that a transition between states is associated with an incident
(Figure 2). The incident is described in terms of its causes, effects, preventive measures
and control measures. The causes leading to an incident are the basis for progressive
state transitions and probabilities in the transition probability matrix (Appendix A1).
Control measures are the basis for fall back state transitions (Figure 4; Appendix A2).
Preventive measures are linked to states in the transition probability matrix (Figure 5).
The effects of incidents are combined with probability of incident occurrence in the risk
assessment matrix to compare the relative importance of different risks. The risks
assessment matrix in this study uses 4 classes to describe the relative importance of
risks in terms of both the probability of incident occurrence and severity of its effects
(Energy Institute 2008; De Mong et al. 2010; King 2012). A consistent division of
0
1000
2000
3000
4000
5000
6000
7000
8000
min
. sep
arat
ion
tre
atab
le w
ater
[km
]
shale plays in the U.S.A.
Page 17
Page 15
D6.2 Subsurface risks and impacts of shale gas operations Copyright © M4ShaleGas Consortium 2015-2017
classes (and consistent colour coding) is used for the probability of transition between
states (Figure 5) as to derive a consistent risk assessment framework.
Table 2 Preventive (PM) and control (CM) measure for mitigating risks associated with the
incidents considered in this study (cf. Figure 5).
The division of probabilities of state transitions and effects of incidents is based on the
review of data from subsurface shale gas operations in the U.S.A. and Canada.
Although the division honours current practices of shale operations in the U.S.A. and
Canada, different divisions may be equally valid, in particular if different regions such
as Europe are concerned. Despite local differences, the consistent risk assessment
framework developed in this study is a powerful tool to compare subsurface risks
associated with shale gas operations as it describes risks in terms of both causes and
effects of incidents (the bow-tie approach), and it is based on actual data for
probabilities of incident occurrences.
2.3 Data compilation, application & limitations
The risk assessment framework is based on a review of data from subsurface shale gas
operations in the U.S.A. and Canada (see also Ter Heege 2016). In particular, the
definition of states in the Markov Chain approach, constraints on probabilities for
transition between states, and the severity of effects are based on these data. Transition
probabilities are based on statistics for wells in the U.S.A. and Canada (mainly U.S.
EPA 2016; Davies et al. 2014). Such an statistical approach is only meaningful if
sufficient data is available. Given current shale gas development in the world, sufficient
data is only available from the U.S.A. and Canada. Therefore, the constraints are only
strictly valid for these regions and should not be directly applied to other regions
without explicitly considering differences in geological settings, regulatory frameworks
and exploitation practices. In other words, current practices, data and risks based on
experience in the U.S.A. and Canada should not be taken as a blueprint for shale gas
Mitigation Measures Typical examples
Preventive Measures (PM)
1 regulations & internal procedures controlling safety of operations, monitoring & mitigation protocols
2 subsurface characterization geological (mapping), geophysical (seismics) & petrophysical (well logs) modelling
3 proper well design & construction stable configurations, multiple (surface) casings, cement bond logs, pressure tests
4 efficient design of operations optimum treatment schedules & fracturing stages, limited injection volumes
5 traffic light systems leakage monitoring concentrations of chemicals (stray gas) in aquifers relative to baselines
6 traffic light systems seismicity monitoring seismicity (magnitudes, frequencies, ground motions) relative to baselines
Control Measures (CM)
1 well repair maintenance, workovers, squeeze cementing, swaging, re-completions
2 modifications of operations reduce injection volumes, modify treatment schedules, shut-in
3 flow diversion flow back, well section isolation, polymer/gel injection, side-tracking (laterals)
4 environmental remediation clean-up, reclamation, re-use
5 repair structural damage renovate, re-build, strengthen
6 decommissioning shut-in, plugging & abandonment
Page 18
Page 16
D6.2 Subsurface risks and impacts of shale gas operations Copyright © M4ShaleGas Consortium 2015-2017
exploitation in other regions such as Europe. Another important limitation is the
statistical analysis of the data on incidents that does not take causal relation between
operations and the occurrence or impact of incidents into account. For example, it is
well known that the frequency and magnitudes of seismicity as well as extent of fracture
disturbed rock volumes are related to the scale of operations (in particular injection
volumes, McGarr 2002 , Osinga et al. 2015). Accordingly, areas where the scale of
operations is large may be particular prone to problematic seismicity and out of zone
fracturing. This relation is not reflected in the statistical analysis of the occurrence of
problematic seismicity or out of zone fracturing. Another example is the relation of
incidents related to fluid migration or leakage along wells which show a relation with
local regulations on well construction (U.S. EPA 2016). Accordingly, the data
compilation is strictly only valid for shale gas operations in regions with similar
variations in geology, (scale of) operations and regulatory frameworks as in the U.S.A.
and Canada. Also, there are huge local differences between these countries, and states
and regions. The main consequence of the statistical approach and bias of data towards
operations in the U.S.A. and Canada is that the risk assessment should not be used as an
quantitative indication of risks that may be expected if shale gas exploitation is pursued
in other regions such as Europe. The relevance of the analysis for other regions is that it
can be used to identify the most prominent risks associated with subsurface shale gas
operations. This information can be used to prioritize regulations and risk mitigation
measures in regions that start to pursue shale gas exploitation.
We address these issues and limitations in the following sections, where the main risks
of shale gas operations in the subsurface are systematically discussed in terms of their
relative importance in the U.S.A. and Canada, potential mitigation measures, and the
relevance to Europe.
Page 19
Page 17
D6.2 Subsurface risks and impacts of shale gas operations Copyright © M4ShaleGas Consortium 2015-2017
3 RESULTS & DISCUSSION
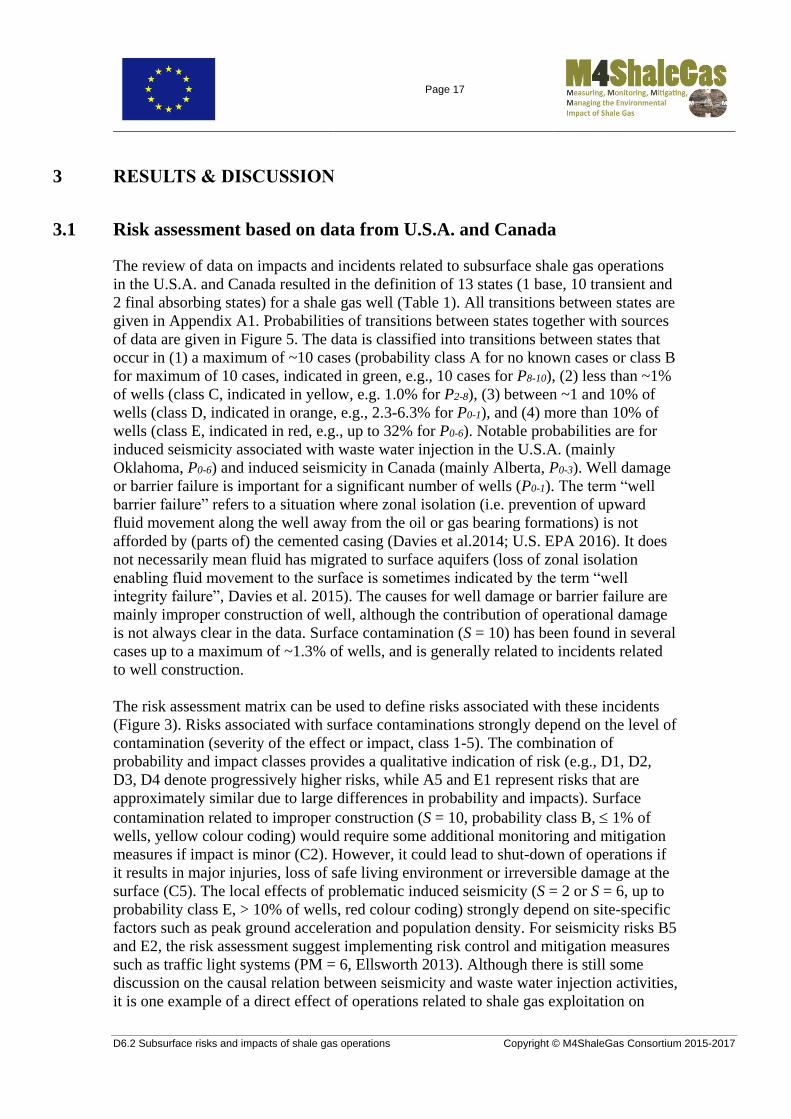
3.1 Risk assessment based on data from U.S.A. and Canada
The review of data on impacts and incidents related to subsurface shale gas operations
in the U.S.A. and Canada resulted in the definition of 13 states (1 base, 10 transient and
2 final absorbing states) for a shale gas well (Table 1). All transitions between states are
given in Appendix A1. Probabilities of transitions between states together with sources
of data are given in Figure 5. The data is classified into transitions between states that
occur in (1) a maximum of ~10 cases (probability class A for no known cases or class B
for maximum of 10 cases, indicated in green, e.g., 10 cases for P8-10), (2) less than ~1%
of wells (class C, indicated in yellow, e.g. 1.0% for P2-8), (3) between ~1 and 10% of
wells (class D, indicated in orange, e.g., 2.3-6.3% for P0-1), and (4) more than 10% of
wells (class E, indicated in red, e.g., up to 32% for P0-6). Notable probabilities are for
induced seismicity associated with waste water injection in the U.S.A. (mainly
Oklahoma, P0-6) and induced seismicity in Canada (mainly Alberta, P0-3). Well damage
or barrier failure is important for a significant number of wells (P0-1). The term “well
barrier failure” refers to a situation where zonal isolation (i.e. prevention of upward
fluid movement along the well away from the oil or gas bearing formations) is not
afforded by (parts of) the cemented casing (Davies et al.2014; U.S. EPA 2016). It does
not necessarily mean fluid has migrated to surface aquifers (loss of zonal isolation
enabling fluid movement to the surface is sometimes indicated by the term “well
integrity failure”, Davies et al. 2015). The causes for well damage or barrier failure are
mainly improper construction of well, although the contribution of operational damage
is not always clear in the data. Surface contamination (S = 10) has been found in several
cases up to a maximum of ~1.3% of wells, and is generally related to incidents related
to well construction.
The risk assessment matrix can be used to define risks associated with these incidents
(Figure 3). Risks associated with surface contaminations strongly depend on the level of
contamination (severity of the effect or impact, class 1-5). The combination of
probability and impact classes provides a qualitative indication of risk (e.g., D1, D2,
D3, D4 denote progressively higher risks, while A5 and E1 represent risks that are
approximately similar due to large differences in probability and impacts). Surface
contamination related to improper construction (S = 10, probability class B, 1% of
wells, yellow colour coding) would require some additional monitoring and mitigation
measures if impact is minor (C2). However, it could lead to shut-down of operations if
it results in major injuries, loss of safe living environment or irreversible damage at the
surface (C5). The local effects of problematic induced seismicity (S = 2 or S = 6, up to
probability class E, > 10% of wells, red colour coding) strongly depend on site-specific
factors such as peak ground acceleration and population density. For seismicity risks B5
and E2, the risk assessment suggest implementing risk control and mitigation measures
such as traffic light systems (PM = 6, Ellsworth 2013). Although there is still some
discussion on the causal relation between seismicity and waste water injection activities,
it is one example of a direct effect of operations related to shale gas exploitation on
Page 20
Page 18
D6.2 Subsurface risks and impacts of shale gas operations Copyright © M4ShaleGas Consortium 2015-2017
human health, safety and environment. It should be noted that injection of waste water
(mostly saltwater coproduced with oil, Walsh and Zoback 2015) is not necessarily
required for shale gas extraction itself, but is a means of disposing of produced or flow
back water.
3.2 Surface contamination– Subsurface processes & risks
One of the main potential impacts and risks for human health, safety and natural
environment (HSE) associated with shale gas operations in U.S.A. and Canada has been
found to be contamination of shallow aquifers, groundwater or drinking water resources
due to upward migration of hazardous substances (absorbing state S = 11). The
probabilities of transitions between states can be used to determine the successive
incidents that may lead to this type of contamination, and their probabilities of
occurrence. The most likely scenarios and incidents involved are graphically
represented in Figure 4b. The current definition of states distinguishes surface
contaminations leading to HSE impacts (S = 11) from less severe surface
contaminations caused by leakage along fractures (S = 9) or by leakage along wells (S =
10). Although there are some studies suggesting statistical correlation with surface
contamination related to shale gas operations and HSE impacts, causal relations are not
established (Werner et al. 2015; Jemielita et al. 2015; Hays and Shonkoff 2016,
unknown probabilities P9-11 and P10-11). Leakage along fractures requires out of zone
fluid migration due to hydraulic fracturing (S = 2). Out of zone fluid migration due to
due to waste water injection (S = 5) does not necessarily involve fracturing but may
occur by advective or dispersive flow of injected or displaced fluids through the
formation matrix of the targeted reservoir (U.S. EPA 2016). Out of zone fluid due to
hydraulic fracturing or waste water injection both have high (class E) probabilities.
There are no known cases were leakage along fractures have directly caused surface
contamination (S = 9) without involvement of migration pathways along wells (no cases
for Pi-9). This scenario is therefore highly unlikely if separation between the production
zone and shallow aquifers is large enough (risk A1). Surface contamination due to
leakage along wells (S = 10) has been found in some cases (class B probability), and
this scenario can pose a minor to high risk (B2-B5) depending on the severity of
contamination. The risks associated with direct surface contamination due to multiple
causes related to improperly functioning wells (class C probability for P0-10) are similar
or slightly higher (C2-C5). There is a relative high probability of well damage or barrier
failure during stimulation operations (class D), but the effects can vary. Fluid migration
along improperly constructed wells (S = 7) or wells damaged by operations (S = 8) has
been found in up to 1.3% of wells (class C probability for P17 and P18 for stimulated
shale production wells. No data has been found for fluid migration along disposal wells,
but probabilities and risks are likely similar or higher (class C probability for P47). The
status of decommissioned, abandoned or orphaned wells is of particular importance
(Davies et al. 2014; U.S. EPA 2016). Moreover, terminology can be confusing as it is
common practice in the oil & gas industry to use the terms (1) “abandoned” for wells of
unknown or unspecified status (sometimes the term “improperly abandoned” is used to
indicate issues with these wells), and (2) “plugged & abandoned” for wells that are
sealed by removing the wellhead, cutting the casing off below the ground surface,
Page 21
Page 19
D6.2 Subsurface risks and impacts of shale gas operations Copyright © M4ShaleGas Consortium 2015-2017
sealing portions of the well with one or more cement or mechanical plugs and thick clay
(bentonite) or drilling mud between plugs and welding the top of the well with a steel
plate (U.S. EPA 2016, but note that procedures may vary). Accordingly, “abandoned”
wells are usually not simply left after production as the term may suggest, and different
regulations for properly decommissioning a well exist. U.S. EPA (2016) defines
orphaned wells as an inactive oil or gas well with no known (or financially solvent)
owner. It may be more clear to use the term decommissioned (Davies et al. 2014;
Boothroyd et al. 2016). Davies et al. (2014) includes a more elaborate description of
terminology and definitions. In this report we use the term “abandoned” for wells after
production lifetime with unknown or unspecified status (if the term is also used in the
original publication, see, for example, U.S. EPA 2016) and the term “decommissioned”
for wells for wells after production lifetime that have been sealed according to (local)
regulations. Note that in most European Member States, regulations prescribe that wells
need to be sealed using prescribed procedures including cutting portions of the casing
and filling cut portions with cement plugs (Gawel et al. 2015). In any case, the status of
decommissioned and abandoned wells is often unclear and a point of concern, for
example as sealing properties of cement may degrade with time (U.S. EPA 2016).
3.3 Induced seismicity – Subsurface processes & risks
Another important impact and HSE risk associated with shale gas operations in U.S.A.
and Canada is structural damage or damage to surface or subsurface infrastructure as a
result of induced seismicity caused by the reactivation of existing large-scale faults
(absorbing state S = 12, referred to as damaging seismicity hereafter). The scenarios of
successive incidents that may lead to damaging seismicity are graphically represented in
Figure 4c. The current definition of states distinguishes damaging seismicity S = 12)
from problematic seismicity related to hydraulic fracturing (S = 3) or waste water
injection (S = 6). Damaging induced seismicity (S = 12) has been found in several cases
related to extensive waste water injection (WWI, class B probability). In one case, an M
5.6 event in central Oklahoma destroyed 14 homes and injured two people (risk B5, see
caption of Figure 5 for references). Due to the fact that the occurrence of damaging
WWI seismicity is limited to some cases (class B probability), risks of damaging WWI
seismicity (B5) are comparable to risks of problematic WWI seismicity (E2) that occurs
frequently but has minor effects. However, both risks can become intolerable if the
impacts of problematic WWI seismicity (S = 3 or S = 6) becomes moderate (risk class
becomes E3) or if the probability of damaging WWI seismicity is raised (probability
class becomes C). Potentially damaging induced seismicity related to hydraulic
fracturing (HF) has been found in 3 cases with maximum M 3.6-4.7 but effects were
reported to be minor (risk B2, see caption of Figure 5 for references). Problematic HF
seismicity is reported in more wells, mainly in Western Canada (class C probability,
risk C1). The probability of problematic HF seismicity is lower than that of WWI
seismicity.
Page 22
Page 20
D6.2 Subsurface risks and impacts of shale gas operations Copyright © M4ShaleGas Consortium 2015-2017
3.4 Risk mitigation measures
The bow-tie method can account for two types of mitigation measures that lower risks
associated with incidents: (1) Preventive measures that mainly lower the probability of
incident occurrence, and (2) control measures that mainly lower the effects of incidents
(Table 2). Preventive measures (PM) can be divided into measures improving the design
of operations that increase safety (“design inherent safety”, e.g., regulations for well
design), measures improving the organization or planning of operations (“organizational
preventive measures”, e.g., internal safety procedures), and measures improving
technical aspects of operations (“technical preventive measures”, e.g., the safe
construction of wells). Control measure can be divided into measures enforcing the
handling of incidents (“organizational control measures”, e.g., safety protocols) and
measures that remediate the effects of incidents (“technical control measures”, e.g., well
repair). A list of general mitigation measures with typical examples of methods is
indicated in Table 2. A more detailed description of mitigation measures and methods
can be found in a previous report (Ter Heege 2016). The effect of mitigation measures
on (probability of) state transitions is indicated described in section 2.2 (cf. Figure 5).
3.5 Application to Europe
A meaningful statistical analysis of data on impacts, incidents and risks of subsurface
shale gas operation can only be performed for the U.S.A. and Canada where sufficient
data is available. As mentioned in section 2.2, direct application to Europe is hampered
by differences in geological settings, regulatory frameworks and practices for
hydrocarbon exploitation. One of the key aspects that may lead to differences between
the U.S.A., Canada and Europe are differences in mitigation measures, such as
regulations. As mentioned in section 3.4, mitigation measures can lower both the
probability of incident occurrence and the effects or impacts of incidents. For example,
regulations act as preventive measures for the occurrence of incidents related to
construction of wells. Below, we discuss the main impacts, incidents and risks identified
for the U.S.A. and Canada, and their relevance for Europe. It should be emphasized that
differences are huge between states or regions in the U.S.A. and Canada as well as
between European Member States. Therefore, only general statements can be made, and
these general statements may not hold for all regions or shale plays. In some cases, it is
useful to compare impacts and risks of shale operations in North America with
conventional gas operations in Europe. Comparison between risks associated with shale
gas operations and risks associated with other energy resources such as conventional
gas is useful to get a better picture of their relative importance (conventional gas
exploitation has been around for a longer period of time in Europe). In this case, risk
assessment needs to acknowledge the scale of operations. If the likelihood of an
incident is constant for a specific type of operation, the number of incidents will be
expected to increase if the number of operations increases. Accordingly, local impacts
of shale gas operations and therefore the risks will be expected to increase if the scale of
operations increase.
Page 23
Page 21
D6.2 Subsurface risks and impacts of shale gas operations Copyright © M4ShaleGas Consortium 2015-2017
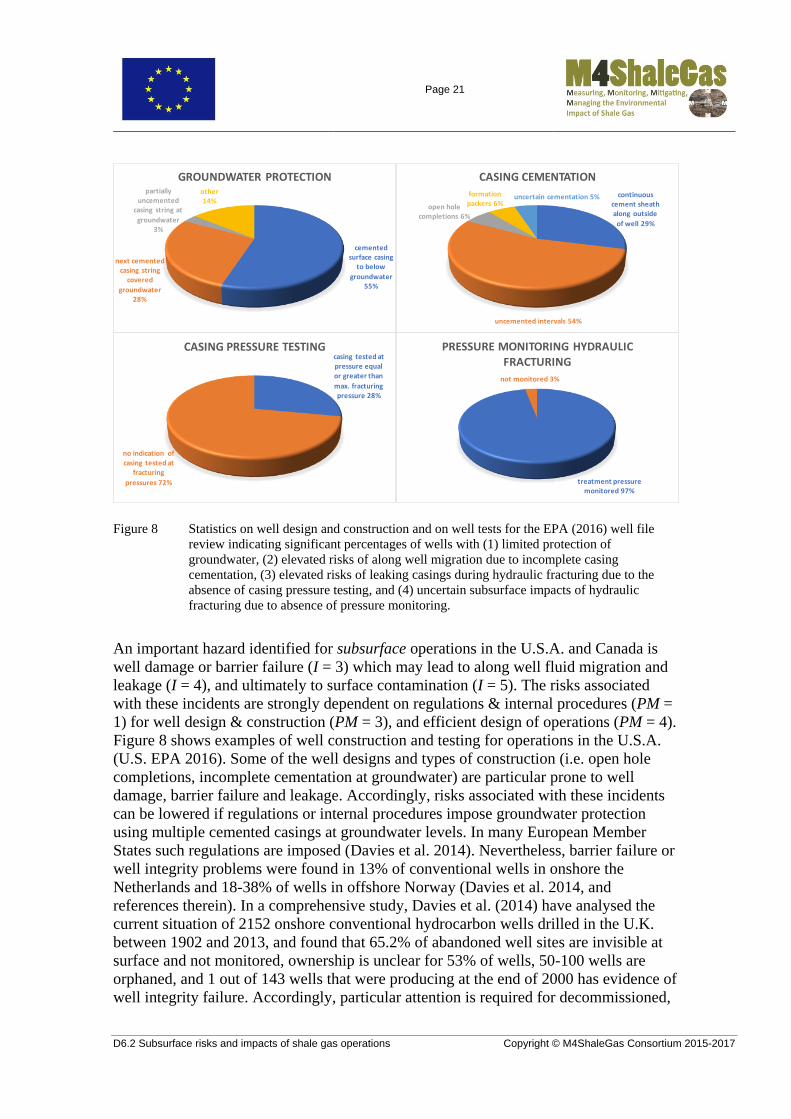
Figure 8 Statistics on well design and construction and on well tests for the EPA (2016) well file
review indicating significant percentages of wells with (1) limited protection of
groundwater, (2) elevated risks of along well migration due to incomplete casing
cementation, (3) elevated risks of leaking casings during hydraulic fracturing due to the
absence of casing pressure testing, and (4) uncertain subsurface impacts of hydraulic
fracturing due to absence of pressure monitoring.
An important hazard identified for subsurface operations in the U.S.A. and Canada is
well damage or barrier failure (I = 3) which may lead to along well fluid migration and
leakage (I = 4), and ultimately to surface contamination (I = 5). The risks associated
with these incidents are strongly dependent on regulations & internal procedures (PM =
1) for well design & construction (PM = 3), and efficient design of operations (PM = 4).
Figure 8 shows examples of well construction and testing for operations in the U.S.A.
(U.S. EPA 2016). Some of the well designs and types of construction (i.e. open hole
completions, incomplete cementation at groundwater) are particular prone to well
damage, barrier failure and leakage. Accordingly, risks associated with these incidents
can be lowered if regulations or internal procedures impose groundwater protection
using multiple cemented casings at groundwater levels. In many European Member
States such regulations are imposed (Davies et al. 2014). Nevertheless, barrier failure or
well integrity problems were found in 13% of conventional wells in onshore the
Netherlands and 18-38% of wells in offshore Norway (Davies et al. 2014, and
references therein). In a comprehensive study, Davies et al. (2014) have analysed the
current situation of 2152 onshore conventional hydrocarbon wells drilled in the U.K.
between 1902 and 2013, and found that 65.2% of abandoned well sites are invisible at
surface and not monitored, ownership is unclear for 53% of wells, 50-100 wells are
orphaned, and 1 out of 143 wells that were producing at the end of 2000 has evidence of
well integrity failure. Accordingly, particular attention is required for decommissioned,
cemented surface casing
to below
groundwater55%
next cemented casing string
covered
groundwater28%
partially uncemented
casing string at
groundwater3%
other14%
GROUNDWATER PROTECTION
casing tested at pressure equal or greater than
max. fracturing pressure 28%
no indication of casing tested at
fracturing
pressures 72%
CASING PRESSURE TESTING
continuous cement sheath along outside
of well 29%
uncemented intervals 54%
open hole completions 6%
formation packers 6%
uncertain cementation 5%
CASING CEMENTATION
treatment pressure monitored 97%
not monitored 3%
PRESSURE MONITORING HYDRAULIC FRACTURING
Page 24
Page 22
D6.2 Subsurface risks and impacts of shale gas operations Copyright © M4ShaleGas Consortium 2015-2017
abandoned or orphaned wells. In many cases, the status and ownership of these wells
after abandonment is unclear and not monitored. Moreover, fluid migration may
increase over time due to degradation of well materials such as cement plugs (U.S. EPA
2016). Plugged and abandoned (decommissioned) wells are associated with fluid
migration risks for current operations, for example in case the fracture disturbed zone
intersects with the abandoned wells (a “frac hit”, U.S. EPA 2016). Problems with
abandoned and orphaned wells are particularly important in areas that have (previously)
been targeted for conventional gas exploitation, which is the case for many European
Member States. Boothroyd et al. (2016) investigated fugitive methane emissions in 104
onshore conventional gas wells in the U.K., and found both significantly greater (30%
of wells) and lower (39% of wells) concentration of surface soil gas methane compared
to nearby control site of similar land use and soil type. The methane flux was found to
be low compared to commonly used on decommissioned well sites. Monitoring is key
in reducing the risks associated with enhanced migration due to well integrity or barrier
failure, and traffic light systems based on concentrations of chemicals (e.g., stray gas) in
groundwater (PM = 5) may aid in reducing these risks. Control measures such as well
repair (CM = 1), modification of operations (CM = 2), flow diversion (CM = 3) or
environmental remediation (CM = 4) are generally more invasive and costly.
The other important hazard identified for subsurface operations in the U.S.A. and
Canada is induced seismicity related to hydraulic fracturing (HF, mainly Western
Canada) and waste water injection (WWI, mainly Central Oklahoma, U.S.A.).
Problematic seismicity (I = 1, 2) may locally occur in a relative large number of wells,
while damaging seismicity (I = 6) locally occurs in few cases and is mainly associated
with WWI operations (see references in Figure 5). The risks associated with seismicity-
related incidents are notoriously difficult to mitigate, mainly due to uncertainty in the
presence and status of faults in the subsurface. Faults that are too small to be detected
by most methods for subsurface characterization (PM = 2) may already cause
problematic seismicity (Zoback and Gorelick 2012). Moreover, problematic seismicity
may become damaging over time due to ongoing fluid injection (increasing scale of
activity, McGarr 2002; Wassing et al. 2016) or as a result of the characteristic inverse
relations between event frequencies and magnitudes (Gutenberg-Richter relations,
Gutenberg and Richter 2010). Also, the distinction between background tectonic (base)
seismicity, triggered tectonic seismicity and seismicity induced by operations is an issue
(Walsh and Zoback 2015). Potential preventive mitigation measures that can be
implemented before commencing operations include regulations & internal procedures
(PM = 1) and efficient design of operations (PM = 4) that limit the scale of activities,
and subsurface characterization to identify seismicity-prone fault systems (PM = 2).
Risks associated with WWI induced seismicity can be reduced by limiting the injection
volumes in wells and spreading WWI over multiple disposal sites that are not
hydrologically connected. Alternatives to WWI may be water treatment and re-use, but
high salinity and high concentration of total dissolved solids is generally a problem as
well as costs involved. In many European Member States mitigation measures for
induced seismicity are imposed, but usually after problematic or damaging seismicity
have been encountered (De Pater and Baisch 2011; Clark et al. 2014; Van Thienen-
Visser and Breunesse 2015). A notable example of problematic seismicity associated
Page 25
Page 23
D6.2 Subsurface risks and impacts of shale gas operations Copyright © M4ShaleGas Consortium 2015-2017
with shale gas operations in Europe has occurred in the Preese Hall well in Lancashire
(U.K.) in 2011 where seismicity with a maximum magnitude of ML 2.3 was associated
with hydraulic fracturing of the Bowland Shale (De Pater and Baisch 2011; Clark et al.
2014). Although the events only caused some minor damage to the well and no damage
at the surface (Green et al. 2012), they can be considered problematic as it has raised
public concern and contributed to a delay of further shale gas operations in the U.K.
One of the main problems for mitigation measures is that the maximum magnitude
occurred after temporary shut-in of the well, which poses a challenge for determining
practical feasible thresholds for seismic magnitudes in traffic light systems aimed at
preventing ML 2.3 seismicity (PM = 6). A notable example of induced seismicity related
to waste (production) water injection has occurred near De Hoeve in the Netherlands in
2008 where seismicity with a maximum magnitude of ML 2.8 was associated with
injection of production water from conventional gas operations into an empty gas field
(Bois et al. 2013; Wassing et al. 2016). An example of how problematic induced
seismicity can become damaging is the induced seismicity associated with extraction of
large volumes of conventional natural gas from the Groningen gas field in the North of
the Netherlands (Van Thienen-Visser and Breunesse 2015). It should be emphasized
that the mechanism causing seismicity during conventional gas extraction (likely
differential compaction leading to fault reactivation) is different than the mechanism for
HF or WWI induced seismicity (increase in pore pressure leading to fault reactivation,
Wassing et al. 2015). However depletion-induced seismicity in Groningen is a prime
example of problematic seismicity with a moderate maximum magnitude ML 3.6 leading
to major risks and impacts in terms of public perceptions, operations and revenues. It
also poses a challenge for traffic light systems based on seismic magnitudes as
frequency of seismicity and ground motions associated with seismicity are equally or
more important in determining seismic risks (Wassing et al. 2015). The relation between
seismic magnitude, ground motion and structural damage depends on hypocentre depth
as well as properties of the overburden (including soil). Therefore, “acceptable”
thresholds for traffic light systems based on seismic magnitude need to be based on site-
specific conditions. Other factors such as population density also play an important role
in establishing such thresholds. Therefore, traffic light systems used in the U.S.A. or
Canada are not directly applicable to Europe. It may be preferred to design traffic lights
based on ground motions rather than seismic magnitudes as the correlation between
ground motion and structural damage is more straightforward. However, it is common
practice to design traffic light systems based on seismic magnitudes (Wassing et al.
2015). Again, monitoring is key in reducing the risks associated with induced
seismicity, and traffic light systems based on seismic magnitudes, frequency and ground
motions (PM = 6) may aid in reducing seismic risks. U.S. EPA (2016) estimates that
0.5% of frac jobs are micro-seismically monitored. Potential control measures are
mainly modification of operations (CM = 2) and (CM = 5) but may even include shut-in
and decommissioning of wells (CM = 6), all of which are generally invasive and costly.
Page 26
Page 24
D6.2 Subsurface risks and impacts of shale gas operations Copyright © M4ShaleGas Consortium 2015-2017
4 SUMMARY & CONCLUSIONS
The risk assessment indicates that the main risks of operations in the subsurface on
human health, safety and natural environment are due to contamination of shallow
aquifers, groundwater or drinking water resources due to upward migration of
hazardous substances along damaged or improperly constructed wells, and (2) structural
damage to subsurface infrastructure as a result of induced seismicity associated with
waste water injection or hydraulic fracturing.
Risks assessment was based on a framework that consists of three components: (1) a
Markov Chain-type approach to describe the transition from a properly operating shale
gas well (base state) to absorbing states where incidents have caused contamination of
shallow aquifers or problematic seismicity, (2) a bow-tie approach to describe incidents
that lead to a transition between states in terms of its causes and effects with associated
preventive and control measures, and (3) a risk assessment matrix that classifies risks
according to their probability of occurrence and effects.
Probabilities of incidents (or state transitions) and effects of incidents are based on the
review of data from subsurface shale gas operations in the U.S.A. and Canada as only
for those countries sufficient data is available for a meaningful statistical analysis.
Limitations of the statistical analysis are that it does not take into account differences in
geological settings, regulatory frameworks and practices for hydrocarbon exploitation
between regions in the U.S.A. and Canada, or between North America and Europe.
Also, causal relations between operational characteristic and the occurrence of incidents
are not taken into account.
The main conclusions from the risk assessment are that:
Probabilities and effects of incidents can be conveniently divided into 5 classes
(classes A-E for probability and classes 1-5 for severity of effects). Probabilities
of incidents are based on the number of incidents relative to the number of wells
studied. Severity of effects is ranked from no effects to catastrophic effects with
irreversible damage, major injuries or loss of safe living environments. The
same classes are used in the probability matrix for transitions between states in
the Markov Chain as in the risks assessment matrix. Mitigation measures are
discussed that can lower probabilities (preventive measures) and effects (control
measures) of incidents.
High probabilities were found for out of zone fluid migration during stimulation
or waste water injection, and for problematic induced seismicity (M > 2) during
waste water injection. Moderate to high probabilities were found for well
damage or barrier failure. Minor to moderate probabilities were found for
incidents leading to along well migration and leakage. Minor probabilities were
found for surface contamination and for damaging induced seismicity. Surface
contamination has minor to moderate impacts and low to moderate risks in most
cases. Decommissioned, abandoned and orphaned wells are a particular
Page 27
Page 25
D6.2 Subsurface risks and impacts of shale gas operations Copyright © M4ShaleGas Consortium 2015-2017
concern. Impacts of induced seismicity can be major and lead to highest risks,
in particular in relation to high volume fracturing or extensive waste water
injection.
Although data for unconventional hydrocarbon exploitation is limited and large
differences exist between the U.S.A., Canada and Europe, examples of impacts
and risks associated with well integrity and leakage and induced seismicity exist
in European Member States, most from conventional hydrocarbon exploitation.
The most important difference between unconventional and conventional
hydrocarbon exploitation is the scale of operations involved. This difference
will affect all probabilities and effects of incidents, and therefore also the risks.
Page 28
Page 26
D6.2 Subsurface risks and impacts of shale gas operations Copyright © M4ShaleGas Consortium 2015-2017
5 REFERENCES
Akob, D.M., Mumford, A.C., Orem, W., Engle, M.A., Klinges, J.G., Kent, D.B., Cozzarelli,
I.M. (2016) Wastewater disposal from unconventional oil and gas development
degrades stream quality at a West Virginia injection facility. Environmental Science
Technology 50: 5517-5525.
Atkinson, G.M. (2015) Ground-Motion Prediction Equation for Small-to-Moderate Events at
Short Hypocentral Distances, with Application to Induced-Seismicity Hazards. Bulletin
of the Seismological Society of America, doi:10.1785/0120140142.
Atkinson, G.M., Eaton, D.W., Ghofrani, H., Walker, D., Cheadle, B., Schultz, R., Shcherbakov,
R., Tiampo, K., Gu, J., Harrington, R.M., Liu, Y., Van der Baan, M., Kao, H. (2016)
Hydraulic Fracturing and Seismicity in the Western Canada Sedimentary Basin.
Seismological Research Letters 87: 1-17.
BCOGC (2012) Investigation of Observed Seismicity in the Horn River Basin, British
Columbia Oil & Gas Commission, British Columbia, Canada.
BCOGC (2014) Investigation of Observed Seismicity in the Montney Trend, British Columbia
Oil & Gas Commission, British Columbia, Canada.
BCOGC (2015). August seismic event detection. Report No. Industry Bulletin 2015-32, British
Columbia Oil and Gas Commission.
Bohnhoff, M., Malin, P.E. (2015) Review of seismic monitoring network design, waveform
processing procedures, and best practices in the USA and Canada. M4ShaleGas report
D3.1, GeoForschungsZentrum, Potsdam, Germany. www.m4shalegas.eu.
Bois, A.-P., Mohajerani, M., Dousi, N., & Harms, S. (2013) Inducing Earthquake By Injecting
Water In A Gas Field: Water-weakening Effect. Society of Petroleum Engineers.
doi:10.2118/166430-MS.
Boothroyd, I.M., Almond, S., Qassim, S.M., Worrall, F., Davies, R.J. (2016) Fugitive emissions
of methane from abandoned, decommissioned oil and gas wells. Science of the Total
Environment 547: 461-469.
Brantley, S.L., Yoxtheimer, D., Arjmand, S., Grieve, P., Vidic, R., Pollak, J., Llewellyn, G.T.,
Abad, J. Simon, C. (2014) Water resource impacts during unconventional shale gas
development: The Pennsylvania experience. International Journal of Coal Geology 126:
140-156.
Clarke, H., Eisner, L., Styles, P., Turner, P. (2014) Felt seismicity associated with shale gas
hydraulic fracturing: The first documented example in Europe. Journal of Geophysical
Research 2014: 8308-8314.
Considine, T.J., Watson, R.W., Considine, N.B., Martin, J.P. (2013) Environmental regulation
and compliance of Marcellus shale gas drilling. Environmental Geosciences 20: 1-16.
Cuss, R.J., Wiseall, A.C., Hennissen, J.A.I., Waters, C.N., Kemp, S.J., Ogier-Simonin, A.,
Holyoake, S., Haslam, S.B. (2015) Hydraulic fracturing: A review of theory and field
experience. M4ShaleGas report D1.1, British Geological Survey, Nottingham, United
Kingdom. www.m4shalegas.eu.
Darrah, T.H., Vengosh, A., Jackson, R.B., Warner, N.R., Poreda, R.J. (2014) Noble gases
identify the mechanisms of fugitive gas contamination in drinking-water wells
overlying the Marcellus and Barnett Shales. Proceedings of the National Academy of
Sciences 111: 14076-14081.
Davies, R.J., Mathias, S.A., Moss, J., Hustoft, S., Newport, L. (2012) Hydraulic fractures: How
far can they go? Marine and Petroleum Geology 37: 1-6.
Page 29
Page 27
D6.2 Subsurface risks and impacts of shale gas operations Copyright © M4ShaleGas Consortium 2015-2017
Davies, R., Foulger, G., Bindley, A., Styles, P. (2013) Induced seismicity and hydraulic
fracturing for the recovery of hydrocarbons. Marine and Petroleum Geology 45: 171-
185.
Davies, R.J., Almond, S., Ward, R.S., Jackson, R.B., Adams, C., Worrall, F., Herringshaw,
L.G., Gluyas, J.G., Whitehead, M.A. (2014) Oil and gas wells and their integrity:
Implications for shale and unconventional resource exploitation. Marine and Petroleum
Geology 56: 239-254.
Demong, K.L., Fahlman, J., Schnell, R.A. (2010) Coping With Surface and Downhole
Interference on Tightly Spaced Completions Pads in the Horn River. Society of
Petroleum Engineers. doi:10.2118/138026-MS.
De Pater, C.J., Baisch, S. (2011) Geomechanical Study of Bowland Shale Seismicity. report,
Cuadrilla Resources Ltd., U.K.
Ellsworth, W.L. (2013) Injection-Induced Earthquakes. Science 341.
Energy Institute (2008) The Risk Assessment Matrix. www.heartsandminds.energyinst.org.
Farahbod, A.M., Kao, H., Walker, D.M., Cassidy, J. F., Calvert, A. (2015) Investigation of
regional seismicity before and after hydraulic fracturing in the Horn River Basin,
northeast British Columbia. Canadian Journal of Earth Sciences, 52(2): 112-122.
Fisher, M.K., Warpinski, N.R. (2012) Hydraulic-Fracture-Height Growth: Real Data. SPE
Production & Operations 27: 8-19.
Fleckenstein, W.W., Eustes, A.W., Stone, C.H., Howell, P.K (2015) An assessment of risk of
migration of hydrocarbons or fracturing fluids to fresh water aquifers: Wattenberg
Field, CO. Society of Petroleum Engineers. doi:10.2118/175401-MS.
Garcia, B., Rouchon, V., Deflandre, J.-P. (2015) Review of monitoring and existing best
practices for monitoring well leakage in the USA and Canada. M4ShaleGas report
D4.4, IFPEN, Rueil-Malmaison, France. www.m4shalegas.eu.
Gawel, K., Lavrov, A., Torsæter, M. (2015) Review of shale gas well drilling, completion,
production and abandonment operations. M4ShaleGas report D5.1, SINTEF,
Trondheim, Norway. www.m4shalegas.eu.
Green, C.A., Styles, P., Baptie, B.J. (2012) Preese Hall shale gas fracturing: Review and
recommendations for induced seismic mitigation, UK Department of Energy and
Climate Control, London, U.K.
Grimmett, G.R., Stirzaker, D. (2003) Probability and Random Processes, 3rd edition, Oxford
University Press.
Grinstead, C.M., Snel, J.L. (2009) Grinstead and Snell's Introduction to Probability, University
Press of Florida.
Gutenberg, B., Richter,C. (2010) Magnitude and energy of earthquakes. Annals of Geophysics
53.
Hammack, R., Harbert, W., Sharma, S., Stewart, B., Capo, R., Wall, A., Wells, A., Diehl, R.,
Blaushild, D., Sams, J., Veloski, G. (2014) An evaluation of fracture growth and
gas/fluid migration as horizontal Marcellus Shale gas wells are hydraulically fractured
in Greene County, Pennsylvania. (NETL-TRS-3-2014). Pittsburgh, PA: U.S.
Department of Energy, National Energy Technology Laboratory, 80 pp.
Hays, J., Shonkoff, S.B.C. (2016) Toward an Understanding of the Environmental and Public
Health Impacts of Unconventional Natural Gas Development: A Categorical
Assessment of the Peer-Reviewed Scientific Literature, 2009-2015. PLOS ONE,
DOI:10.1371 /journal.pone.0154164, 13 pp.
Holland, A. A. (2013) Earthquakes Triggered by Hydraulic Fracturing in South-Central
Oklahoma. Bulletin of the Seismological Society of America, 103 (3): 1784-1792.
Page 30
Page 28
D6.2 Subsurface risks and impacts of shale gas operations Copyright © M4ShaleGas Consortium 2015-2017
Ingraffea, A.R., Wells, M.T., Santoro, R.L., Shonkoff, S.B. (2014) Assessment and risk analysis
of casing and cement impairment in oil and gas wells in Pennsylvania, 2000-2012.
Proceedings of the National Academy of Sciences USA 111: 10955-10960.
Jackson, R.B., Vengosh, A., Darrah, T.H., Warner, N.R., Down, A., Poreda, R.J., Osborn, S.G.,
Zhao, K., Karr, J.D. (2013) Increased stray gas abundance in a subset of drinking water
wells near Marcellus shale gas extraction. Proceedings of the National Academy of
Sciences 110: 11250-11255.
Jemielita, T, Gerton, G.L., Neidell, M., Chillrud, S., Yan, B., Stute, M., Howarth, M., Saberi, P.,
Fausti, N., Penning, T.M., Roy, J., Propert, K.J., Panettieri, Jr., R.A. (2015)
Unconventional Gas and Oil Drilling Is Associated with Increased Hospital Utilization
Rates. PLOS ONE, DOI:10.1371/journal.pone.0131093, 18 pp.
Kell, S. (2011) State oil and gas agency groundwater investigations and their role in advancing
regulatory reforms, a two-state review: Ohio and Texas. Report of the Ground Water
Protection Council (GWPC).
Keranen, K.M., Weingarten, M., Abers, G.A., Bekins, B.A., Ge, S. (2014) Sharp increase in
central Oklahoma seismicity since 2008 induced by massive wastewater injection.
Science 345: 448-451.
King, G.E. (2012) Hydraulic Fracturing 101: What Every Representative, Environmentalist,
Regulator, Reporter, Investor, University Researcher, Neighbor, and Engineer Should
Know About Hydraulic Fracturing Risk. Society of Petroleum Engineers.
doi:10.2118/0412-0034-JPT.
Llewellyn, G.T., Dorman, F., Westland, J.L., Yoxtheimer, D., Grieve, P., Sowers, T., Humston-
Fulmer, E., Brantley, S.L. (2015) Evaluating a groundwater supply contamination
incident attributed to Marcellus Shale gas development. Proceedings of the National
Academy of Sciences USA 112: 6325-6330.
McGarr, A. (2002) Case histories of induced and triggered seismicity. In: Lee, W.H.K.,
Kanamori, H., Jennings, P.C., Kisslinger, C., International Handbook of Earthquake and
Engineering Seismology, 647.
NRC (2013) Induced seismicity potential in energy technologies. National Research Council.
The National Academic Press, Washington D.C., U.S.A., 248 p.
Okrent, D. (1980) Comment on Societal Risk. Science 208: 372-375.
Osinga, S., Wassing, B., Ter Heege, J. (2015) Induced seismicity related to global shale gas
operations: A review. M4ShaleGas report D2.1, TNO, Utrecht, the Netherlands.
www.m4shalegas.eu.
Schultz, R., Mei, S., Pană, D., Stern, V., Gu,Y.G., Kim, A., Eaton, D. (2015a) The Cardston
Earthquake Swarm and Hydraulic Fracturing of the Exshaw Formation (Alberta Bakken
Play). Bulletin of the Seismological Society of America 105: 2871–2884.
Schultz, R., Stern, V., Novakovic, M., Atkinson, G., Gu, Y.J. (2015b) Hydraulic fracturing and
the Crooked Lake Sequences: Insights gleaned from regional seismic networks.
Geophys. Res. Lett. 42: 2750-2758.
Smith, K. (2013) Environmental hazards: assessing risk and reducing disaster. Routledge, Oxon,
United Kingdom, 478 p.
Ter Heege, J.H. (2016) Integrated review of best practices of subsurface operations in U.S.A.
and Canada. M4ShaleGas report D6.1, TNO, Utrecht, the Netherlands:
www.m4shalegas.eu.
U.S. EPA (2016) Hydraulic Fracturing for Oil and Gas: Impacts from the Hydraulic Fracturing
Water Cycle on Drinking Water Resources in the United States. U.S. Environmental
Protection Agency, Office of Research and Development, Washington, DC,
EPA/600/R-16/236Fa: www.epa.gov.
Page 31
Page 29
D6.2 Subsurface risks and impacts of shale gas operations Copyright © M4ShaleGas Consortium 2015-2017
Van Thienen-Visser, K., Hendriks, D., Marsman, A., Nepveu, M., Groenenberg, R.,
Wildenborg, T., Van Duijne, H., Den Hartogh, M., Pinkse, T. (2013) Bow-tie risk
assessment combining causes and effects applied to gas oil storage in an abandoned salt
cavern. Engineering Geology 168: 49–166.
Van Thienen-Visser, K., Breunese, J.N. (2015) Induced seismicity of the Groningen gas field:
History and recent developments. The leading edge June 2015 Special Section: 664-
671.
Vidic, R.D., Brantley, S.L., Vandenbossche, J.M., Yoxtheimer, D., Abad, J.D. (2013) Impact of
shale gas development on regional water quality. Science 340: 1235009.
Walsh, F.R., Zoback, M.D. (2015) Oklahoma's recent earthquakes and saltwater disposal.
Science Advances 1.
Wassing, B. Buijze, L., Ter Heege, J. (2016) Key controlling factors for shale gas induced
seismicity. M4ShaleGas report D2.2, TNO, Utrecht, the Netherlands:
www.m4shalegas.eu.
Werner, A.K., Vink, S., Watt, K., Jagals, P. (2015) Environmental health impacts of
unconventional natural gas development: A review of the current strength of evidence.
Science of the Total Environment 505: 1127–1141.
Zoback, M.D., Gorelick, S.M. (2012) Earthquake triggering and large-scale geologic storage of
carbon dioxide. Proceedings of the National Academy of Sciences of the United States
of America, 109(26): 10164-10168.
Page 32
Page 30
D6.2 Subsurface risks and impacts of shale gas operations Copyright © M4ShaleGas Consortium 2015-2017
APPENDIX
Table A1 Relevant transitions between states (i and j) caused by incidents (I) with a description of
potential processes (P) involved. Note that data on probability of occurrence (Pi-j) is not
available for all transitions and processes.
Statei
Statej
Incident (I)I
Specific process or Measures / commentsP
0 1 1 problematic stimulation operations 1 stimulation-related well damage (e.g., damage at fracture pressure)
0 2 1 problematic stimulation operations 2 out of zone fracturing & fluid migration (e.g., fracture growth into overburden)
0 3 1 problematic stimulation operations 3 stimulation-induced seismicity (anomalous M > 2 seismicity)
0 4 2 problematic waste water injection (WWI) 4 WWI-related well damage (e.g., damage during long term pressure increase)
0 5 2 problematic waste water injection (WWI) 5 out of zone fluid migration (e.g., pressure diffusion beyond disposal complex)
0 6 2 problematic waste water injection (WWI) 6 WWI-induced seismicity (M > 2 seismicity near disposal complex)
0 7 3 well damage or integrity/barrier failure 7 fluid migration along improperly constructed wells (not correlated to stimulation)
0 8 3 well damage or integrity/barrier failure 8 fluid migration along wells damaged by operations (correlated to stimulation)
0 10 4 loss of fluid containment 9 surface contamination by along well fluid migration (multiple causes)
1 2 1 problematic stimulation operations 10 out of zone fluid migration aided by well damage (e.g., out of zone fracturing)
1 3 1 problematic stimulation operations 11 stimulation-induced seismicity in damaged wells
1 7 3 well damage or integrity/barrier failure 12 fluid migration along stimulated wells due to poor construction or design
1 8 3 well damage or integrity/barrier failure 13 fluid migration along stimulated wells with operational damage
1 10 4 loss of fluid containment 14 surface contamination by stimulation-related well collapse
2 3 1 problematic stimulation operations 15 stimulation-induced seismicity promoted by out of zone fracturing
2 7 3 well damage or integrity/barrier failure 16 along well fluid migration promoted by interconnecting fracture networks
2 8 3 well damage or integrity/barrier failure 17 along well fluid migration by well communication through interconnecting fractures
2 9 4 loss of fluid containment 18 surface contamination by leakage along stimulated fractures extending to surface
2 10 4 loss of fluid containment 19 surface contamination by leakage along wells aided by out of zone fluid migration
3 8 3 well damage or integrity/barrier failure 20 along well fluid migration by seismicity-induced well damage (ground motions)
3 10 4 loss of fluid containment 21 surface contamination caused by seismicity-induced well collapse (ground motions)
3 12 6 problematic seismicity 22 stimulation-related seismicity leading to HSE risks (structural damage)
4 5 2 problematic waste water injection (WWI) 23 WWI-seismicity promoted by out of zone fluid migration
4 6 2 problematic waste water injection (WWI) 24 WWI-seismicity in damaged well
4 7 3 well damage or integrity/barrier failure 25 fluid migration along WWI wells due to poor construction or design
4 8 3 well damage or integrity/barrier failure 26 fluid migration along WWI wells with operational damage
4 10 4 loss of fluid containment 27 surface contamination by injection-related well damage (e.g., well collapse)
5 6 2 problematic waste water injection (WWI) 28 out of zone fluid migration aided by damaged WWI wells
5 7 3 well damage or integrity/barrier failure 29 along well fluid migration promoted by interconnecting (WWI) fluid plumes
5 8 3 well damage or integrity/barrier failure 30 along well fluid migration promoted by injection-related well damage
5 9 4 loss of fluid containment 31 surface contamination by leakage along fracture networks extending to surface
5 10 4 loss of fluid containment 32 surface contamination by leakage along wells aided by out of zone fluid migration
6 8 3 well damage or integrity/barrier failure 33 along well fluid migration by WWI seismicity-induced well damage (ground motions)
6 10 4 loss of fluid containment 34 surface contamination caused by WWI seismicity-induced well collapse
6 12 6 problematic seismicity 35 WWI-seismicity leading to HSE risks (structural damage)
7 10 4 loss of fluid containment 36 surface contamination caused by fluid migration along improperly constructed wells
8 10 4 loss of fluid containment 37 surface contamination caused by fluid migration along wells with operational damage
9 11 5 surface contamination 38 fracture-related surface contamination leading to pollution-related HSE risks
10 11 5 surface contamination 39 well-related surface contamination leading to pollution-related HSE risks
Page 33
Page 31
D6.2 Subsurface risks and impacts of shale gas operations Copyright © M4ShaleGas Consortium 2015-2017
Table A2 Transitions between states (i and j) for which preventive measures (PM) may be
implemented to lower the probability that the transition occurs.
StateI
Statej
Preventive Measure (PM)PM
Comments/examples
0 0 1 regulations & internal procedures lowers all probabilities of deviating from the base state with a properly functioning well
0 2, 3, 5, 6 2 subsurface characterization mainly lowers probability of out of zone fracturing and problematic induced seismicity
0 1, 4, 7, 8, 10 3 proper well design & construction mainly lowers probabilities of well-related incidents
0 1-9 4 safe & efficient design of operations lowers probabilities of all operations-related incidents
0 9-11 5 traffic light systems leakage lowers probability of surface contaminations becoming widespread (HSE risk)
0 12 6 traffic light systems seismicity lowers probability of acceptable seismicity becoming problematic (HSE risk)