Project: Freight Logistics Coordination Team Major Consultancy Support to Work Program Supply Chains in Tasmania Reference: 234986 Prepared for: Department of Infrastructure, Energy and Resources Revision: 0 30 August 2013
Transcript
Project: Freight Logistics Coordination Team Major Consultancy Support to Work Program
Supply Chains in Tasmania
Reference: 234986
Prepared for: Department of Infrastructure, Energy and Resources Revision: 0
30 August 2013
DocumeDocumeAureconABN 54 AureconLevel 8, DocklandPO Box DocklandAustralia T F E W
+61+61melaure
A persona) Using
copy b) Using
Docume
Report T
Documen
File Path
Client
Rev Da
0 24
1 01/
2 12/
Current R
Approva
ent Control Rent prepared n Australia Pt005 139 873
n Centre 850 Collins ds VIC 300823061 ds VIC 8012
a
3 9975 300 3 9975 [email protected] using Aureg the documentsversion.
g the documents
ent control
Title
nt ID
h
ate
May 2013
/08/2013
/09/2013
Revision
al
Record by: ty Ltd 3
Street 8
2
0 4 recongroup.com con documes or data in elec
s or data for any
Supply
P:\IND\2Tasman
DepartmEnergy a
Revisio
Initial Dra
Draft for F
Internal R
0
com
ents or data actronic form with
y purpose not a
Chains in Ta
234986 DIER ia 20130802.d
ment of Infrastand Resource
n Details/Sta
aft
FLCT review
Review
Project 234986
accepts the rhout requesting
greed to in writi
asmania
Pro
- Freight Logisdocx
tructure, es Cli
tus Pre
Ap
Na
Tit
File Auercon Supply
risk of: and checking th
ing by Aureco
oject Number
stics\report\23
ent Contact
epared by A
MNMNMN
prover Signat
ame
le
Chains Report Part I
hem for accurac
n.
r 2
34986 DIER -
DIna
Author V
MS/NDS/NP
MS/NDS/NP/PC
S
MS/NDS/NP/PC
K
ure
P
SM
(Supply Chains) 30 ARevisi
cy against the o
234986
FLCT Supply
Department nfrastructure
and Resource
Verifier A
P
SM P
KK P
Peter Carney
Supply ChainManager
August 2013ion 0 Page 2
original hard
y Chains in
of e Energy es
Approver
PC
PC
PC
y
n
Project 234986 File Auercon Supply Chains Report Part I (Supply Chains) 30 August 2013Revision 0 Page 1
Disclaimer
This report has been prepared solely for the benefit of the Freight Logistics Coordination Team (FLCT) and in accordance with instructions given by or on behalf of the FLCT and in the circumstances which existed at the time of preparation. It is not possible to make a proper assessment of the report without a clear understanding of the terms of engagement under which the report has been prepared, including the scope of the instructions and the directions given to and the assumptions made by those who prepared the report. The report may not address issues which would need to be addressed if the particular intention, environment, circumstances, time, requirements and brief are different from those for which this report has been prepared. This report may also make assumptions about matters which a third party may not be aware. It should not be used or relied upon or used for any other project or in a different set of circumstances and requirements without an independent check being carried out as to its suitability, relevance or accuracy. Aurecon accepts no responsibility or liability for the consequences of the report or the information contained therein being used or relied upon for a purpose other than the purposes for which it was commissioned at the time of the commissioning or for any unauthorised use by its client or any third party.
The information in this report has been collected through detailed interviews with industry, peak organisations and infrastructure providers. The information collected includes both business-related data and the confidential views of participants. Confidentiality of discussions and the aggregation of data and views were key components supporting stakeholder participation.
Project 234986 File Auercon Supply Chains Report Part I (Supply Chains) 30 August 2013Revision 0 Page 2
Contents
Contents 2
1. Executive Summary 5
1.1. Background 5
1.2. The Nature of Tasmania’s Supply Chains 5
1.3. Findings 6
1.4. Recommendations 8
2. Tasmania’s Freight System and Container Freight Profile 9
2.1. Tasmania’s Freight Task 9
2.1.1 Tasmanian Economy and Population 9
2.1.2 Regional Focus 9
2.1.3 Current and Future Freight Task 11
2.2. Tasmania’s Freight System 14
2.2.1 Road 14
2.2.2 Rail 15
2.2.3 Sea 17
2.2.4 Air 19
2.3. Tasmania’s Container Freight Profile 19
2.3.1 Inbound Container Freight Task 21
2.3.2 Outbound Freight Characteristics 22
3. Supply Chain Quality and Cost Benchmarking 24
3.1. Supply Chain Definition 24
3.2. Approach 25
4. Supply Chain Analysis 27
4.1. Aquaculture (Salmon and Ocean Trout) 28
4.2. Meat (Chilled and Frozen) 32
4.3. Bell Bay Industrial Minerals 35
4.4. Beer 39
4.5. Vegetables (Fresh, Export and Frozen) 41
4.6. Fruit 46
4.7. Zinc 48
4.8. Newsprint 51
4.9. Timber 54
Project 234986 File Auercon Supply Chains Report Part I (Supply Chains) 30 August 2013Revision 0 Page 3
4.10. Dairy 56
4.11. Retail 60
5. SIW Distribution Centre (DC) 60
6. Representative Supply Chains 64
6.1. Supply Chain Quality: Summary of Comments 66
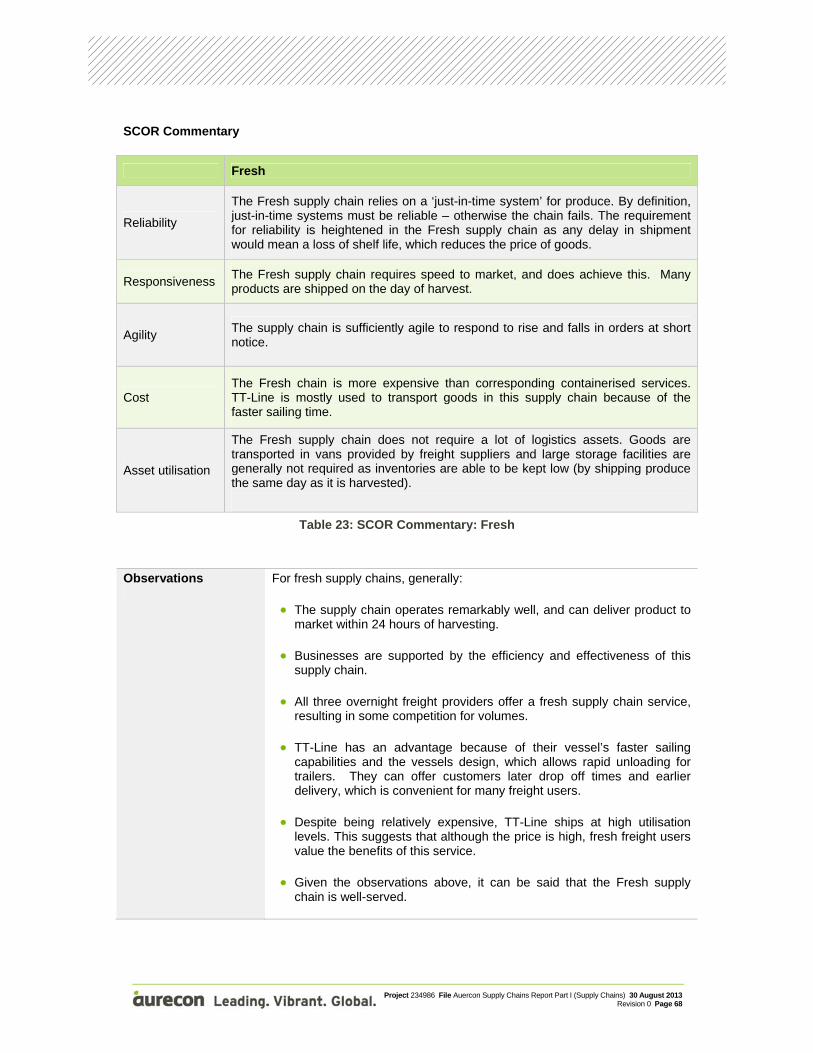
6.2. Fresh 67
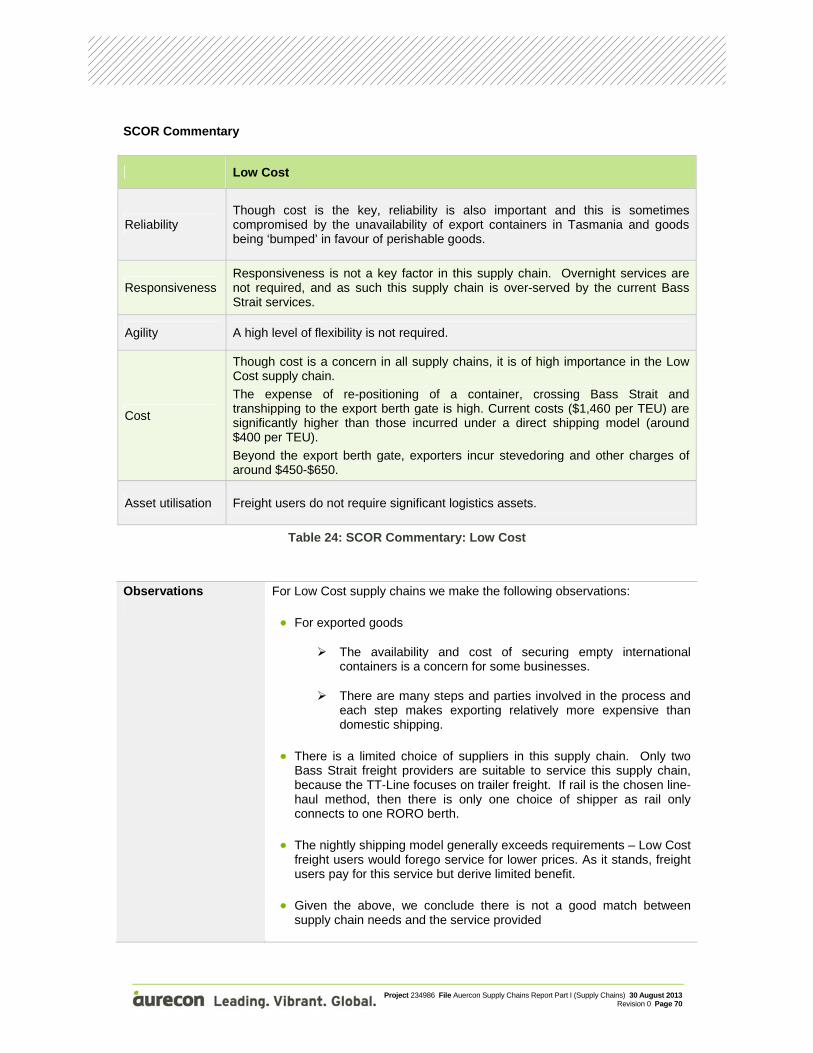
6.3. Low Cost – via Melbourne 69
6.4. Low Cost – Direct Export 71
6.5. Low Inventory 72
6.6. Perishable 74
6.7. Empty Containers 75
7. Review of Tasmanian Supply Chain Costs 76
7.1. Road Freight Services and Rates 77
7.2. Rail Freight Services and Rates 78
7.3. Sea Freight Services and Rates 79
7.3.1 Indicative Shipping Rates 79
7.3.2 Volume Variation in Shipping Rates 80
7.3.3 Empty Container Positioning Costs 81
7.4. Port Costs 82
7.5. Tasmanian Freight Equalisation Scheme 83
7.5.1 Structure 83
7.5.2 TFES and Exports 85
7.6. Medium Volume Shipper Breakdown of Prices 86
7.7. Export 87
7.8. Cost Benchmarking 88
8. Findings 93
8.1. Supply Chains 93
8.2. Innovation 93
8.3. Efficiencies 94
8.4. Inefficiencies 94
8.5. Excess Empty Containers 95
8.6. Freight Service 96
8.7. Shipping Capacity 96
8.8. Freight Costs 97
8.9. Export Freight Costs 97
8.10. Data Availability 98
Project 234986 File Auercon Supply Chains Report Part I (Supply Chains) 30 August 2013Revision 0 Page 4
8.11. Market Structure 98
9. Opportunities for Improvement 99
9.1. Capacity Expansion for Shipping 99
9.2. Shipping from Bell Bay 99
9.3. Empty Container Positioning 99
9.4. Freight Data Base 100
9.5. Supply Chain Optimisation 100
9.6. Industry Structure 100
9.7. Innovation Forums 101
9.8. Assistance for Export 101
10. Appendices 102
List of Tables and Figures 103
Commodity Classifications 105
References 107
Companies Contacted 109
Project 234986 File Auercon Supply Chains Report Part I (Supply Chains) 30 August 2013Revision 0 Page 5
1. Executive Summary
1.1. Background
The Freight Logistics Coordination Team (FLCT) was established as part of a one-off $20 million Australian Government funding package to assist Tasmanian exporters following the cessation of international container shipping services to Tasmania in 2011.
The FLCT is an independent expert advisory body comprising 19 senior representatives from major shippers and producers, infrastructure providers, freight logistics companies and peak industry bodies. The FLCT has a clear focus on outcomes that deliver improved freight efficiency for Tasmanian businesses, and support business growth.
As part of the FLCT’s work, Aurecon was engaged to undertake a major study on supply chain quality, cost and benchmarking. The objectives of this study are to undertake a detailed analysis of:
transport and logistics supply chains across key commodity groups and benchmark them in terms of quality and cost; and
the cost of shipping as a modal component of the supply chain.
Consistent with these objectives, the outcomes of the study are presented in two reports:
1. Tasmanian Supply Chains
Aurecon examined the supply chains of all major non-bulk commodities produced within Tasmania, and provided quantitative information and expert qualitative observations on the costs, quality and efficiency of supply chains at both an individual and aggregated level. The study has involved detailed interviews with a wide range of freight users and stakeholders, supported by site visits, analysis of freight and cost data and our own industry knowledge.
2. Tasmanian Shipping and Ports
This report examines shipping as a modal component of Tasmania’s supply chains, including cost, capacity and the relative efficiencies of Bass Strait shipping services and Tasmania’s three northern ports. It also investigates the underlying cost considerations to vessel owners which form the basis of freight rates and considers the potential for the resumption of direct call international shipping services to Tasmania’s north coast.
1.2. The Nature of Tasmania’s Supply Chains
Tasmania’s economy relies on demand from larger interstate and international markets due to the small size of local demand for most products. It is also reliant on imports to supply many industry and community needs, particularly retail goods. Tasmania’s physical separation from interstate and
Project 234986 File Auercon Supply Chains Report Part I (Supply Chains) 30 August 2013Revision 0 Page 6
international markets creates a dependency on Bass Strait shipping (unlike other states where there are road or rail alternatives) for which efficiency and cost is critical.
The majority of inbound freight is made up of retail market segment goods and empty containers. The retail goods are consumed by Tasmanians while the empty containers are brought in to be filled with goods and produce destined for export markets.
The supply chain for retail markets necessarily follows population centres. Goods are shipped to distribution centres (DCs) in Hobart, Launceston, Devonport and Burnie and delivered to end markets. Freight forwarders such as Toll, SeaRoad, Fresh Freight and SRT manage these freight flows.
With overnight delivery from Melbourne 7 days per week, goods can reach Tasmania in a short time. Goods ordered in the morning of one day can be on supermarket shelves by the afternoon of the next day.
Outbound freight has a different pattern to inbound freight. Tasmania’s industries and farms produce a range of products from high value seafood and berries to minerals and other commodities, such as paper. They have in common a “make and ship” supply chain. Only small amounts of the output of Tasmania’s farms and industries are held in Tasmania. Most output is held on the mainland, closer to end markets (for manufactured goods) or simply delivered directly to end markets (for fresh goods).
The Tasmanian freight system has evolved to support this “make and ship” business model. The reverse is also true as some business models have evolved to take advantage of the freight service.
Outbound freight is transported from production and harvest/processing locations to a port. These are largely (but not entirely) point to point supply chains (that is, there are no intermediate stops). Being point to point there is not a lot to improve, as once goods are on a truck or train their movement is efficient.
The area to look for improvement in Tasmania’s freight system is therefore at the system level. It is the manner and nature of interactions between supply chains where improvements may be found.
1.3. Findings
The key findings of this study are:
Tasmanians are well served by their shipping providers. An efficient, timely, reliable and frequent service is provided by three shipping providers. The existence of three providers is a benefit in itself as it enables a degree of redundancy in the system should interruptions occur.
Individual supply chains, as a result of good shipping services and coordinated transport services to meet shipping, are very efficient. Goods produced from almost anywhere in Tasmania on one day are able to be shipped that evening and delivered into mainland markets by the following day.
Tasmania’s roads are largely uncongested, which is a benefit to freight users.
Tasmanian businesses have adjusted their supply chains to take advantage of the frequency and reliability of freight services. While only a small percentage of freight users (15%) need an overnight service, about half of the freight (51%) from Tasmania takes advantage of it.
Project 234986 File Auercon Supply Chains Report Part I (Supply Chains) 30 August 2013Revision 0 Page 7
As good as the service is, it is a one size fits all offering and this does not always suit. Some Tasmanian businesses derive no particular value from an overnight shipping service, but in the absence of an alternative must pay for this service level and use these services.
Transport companies have invested and are continuing to invest to improve their equipment and facilities to service Tasmanians. Examples of investment include new truck fleets, new container forklifts, capital expenditure at ports and new depots.
Similarly, the Government is investing to improve infrastructure, notably in rail, road and at intermodal terminals.
In benchmarking shipping costs, we found that Bass Strait shipping is 24% more expensive than a similar European service. It should be noted, however, that input costs of Bass Strait freight providers (labour costs and fuel) are estimated to be around 23% more expensive than European costs.
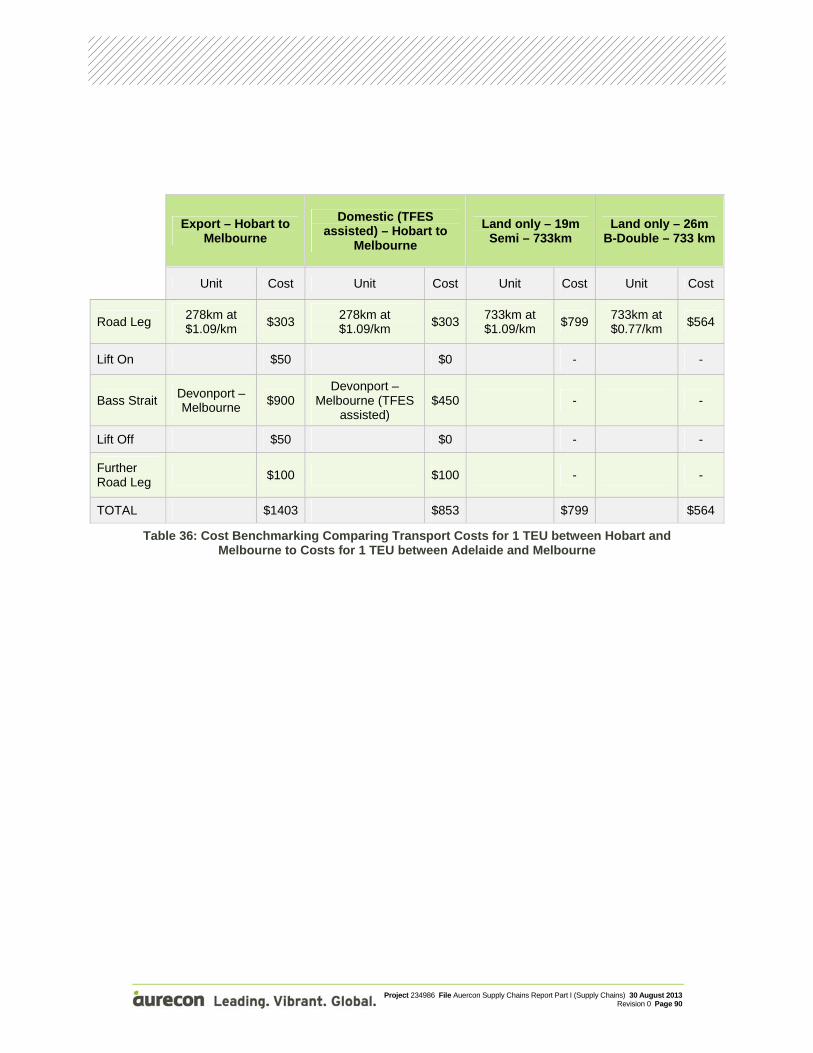
The benchmark Hobart to Melbourne cost of shipping is $1,403/TEU. With TFES assistance this can reduce to $853. A comparable journey on the mainland using road transport costs between $564 and $799.
In benchmarking road freight costs we found that Tasmanian road freight is priced similarly to mainland road freight. An indicative freight rate is $1.09/TEU/km. We found there are several road freight providers and that this market is competitive.
As with all industries, freight pricing follows volume and volatility. Freight users with low volumes or who have highly seasonal requirements will pay more than large volume steady producers. We understand large freight users enjoy considerable discounts to nominal rates.
TFES is a major benefit for domestic shippers who qualify for assistance. The cost of freight can be reduced to between one-third and one half of the usual wharf to wharf costs.
Exporters from Bell Bay face significantly higher costs following the cessation of direct shipping. Goods must be transported from Bell Bay to either Devonport or Burnie and empty containers must be relocated to Bell Bay. These steps add to complexity and cost. We estimate the additional cost to be $1,000-$1,300 more per TEU.
Individual industries and businesses are innovative. For example, for one confectionary manufacture business there has been a reduction in costs and improved service through shortening lead times, removing logistics steps, improving asset utilisation and introducing automation where appropriate.
There is evidence of planning shortcomings across Tasmanian supply chains and this is where opportunities for improvement lie.
The movement of empty containers appears to be excessive with more than 25% of the total freight task being empty containers.
Sourcing empty international shipping containers can be difficult. Tasmania faces an imbalance of freight. Fewer international imports arrive than leave Tasmania, which means that empty containers must be brought in. Shipping providers always favour full containers over empties and when capacity is tight fewer empties are shipped.
Project 234986 File Auercon Supply Chains Report Part I (Supply Chains) 30 August 2013Revision 0 Page 8
Bass Strait shipping is capacity constrained at times. In the lead up to Christmas it can be difficult to move freight inbound and around harvest time in Tasmania (from February to May) some freight is not shipped because of capacity constraints.
The availability of freight data is scarce. Reliable and reportable data does not exist in the public domain at a level that is helpful for analysis of the freight system.
There are competing plans for the development of Tasmanian ports. Some interests wish to see Bell Bay developed, whilst others advocate for development at Burnie. The existence of competing development plans creates uncertainty for business investment.
Shipping options are constrained. Should rail be the preferred form of linehaul from Hobart, as is the case with heavy freight, the only shipping option is to send freight via Burnie.
1.4. Recommendations
An increase in shipping capacity is recommended, given that shipping capacity is near its practical limit and that this is adversely affecting freight services at present.
Weekly RORO shipments for freight from Bell Bay by one of the existing shippers should be considered. A substantial market for freight exists in Bell Bay which does not require a daily service. Direct shipping from Bell Bay would save the cost of a road leg and simplify logistics. It would also provide an alternative port for heavy freight that travels on rail.
A clear strategy on Ports is required. We understand that this is currently in development.
Empty container repositioning should be investigated. In addition, to the impact of these containers on Bass Strait Shipping capacity, re-positioning empty containers presents a notable cost to freight users. There may be a case for pooling containers.
Consideration should be given to the state wide planning of freight movements. Better planning offers the opportunity to reduce the carriage of empties on ships, reduce empty backhauls for trucks, intelligently route freight to rail, eliminate the stranding of freight and reduce the number of vehicles on roads.
With agriculture on the verge of significant expansion in Tasmania, it may be appropriate to commence down the path of co-operative industry structures to achieve economies of scale, as has been achieved in New Zealand. New Zealand presents some compelling models of effective co-operative systems. There are examples of single desk marketing initiatives (Zespri, ENZA) which have also influenced growing, product development, freight purchasing and distribution.
We consider there is the opportunity to share examples of innovation in supply chain and logistics with others in Tasmania. Innovation tends to be held within company walls. Where businesses do not compete with each other, a forum of interested peers could meet with an innovation agenda in mind.
Consideration should be given to measures to assist export freight users. Over time expenditure on direct freight assistance could be diverted to infrastructure improvements that improve the competitiveness of the supply chain.
Project 234986 File Auercon Supply Chains Report Part I (Supply Chains) 30 August 2013Revision 0 Page 9
2. Tasmania’s Freight System and Container Freight Profile
This section provides an overview of Tasmania’s freight system and container freight profiles as background context for the supply chain analysis review.
2.1. Tasmania’s Freight Task
2.1.1 Tasmanian Economy and Population
Tasmania has a small economy, and a small, highly dispersed population. Due to the small size of local demand, the economy relies on trade with interstate and international markets as a major source of income. Major industry sectors for the State are manufacturing, mining, agriculture, fisheries, forestry and tourism.
As an island, air and sea links to access markets are essential. Around two thirds of Tasmania’s total freight task comprises goods moving in to or out of the state. The majority of container movements out of Tasmania are destined for domestic markets. Imports are vital for industry inputs and consumer goods not produced locally.
The Tasmanian economy is currently undergoing a period of structural change driven by a downturn in traditional industries such as forestry. Tasmanian Treasury forecasts indicate Tasmanian Gross State Product is expected to grow at a rate of 1.75% in the short term and at a rate of 2.25% per year in the medium term.
The current population is just over 500,000. Population projections for the State indicate a moderate population growth over time with growth focused in urban areas. Tasmanian Treasury forecasts indicate Tasmania’s population growth will remain steady at 0.4 % in 2012-13, increasing to 0.5 % for 2013-14 and subsequent years. Growth will be highest in Greater Hobart. Launceston is forecast to grow in line with overall population growth rates, with lower growth in the Burnie-Devonport region.
Economic activity underpins demand for transport infrastructure. Forecast population growth and growth in key sectors of the economy such as agriculture and mining will lead to increased demand for freight movement over the next 30 years. Detailed assessment of future demand across key industry sectors, together with analysis of current and likely future infrastructure constraints will drive the long term supply strategies for Tasmania’s transport infrastructure.
2.1.2 Regional Focus
Tasmania’s freight task has a clear regional element. Each major region – North West, Northern and Southern - is a significant origin and destination for freight. The diverse location of primary production, processing and industrial centres, and major industries, together with multiple major population centres, are some of the drivers supporting a high regional task. Significant volumes of freight move
Project 234986 File Auercon Supply Chains Report Part I (Supply Chains) 30 August 2013Revision 0 Page 10
between regions as well as from regions direct to a sea or air port. Key characteristics and relationships are described below.
North West Tasmania
Tasmania’s largest freight generating region. Primary production – major agricultural region suited to high intensity dairy, vegetable and
livestock production. Rapid expansion of aquaculture on the West Coast. Processing facilities – supporting primary production several major dairy, vegetable and
livestock processors are located in the North West. The mineral rich west coast generates mineral ores both for export and processing within
Tasmania. Cement production at Railton generates high but localised freight volumes. Containerised freight enters Tasmania through the ports of Burnie and Devonport, with a large
proportion of this moved to the major population centres of Hobart and Launceston. Forestry – undergoing structural change, however the North West contains significant
plantation resources.
Northern Tasmania
Primary production – a range of agricultural commodities are produced, focused mainly on the local government areas of Northern Midlands, Meander Valley, Dorset and Flinders Island.
A large proportion of agricultural products from the region, such as milk and vegetables, are transported to the North West region for processing and subsequent export and/or sale.
Two major mineral processing facilities are located at Bell Bay. Mineral concentrates and some of the finished products are shipped direct, requiring minimal use of the land transport network.
Launceston is the major administrative and retail centre and generates substantial retail demand. Several state-wide distribution centres are located in the region, including those for major supermarkets and beverage companies. A major brewery is also located in Launceston.
Forestry – the North East contains major plantation resources. Operational timber processing facilities, including a large sawmill and export woodchip facility, are located at Bell Bay.
Southern Tasmania
A large proportion of the freight generated in the Southern Region is derived from a few major industries – Nyrstar (Zinc processor), Norske Skog (paper manufacture) and Kraft (Cadbury chocolate).
Other medium sized industries are involved in food and beverage production, meat processing, and despite a downturn over the last few years the Huon, Derwent Valley and Central Highlands still have significant forestry outputs.
Hobart is the largest urban centre in the State and generates substantial demand for consumer goods.
The bulk of the containerised freight destined for southern Tasmania is transported by road; however rail is used for a part of the task.
The majority of freight moving into and out of the Southern Region is moved through Burnie and Devonport ports.
2.1.3
In 2008/million toOutside or proceexport lo
The bulkThis is ilare not ithe indus
Agricultuis in theInvestmedriver ofsuch, roafreight, iMain RoNorth W
1 The forregarding
Current
/09, Tasmanonnes. Appof this road/
essed producocation using
k of Tasmanllustrated beincluded in tstry and unc
Figure 1:
ure is forecase North Weent in irrigatf this future ads in the Nncluding theoad, Birralee
West); and the
restry freight g future harves
5
1,0
1,5
2,0
2,5
3,0
Net To
nne Kilo
meters ('000 000)
and Futu
nia’s total heproximately 8rail task it is cts were trang pipeline.
nia’s freight low (Figure his figure. Tertainty rega
: Projected n
st to be a maest and Nortion schemesgrowth. The
North and No Bass Highw
e Main Roade Midland Hig
task has beesting schedule
0
500
000
500
000
500
000
2009
ure Freig
avy freight t88% of this t
estimated thnsported dire
task is gene1), noting thThe forestry arding future
net tonne pe
ajor growth ath of the Sts in all regioe majority of
orth West areway (Smithtod and Batmaghway.
en excluded des and process
9 TFS 2029
Project 234986
ght Task
task moved task was trahat an additioectly from sh
erated by agat mineral otask has beharvesting s
er kilometre
area for Tasmtate, with mons of the Stf agriculturae likely to exn to Illawarra
an Highway
due to structusing locations
9 Projection
File Auercon Supply
on the road nsported ononal 3 to 4 mhip to wharf-
griculture, cores which doen excluded
schedules an
e by Sector (
mania. The most process
tate, includinl freight mov
xperience thea Main Road(linking the
ural changes s.
Constr
Agricul
Consum
Cemen
Empty
Manuf
Basic m
Mining
Chains Report Part I
and rail net road with th
million tonnes-side proces
onstruction, o not use thed due to strucnd processing
(excluding f
majority of asors locatedng the Southves on the re highest incd); Bridport MNorth East
within the in
uction inputs
ltural product
mer goods
nt and coal
containers
facturing good
metal product
g ores and Zin
(Supply Chains) 30 ARevisio
twork was ahe remaindes of bulk minssing or from
mining, ande road or raictural changg locations.
forestry) 1
agricultural p in the Norhern Region road networkcreases in agMain Road, Fto processo
ndustry and u
ts
ds
s
c
August 2013on 0 Page 11
round 28 er on rail. neral ores m mine to
forestry. l network
ges within
roduction rth West.
is a key k and, as gricultural Frankford ors in the
uncertainty
Project 234986 File Auercon Supply Chains Report Part I (Supply Chains) 30 August 2013Revision 0 Page 12
Proposed expansion of existing mines and development of new mines in Tasmania has the potential to significantly increase freight from this sector over the short to medium term. In the North West, this task will largely be split between rail (Melba line), and road (primarily the Bass Highway and Murchison-Ridgley Highway corridor).
Consumer goods are forecast to undergo a large increase, but will make up a relatively small proportion of the overall task. Most consumer goods are brought into Tasmania via one of the three northern ports. Product is generally moved to urban centres via larger vehicles before being distributed to individual businesses by smaller vehicles. The rail network currently plays a key role in moving consumer goods between ports and southern Tasmania. The movement of consumer goods is likely to increase most strongly on the road and rail corridors between key container ports (Burnie and Devonport) and major urban centres (Hobart, Launceston, Burnie and Devonport).
The movement of construction materials, including bitumen, building materials, concrete, stone, sand and clay, comprise a significant part of Tasmania’s freight task (almost a quarter of the total task by tonnage in 2008/09).
Historically, Tasmania’s state and regional freight task has been dominated by forestry, with high volumes of forestry freight moving intra-regionally to one of three export ports. Market and structural changes have seen this task reduce significantly. The highest forestry freight volumes currently move out of Bell Bay reflecting the location of forestry processing centres in the adjacent Bell Bay Industrial Estate.
Project 234986 File Auercon Supply Chains Report Part I (Supply Chains) 30 August 2013Revision 0 Page 13
Figure 12 shows forecast freight growth across Tasmania. The Burnie to Hobart corridor carries the most significant freight volumes, the majority on the road network.
Figure 2: Current and Forecast Freight Tonnages, Tasmania's Strategic Freight Network
(Source DIER)
2.2. T
2.2.1
By tonnais TasmpopulatioMidland significa
Major reFrankforBell Baymining pconnecteagricultu
Tasma
Road
age, traffic vmania’s most
on centres. THighway, I
nt freight roa
egional freighrd-Birralee-By. The Murchproduct to Bed by the B
ural and fores
ania’s F
olumes and t significant The Corridorllawara Mai
ad, connectin
ht roads plaatman Freighison Highw
Burnie Port fBass Highwastry sectors.
Fig
Freight
strategic lanfreight corri
r extends froin Road, Brng to the Bell
y a critical rght Corridor, way is the kefor export. Ty from Smit
ure 3: Tasm
Project 234986
t Syste
nd use connedor, connecm Burnie Porooker Highwl Bay Port an
role in movinconnecting
ey freight linThe highly pthton to Bur
manian Majo
File Auercon Supply
em
ections, the cting major ort to Hobart,way. The End Industrial
ng freight tothe North Eak out of the
productive Nnie port and
r Road Netw
Chains Report Part I
Burnie to Hoports, proce, and include
East Tamar Estate.
o/from this keast and Nort
e West Coasorth West c
d is particula
work
(Supply Chains) 30 ARevisio
obart Freightessing, induses the Bass
Highway is
ey corridor, th West regist, moving hcorner of thearly importan
August 2013on 0 Page 14
t Corridor strial and Highway,
s another
including ions, and igh-value
e state is nt for the
Project 234986 File Auercon Supply Chains Report Part I (Supply Chains) 30 August 2013Revision 0 Page 15
Tasmania has an extensive road network, which is generally efficient, with few capacity constraints. When compared to mainland states, Tasmania has little or no congestion, with the exception of major urban corridors during peak commuter peiords. This operating environment facilities reliable freight services and provides good access to port and major freight precincts. The reliability and efficiency of the system supports just in time freight services. Added to this, the relative size of Tasmania is a unique advantage for the freight industry. For example, of the major urban centres the furthest apart is Hobart to Burnie (279km). This trip can be undertaken in approximately 3 hours 15 minutes. This is significant as it allows for a truck to be loaded at one location, transported to the other, unloaded and then repacked with a new load and then transported to the original location within a regular working day. This is highly efficient as it removes the need for driver changes or rest breaks which are a common feature of mainland interstate travel.
Tasmanian freight is served by a number of transport providers. Some specialise in particular freight, such as refrigerated fresh food, others specialise in regional locations. The road freight task is served by a range of vehicles. Some of the most commonly used vehicles include, rigid vehicles, tautliners, refrigerated pantech, 19m semi-trailers and 26m B-doubles. Anecdotal evidence suggests that some specialised vehicles, such as a side loader, can be both expensive and difficult to access.
On arrival, inbound freight is moved predominantly by truck to distribution centres for deconsolidation. The major distribution centres are located in Devonport, Launceston, Burnie and Hobart. From these distribution centres freight is distributed to end-points. Full containers that do not need de-consolidation for customers proceed from ship to customer. The reverse flow occurs for outbound freight.
2.2.2 Rail
Tasmania’s rail freight system is owned and operated by TasRail which was established as a vertically integrated State owned corporation in 2009. This followed a period of private ownership, where network and service operations were undertaken by separate entities.
Tasmania’s operational rail network consists of 632km of single line track. To facilitate two-way movement of trains, there are a number of passing loops on the network. Lengths of passing loops dictate maximum train lengths, and the Tasmanian network can generally accommodate trains between 800-900 metres long.
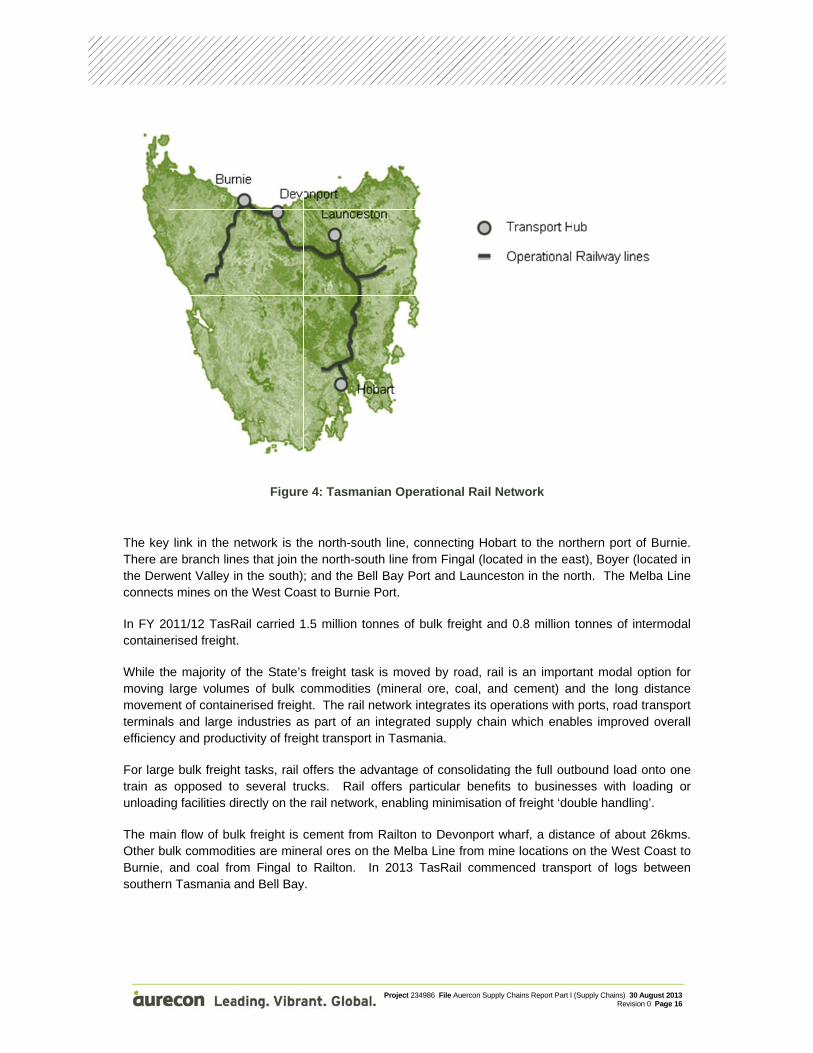
The key There arthe Derwconnects
In FY 20containe
While thmoving movemeterminalsefficienc
For largetrain as unloadin
The maiOther buBurnie, southern
link in the nre branch linwent Valley is mines on th
011/12 TasRerised freight
he majority olarge volum
ent of contains and large
cy and produc
e bulk freighopposed to
ng facilities d
n flow of buulk commoditand coal fro
n Tasmania a
Figure
network is thes that join tn the south)he West Coa
Rail carried 1.
of the State’ses of bulk c
nerised freighindustries asctivity of freig
t tasks, rail oo several truirectly on the
lk freight is cties are mineom Fingal toand Bell Bay
e 4: Tasman
he north-southe north-sou; and the Beast to Burnie
1.5 million to
s freight taskcommodities ht. The rail ns part of an ght transport
offers the aducks. Rail e rail network
cement fromeral ores on o Railton. Iy.
Project 234986
nian Operati
th line, connuth line fromell Bay Port a
Port.
onnes of bulk
k is moved b(mineral or
network integintegrated s
t in Tasmania
dvantage of coffers partick, enabling m
m Railton to Dthe Melba Ln 2013 Tas
File Auercon Supply
onal Rail Ne
necting HobaFingal (loca
and Launces
k freight and
by road, rail re, coal, andgrates its opesupply chaina.
consolidatingcular benefitsminimisation
Devonport wine from min
sRail comme
Chains Report Part I
etwork
art to the noted in the ea
ston in the no
d 0.8 million
is an importd cement) anerations with
n which enab
g the full outs to businesof freight ‘do
wharf, a distane locations enced transp
(Supply Chains) 30 ARevisio
rthern port oast), Boyer (lorth. The Me
tonnes of in
tant modal ond the long
h ports, road bles improve
tbound load sses with lo
ouble handlin
ance of abouon the West port of logs
August 2013on 0 Page 16
of Burnie. ocated in elba Line
ntermodal
option for distance transport
ed overall
onto one oading or ng’.
ut 26kms. Coast to between
Project 234986 File Auercon Supply Chains Report Part I (Supply Chains) 30 August 2013Revision 0 Page 17
There is reasonable prospect that several mineral projects will commence operations in the short to medium term. If these projects are realised the rail system is well placed to support them with resultant growth in the bulk side of its business.
Rail also participates in the intermodal market primarily on the north-south line between Hobart and the Port of Burnie. Newsprint and Zinc Ingots make up a large part of the volume moved. For non-time sensitive products rail is an attractive proposition. Rail has approximately 10% market share of the intermodal freight in Tasmania. In this market sector rail competes with road transport.
2.2.3 Sea
Tasmania relies on moving freight in and out of the state by sea through its sea ports. Each region has at least one major port involved in the shipment of bulk materials:
South: Hobart: movement of bulk fuel, mineral concentrate, logs and forestry products. Prior to the forest industry downturn in 2010 a major woodchip export facility operated from Triabunna.
North: Bell Bay: bulk mineral concentrate, woodchips, coke, metal products and fuel. North West: Burnie: bulk mineral concentrate, logs and fuel. Devonport: cement and fuel. Port Latta (privately owned port facility): mineral concentrate.
A large component of Tasmania’s sea freight task by volume is ‘bulk freight’ – for example, mined ore concentrates, fuel, cement and woodchips – or ‘break bulk’ – for example, un-containerised wood products. Bulk freight is largely in the domain of single companies who charter vessels to ship their particular commodity, in some cases to/from privately owned wharf facilities.
Containerised freight and freight contained in trailers forms the other major component of the sea freight task.
Table 1 shows freight flows through Tasmania’s four major ports. The three northern ports carry the highest bulk and container freight volumes, with Burnie Port catering for the highest total volumes. All three northern ports carry significant volumes of bulk freight, although the highest bulk freight volumes are moved through the privately owned facility at Port Latta (2.5 million tonnes per year).
The shipment of containerised and RORO freight occurs out of two ports – Burnie and Devonport, with approximately 240,000 and 200,000 annual TEU movements respectively. Bell Bay Port previously carried higher container volumes – around 90,000 TEU movements in 2009 – however the withdrawal of international container services through Bell Bay has seen TEU numbers fall to around 6,000 TEU in 2011/12.
Project 234986 File Auercon Supply Chains Report Part I (Supply Chains) 30 August 2013Revision 0 Page 18
Total (Tonnes) 11,214,933 3,744,349 3,357,326 2,332,857 1,780,401
Total (TEU) 448,864 242,284 200,695 5,885 0
Source: TasPorts communication to study team, April 2012 Flows of ‘Minerals Concentrate’ through Burnie are mainly outbound, but generally inbound to processing plants through Bell Bay and Hobart ports.
‘Other’ covers the outbound flow of cement through Devonport, and processing by-products through Hobart.
Table 1: Freight Task Throughput of Tasmania’s Major Ports 2011-12
Shipping services across Bass Strait are provided by SeaRoad Shipping, Toll–ANL and TT-Line. SeaRoad Shipping and Toll-ANL provide an overnight service six days per week. TT-Line provides an overnight service from Tasmania seven days per week, and has a slightly faster crossing time. Each of the service providers operate independently from their own terminals. The carrying capacity and characteristics of a typical vessel for each carrier is:
Toll-ANL: 500 TEU plus general freight (containers, trailers, agricultural equipment, break bulk) SeaRoad Shipping: 180 -260 TEU plus trailers (containers and trailers) TT-Line: 175 TEU (trailers, cars, caravans)
We estimate monthly capacity to be 23,000 TEU. We consider effective capacity to be 85% of this figure, 19,550 TEU. Effective capacity is the capacity at which the system operates well. At this utilisation the system can recover from unplanned outages or unexpected peaks within a reasonable time frame.
Swire Shipping operates a multipurpose vessel on a 32-day rotation through to Korea and China, calling at Bell Bay for Bell Bay Aluminium cargos. This service is relatively new and picks up break bulk as well as containerised cargoes. There is a small amount of container capacity for other exporters.
The features, benefits and relative efficiencies of Bass Strait Shipping are discussed in greater detail in the accompanying report ‘Tasmanian Shipping and Ports’.
Project 234986 File Auercon Supply Chains Report Part I (Supply Chains) 30 August 2013Revision 0 Page 19
2.2.4 Air
Air freight carries approximately 17,000 tonnes of freight in Tasmania annually. This represents less than 1% of Tasmania’s freight task by volume. Due to its higher cost, when compared to sea freight, use of air freight is characterised by high end, high value products. This includes a mix of perishable, time sensitive products such as abalone, crayfish, cut flowers and berries. These products are seasonal with mail underpinning the service. Air freight is not eligible for TFES assistance.
From stakeholder discussions we gathered the following information. Tasmania is a net importer of air freight with freight capacity typically full inbound. We understand that growth in internet shopping has somewhat contributed to this allied to a base load of mail and newspapers. There is typically spare capacity outbound; however, capacity is often reached at Christmas and Easter. Approximately 85% of outbound products are destined for international markets. These products can be transferred at Tullamarine airport onto international services.
Air freight services are available from Hobart and Launceston Airport. The major air freight providers are Australian Air Express and Toll. Services are provided in the belly-hold of passenger services as well as specialised freighter services. Australian Air Express (AAE) provides two dedicated freight services daily from Tasmania to Tullamarine airport in Melbourne. One flight connects Hobart and a second connects Launceston each with a capacity for 15 tonnes. Anecdotal evidence suggests that the AAE fleet could double its service if required. Discussions with a fruit industry peak body indicated a charter was considered but discounted on a cost basis when compared to TT-Line. Similar to other freight services, air freight is a dynamic offering with better service and increased frequency, but at a higher price. For example, AAE can offer a service on the next available Qantas passenger flight for a higher price or an overnight service on its dedicated aircraft for a lower price.
2.3. Tasmania’s Container Freight Profile
Between FY2001 and FY2008, the Tasmanian economy grew at an average of 3.4%. Over the same period, TEU volumes (containerised and RORO freight) increased by 60%, representing an average annual increase of 8%.
In the four years following the FY2008 peak, total TEU declined by 9%, at an average annual decrease of 2%. Three key trends are notable over this period: the cessation of container freight through Hobart; decline in container freight volumes through Bell Bay; and consolidation and growth of container volumes through Burnie and Devonport ports.
Project 234986 File Auercon Supply Chains Report Part I (Supply Chains) 30 August 2013Revision 0 Page 20
The inbound and outbound flow of Tasmania’s container task for the last five years is shown in the tables below.
Port "Market Share"
FY Bell Bay Devonport Burnie Hobart Total Devonport Burnie
07/08 46,372 87,913 109,970 2,076 246,331 36% 45%
08/09 45,339 86,782 103,475 0 235,596 37% 44%
09/10 22,246 93,840 114,205 0 230,291 41% 50%
10/11 24,689 93,282 115,142 0 233,113 40% 49%
11/12 2,412 101,341 121,776 0 225,529 45% 54%
Source: TasPorts Annual Report FY 11/12
Table 2: Inbound Freight (TEU) Task and Port Market Share
Port "Market Share"
FY Bell Bay Devonport Burnie Hobart Total Devonport Burnie
07/08 43,086 83,123 117,267 1,678 245,154 34% 48%
08/09 46,587 82,282 109,720 0 238,589 34% 46%
09/10 24,117 90,902 115,646 1 230,666 39% 50%
10/11 23,001 90,759 116,473 1 230,234 39% 51%
11/12 3,473 99,353 120,508 0 223,334 44% 54%
Source: TasPorts Annual Report FY 11/12
Table 3: Outbound Freight (TEU) Task and Port Market Share
Project 234986 File Auercon Supply Chains Report Part I (Supply Chains) 30 August 2013Revision 0 Page 21
2.3.1 Inbound Container Freight Task
The major inbound container commodities to Tasmania are retail, empty containers and industrial products.
The key characteristics of the inbound task are:
54% of inbound freight is retail products, with manufacturing goods the major commodity within this commodity type.
The main destination for retail freight are the major population centres of Hobart, Launceston and Burnie-Devonport.
21% of inbound freight is empty containers.
Less than 5% of inbound freight, or 11,000 TEU, has been transhipped as part of an international import.
There are two major seasonal peaks: October, driven by an influx of retail goods for Christmas; and March to May, related to an inflow of empty containers for agricultural exports.
The seasonal movement of freight into Tasmania is shown below.
The top four outbound commodities of empty containers, agriculture, retail and industrial products account for almost 90% of total containerised exports.
0
5000
10000
15000
20000
2500007‐2008
09‐2008
11‐2008
01‐2009
03‐2009
05‐2009
07‐2009
09‐2009
11‐2009
01‐2010
03‐2010
05‐2010
07‐2010
09‐2010
11‐2010
01‐2011
03‐2011
05‐2011
07‐2011
09‐2011
11‐2011
01‐2012
03‐2012
05‐2012
Freight Entering Tasmania19550 TEU Effective Capacity
(85% 0f 23k TEU)
Project 234986 File Auercon Supply Chains Report Part I (Supply Chains) 30 August 2013Revision 0 Page 23
Empty containers and trailers account for 33% of outbound freight volumes.
Around 17% of the outbound task, or 37,000 TEU, is transshipped for international export. The major commodities within this task are zinc, newsprint, vegetables and aluminium.
Outbound freight volumes peak between February and May, reflecting the movement of large volumes of agricultural products. The volume of agricultural exports is growing.
The seasonal movement of freight out of Tasmania is shown below.
Figure 8: Monthly Bass Strait TEU Flow
19550 TEU Effective Capacity (85% 0f 23k TEU)
Project 234986 File Auercon Supply Chains Report Part I (Supply Chains) 30 August 2013Revision 0 Page 24
3. Supply Chain Quality and Cost Benchmarking
The objective of this study was to analyse and better understand Tasmanian supply chains, including service and quality, and to benchmark supply chain costs against comparable Australian jurisdictions. In this context, this report focuses on:
observations about the quality of supply chains across key commodity groups, including commentary about impediments to supply chain operations;
an analysis of freight costs across commodity groups, with comparison to national benchmarks, where appropriate and available; and
suggestions for improvements to the freight supply chains.
The focus of the study was containerised freight, and mostly outbound flows, however some observations on bulk freight and inbound containerised freight are made.
3.1. Supply Chain Definition
A supply chain is a system of organizations, people, technology, activities, information and resources involved in moving a product from supplier to customer. Supply chains transform natural resources, raw materials and components into a finished product that is delivered to the end customer. Supply chains move products from input materials, through processing, through distribution, and ultimately to customers2. Each company operates its own specific supply chain, based on its own needs.
Supply chain management is a broad concept with multiple levels. Generally, it is concerned with determining the most efficient supply chain position (balancing cost, service and quality) to service a market.
Freight users make their transport choices based on time, price and reliability. Different industries have different supply chains, for example, consumer goods generally require a greater level of reliability, responsiveness and complexity than primary industry, mining or forestry.
2 Anna Nagurney: Supply Chain Network Economics: Dynamics of Prices, Flows, and Profits, Edward Elgar Publishing, 2006, ISBN 1-84542-916-8
Project 234986 File Auercon Supply Chains Report Part I (Supply Chains) 30 August 2013Revision 0 Page 25
Supply chain mapping identifies and analyses the steps within a supply chain, capturing the transition points or nodes and associated transport links. Figure 9 shows a typical supply chain in Tasmania.
Figure 9: Typical Tasmanian Supply Chain
Generally, the risk of supply chains problems is higher at a node, where a product may be delayed, incorrectly stored or constrained. Problems arise at nodes because there is:
a handover of responsibility;
some loss of information;
a change in the capacity of the system from one process to another; or
a change from a continuous process to a batch process or vice versa.
3.2. Approach
Aurecon interviewed approximately 80 infrastructure providers, freight forwarders, freight providers, freight users, associations and government bodies (a list is provided in Appendix D). These organisations are involved in the production and movement of either major commodities or commodities considered to be of interest to the FLCT.
Supply chains were mapped by both individual commodity groups and representative supply chains. The latter were identified based on the key attributes of perishability, overnight delivery, time sensitivity and cost sensitivity, leading to five key groups: fresh, low-cost, low inventory, perishable and empty (being empty containers).
The individual and representative supply chains that formed part of the study are:
1. Fresh: Vegetables, Fish, Fruit 2. Perishable: Confectionery, Butter and Cheese, Misc Food, Livestock, Meat,
Frozen Vegetables
Project 234986 File Auercon Supply Chains Report Part I (Supply Chains) 30 August 2013Revision 0 Page 26
The steps captured within the supply chain analysis focused on location steps – ‘nodes’ – and transport steps – ‘arcs.’ This approach involves the detailed review of supply chain operations and relationships, including potential inefficiencies, multiple handling issues and the freight and logistics choices made by businesses. An example of a node and arc diagram is illustrated below.
.
Figure 10: Sample Node Arc Diagram
Most interviews included a site visit, usually to production points, hubs, distribution centres or terminals. An important part of the process was the ability to observe business operations and capture anecdotal information.
Data on volumes, seasonality and cost was sought from individual businesses. However in the majority of interviews, freight volumes and costs were not disclosed for commercial reasons despite assurances of confidentiality within the study.
To assist in building volume data, other sources have been used including company annual reports; the Tasmanian Department of Infrastructure Energy and Resources’ (DIER) Tasmanian Freight Survey 2008-09; data from the Port of Melbourne and TasPorts; and a variety of general access documents. Indicative road freight rates were sourced from Transeco, a road freight economics consultancy. Sea freight rates were available from a small number of freight users.
To protect the confidentiality of information collected from individual businesses, representative supply chains have been used. Information is also presented at a generic commodity supply chain level but costs are not included in this analysis given the information is too easily related back to individual businesses.
Project 234986 File Auercon Supply Chains Report Part I (Supply Chains) 30 August 2013Revision 0 Page 27
4. Supply Chain Analysis
Tasmania’s freight supply chains are relatively simple and similar across commodities. Most businesses operate point to point supply chains, typically using two transport modes (e.g. road and sea) as part of a ‘make and ship’ business model.
Tasmanian freight supply chains differ from mainland supply chains which involve both a linehaul and distribution function. For many Tasmanian businesses, goods are packed on site and line hauled to the mainland, then distribution occurs on the mainland.
Opportunities to improve a linehaul function are limited. Considering a commodity or business in isolation, once a product is placed on a truck there is little that can be improved.
The opportunities for improvement in Tasmania are across supply chains and at the system level, considering how supply chains work together, how freight is planned and whether networks can be improved.
This section reviews individual supply chains in terms of their operation, requirements, volumes and transport modes, supported by general observations on quality and efficiency.
Project 234986 File Auercon Supply Chains Report Part I (Supply Chains) 30 August 2013Revision 0 Page 28
4.1. Aquaculture (Salmon and Ocean Trout)
Market The majority of salmon and ocean trout produced in Tasmania are sold in Australian markets. The product has a limited shelf life, making it a time sensitive supply chain.
Salmon and ocean trout are sold in various forms – whole fish (head on gutted); processed (smoked, sliced, etc); and steaks. Customers include wholesale markets, supermarkets and restaurants.
Supply Chain Requirements
The key requirements of this supply chain are responsiveness and reliability. The timing of activities in this supply chain is also important.
Responsiveness
Goods move quickly through the supply chain. The delivery of fresh fish to market is the key objective.
The earlier fish are delivered, the longer the shelf life. Some supermarkets will not accept product with less than 75% shelf life. This requirement is important for fish shipped over longer distances, such as to Brisbane or Perth.
Reliability
The supply chain needs to be robust to disruption.
Timing
Close coordination between the harvesting and processing of salmon and ocean trout and shipping services is very important in maximising freshness.
Volume Three companies are prominent in the industry. Indicative volumes for each are:
Project 234986 File Auercon Supply Chains Report Part I (Supply Chains) 30 August 2013Revision 0 Page 29
Supply Chain Steps
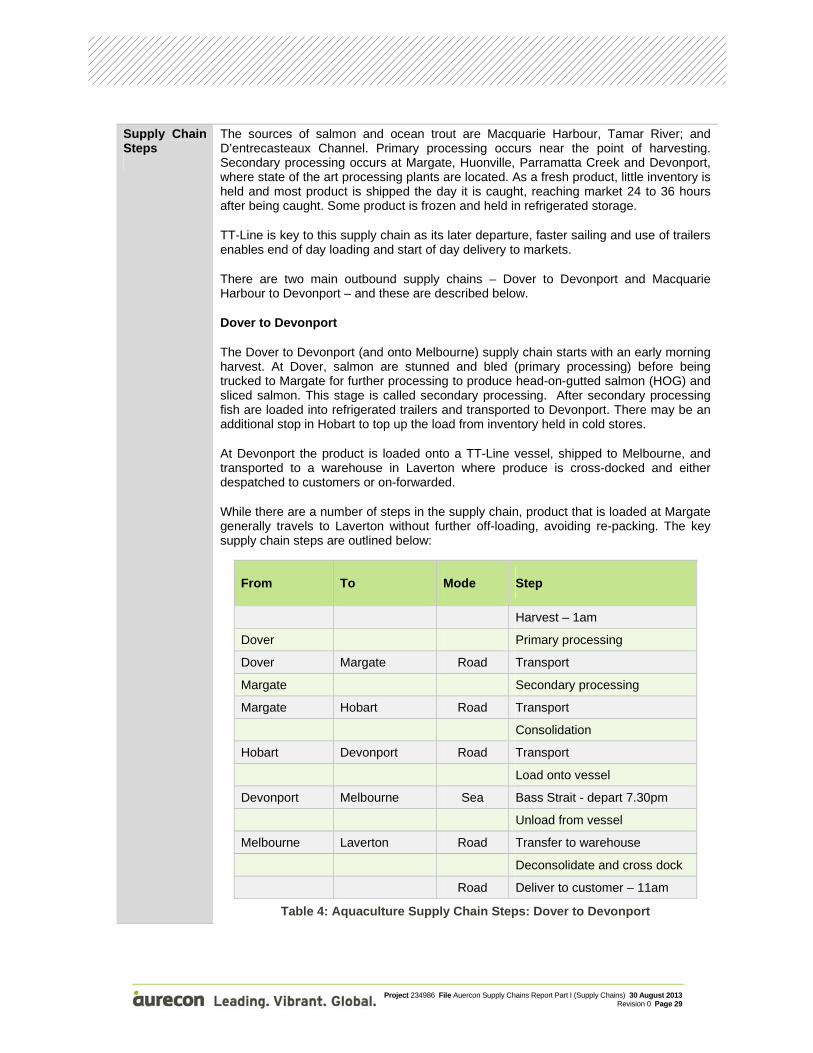
The sources of salmon and ocean trout are Macquarie Harbour, Tamar River; and D’entrecasteaux Channel. Primary processing occurs near the point of harvesting. Secondary processing occurs at Margate, Huonville, Parramatta Creek and Devonport, where state of the art processing plants are located. As a fresh product, little inventory is held and most product is shipped the day it is caught, reaching market 24 to 36 hours after being caught. Some product is frozen and held in refrigerated storage.
TT-Line is key to this supply chain as its later departure, faster sailing and use of trailers enables end of day loading and start of day delivery to markets.
There are two main outbound supply chains – Dover to Devonport and Macquarie Harbour to Devonport – and these are described below.
Dover to Devonport
The Dover to Devonport (and onto Melbourne) supply chain starts with an early morning harvest. At Dover, salmon are stunned and bled (primary processing) before being trucked to Margate for further processing to produce head-on-gutted salmon (HOG) and sliced salmon. This stage is called secondary processing. After secondary processing fish are loaded into refrigerated trailers and transported to Devonport. There may be an additional stop in Hobart to top up the load from inventory held in cold stores.
At Devonport the product is loaded onto a TT-Line vessel, shipped to Melbourne, and transported to a warehouse in Laverton where produce is cross-docked and either despatched to customers or on-forwarded.
While there are a number of steps in the supply chain, product that is loaded at Margate generally travels to Laverton without further off-loading, avoiding re-packing. The key supply chain steps are outlined below:
Table 4: Aquaculture Supply Chain Steps: Dover to Devonport
Project 234986 File Auercon Supply Chains Report Part I (Supply Chains) 30 August 2013Revision 0 Page 30
Macquarie Harbour to Devonport
Salmon are harvested at night, stunned, bled on barges on Macquarie Harbour, and transferred to vehicles (also on barges) for transport to Devonport. The loading of vehicles on a barge saves a re-handling step.
On arrival at Devonport the salmon are pumped from vehicles to the processing facility (located adjacent to Devonport Port) for secondary processing. The processed salmon are then loaded into refrigerated trailers, shipped via TT-Line to Melbourne, and transported to a warehouse in Laverton for sorting and customer dispatch.
One company operates a processing facility at Parramatta Creek, located just outside Devonport. For this company, there are some additional transport steps. Its arrangements on the mainland are not known.
Table 5: Aquaculture Supply Chain Steps: Macquarie Harbour/Strahan to Devonport
Arcs anNodes
Seasona
Observa
d
ality Ausdiffor 7
ations WhutilproDevchaare
Thipro(incinte
Thewith
The
stralians conference is ab7 to 8 TEU p
hen looking isation and
oduct - prodvonport. Locain eliminatee timed to me
is market reqoduct to concluding procerstate suppl
e chain has hin reason th
e supply cha
Strahan
11,000 tonn226 km
nsume salmbout two fold.per day, to sh
at supply ctiming prob
duction facilcating proce
es double haeet vessel cu
quires a fastnsumers on cessing) is ly chain.
no idle time.hat any cargo
ain is conside
n
Parramne
Project 234986
mon in the w. The seasonhipping requi
chain efficienblems. In thiities are lo
essing facilitindling. Ther
ut-off times. T
t, timely andthe mainlanefficient and
. It is underso intended to
ered efficient
Port of M
40,0042
Huonvil
matta
De
29,000 to300 km
File Auercon Supply
warmer monnal peak addrements.
ncy it is cos supply chcated eitheries at thesee is no lag tTrailers are r
d reliable supnd. Delivery d comparab
stood vesselso ship will be
t and effectiv
Melbourne
00 tonne 20 km
Dover
lle Ho
evonport
nne m
Chains Report Part I
nths. Peak tds in the orde
mmon to lohain there isr at the po
e natural breime in the sureported to b
pply chain into a custom
ble to an eq
s will wait foe shipped.
ve in both des
obart
(Supply Chains) 30 ARevisio
to trough, ter of 200 TEU
ook for doubs no double oint of harveeak points inupply chain e fully utilise
n order to demer in arounquivalent hi
r a late vehic
sign and ope
Transp
Cold S
HarvesProcesSecon
Major
Shippi
August 2013on 0 Page 31
he seasonaU per month
ble handlinghandling o
esting or an the supplyas deliveries
ed.
eliver a freshnd 36 hoursgh standard
cle, ensuring
eration.
port Hub
Store
sting and ssing dary Proces
Highway
ng Route
al ,
, f t y s
h s d
g
Primary
sing
Project 234986 File Auercon Supply Chains Report Part I (Supply Chains) 30 August 2013Revision 0 Page 32
4.2. Meat (Chilled and Frozen)
Market Meat produced in Tasmania includes beef, sheep, lamb and veal. It is exported domestically and internationally as both chilled and frozen product. Export markets are broad, and include destinations in Europe, Asia, the Middle East and the USA. Hides are shipped to China.
Some product is sold locally in Tasmania, however this represents a small percentage of the volumes produced and is not reviewed here.
Supply Chain Requirements
Generally, chilled meat is sold domestically, while frozen meat is sold to international markets. As a fresh supply chain, chilled meat is time sensitive making it important this product is moved quickly to Melbourne for further processing. For frozen meat, the need for quick delivery to Melbourne is less urgent. For both chains efficiency and cost are important.
The supply chain steps differ depending on the degree of local downstream processing available and end market.
For example, one company without downstream processing facilities slaughters lamb, mutton and veal to produce chilled and frozen carcasses. Carcasses are located into refrigerated vehicles, transported to Devonport and shipped to Melbourne where carcasses are transferred to an export meat works for processing and subsequent packaging for export.
Another company with downstream processing facilities slaughters beef, lamb, mutton and veal. It then bones the meat, and packs it into cartons to be chilled and frozen. Frozen product is packed into containers on-site for export.
Volume Three companies are prominent in the industry. Indicative volumes for each are:
Project 234986 File Auercon Supply Chains Report Part I (Supply Chains) 30 August 2013Revision 0 Page 33
There are additional supply chain steps after arrival at the Melbourne distribution centre, related to further processing for sale into export markets. These steps are common to any abattoir that does not have downstream processing facilities and are not particular to Tasmanian freight. There are inefficiencies associated with these further steps (multiple handling steps). The company in question is currently investing to bring downstream processing in-house and improve this aspect of their supply chain.
As an export supply chain, frozen meat is not as critically time sensitive as chilled meat. However the need to meet an export vessel is a key consideration.
Cartons of meat are typically shipped in 40ft refrigerated containers. This equipment is not readily available in Tasmania and needs to be re-positioned into the state. The supply chain steps are outlined below.
Project 234986 File Auercon Supply Chains Report Part I (Supply Chains) 30 August 2013Revision 0 Page 35
4.3. Bell Bay Industrial Minerals
Market Bell Bay contains some of Tasmania’s largest industrial businesses. These businesses compete in highly competitive international markets. Some businesses provide niche or specialist products, which command a premium price. Associated with a premium price is the expectation of timely and reliable delivery.
Industrial output from Bell Bay is in the order of 450,000 tonnes of processed minerals and metal per year. Around 260,000 tonnes of product is shipped in bulk, with the remaining product containerised, amounting to 8,000 to 9,000 TEU. Material is transported to markets in Asia, India, Australia, South Africa and USA.
Supply Chain Requirements
Reliability
The outbound supply chain needs to deliver product to customers on-time, and in full.
The inbound supply chain needs to support operations. Unexpected problems due to supply chain failures can have significant cost implications for large industrial companies.
Cost
Given businesses compete in international markets, where many competitors have lower cost structures, the minimisation of supply chain costs is critical.
Volume Bell Bay has a significant inbound supply chain, in addition to finished products.
Inbound bulk shipments arrive by ship at Bell Bay port. Containerised freight arrives via Melbourne and Burnie by truck. Swire’s multi-purpose vessel will bring in some of this freight in the future.
The key inbound commodities, volume and origin are shown below:
Product Origin Frequency and Volume (tonnes)
Total volume/yr (tonnes)
Alumina Gladstone 13 x 26,000t shipments 338,000
Petroleum Coke
USA 8 x 8,000t shipments
64,000
Liquid Pitch Korea 6 x 2,500t shipments
15,000
Consumables (containerised)
China/Europe 500 11,000
Coal Fingal 60,000t/yr 60,000
Manganese, Iron Ore, other
Various >260,000t/yr 260,000
Project 234986 File Auercon Supply Chains Report Part I (Supply Chains) 30 August 2013Revision 0 Page 36
The key outbound commodities and volumes are shown below:
Product Volume shipped through Bell Bay
Volume shipped through other ports
Total volume per year
Break bulk – Ingots 24,000t 0 24,000t
Containers – Ingots 3600 TEU 3400 TEU 7,000 TEU
Bulk – Ferro Manganese
240,000t 0 240,000/yr
Containers – Ferro Manganese
0 1000 TEU 1,000 TEU
Containers - other 0 550 TEU 550 TEU
Supply Chain Steps
The supply chain steps are outlined below:
From To Mode Step
Melbourne Bell Bay Sea/Road Reposition container
Bell Bay Fill container
Bell Bay Transport to staging area
Bell Bay Burnie Road Transport to Bass Strait ship
Burnie Load onto vessel
Burnie Melbourne Sea Ship across Bass Strait
Melbourne Unload from vessel
Road Transfer to export berths
Table 8: Supply Chain Steps: Bell Bay to Melbourne
Arcs anNodes
Seasona
Observa
Comparwith Ma
d
ality Ouexc
ations Thecoscon
OcStr
A rpar
Othout
rison inland
Cohasrepand
All
tput of indusception being
e cessation osts; reducedntainers, for t
casions wherait have also
recent agreert, but only fo
her businesst of Bell Bay
mpared to as more stepositioning. Wd $800 to sh
industrial su
Port
Burnie
8
strial procesg planned ou
of AAA’s dired shipping othose busine
en containerso impacted o
ment betweeor cargoes w
ses have decwould be pre
a mainland ineps and adWe estimate ip).
upply chains
Project 234986
of Melbourne
550 TEU 420 km
ses is geneutages or ma
ect internatiooptions; and esses located
s have not bn reliability.
en Swires anwith long lead
cided to ship eferred if a s
ndustrial supditional costhis addition
have transpo
File Auercon Supply
e
Bell Bay
rally constanaintenance sh
onal shippingincreased d
d at Bell Bay
been shipped
nd Bell Bay Ad times.
in bulk, whicservice was o
pply chain, thsts, related al cost at aro
ort and reha
Chains Report Part I
nt throughouhut downs.
service out difficulties iny.
d due to cap
Aluminium ha
ch saves on offered.
he industrial to shipping
ound $1,100
ndling costs
(Supply Chains) 30 ARevisio
Transport
Processing
Major High
Shipping R
ut the year, w
of Bell Bay hn sourcing e
pacity limitati
as addressed
costs but di
supply chaing and emp0/TEU ($300
and we have
August 2013on 0 Page 37
Hub
g Plant
hway
Route
with the only
has added toempty expor
ons on Bass
d the issue in
rect shipping
n at Bell Bayty containeto reposition
e considered
y
o rt
s
n
g
y r n
d
Project 234986 File Auercon Supply Chains Report Part I (Supply Chains) 30 August 2013Revision 0 Page 38
these to be comparable between the mainland and Tasmania.
The cost of moving heavy industrial goods on mainland roads and on Tasmanian roads is similar.
Container export through MelbourneSteel company
Bell Bay Industrial Minerals
Re-position container X
Transport goods to freight forwarder X
Fill container X X
Transport to staging area X
Transport to Bass Strait ship X
Ship across Bass Strait X
Hold at freight forwarder X X
Transport to export berths X X
Load onto international ship X X
Table 9: Comparison of Supply Chains Elements
Project 234986 File Auercon Supply Chains Report Part I (Supply Chains) 30 August 2013Revision 0 Page 39
4.4. Beer
Market Limited data is available on the Tasmanian beer industry.
The market for Tasmania’s beer production is primarily on the mainland.
There are two major production sites, one in Hobart and a larger facility in Launceston. Boags was interviewed for the study.
Supply Chain Requirements
Anecdotal evidence suggests that an average of 500 TEU of beer is shipped out of the state each month. This volume can double in peak months.
Beer has a significant inbound supply chain, at around 200 TEU/month, or 3,000 TEU annually in addition to its finished product flows. Inbound volumes include bottles, cans, crown seals, cardboard cluster packs, malt, sugar and empty containers.
Beer is a fast moving consumer good (FMCG), with the following requirements:
Responsiveness: goods must move quickly through the chain.
Cost effectiveness: warehousing and distribution costs must be minimised.
Reliability: stockouts are unacceptable.
Agility: the supply chain must be able to respond to peaks (e.g. Christmas).
Boags’ production process resembles that of other modern manufacturers observed in Tasmania. It is a high speed, high volume business. Little product is held locally; instead product is shipped to the mainland to be closer to markets, minimising order to delivery cycles.
Volume Tasmania’s outbound beer volumes are estimated at 8,000 TEU per year.
Supply Chain Steps The production process and supply chain for beer is highly efficient.
At the end of the production process is a high speed bottling plant. This leads to an automated packing line and robotic palletizers. From the palletizers goods are loaded onto tautliner trailers for transfer off-site.
There is limited room at the end of the production line at Boags, and an offsite warehouse is used to store and prepare product for transhipment to a mainland warehouse, where goods are slipsheeted and containerised.
After containerisation, goods are shipped through Burnie to Melbourne and other parts of Australia.
Project 234986 File Auercon Supply Chains Report Part I (Supply Chains) 30 August 2013Revision 0 Page 40
The supply chain steps are outlined below.
From To Mode Step
Produce and package beer
Factory Offsite warehouse
Road Transfer
Offsite warehouse
Burnie Road Road freight
Burnie Load onto vessel
Burnie Melbourne Sea Bass Strait
Melbourne
Unload from vessel
Melbourne Road Transfer to warehouse
Table 10: Supply Chain Steps: Launceston to Melbourne
Seasonality Output is highly seasonal. In summer and over the holiday season, volumes sold are higher. Peak period volumes can be almost double.
Observations The supply chain inspected had the hallmarks of a high quality process.
State of the art equipment, modern business processes and modern technologies, are used.
A specialist third party logistics organisation (Bevchain) manages warehousing and logistics operations, an example of aggregating for efficiency. Route-trade businesses commonly do this.
The warehousing of goods in mainland warehouses stores goods closer to markets, reducing lead times for customers.
Some double handling does occur in both the inbound and outbound supply chains. This reflects site constraints, with insufficient space to store packaging materials or finished goods.
Comparison with Mainland
This supply chain compares favourably with similar interstate businesses. We estimate road transport costs and warehousing costs and practices are similar.
Project 234986 File Auercon Supply Chains Report Part I (Supply Chains) 30 August 2013Revision 0 Page 41
4.5. Vegetables (Fresh, Export and Frozen)
Market Three different supply chains are identified for vegetables:
Fresh vegetables: short shelf life, just-in-time delivery. Examples include broccoli, beans, lettuce and carrots.
Export vegetables: time sensitive in terms of market rather than perishability. Product has a narrow market window, requiring shipment over a few months. For example, onions.
Processed vegetables: processed, frozen finished product. Examples include potatoes and peas.
The total value of vegetable production in Tasmania was estimated at approximately $240 million in 2009. The five major commodities produced in Tasmania are green peas, hops, carrots, onions and potatoes.
Interviews were conducted with carrot, onion, lettuce and potato producers.
Supply Chain Requirements
Fresh Vegetables
The fresh vegetable supply chain is broadly similar to other fresh food supply chains such as aquaculture and fruit. Vegetables are typically picked, packed and transported to market within 24 to 48 hours of harvesting. Overnight delivery is required.
Export vegetables
Export vegetables, such as onions, are grown in the North West, processed in Forth and exported through Devonport. The emphasis is on cost. Goods sold into export markets are very sensitive to cost.
Processed vegetables
Large processing plants located in Ulverstone, Devonport and Smithton are hubs for vegetable processing in Tasmania. Vegetables are transported from these plants to Burnie, to be shipped to the mainland. The supply chains need to be reliable and low cost, as there is competition from imported processed vegetables.
Project 234986 File Auercon Supply Chains Report Part I (Supply Chains) 30 August 2013Revision 0 Page 42
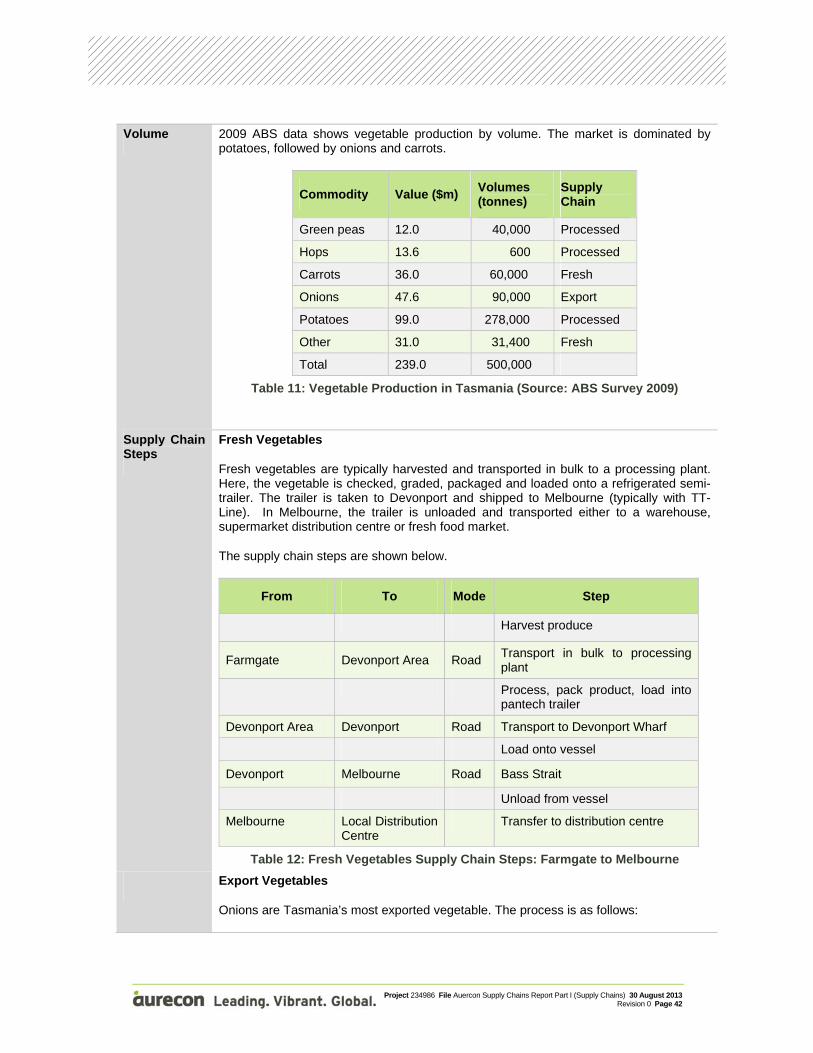
Volume 2009 ABS data shows vegetable production by volume. The market is dominated by potatoes, followed by onions and carrots.
Commodity Value ($m) Volumes (tonnes)
Supply Chain
Green peas 12.0 40,000 Processed
Hops 13.6 600 Processed
Carrots 36.0 60,000 Fresh
Onions 47.6 90,000 Export
Potatoes 99.0 278,000 Processed
Other 31.0 31,400 Fresh
Total 239.0 500,000
Table 11: Vegetable Production in Tasmania (Source: ABS Survey 2009)
Supply Chain Steps
Fresh Vegetables
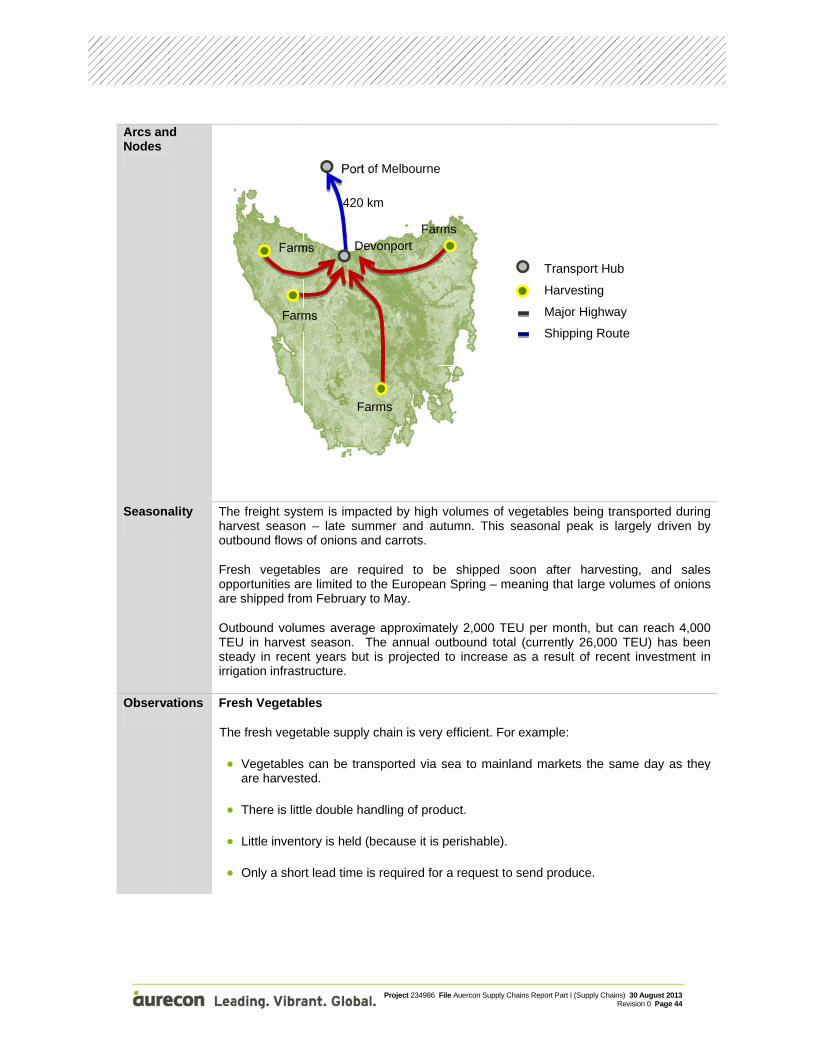
Fresh vegetables are typically harvested and transported in bulk to a processing plant. Here, the vegetable is checked, graded, packaged and loaded onto a refrigerated semi-trailer. The trailer is taken to Devonport and shipped to Melbourne (typically with TT-Line). In Melbourne, the trailer is unloaded and transported either to a warehouse, supermarket distribution centre or fresh food market.
The supply chain steps are shown below.
From To Mode Step
Harvest produce
Farmgate Devonport Area Road Transport in bulk to processing plant
Process, pack product, load into pantech trailer
Devonport Area Devonport Road Transport to Devonport Wharf
Load onto vessel
Devonport Melbourne Road Bass Strait
Unload from vessel
Melbourne Local Distribution Centre
Transfer to distribution centre
Table 12: Fresh Vegetables Supply Chain Steps: Farmgate to Melbourne
Export Vegetables
Onions are Tasmania’s most exported vegetable. The process is as follows:
Project 234986 File Auercon Supply Chains Report Part I (Supply Chains) 30 August 2013Revision 0 Page 43
Onions are lifted from the ground in December and dried in the paddock for two months
Onions are transported to a processing warehouse where they are further cured, graded and packed
A food grade empty container is sourced and repositioned from Melbourne
The container is modified to become a ‘fantainer’ (i.e. the container is modified to allow for air circulation, a fan is installed at the front of the container and a door left ajar)
Onions are loaded into containers (loose or bagged, in accordance with buyer requirements)
Full containers are transported to Devonport and shipped from Devonport to Melbourne for export
Processed vegetables
Potatoes dominate the processed vegetables segment.
Harvest occurs in Autumn and produce is transported to processing plants in Ulverstone or Smithton. Most potatoes are processed into French fries, or placed into cold storage to be used through the year.
Finished product is packaged and placed in cold storage or refrigerated containers for transportation to the mainland via Burnie.
The supply chain steps are shown below.
From To Mode Step
Harvest produce
Farmgate Smithton Area Road Transport in bulk to processing plant
Process, pack product, load into reefer container
Smithton Area
Burnie Road Transport to Burnie Wharf
Load onto vessel
Burnie Melbourne Road Bass Strait
Unload from vessel
Melbourne Local Distribution Centre
Transfer to distribution centre
Table 13: Processed Vegetables Supply Chain Steps: Farmgate to Melbourne
Arcs anNodes
Seasona
Observa
d
ality Theharout
Freoppare
OutTEUsteairrig
ations Fre
The
e freight systrvest seasonbound flows
esh vegetabportunities ar shipped from
tbound volumU in harvestady in recengation infrast
esh Vegetab
e fresh veget
Vegetablesare harvest
There is littl
Little invent
Only a shor
Farm
Farm
tem is impacn – late sum
of onions an
bles are reqre limited to tm February t
mes averaget season. Tnt years but tructure.
bles
table supply
can be tranted.
le double ha
tory is held (b
rt lead time is
Port o
420 k
ms
ms
Fa
Dev
Project 234986
cted by high mmer and aund carrots.
quired to bthe Europeato May.
e approximaThe annual o
is projected
chain is very
nsported via
ndling of pro
because it is
s required fo
of Melbourne
km
Far
arms
vonport
File Auercon Supply
volumes of utumn. This
be shipped an Spring – m
ately 2,000 Toutbound totd to increase
y efficient. Fo
sea to main
oduct.
s perishable).
or a request t
e
rms
Chains Report Part I
vegetables seasonal p
soon after meaning that
TEU per montal (currentlye as a result
or example:
nland market
.
o send produ
Trans
Harve
Major
Shipp
(Supply Chains) 30 ARevisio
being transppeak is large
harvesting,t large volum
nth, but can y 26,000 TEUt of recent in
ts the same
uce.
sport Hub
esting
r Highway
ping Route
August 2013on 0 Page 44
ported duringely driven by
, and salesmes of onions
reach 4,000U) has beennvestment in
day as they
g y
s s
0 n n
y
Project 234986 File Auercon Supply Chains Report Part I (Supply Chains) 30 August 2013Revision 0 Page 45
Export Vegetables
The export vegetables supply chain can be considered cost effective, as:
Vegetable processing is simple.
Processing plants are close to the port, which minimises transfer costs.
Although the supply chain is generally cost effective, and businesses reported good collaboration between farmers and processors, there are some challenges and opportunities for improvement:
Businesses reported that there is a requirement for better management in sourcing food grade export containers.
The seasonal nature of this freight is challenging for freight providers, as during harvest season an additional 2,000- 3,000 TEU is required each day.
Processed vegetables
There is a seasonal nature to the supply side of the chain (i.e. harvest time) – however for the rest of the year it is assumed that the processing vegetables is a constant process.
Comparison with Mainland
The Tasmanian vegetable supply chain is not unlike mainland supply chains. In comparing the two, the following observations can be made:
The distance between the farm and processing plant tends to be greater on the mainland.
Whilst mainland producers can harvest and truck to markets on the same day, the need for Tasmanian vegetables to cross Bass Strait means that goods arrive when the market is closed.
Fresh vegetables are transported in reefer containers by TT-Line. The cost of this is relatively high, and even after TFES is applied Tasmanian producer’s costs are likely to be higher than mainland producers.
Project 234986 File Auercon Supply Chains Report Part I (Supply Chains) 30 August 2013Revision 0 Page 46
4.6. Fruit
Market The market for fruit is relatively time sensitive. Some fruits (such as berries) are highly perishable, while other fruits (such as apples) can be consumed up to 12 months after harvesting if stored correctly.
Perishable fruits (e.g. berries, cherries and stonefruit) have a defined timeframe for consumption. Producers are conscious of factors impacting on demand (e.g. Chinese New Year, which can fall between mid-January and mid-February and impacts the demand for cherries) when planning a harvest season, and work to identify domestic or international markets accordingly.
This investigation focuses on the apple and cherry industries.
Supply Chain Requirements
The fruit supply chain is heavily influenced by market requirements and product type. Perishable fruit can be picked, processed and transported to market within 24 to 48 hours of harvesting.
The cherry industry is focussed in the Huon Valley, Derwent Valley, Coal River Valley, Tamar Valley and the North-West coast. Being a fresh product there is little inventory held and product is usually shipped within two days of being harvested.
As with other fresh food products, cherries are shipped by TT-Line. In Melbourne, they are transported to fresh food markets, distribution centres or transported to Melbourne Airport to be flown to international markets.
The supply chain for apples differs markedly. Apples can be kept in cold storage for up to one year and could be considered non-perishable. Once removed from cold storage, an efficient supply chain is required.
Volume Tasmania produces 4,400 tonnes of cherries per season. Of this, approximately 1,920 tonnes are exported internationally.
Approximately 55,000 tonnes of apples are produced in Tasmania each year. The industry is focussed in the Huon Valley, south of Hobart, where around 80% of production occurs. The remainder is produced in Spreyton and the Tamar Valley.
Supply Chain Steps
The supply chain generally follows these steps:
Fruit is picked at orchards in the greater Hobart area.
Fruit is moved to a cold store and packing warehouse, where it is hydro-cooled, graded and packed on pallets in the cold store.
Pallets are transported by truck to Hobart to TasPorts Cold Store, where fruit is inspected by the Australian Quarantine and Inspection Service.
Pallets are transported by truck to Devonport, loaded onto a TT-Line vessel and shipped to Melbourne.
Fruit is moved to a cold store facility, supermarket distribution centre or Melbourne Airport to be flown to an international market.
Project 234986 File Auercon Supply Chains Report Part I (Supply Chains) 30 August 2013Revision 0 Page 47
The supply chain steps are shown below.
From To Mode Step
Pick fruit, process and pack fruit
Hobart Greater Hobart Road Despatch transport
Greater Hobart Load truck
Greater Hobart Hobart Road Transport
Consolidation, AQIS inspection
Hobart Devonport Road Transport
Load onto vessel
Devonport Melbourne Sea Bass Strait
Unload vessel
Melbourne Transfer to cold store, distribution centre, Melbourne airport
Table 14: Fruit Supply Chain Steps: Hobart to Melbourne
Seasonality Fruit is highly seasonal. The majority of produce is harvested and transported during summer, and volumes decline significantly over winter.
The cherry season typically runs for 8 weeks from mid-December to mid-February. For 4 – 5 weeks of this time, approximately 65 tonnes of cherries are exported daily.
The apple harvest season is spread over a longer period, generally lasting from January until April.
Observations Overall, the supply chain is efficient. Production and packing facilities are located either at the point of harvesting or at the point where product is consolidated onto a linehaul vehicle. Delivery times are co-ordinated to meet vessel cut-off times, which results in minimal lag time.
Comparison with Mainland
Other countries have evolved towards industry models that extract efficiencies from the supply chain. For example, organisations such as ENZA and Zespri in New Zealand have established industry scale facilities and have invested in grading and cold storage technologies (e.g. controlled atmosphere) to lower costs of pack housing and improve cold storage for all industry participants).
Tasmania has a combination of multiuser packing and cold storage facilities and on farm facilities. Further movement towards multi user facilities with better technologies may improve the fruit supply chain.
Project 234986 File Auercon Supply Chains Report Part I (Supply Chains) 30 August 2013Revision 0 Page 48
4.7. Zinc
Market World production of zinc (used in galvanizing steel and as an alloyed metal) is about 12 million tonnes each year, of which approximately 280,000 tonnes is produced in Hobart.
The world’s largest zinc producer is Nyrstar, a global company who operate a zinc smelter in Hobart.
Supply Chain Requirements
As a major freight user Nyrstar is influential in shaping logistics patterns in Tasmania.
The zinc supply chain commences with the import of zinc concentrate and zinc oxides to the plant. Following smelting, zinc metal is produced in the form of ingots as well as various by-products. 140,000 tonnes of by-products are shipped in bulk to Port Pirie and Asia. Significant volumes of sulphuric acid are also produced, and shipped out by tanker.
The outbound zinc supply chain is of most interest to this study as it uses three modes of transport – road, rail and sea. Most of the zinc produced is exported internationally. This is a competitive market, requiring a reliable and cost effective supply chain.
Volume Nyrstar’s plant at Lutana, in the greater Hobart area, has a production capacity of approximately 280,000 tonnes per annum. 272,000 tonnes were produced in 2012.
Supply Chain Steps
The outbound logistics chain is managed by a third party logistics provider. The process is as follows:
Zinc ingots are loaded ont a flat bed truck and moved to a consolodation point in central Hobart.
Zinc ingots are packed into a domestic container and transported by rail to Burnie.
Product is shipped from Burnie to Melbourne.
In Melbourne, product is transported to a warehouse where it is re-packaged to an international container and transferred to an export berth.
Project 234986 File Auercon Supply Chains Report Part I (Supply Chains) 30 August 2013Revision 0 Page 49
The supply chain steps are shown below.
From To Mode Step
Lutana Produce zinc ingots
Lutana Load truck
Lutana Hobart Road Transport toconsolidation point
Hobart Pack into domestic container
Hobart Loaded onto train
Hobart Burnie Rail Transport to Burnie Wharf
Unload train/load onto ship
Burnie Melbourne Sea Bass Strait
Melbourne Unload from vessel
Melbourne West Melbourne
Road Transport to Melbourne Metal Centre
West Melbourne
Unpack and store
West Melbourne
Repack into international container
West Melbourne
Road Transfer to international ship
Table 15: Supply Chains Steps: Hobart to Melbourne
Arcs anNodes
Seasona
Observa
d
ality
ations
We(Po
The producvolumes thshutdowns,
The followin
Multiple hamodal chanmay be a improving s
The choicemode for tshipping se
ebb Dock ort of Melbou
ction of Zincroughout the, which tend
ng inefficienc
ndling steps nge from roagood trade-oshipping cap
e of supplierthese goodservice.
Burnie
4
urne)
R280
Project 234986
c is a contine year. The eto occur ove
cies were ob
– repackagiad to rail (hooff against sacity).
is limited fors, as only th
420 km
Swan
Melbourne
Rail freight 000 tonnes378 km
File Auercon Supply
nuous indusexception is er the Christm
bserved:
ng from a doowever repacshipping em
r this supplyhe Burnie Po
Hoba
nson Dock (P
Metal Centr
Lutana
s
Chains Report Part I
trial processfor planned
mas/January
omestic to inckaging to apty containe
y chain if rail ort has a ra
art
Port of Melbo
re
a
(Supply Chains) 30 ARevisio
s with little foutages or m
y period.
ternational can internationers, saving o
is the prefeail interface
Transport
Packed In
Productio
Major Hig
Shipping
ourne)
August 2013on 0 Page 50
fluctuation inmaintenance
container andnal containeon costs and
erred linehauto an active
t Hub
nto Containe
on
ghway
Route
n e
d r d
l e
er
Project 234986 File Auercon Supply Chains Report Part I (Supply Chains) 30 August 2013Revision 0 Page 51
4.8. Newsprint
Market Traditional newsprint paper is in decline, with production shifting to higher quality paper (e.g. tissue and magazine grade paper).
Newsprint is moving towards a ‘just in time’ model, which supports customer inventory management. This involves the producer managing scheduling to ensure the product reaches the client as required, while also balancing production costs and inventory.
Norske Skog was interviewed for this study.
Supply Chain Requirements
The major inbound material for paper production is softwood timber, most of which is sourced from Southern Tasmanian forests.
The outbound supply chain consists of newsprint and other grades, and most is shipped to Melbourne to be sent interstate and exported to international markets.
The Boyer paper mill is located in close proximity to raw material sources. From the mill, newsprint is moved by rail to Burnie and shipped to Melbourne.
The warehousing of finished inventory is located closer to the market, at Norske Skog’s warehouse in Melbourne. The Melbourne warehouse holds product from both the Boyer and Albury mills. This minimises Norske Skog’s inventory costs as one large warehouse reduces operating costs.
The Newsprint industry requires the supply chain to be reliable, responsive and low cost.
Volume Annual production is approximately 290,000 tonnes of newsprint and related grades of paper.
Supply Chain Steps The supply chain follows the process as outlined below:
Paper rolls move from the mill to the dispatch warehouse by conveyor.
Rolls are stacked in the warehouse by grab forklift.
Paper is transported in containers. Specialised 40ft containers transport paper to Melbourne, Adelaide and Sydney.
Export containers are loaded by forklift, while domestic containers are loaded using a skate system (the container has a floor modified to accept skates – similar to a roller floor where goods are loaded into containers without using a forklift. A skate, operating on a compressed air system, is loaded with paper rolls and moved into a container and removed without disturbing the paper rolls).
Loading plans have been developed for different mixes of paper rolls, to maximise the mass in the box.
Project 234986 File Auercon Supply Chains Report Part I (Supply Chains) 30 August 2013Revision 0 Page 52
The rail terminal and container yard are adjacent to the dispatch warehouse. Loaded containers are staged in the yard waiting loading onto a train.
TasRail position an empty rake and pick up a full rake from the mill 6 days per week. The train transports product to Burnie, where it is shipped to Melbourne and transported to Norske Skog’s warehouse.
This ‘point to point’ supply chain is very efficient. The ‘make and ship’ model used by Norske Skog is a common style of operation in Tasmania.
There is the potential to increase efficiencies by reducing the rail cycle time from 30 to 24 hours. Under the current 30 hour cycle TasRail employs three fleets of wagons and containers to maintain its timetable. TasRail’s investment program in track upgrades and rolling stock will seek to achieve a 24 hour cycle. If the rail cycle is reduced to 24 hours this would save on the number of wagons and containers required to provide the service.
The supply chain steps are shown below.
From To Mode Step
Production, packing, load train
Boyer Burnie Rail Transport to Burnie on rail
Shunt rack on Burnie Wharf
Burnie Melbourne Sea Bass Strait
Unload vessel
Transport to warehouse
Table 16: Supply Chain Steps: Boyer to Melbourne
Arcs an
Seasona
Observa
d Nodes
ality
ations
Being reason
The lo
Loloa
Loha
Deste
Hi
Threfa
Rea
a continuounably consta
ogistics of th
oading of cading.
oading trainsaving to trans
elivering conep.
igh-cube con
he use of aeduces costcilities.
eturning 40ftgood use of
Burni
Project 234986
us industrial ant.
is supply cha
ontainers us
s at the plasport produc
ntainers by r
ntainers max
a warehousets associate
t containers capacity tha
Port of Me
420 km
e
Rail frei290 000 to
378 km
File Auercon Supply
process, ou
ain are very
sing a skat
nt rail termict to a rail line
rail to the w
ximise payloa
e in Melboued with ma
are used to at would othe
elbourne
m
ghtonnes m
Chains Report Part I
tbound flows
efficient:
te system is
nal avoids te and modal
wharf at Burn
ads.
rne as the aintaining m
transport goerwise be em
Hobart
(Supply Chains) 30 ARevisio
s are assum
s faster tha
the logistics change.
nie avoids a
main storagmultiple war
oods to Hobampty.
Trans
Prima
Railw
Shipp
August 2013on 0 Page 53
med to be
an forklift
steps of
handling
ge facility rehousing
art, this is
sport Hub
ary Proces
wayline
ping Route
Project 234986 File Auercon Supply Chains Report Part I (Supply Chains) 30 August 2013Revision 0 Page 54
4.9. Timber
Market The Tasmanian forestry industry is going through a process of structural transformation brought about by changing markets. Some of the factors that have challenged the industry include:
Reduced national demand for hardwood structural wood.
Reduction in local plantation investment schemes.
Reduction in market price and demand for woodchips.
High Australian Dollar.
High overhead costs.
Supply Chain Requirements
For an industry facing financial pressure, a low cost supply chain is important.
The supply chain steps for timber differ depending on the final product. All wood is transported via log trucks to a processing facility, but from this point the supply chain flow differs depending on the end use of the wood (woodchips, sawn product etc).
There are three main supply chains for forestry in Tasmania – the North-West to Burnie, from the North-East to Bell Bay and from the Greater Hobart area to Hobart.
Some of the major operators in Tasmania include Ta Ann (who operate a mill in the Huon Valley and another in Smithton) and Neville Smith (who operate a softwood mill in Huonville and the Artec wood chip facility in Bell Bay).
Norske Skog (the paper plant at Boyer) is a major consumer of timber in Tasmania.
Volume The forestry industry produced approximately 6 million cubic metres in 2009. Current production statistics are unavailable, however output has declined markedly, and it is not expected that the market will recover.
Supply Chain Steps Trees are cut down at a landing spot and moved to a clearing area. Logs are segmented depending on their market destination and loaded onto log trucks by an excavator.
Wood generally goes to one of four facilities – a saw mill, export yard, wood shipper or pulp mill.
Saw logs are transported to a saw mill for milling into lumber or veneer panels. Saw logs destined for the export market are typically transported directly to an export yard for bulk shipping.
Pulp logs are transported to a mill and processed into pulp for use in the
Project 234986 File Auercon Supply Chains Report Part I (Supply Chains) 30 August 2013Revision 0 Page 55
paper industry.
Wood for chipping is generally residue. These are tops and branches of trees which are typically left in the forest for a period of time before being chipped.
Seasonality Forestry outputs are reasonably constant through the year.
Observations The forestry supply chain aims to minimise transport costs. The transport of waste product is therefore minimised.
The haulage of logs is a competitive market, due to the decreasing volume of timber to be hauled.
Timber supply chains appear to be efficient and low cost.
Comparison with Mainland
As transport costs were not available it is difficult to draw a comparison with mainland operators.
Project 234986 File Auercon Supply Chains Report Part I (Supply Chains) 30 August 2013Revision 0 Page 56
4.10. Dairy
Market Tasmania is a major producer of processed dairy products.
Product is processed in Tasmania (major plants are located in Burnie, Spreyton and Smithton) and sent in bulk to Melbourne for repacking and distribution in Victoria and the rest of mainland Australia.
Products include:
Cheese: Soft and hard cheese is produced and shipped to interstate markets.
Butter: Butter is produced for the Australian market (Tasmania and mainland).
Powdered milk: Almost all product is destined for the export market. Powdered milk is sent to Melbourne for transhipment to markets in Asia. Products destined for the mainland are distributed from a Melbourne distribution centre.
Raw milk.
Supply Chain Requirements
The supply chain includes farms, processing plants and markets.
Milk must be collected from farms regularly (to avoid wasting milk) and finished goods need to be moved quickly from processing plants to mainland markets and distribution centres, due to limited storage capacity at the plant.
The features important to this supply chain are :
Reliability
It is important to keep goods moving through the chain.
Responsiveness
Processing plants are located close to the major suppliers of dairy products in Northern Tasmania.
Product collected from processing plants from Monday to Friday is shipped to Melbourne on the day of collection.
Project 234986 File Auercon Supply Chains Report Part I (Supply Chains) 30 August 2013Revision 0 Page 57
Volume Three companies are prominent in the industry. Indicative volumes for each are:
Company Production (tonnes)
Fonterra 40,000
Tasmania Dairy 20,000
Murray Goulburn 9,000
TOTAL 69,000
Table 17: Major Dairy Producers in Tasmania
Supply Chain Steps
Raw Milk
Raw milk is collected from dairy farms in Northern Tasmania. Depending on the volume produced by the farm, pick-up ranges from every second day to once a week. Milk is transported by road in bulk liquid trailers to the processing plant. Due to the relative short distance from the farm to the plant a non-refrigerated food grade tank can be used.
Cheese
Cheese is temperature sensitive, but not particularly time sensitive or prone to degradation due to poor handling or delays. All cheeses (soft and hard) are put into cold storage for 5-16 days after processing to reach a stable temperature of 5°C. After this period, it’s critical to maintain a temperature of 5°C to prevent spoilage and degradation of the product.
The cheese is packed into reefer containers at the processing plant and picked up daily from Monday to Friday to be transported to Burnie for shipping overnight to Melbourne. The containers are under constant power during shipment. Products are transported from Melbourne to processing plants for final packaging and distribution on the mainland.
Powdered Milk
Powdered milk is not temperature or time sensitive, although it is preferred that the product is not exposed to excessive heat as it would impact on the product quality.
Product is shipped from Burnie to Melbourne.
Arcs anNodes
The
d
S
e dairy supp
From
Farm
Farm
Processin
Burnie
Burnie
Melbourn
Melbourn
Table 18
Wynya
mithton
ly chain step
ng plant
ne
ne
8: Supply C
Port o
420
Spreyton
Bur
ard
Project 234986
ps are shown
To
Processing
Burnie
Melbourne
hain Steps:
of Melbourne
km
rnie
File Auercon Supply
n below.
M
g plant R
R
S
R
Farm to Me
Chains Report Part I
Mode S
P
Road L
Road L
L
Sea B
Uv
Road Tp
elbourne Dis
(Supply Chains) 30 ARevisio
Step
Produce milk
Linehaul
Local road
Load onto ve
Bass Strait
Unload vessel
Transfer toprocessing p
stribution C
Transport
Processing
Major High
Shipping R
August 2013on 0 Page 58
k
essel
from
o final plant
Centre
Hub
g Plant
hway
Route
Project 234986 File Auercon Supply Chains Report Part I (Supply Chains) 30 August 2013Revision 0 Page 59
Seasonality Australians consume cheese throughout the year, with demand for blue cheese and soft cheese peaking from September and through the Christmas period. Peak to trough, the seasonal difference is about two fold.
Cheese and Butter: The plants are impacted by seasonal demand between September and December.
Powdered Milk: There is no seasonal demand for powdered milk and production is relatively constant throughout the year.
Observations The dairy supply chain in Tasmania is very efficient.
A degree of sophistication is present in the handling of cheese products. To ensure product quality, the temperature of the product is maintained from the cold store in Tasmania to the delivery point in Melbourne.
Due to the efficiency of the supply chain there is little inventory held at the processing plant. Product is usually shipped on the day it is collected from the producers.
A less frequent logistic arrangement could be an option, however the current arrangement allows a constant flow of products from Tasmanian plants, prevents any bottlenecks on site and a allows a constant production rate to be maintained by the producers.
Comparison with Mainland
Mainland dairies operate on a similar basis.
Project 234986 File Auercon Supply Chains Report Part I (Supply Chains) 30 August 2013Revision 0 Page 60
4.11. Retail
Market Retail goods account for nearly 55% of all inbound goods.
The following businesses were interviewed for this study.
Bunnings (three operations in Tasmania).
Statewide Independent Wholesalers (SIW) (SIW operate Tasmania’s largest distribution centre, servicing approximately 28 Woolworths stores, 19 BWS stores and 200 other independent stores).
Freight forwarders such as Toll, SeaRoad, Fresh Freight, and SRT Logistics service other retailers by consolidating, deconsolidating and distributing goods from their own premises.
The market for retail goods delivers food and clothing, white goods and other consumables. Tasmanian consumers, like other Australian consumers, have high expectations – that shelves will be fully stocked of a range of quality goods.
Supply Chain Requirements
The key requirements of this supply chain are responsiveness and reliability. In this context, responsive means that goods are able to move quickly through the supply chain.
Responsiveness
A key requirement of this supply chain is that goods be delivered overnight. Evidence suggests that retail deliveries into Tasmania are a major influence on shipping services.
A very high service level requirement means that retail goods do not have to be held in large quantity in the supply chain. This reduction in inventory holdings minimises cost, and the benefits of this flow to Tasmanian consumers.
Reliability
It is important to minimise disruptions, as they have a significant impact on freight users.
Volume In FY 2011/12 the Port of Melbourne recorded 132,000 TEU of this commodity group flowing into Tasmania
Supply Chain Steps
5. SIW Distribution Centre (DC)
SIW source goods locally and from the mainland.
Goods from the mainland are sourced on a delivered to warehouse basis. They are consolidated by freight forwarders in Melbourne and shipped to Burnie and Devonport. From there they are transported to the SIW DC.
Goods are unloaded and put away into a conventional high bay racking system.
Project 234986 File Auercon Supply Chains Report Part I (Supply Chains) 30 August 2013Revision 0 Page 61
Goods are picked up as required and made into consignments for stores. Trucks make a series of stops for stores.
An estimated 80 outbound loads per day are delivered outside of peak season, with volumes increasing around 40% in peak season.
Bunnings
Bunnings source stock locally, from mainland distributors and from the Victorian Bunnings DC. Bunnings DC stock is containerised by Toll in Melbourne before shipping to Burnie.
Other stock from regular mainland suppliers is consolidated by SeaRoad and then shipped to Devonport.
Goods are delivered to stores in 40ft containers.
An example of the supply chain steps is shown below.
From To Mode Step
Melbourne Consolidate loads
Melbourne Load onto vessel
Melbourne Devonport Sea Bass Strait
Devonport Unload from vessel
Devonport Launceston Road Road to distribution centre
Launceston Unload trucks and putaway/crossdock
Launceston Pick and build load
Launceston Other Road Deliver to supermarket or other retail outlet
Table 19: Supply Chain Steps: Melbourne to Tasmanian Shop
Seasona
Observa
ality Thov
ations SIW
Bu
Ge
he profile for er the Christ
W Distributi
SIW is a stasks can a
It is obseorganisatiofor busines
The locatiotrucks to m
unnings
Bunnings rspace on sWhile this
The Tasmdistribution
eneral Obse
Both SIWdevelopme
With threeconnectivitthe high ex
Disruptionscosts to bu
inbound rettmas period (
ion Centre
tate-of-the-aachieve scal
erved that ons. The benss to put asid
on of the dismake two or m
reported thatships, and sis understan
anian Bunnin centre as V
ervations
W and Bunents and tech
e overnight sty between Txpectations o
s to this supusinesses (e.
Project 234986
tail products (October to J
art distributioe efficiencies
aggregationnefits achievde competitiv
stribution cemore trips pe
t during the shipment of ndable, it is a
ings businesVictorian Bun
nnings operhnologies cre
services for Tasmania anof their consu
pply chain ar.g. if cargo of
File Auercon Supply
is shown bJanuary).
n centre ands.
has beenved by a largve tensions in
ntre in closeer day.
seasonal penon-perishabn inconvenie
sses are sernings busine
rate nationaeated and im
most nightsnd the mainumers for ava
re be readilyf fresh produ
Chains Report Part I
elow. There
d an example
n achieved ger scale opn this part of
e proximity t
ak in Decemble goods is ence.
rviced from tesses.
al systems, mplemented e
s of the weeland and reailability.
y felt and mauce is delaye
(Supply Chains) 30 ARevisio
e is a seaso
e of how agg
between coperation are f the supply c
to major citie
mber there is sometimes
the same M
and beneelsewhere.
ek, there is tail business
ay result in ied).
August 2013on 0 Page 62
onal peak
gregating
ompeting sufficient
chain.
es allows
a lack of deferred.
Melbourne
efit from
excellent ses meet
ncreased
Project 234986 File Auercon Supply Chains Report Part I (Supply Chains) 30 August 2013Revision 0 Page 63
As Tasmania’s focus shifts to fresh produce industries it will be important to develop operations that minimise disruptions.
Comparison with Mainland
As road freight rates are comparable between Tasmania and the mainland it is assumed costs would be similar.
Generally, there is little difference in the retail supply chain between Tasmania and the mainland, except for the requirement for goods to undertake the Bass Strait transit leg.
Project 234986 File Auercon Supply Chains Report Part I (Supply Chains) 30 August 2013Revision 0 Page 64
6. Representative Supply Chains
A representative supply chain is one that is illustrative of a group of supply chains. Analysis has been completed at this level in order to ensure businesses’ confidentiality regarding costs.
The analysis below provides insight into how Tasmanian supply chains work and their indicative cost.
Attributes Commodities are mapped to supply chains using four attributes:
Perishability – the product will spoil within a certain time frame.
Overnight – (related to perishability) the market for this product expects freshness, requiring the product to be sent within a short time of harvesting. This is usually the same day.
Time-sensitive – the product may not be perishable but the business’ supply chain has been designed around the immediate flow of product after production.
Price/cost sensitivity – all markets are price sensitive, but these commodities are prepared to relax other constraints for cost savings.
Five Representative Supply Chains
Applying the attributes above five representative supply chains have been identified:
Fresh
Low Cost
Low Inventory
Perishable
Empty Containers
Project 234986 File Auercon Supply Chains Report Part I (Supply Chains) 30 August 2013Revision 0 Page 65
Commodities were mapped as follows for outbound freight:
The SCOR (Supply-Chain Operations Reference) system approach is used to further analyse these supply chains in the section below.
SCOR provides a way of considering supply chains. The SCOR attributes and definitions are shown below.
Attribute Definition
Reliability The performance of the supply chain in delivering: the correct product, to the correct place and customer, at the correct time.
Responsiveness The velocity at which a supply chain provides products to the customer.
Agility The ability of a supply chain to respond to market changes.
Costs The costs associated with operating the supply chain.
Asset Utilisation The effectiveness of an organisation in managing assets to support demand satisfaction.
Table 21: SCOR Model Attributes Definitions
Project 234986 File Auercon Supply Chains Report Part I (Supply Chains) 30 August 2013Revision 0 Page 66
6.1. Supply Chain Quality: Summary of Comments
A summary of comments made to Aurecon during the interview process is shown below.
Table 22: Summary of Interviews of Tasmania Freight Users
Lo
w v
olu
me
fo
rce
s le
ss
th
an
co
nta
ine
r lo
ad
(L
CL
)
Sh
ipp
ing
co
sts
too
mu
ch
De
railm
en
t a
nd
un
relia
ble
eq
uip
me
nt
Sh
ipp
ing
se
rvic
es
are
eff
icie
nt
Sh
ipp
ing
se
rvic
es
are
re
liab
le a
nd
ca
pa
ble
Pro
ble
m n
ot
ha
vin
g c
oa
sta
l sh
ipp
ing
Lac
k o
f in
tern
atio
nal
dir
ect
call
Se
a c
ap
ac
ity
is c
on
str
ain
ed
Sea
son
alit
y
Co
nta
ine
r a
va
ilab
ility
is a
pro
ble
m
Ro
ad
ac
cess
to
po
rt is
go
od
Sh
ipp
ing
fre
qu
en
cy
is g
oo
d
Op
po
rtu
nit
y fo
r m
ore
inn
ova
tio
n
To
o m
an
y e
mp
tie
s is
a p
rob
lem
La
ck
of
vis
ibil
ity
Ins
uff
icie
nt
co
mp
eti
tio
n in
sh
ipp
ing
Ag
gre
ga
tio
n w
ou
ld b
e g
oo
d
Ra
il is
ov
er
su
bs
idis
ed
Fresh 3 3 3 1 1 2 5 2 1
Perishable 4 3 3 1 1 2 2 1
Low Cost 10 1 4 4 2 1 6 2 6
Low Inventory 1 3 1 1 1 1 2 1 1 2
Other 1 6 1 7 6 4 1 4 2 5 2 2 1 1 1
Total 1 24 2 20 17 2 1 10 4 14 2 13 2 2 4 12 1 1
Project 234986 File Auercon Supply Chains Report Part I (Supply Chains) 30 August 2013Revision 0 Page 67
6.2. Fresh
The Fresh supply chain includes a number of commodities such as vegetables, fruit, fish and chilled meat. Fresh freight is characterised by the need to access markets quickly.
The harvest is the first step in the Fresh supply chain. Goods are harvested and brought to a consolidation point where further processing occurs if required.
Goods are then loaded onto a refrigerated vehicle and transported to one of the Northern ports to be shipped to Melbourne. Goods are usually shipped the same day as they are harvested.
On arrival in Melbourne, goods are delivered to the customer or taken to a distribution centre. From there goods are deconsolidated, re-packed onto vehicles for interstate transfer, international transfer, and delivery to market or on-forwarded to end customers.
Figure 11: Fresh Supply Chain Arc Node Diagram
Prices above are indicative only, and can be higher for produce that is highly seasonal and for produce transported in less than a container load (LCL).
Project 234986 File Auercon Supply Chains Report Part I (Supply Chains) 30 August 2013Revision 0 Page 68
SCOR Commentary
Fresh
Reliability
The Fresh supply chain relies on a ‘just-in-time system’ for produce. By definition, just-in-time systems must be reliable – otherwise the chain fails. The requirement for reliability is heightened in the Fresh supply chain as any delay in shipment would mean a loss of shelf life, which reduces the price of goods.
Responsiveness The Fresh supply chain requires speed to market, and does achieve this. Many products are shipped on the day of harvest.
Agility The supply chain is sufficiently agile to respond to rise and falls in orders at short notice.
Cost The Fresh chain is more expensive than corresponding containerised services. TT-Line is mostly used to transport goods in this supply chain because of the faster sailing time.
Asset utilisation
The Fresh supply chain does not require a lot of logistics assets. Goods are transported in vans provided by freight suppliers and large storage facilities are generally not required as inventories are able to be kept low (by shipping produce the same day as it is harvested).
Table 23: SCOR Commentary: Fresh
Observations For fresh supply chains, generally:
The supply chain operates remarkably well, and can deliver product to market within 24 hours of harvesting.
Businesses are supported by the efficiency and effectiveness of this supply chain.
All three overnight freight providers offer a fresh supply chain service, resulting in some competition for volumes.
TT-Line has an advantage because of their vessel’s faster sailing capabilities and the vessels design, which allows rapid unloading for trailers. They can offer customers later drop off times and earlier delivery, which is convenient for many freight users.
Despite being relatively expensive, TT-Line ships at high utilisation levels. This suggests that although the price is high, fresh freight users value the benefits of this service.
Given the observations above, it can be said that the Fresh supply chain is well-served.
Project 234986 File Auercon Supply Chains Report Part I (Supply Chains) 30 August 2013Revision 0 Page 69
6.3. Low Cost – via Melbourne
Low Cost products consist of primary industry output and recycled products, which may be exported internationally. Additional costs are incurred in exporting Low Cost product to international markets (e.g. empty container relocation and international port charges).
There are Low Cost supply chains in Hobart and Bell Bay areas. The arc node diagram below illustrates a typical Low Cost supply chain based in the Bell Bay area. The supply chain includes a road haul to Burnie, shipping to Melbourne and transport to a Melbourne warehouse or to Swanston Dock for export.
Indicative charges associated with exporting product are shown below, including empty container repositioning and port charges. International sea freight charges are excluded.
.
Figure 12: Low Cost Supply Chain Arc Node Diagram
Project 234986 File Auercon Supply Chains Report Part I (Supply Chains) 30 August 2013Revision 0 Page 70
SCOR Commentary
Low Cost
Reliability Though cost is the key, reliability is also important and this is sometimes compromised by the unavailability of export containers in Tasmania and goods being ‘bumped’ in favour of perishable goods.
Responsiveness Responsiveness is not a key factor in this supply chain. Overnight services are not required, and as such this supply chain is over-served by the current Bass Strait services.
Agility A high level of flexibility is not required.
Cost
Though cost is a concern in all supply chains, it is of high importance in the Low Cost supply chain.
The expense of re-positioning of a container, crossing Bass Strait and transhipping to the export berth gate is high. Current costs ($1,460 per TEU) are significantly higher than those incurred under a direct shipping model (around $400 per TEU).
Beyond the export berth gate, exporters incur stevedoring and other charges of around $450-$650.
Asset utilisation Freight users do not require significant logistics assets.
Table 24: SCOR Commentary: Low Cost
Observations For Low Cost supply chains we make the following observations:
For exported goods
The availability and cost of securing empty international containers is a concern for some businesses.
There are many steps and parties involved in the process and each step makes exporting relatively more expensive than domestic shipping.
There is a limited choice of suppliers in this supply chain. Only two Bass Strait freight providers are suitable to service this supply chain, because the TT-Line focuses on trailer freight. If rail is the chosen line-haul method, then there is only one choice of shipper as rail only connects to one RORO berth.
The nightly shipping model generally exceeds requirements – Low Cost freight users would forego service for lower prices. As it stands, freight users pay for this service but derive limited benefit.
Given the above, we conclude there is not a good match between supply chain needs and the service provided
Project 234986 File Auercon Supply Chains Report Part I (Supply Chains) 30 August 2013Revision 0 Page 71
6.4. Low Cost – Direct Export
The introduction of a direct international shipping service (Swire vessel) calling monthly into Bell Bay provides an alternative option for the low cost supply chain. The diagram below provides indicative costs (excluding international shipping costs) based on past Bell Bay shipping rates.
Figure 13: Low Cost Supply Chain Arc Node Diagram
Observations For low cost supply chains we make the following observations:
The direct international shipping service calls monthly, and the voyage to China is 6 weeks. This may not be timely enough for all Low Cost freight users.
The cost of holding inventory for a monthly shipment may not suit all freight users.
For those freight users who have price sensitive market offers with long lead times, this supply chain would be well suited.
Project 234986 File Auercon Supply Chains Report Part I (Supply Chains) 30 August 2013Revision 0 Page 72
6.5. Low Inventory
Businesses in the Low Inventory supply chain ship product from Tasmania shortly after manufacture, thereby minimising the amount of inventory held Tasmania and the cost of holding that inventory. High volume shippers are prevalent in this market segment and due to their volumes able to negotiate attractive rates with freight providers. For these reasons Low Inventory supply chains also tend to be low cost.
A typical supply chain for a hypothetical large multi-national manufacturer in the Hobart area is indicated below. Truck and trains leave Hobart and travel to Burnie where containers are loaded and shipped across Bass Strait, before final transportation to a warehouse in Melbourne.
The supply chain described here is a ‘make and ship’ model. Product is made in Tasmania and moved to large mainland distribution centres, keeping both inventories and operating costs low.
Rail freight rates are unknown and we assume that for a large volume shipper, rail freight rates are equal to, if not less than, road freight rates.
Project 234986 File Auercon Supply Chains Report Part I (Supply Chains) 30 August 2013Revision 0 Page 73
SCOR Commentary
Low Inventory
Reliability Reliability is important for this chain. Although goods do not need to reach a consumer location ‘just in time’, it is important that goods are moved away from manufacturing facilities in a timely manner.
Responsiveness Goods need to be transported efficiently. Speed through the chain is not essential.
Agility Agility is generally not required as goods are the output of continuous industrial processes and therefore volumes are predictable. For some businesses, there are Christmas demand peaks which must be met.
Cost Daily services to distribution centres in Melbourne enable business to reduce the cost of warehousing in Tasmania. As a result warehouses can either be smaller in Tasmania, or not operated at all.
Asset utilisation Companies within this supply chain require minimal assets. There are fewer physical assets and less working capital.
Table 25: SCOR Commentary: Low Inventory
Observations All three overnight freight providers are able to provide a service, resulting in some competition for this work.
The provision of overnight services enables inventory to be moved through the supply chain quickly, reducing Tasmanian businesses’ holding costs and potentially providing a benefit to their customers.
Though businesses make use of overnight shipping services, they do not necessarily require it. Some businesses indicated a less frequent service would be acceptable to them, if it was accompanied with a suitable reduction in the freight rate.
Overall there is a good match between supply chain needs and the service provided.
Project 234986 File Auercon Supply Chains Report Part I (Supply Chains) 30 August 2013Revision 0 Page 74
6.6. Perishable
The Perishable supply chain consists of products with a defined shelf life, but are not as time sensitive as fresh food, such as vegetables or dairy.
A typical supply chain for a perishable product is illustrated below. Output is typically consolidated in a production or packing plant and transported to the port in refrigerated containers to be shipped to Melbourne. Product is then transported to a distribution centre or transhipped to Swanson Dock for international export.
Reliability This is a ‘just-in-time’ supply chain, and must be reliable. The supply chain is well served by current service providers. Daily sailings leave on time.
Responsiveness This supply chain requires speed to market, however the need is not as urgent as with the Fresh supply chain. The freight industry in Tasmania is highly capable in this area.
Agility The daily service and vertically integrated structure of supply chains in Tasmania provides flexibility.
Cost Users of the Perishable supply chain report that costs are too high.
Asset utilisation Assets are well utilised but specialised containers (reefers) are sometimes in short supply.
Table 26: SCOR Commentary: Perishable
Project 234986 File Auercon Supply Chains Report Part I (Supply Chains) 30 August 2013Revision 0 Page 75
Observations All three overnight freight providers are able to provide a service. As a result there is some competition for this work.
The provision of overnight services enables inventories to be moved on through the supply chain quickly, reducing holding costs and potentially offering benefit to customers.
There is a good match between supply chain needs and the service provided.
6.7. Empty Containers
There is a large flow of empty containers across Bass Strait, and the costs of sourcing a container from Melbourne are significant for freight users.
The distance from Melbourne to Hobart is 733km. On the mainland, the cost of transporting a container that distance would be $700-$800, though an empty would attract a lower rate.
In Tasmania the cost is lower ($400-$600), as illustrated by the diagram below.
Observations Although there are many empty containers in the system it can be difficult to source the right kind.
Project 234986 File Auercon Supply Chains Report Part I (Supply Chains) 30 August 2013Revision 0 Page 76
7. Review of Tasmanian Supply Chain Costs
In addition to understanding the quality and efficiency of Tasmanian supply chains, Aurecon were engaged to investigate the cost of supply chains in Tasmania and benchmark these costs against other markets.
The following review of Tasmanian supply chain costs provides indicative freight rates for road transport and shipping across Bass Strait. Indicative rates for rail transport are classified commercial in confidence, and are not provided for this reason.
In addition to linehaul and shipping costs, freight users incur other expenses such as handling charges and storage. The estimated cost of repositioning an empty container from Melbourne to Tasmania is approximately $400 to $600, depending on the final destination. This review compares the total cost for a typical Tasmanian supply chain to a similar supply chain on the mainland.
For road freight, approximately 23% of vehicle costs are fixed and the remaining 77% vary with the volume of work. By comparison, approximately 65% of sea freight costs are fixed (including capital, wages and maintenance) and the remaining 35% of cost is variable or related to volume and activity3.
Analysis shows that road freight rates in Tasmania are competitive and comparable to mainland rates. While the cost of shipping goods across Bass Strait is a major concern to freight users, the analysis shows that Bass Strait wharf-to-wharf gate prices vary markedly. Prices for low volume shipments range from $1,000 to $1,200 per 20ft dry TEU, while for high volume freight users prices can be half of this.
Shipping rates to transport containers across Bass Strait include port charges (both in Tasmania and at the Port of Melbourne). Additional charges such as quarantine and marine insurance may apply to international exports. These types of charges (which typically amount to $450 - $650) should be disaggregated when making comparisons between shipping services.
A discussion of factors that influence the cost of shipping is included in Aurecon’s accompanying report ‘Tasmanian Shipping and Ports’. When wharf-to-wharf costs are converted to a ‘per TEU per km’ rate, the cost is approximately two to three times more expensive than a typical road freight rate. However, for shippers eligible for the Tasmanian Freight Equalisation Scheme (TFES), shipping rates align more closely with road freight rates.
3 Transeco source & Aurecon internal modeling
Project 234986 File Auercon Supply Chains Report Part I (Supply Chains) 30 August 2013Revision 0 Page 77
7.1. Road Freight Services and Rates
The majority of Tasmania’s container freight is carried on road. The road freight task is serviced by a number of transport providers.
Road freight rates in Tasmania are competitive and comparable to mainland rates.
Common Vehicles
Small and medium rigid vehicles
19m Semi-Trailers
13.7m Refrigerated (Pantechnicon)
26m B-Doubles
Vehicle Costs
Labour (Wages and on-costs)
Fuel
Tyres
Maintenance
Capital investment and interest
Insurance
Registration
Typically 23% of costs are fixed and 77% vary with the volume of work
Rates
Road freight operating costs for a range of vehicles have been identified through industry research. These rates are reported below.
Vehicle Unit Rate
19m Semi – Shorthaul Per hour $130
19m Semi – Linehaul Per km $2.17
13.7m Refrigerated – linehaul
Per km $2.50
26m B-Double – linehaul Per km $2.31
Table 27: Indicative Road Freight Operating Costs by vehicle type
Project 234986 File Auercon Supply Chains Report Part I (Supply Chains) 30 August 2013Revision 0 Page 78
Variation in Road Rates
The cost to transport each container can vary significantly with the utilisation of the vehicle. For example, an exporter with a heavy product may load 20 foot containers at approximately 27 tonnes. However, the gross mass limit for a tri axle truck is 42.5 tonnes, meaning that only one container can be loaded on each truck without exceeding the gross mass limit.
The table below outlines transport costs for different levels of vehicle utilisation.
Truck Utilisation 1 TEU 2 TEU 3 TEU
19m Semi-Trailer $2.17 per TEU/km
$1.09 per TEU/km
N/A
13.7m Refrigerated – linehaul
$2.50 Per TEU/km
$1.25 per TEU/km
NA
26m B-Double $2.31 per TEU/km
$1.16 per TEU/km
$0.77 per TEU/km
Table 28: Standard Tasmania Truck Haulage Cost Rates
7.2. Rail Freight Services and Rates
TasRail is Tasmania’s sole provider of rail transport and operates on a commercial basis. Rail freight rates are commercial in confidence and therefore are not considered in this study.
Anecdotally, rail is considered competitive with road freight over long distances and is most suitable for hauling bulk commodities. Rail is least suitable for time sensitive retail tasks where flexibility is required.
In Tasmania, bulk and containerised heavy commodities represent the greatest share of rail freight.
Where freight is contestable to road or rail, it can be assumed that the inherent inflexibility of rail means rail freight rates need to be lower than road freight costs despite the broader benefits of rail (e.g. reduced congestion and emissions) to attract patronage.
Project 234986 File Auercon Supply Chains Report Part I (Supply Chains) 30 August 2013Revision 0 Page 79
7.3. Sea Freight Services and Rates
TT-Line, SeaRoad Shipping and Toll-ANL are the major providers of Bass Strait shipping services. They all provide overnight shipping services (more detail is included in the accompanying ‘Tasmanian Shipping and Ports’ report), enabling freight users to reach markets quickly. A ‘just in time’ service enables shippers to deliver containers or trailers to terminals by early or late afternoon on any weekday to be shipped to Melbourne overnight and arrive at the end distribution point (a distribution centre, market or factory) the next day.
The ability to access a ‘just in time’ service is important to businesses in the food and agricultural products sector, particularly for those businesses that deal with fresh and refrigerated seafood and market produce. TT-Line is considered to have the best service for fresh freight, as it sails last, arrives earliest and can unload trailers very quickly.
The retail sector is the largest part of the inbound freight task, and prefers to hold low levels inventory and to move freight quickly. Inbound retail freight is arguably the main driver for the overnight service. For outbound freight, just over half relies on the “make and ship” business model, sending freight out of Tasmania within a day of harvest or manufacture. As with the inbound freight task model, the outbound freight task is also a significant driver for the overnight shipping service.
The two largest shippers across Bass Strait are vertically integrated companies, and provide road freight and freight forwarding services. This benefits freight users by having services managed by one party, and can reduce points of failure in the supply chain, making it more reliable. However, the downside to his is that there is a lack of choice for competing freight forwarders who believe the integrated shipping provider can be conflicted in providing their service.
The services provided by the various freight operators are:
Service Toll SeaRoad TT-Line SRT Fresh
Freight TasFreight TasRail
Mainland transport
x x
Shipping x x x
Road/rail Transport
x x x x x x
Freight Forwarding
x x x x x
Table 29: Services Provided by Major Transport and Logistics Suppliers in Tasmania
7.3.1 Indicative Shipping Rates
Shipping rates are typically quoted on a wharf gate-to-wharf gate basis. That is, the price is inclusive of all the individual components, such as lift-on / lift-off and port charges.
As a premium freight service carrying largely refrigerated fresh food, TT-Line has a different price structure compared to Toll-ANL and SeaRoad Shipping. Consultation with numerous freight users
Project 234986 File Auercon Supply Chains Report Part I (Supply Chains) 30 August 2013Revision 0 Page 80
indicates TT-Line has a price of approximately $225 per linear metre including loading and unloading of trailers.
Prices ascertained through consultation with freight users are shown below. Prices are indicative only, as many freight users provided data in a veiled fashion, and prices vary depending on annual volume.
Freight costs per TEU per kilometre have been calculated for a series of price points, based on a Bass Strait crossing distance of 420 km. The summary of these costs are shown in the table below.
Wharf to Wharf Cost
Rate per TEU/km Before TFES
Out-of-Pocket Cost
if TFES is Applicable
Rate per TEU/km After TFES
$1,600 $3.81 per TEU/km $745 $1.77 per TEU/km
$1,400 $3.33 per TEU/km $545 $1.30 per TEU/km
$1,200 $2.85 per TEU/km $389 $0.92 per TEU/km
$1,000 $2.38 per TEU/km $289 $0.69 per TEU/km
$800 $1.90 per TEU/km $227 $0.54 per TEU/km
$600 $1.43 per TEU/km $181 $0.43 per TEU/km
Table 31: Notional TEU Rates
A review of wharf to wharf costs for Bass Strait shipping indicates that on a per TEU per km basis, the cost is approximately two to three times more expensive than typical road freight rates ($1.09 per TEU/km). However, for shippers receiving TFES assistance, shipping rates compare favourably with road freight rates. For example, a shipper who pays a wharf to wharf cost of $1,000 and receives the TFES assistance will pay $0.69 per TEU/km.
7.3.2 Volume Variation in Shipping Rates
The volume of units shipped has a significant impact on price, with high volume Bass Strait shippers paying less per TEU than their low volume counterparts. Seasonality and container equipment requirements also impacts pricing, with shippers with consistent volumes receiving lower rates than highly seasonal shippers. The relationship between volume and price is shown below.
Project 234986 File Auercon Supply Chains Report Part I (Supply Chains) 30 August 2013Revision 0 Page 81
Figure 17: TEU Shipping Price vs. Quantity
7.3.3 Empty Container Positioning Costs
Empty containers represent 31% of inbound containers and 33% of outbound containers. Empty container repositioning is required due to a range of factors, including:
A mismatch in container types – for example 40ft international containers enter Tasmania while 20ft international containers leave.
An imbalance in import/export trade with more full containers entering Tasmania than leaving.
Stakeholder discussions indicate that the repositioning of empty containers is a significant issue facing export freight users. Notwithstanding the physical challenge of obtaining an empty export container and securing passage across Bass Strait, this task attracts a repositioning cost.
The cost to reposition an empty container from Melbourne to Tasmania is approximately $400-$600 depending on the final destination and typically includes Bass Strait shipping and road transport costs. Container hire is typically only charged after the seventh day.
Project 234986 File Auercon Supply Chains Report Part I (Supply Chains) 30 August 2013Revision 0 Page 82
Empty container positioning is not generally of concern to domestic freight users, as domestic containers are in surplus by a large amount in Tasmania. For some freight users, containers are included by the freight supplier (e.g. Toll) and included in freight rates.
7.4. Port Costs
Shipping rates to transport containers between Tasmania and Melbourne include the TasPorts and Port of Melbourne port charges, including Webb dock lift-on/lift-off costs. Export freight users face additional port charges to tranship goods via Melbourne, and dependent on the goods may include charges such as:
Container consumption
Quarantine
Health certificates
Container lining
Marine Insurance
Typical charges and indicative rates for export shippers are:
Charge Indicative Rate
Terminal Handling Charge (THC) $200 - $300
Basic Service Rate Additional (BSRA) $150 - $200
Security $20
Bill of Lading $60 - $100
Manifest $25
Total $450 - $650
Table 33: Indicative Charges and Rates Applied To Exports
These additional charges are sometimes included in freight user’s representations of Bass Strait shipping charges. To ensure costs are not misrepresented, it is important to disaggregate these charges before making comparisons between Bass Strait and other shipping services.
Project 234986 File Auercon Supply Chains Report Part I (Supply Chains) 30 August 2013Revision 0 Page 83
7.5. Tasmanian Freight Equalisation Scheme
7.5.1 Structure
The Tasmanian Freight Equalisation Scheme (TFES) was originally introduced in July 1976. The Government’s objective was to alleviate the freight cost disadvantage incurred by shippers of eligible non-bulk goods moved by sea between Tasmania and the mainland.
Under the TFES, a shipper’s wharf-to-wharf freight bill from northern Tasmania to Victoria minus the Road Freight Equivalent cost, determines how much assistance an individual shipper may be paid (the ‘sea freight disadvantage’). This is calculated before adjustments are made for the heavy freight discount and Scheme incentive structure (the Scheme incentive structure means that shippers with higher freight costs are not paid the full ‘sea freight disadvantage’ – the maximum TFES payment is capped at $755 per TEU plus an intermodal allowance of $100).
Where claims are not submitted on a wharf-to-wharf basis, the freight bill is adjusted by subtracting a fixed amount per TEU equivalent for each door-to-wharf or wharf-to-door movement to estimate the notional wharf-to-wharf equivalent freight bill.
The key benchmark underpinning the TFES calculation of shippers’ sea freight disadvantage is the ‘road freight equivalent’ – the notional cost of transporting the same amount of freight 420 kilometres by road on the mainland.
Where claims are made on a door-to-door basis, the freight bill is converted to a wharf-to-wharf basis by subtracting fixed parameters. The current parameters are $230 per TEU which equates to $460 for
door
door-to-wharf
intermodal cost
wharf-to-wharf cost
door wharf wharf
intermodal cost
door-to-wharf
Bass Strait (420 km, Northern Tasmania
to Port of Melbourne)
Sea journey
Origin
local collection
highway start
road transport - linehaul
road freight Equivalent (420 km)
Road journey
Destination
local delivery
highway end
Source: BITRE based on TFES Review Authority (1998) and Ministerial directions (DITRDLG 2008)
Figure 18: Structure of TFES
Project 234986 File Auercon Supply Chains Report Part I (Supply Chains) 30 August 2013Revision 0 Page 84
a door-to-door shipment.
The actual assistance payable under TFES is:
the shipper’s calculated sea freight cost disadvantage; less
an adjustment – to provide an incentive to minimise freight rates; plus
the fixed allowance for intermodal costs.
In 1998 the TFES review authority recommended that the assistance payable to a shipper incorporate an adjustment to incentivise shippers to minimise freight rates. This relates to the upper limit of TFES assistance of $855 per TEU (including the intermodal allowance). This upper limit applies for a notional wharf to wharf disadvantage of greater than or equal to $1,007 per TEU.
The Ministerial Directions (2008) identifies four classes of freight users. These classes receive a proportion of the notional wharf-to-wharf freight cost disadvantage which declines as the cost increases:
100 % of the first $335.50 per TEU (Class 1 shipper); plus
75 % for the second $335.50 per TEU (Class 2 shipper); plus
50 % for the third $335.50 per TEU (Class 3 shipper); plus
Nil for amounts above $1006.50 per TEU (Class 4 shipper).
It is important to note that a Class 1 freight user with a notional wharf-to-wharf disadvantage of $0 to $335.50, which equates to a notional wharf-to-wharf cost of $281 to $616.5 incurs the same out of pocket expense of approximately $181 regardless of whether their notional wharf-to-wharf cost is $281 or $616.50.
Shipper Notional Wharf-to-Wharf rate
Road Freight
Equivalent
Notional Wharf-to-
Wharf Disadvantage
TFES Payment
Out of Pocket
Expense
Class 1 $281 to $616.50
$281 $0 to $335.50 $0 to
$435.50 $181
Class 2 $616.51 to
$952 $281
$335.51 to $671
$435.51 to $687.13
$181 to $264.88
Class 3 $952.01 to $1,287. 50
$281 $671.01 to $1,006.50
$687.13 to $854.88
$264.88 to $432.63
Class 4 >$1,287.51 $281 >$1,006.51 $854.88 >$432.64
Table 34: A Comparison of Out of Pocket Expenses for Shippers Eligible for TFES
7.5.2 T
There arset out in
Goods agricultu
TFES pprocess Tasman
The TFE
ship
ship
intenmain
An expodifferencnotional comparewho incu
The strurelocatinemploym
Fig
TFES an
re eligibility rn the Ministe
eligible for ure, forestry,
ayments do on the main
ia in the dom
ES does not a
ped as air ca
ped as bulk
nded to be snland prior to
ort freight uce in costs in
wharf-to-whed to a TFESurs an out of
cture of the ng processinment. For ex
gure 19: Tas
nd Expor
requirementserial Direction
southboundfishing, man
not extendnland prior t
mestic marke
apply to goo
argo, except
cargo; or
shipped out o export.
ser incurs tncurred by eharf rate of S eligible dompocket expe
TFES can pg activities ample, fruit
smania Frei
rts
s that freightn – Guideline
d assistancenufacturing a
to exports to export as t are eligible
ds that are:
in special ci
of Australia
the total cosexporters and$1,287.51 inmestic freighense of $432
produce a scto the mainor vegetable
Project 234986
ght Equalis
t users must es (MDG).
e are genernd mining.
unless theyper the MD
e for assistan
rcumstances
a, unless the
st of the nod TFES eligincurs the enht user shipp2.64.
enario whereland to redu
es may be p
File Auercon Supply
sation Schem
meet to rec
rally related
y undergo aDG. Also, notnce.
s;
ey undergo
otional wharible domesticntire amounping between
e businessesuce transporrepared and
Chains Report Part I
me Assistan
ceive TFES a
to primary
a manufactut all goods m
a manufactu
rf-to-wharf rac freight uset as an out
n northern Ta
s in export mrt costs, at ad packaged f
(Supply Chains) 30 ARevisio
nce
assistance, w
industries,
ring or valumoving in an
uring proces
ate. To highers - an expot of pocket asmania and
markets may a cost to Tafor supermar
August 2013on 0 Page 85
which are
such as
e adding nd out of
ss on the
hlight the ort with a expense, d Victoria
consider asmanian rkets and
Project 234986 File Auercon Supply Chains Report Part I (Supply Chains) 30 August 2013Revision 0 Page 86
transported across the Bass Strait in bulk. In this scenario businesses may consider relocating processing activities to the mainland in order to be eligible for TFES assistance. Stakeholder feedback indicates that a number of businesses are considering migrating value adding activities to the mainland.
7.6. Medium Volume Shipper Breakdown of Prices
A number of different tariffs apply to Bass Strait shipping services, with each customer having their own rate card, comprising of multiple fees. Rate cards are developed through commercial negotiation and it may be the case that similar businesses face different freight rates.
Indicative freight rates have been developed based on information gained through interviewing freight users.
The chart below compares costs incurred by a medium volume domestic shipper (before TFES) and a medium volume overseas shipper. The Bass Strait shipping cost is based on is the mid-point of the range of estimated charges medium volume shippers face - $1,000/TEU.
As information on charges has not been made available it is not possible to break down shipping cost into its components. As such, charges include lift on/lift off allowances and all port charges. Although port charges are published, Bass Strait shippers have negotiated commercially confidential rates with TasPorts and the Port of Melbourne which vary from the published schedules.
As a rule of thumb the fixed/variable split of costs for ships is 65%:35%, and the lift on/lift off charge is approximately $50. These costs are shown below.
Project 234986 File Auercon Supply Chains Report Part I (Supply Chains) 30 August 2013Revision 0 Page 87
Figure 20: Breakdown of Transport Costs
There is a common view among stakeholders that Bass Strait shipping costs are high. This is true in comparison to road freight in mainland states; though the TFES reduces this burden for eligible shippers. However, direct exporters are ineligible for the TFES, and receive no relief from Bass Strait shipping costs.
In addition to the usual freight costs, other charges, such as empty container repositioning adds to costs incurred by domestic shippers. These additional costs amount to around $500, although large exporters may be able to negotiate cheaper Bass Strait shipping costs.
Total export shipping costs are up to $1,600 per TEU more expensive than a domestic shipper’s cost to ship goods from Tasmania to Melbourne.
7.7. Export
The cessation of the direct call international shipping service to Bell Bay and the impact on exporters is well documented. The following observation compares the cost impact for an exporter who previously shipped from Bell Bay with the AAA service to an exporter who now tranships through Melbourne.
Project 234986 File Auercon Supply Chains Report Part I (Supply Chains) 30 August 2013Revision 0 Page 88
Two Cases Launceston to Bell Bay (47km – 35min travel time); and
Launceston to Port of Melbourne (via Bass Strait).
Assumptions Cost to relocate empty container from Bell Bay to Launceston - $300.
Launceston to Bell Bay road freight - $100.
Bass Strait shipping cost $1000 (wharf to wharf).
Transhipment cost - $100 based on hourly semi-trailer rate.
Cost Breakdown
Table 35: Comparative Transport Cost Breakdown
Note: The assumed Bass Strait cost of $1,000 is regarded as competitive. Based on the scenario above, the impact to an exporter is $1,260 per TEI. This assessment does not include the price of international ocean freight which varies depending on carrier.
7.8. Cost Benchmarking
A key focus of this study is to benchmark the cost of transporting a container originating in Tasmania against a road journey originating on the mainland.
Aurecon’s ‘Tasmanian Shipping and Ports’ Report provides details of cost benchmarking Bass Strait shipping cost against comparable international journeys. This benchmarking exercise found that the nominal rack rate of Bass Strait prices appear to be higher by 24% on average, however this price difference should be considered in context. It is influenced by higher Australian costs for labour and bunker fuel prices, which are around 23% higher than European costs.
Project 234986 File Auercon Supply Chains Report Part I (Supply Chains) 30 August 2013Revision 0 Page 89
The challenge of any benchmarking exercise is to find a suitable and realistic comparison as different freight tasks have different drivers. An example of these drivers is the preference to use TT-Line for fresh food based on the faster sailing time compared to other services which may be less cost.
The following benchmarking exercise compares the cost of transporting a container (1 TEU) from Hobart to Melbourne (733km) against the cost of transporting a container a similar distance on land only.
A land journey between Adelaide and Melbourne is used to demonstrate road costs, as the distance is close to the distance between Hobart and Melbourne.
Four scenarios Hobart to Melbourne (via Devonport) for a container.
Hobart to Melbourne (via Devonport) for domestic container (TFES assisted).
A hypothetical journey (733km) on a 19m Semi undertaken on land only.
A hypothetical journey (733km) on a 26m B-Double undertaken on land only.
Assumptions A Semi-trailer operates at a cost of $2.15/km ($1.09/km/TEU).
A B-Double operates at a cost of $2.30/km ($0.77/km/ TEU).
A nominal wharf-to-wharf cost of $1,000 (includes intermodal lift on/off costs of $100).
A nominal cost between Webb Dock and the final destination in Melbourne of $100.
Project 234986 File Auercon Supply Chains Report Part I (Supply Chains) 30 August 2013Revision 0 Page 90
Export – Hobart to Melbourne
Domestic (TFES assisted) – Hobart to
Melbourne
Land only – 19m Semi – 733km
Land only – 26m B-Double – 733 km
Unit Cost Unit Cost Unit Cost Unit Cost
Road Leg 278km at $1.09/km
$303 278km at $1.09/km
$303733km at $1.09/km
$799 733km at $0.77/km
$564
Lift On $50 $0 - -
Bass Strait Devonport – Melbourne
$900 Devonport –
Melbourne (TFES assisted)
$450 - -
Lift Off $50 $0 - -
Further Road Leg
$100 $100 - -
TOTAL $1403 $853 $799 $564
Table 36: Cost Benchmarking Comparing Transport Costs for 1 TEU between Hobart and Melbourne to Costs for 1 TEU between Adelaide and Melbourne
Project 234986 File Auercon Supply Chains Report Part I (Supply Chains) 30 August 2013Revision 0 Page 91
Figure 21: Comparative Transport Cost Breakdown
As indicated in the table and chart above, the cost to transport a container from Hobart to Melbourne ($1,403) is almost double the cost to transport a container the same distance on land by semi-trailer ($799). These costs do not include additional costs incurred by freight users in Tasmania such as empty container relocation, cleaning, fumigation and inspection.
The cost to move a container from Hobart to Melbourne is reduced by $550 to a total cost of $853 where the exporter is eligible for TFES assistance. A journey of the same distance undertaken on land varies from $564 to $799 based on standard rates for a 19m Semi-trailer (2 TEU) and a 26m B-Double (3 TEU) vehicle.
Road freight pricing
Tasmanian road freight prices have also been compared against mainland and New Zealand rates. The analysis below considers a container originating on the North Island of New Zealand, crossing the Cook Strait to the South Island.
Assumptions Rates have been calculated for a dry container on a dollar per kilometre per TEU rate.
19m semi-trailer (or equivalent) vehicle is used.
TEU rates are calculated on the assumption that the truck is fully utilised i.e. two paying TEU’s per truck.
Project 234986 File Auercon Supply Chains Report Part I (Supply Chains) 30 August 2013Revision 0 Page 92
The figure below illustrates comparative road freight prices.
Figure 22: Comparative Road Freight Price
Rate Comparison Victoria
Tasmanian rates are broadly comparable to Victoria. The price data above indicates that Tasmania is marginally more expensive than Victoria. The reason for this is likely to be that fuel costs are higher in Tasmania than mainland state capitals.
New Zealand
Road freight prices are notably higher in New Zealand than Tasmania. While labour costs are higher in Australia, New Zealand freight users pay road user charges that do not apply in Australia.
Industrial
Transeco
Industrial
Industrial - VIC
Transeco
NZ Industrial
$1.00
$1.05
$1.10
$1.15
$1.20
$1.25
0.5 1.5 2.5 3.5
Road Freight Price (Dry) $/km/TEU
$/km/TEU
Tasmania Victoria New Zealand
Project 234986 File Auercon Supply Chains Report Part I (Supply Chains) 30 August 2013Revision 0 Page 93
8. Findings
8.1. Supply Chains
Tasmanian supply chains are simple, and largely similar across different commodity groups. The linehaul nature of supply chains supports the ‘make and ship’ business model used by many Tasmanian freight users. This differs from mainland supply chains, which involve both linehaul and distribution. Many industries in Tasmania do not have a distribution function in the State, as this step takes place on the mainland.
Overall, there are few opportunities for improvement for the linehaul function. Considering a commodity or business in isolation, once a product is placed on a truck there is little that can be improved. There are, however, opportunities for improvement to be found outside individual commodity supply chains and individual businesses. The opportunities for improvement in Tasmania are to consider how these supply chains work together, how freight is planned and whether or not the network can be improved.
8.2. Innovation
A common feature of the logistics industry is the constant search for efficiencies. Through the interview process, Aurecon discovered a number of efficiencies introduced by companies in Tasmania, and these are detailed below.
An observation we made was that where excellence occurs, it is generally confined to a single company and these ideas and efficiencies do not flow to others. Larger companies tend to have more efficient supply chains because they have the resources to investigate problems and invest in their remedies.
Project 234986 File Auercon Supply Chains Report Part I (Supply Chains) 30 August 2013Revision 0 Page 94
Company Innovation Comment
Cadbury Slip sheets Removes the need for a pallet, allows more to be packed into a container
Petuna Trailers on barges Can pump fish directly to road trailer eliminating a double handling step
Websters Fantainer – door ajar shipping Onions arrive in good condition
Norske Skate loading of containers Removes the need for a pallet, allows more to be packed into a container
Toll Specialised reefers Separates reefer from refrigeration plant, allowing more to be stored in container
Cadbury, Norske Melbourne warehousing Reduces inventory holdings and warehousing costs
8.3. Efficiencies
The efficiency of many Tasmanian supply chains is evident – for example, it is not uncommon for produce to be moved from field to market within 24-36 hours.
Inefficiencies arise at the nodes (transfer points) in a supply chain. In point to point supply chains such as Tasmania’s freight system there are few nodes except for the endpoints.
8.4. Inefficiencies
Some inefficiency was noted, which were mostly the result of flaws in the design or execution of the supply chain.
Project 234986 File Auercon Supply Chains Report Part I (Supply Chains) 30 August 2013Revision 0 Page 95
Comment Observation
Intermodal rail On the mainland it is inefficient to use rail over short distances such as those in Tasmania. For freight already loaded onto a truck, it is not clear that the cost and delay of changing modes is worthwhile.
Driving past two ports For export freight that originates from Bell Bay it is inefficient (but unavoidable) to pass two ports (Bell Bay and Devonport) on the way to the Port of Burnie.
Container availability
The unavailability of certain container types is a shortcoming of the system. Some manufacturers add to their lead times to cater for delays in securing containers. Container availability may be impacted by shipping capacity levels.
Goods left behind At peak times, some goods are left behind in favour of perishable freight.
Excess empty containers See below
Table 37: Supply Chain Inefficiencies
8.5. Excess Empty Containers
Empty containers account for more than 27% of the Bass Strait shipping task. For a system constrained by capacity, this is a waste.
Direction 20 ft 40 ft All Containers Wheeled All Unitised
Entering Tas 27,016 5,690 38,396 4,403 47,202
Leaving Tas 47,706 5,023 57,752 8,208 74,168
74,722 10,713 96,148 12,611 121,370
Table 38: Empty Containers
The reasons behind the large volume of empty containers being shipped are not clearly known, but the following factors may impact volumes:
A mismatch between inbound (domestic) and outbound (international) containers.
A mismatch between container sizes 40ft vs 20ft.
An absence of coordination between shippers.
Poor planning.
Project 234986 File Auercon Supply Chains Report Part I (Supply Chains) 30 August 2013Revision 0 Page 96
8.6. Freight Service
Most freight users regard the freight service across Bass Strait as very good, because it is:
Provided by multiple shippers – provides for a level of redundancy.
Nightly – 6 to 7 days per week – can ship fresh freight.
Reliable – for most users it is possible to ship with a high degree of certainty.
Efficient – ships unload in a matter of hours.
Timely – shipping at the end of the day meshes well with work day in Tasmania.
Businesses have developed their supply chains around the reliability, timeliness and daily schedule of shipping services.
These shipping services are a one size fits all model, and some freight needs this service, some freight takes advantage of this service and some freight pays for this service level but derives no benefit.
Only a small proportion of freight (15%) strictly requires this level of service. This is fresh freight, which needs to get to market quickly to maximise shelf life (and in turn price).
Around half of freight (51%) across Bass Strait can make use of this service and does, for example, fresh freight.
Some freight users reported reliability problems. They were that:
at peak times their freight is left behind in favour of perishable freight; and/or
export containers were often hard to obtain.
On balance the freight service meets the needs of most users, with harvest time presenting a challenge to most freight users.
8.7. Shipping Capacity
Daily Bass Strait shipping capacity in one direction is around 860 TEU. Based on a six and seven day shipping schedule, monthly capacity is around 23,000 TEU. Average utilisation is 80%, with an average of 18,500 TEU moved monthly each way in FY 2011/12.
Logistics systems are commonly considered “at capacity” at 85% utilisation. This is a level that permits recovery should some complication occur (e.g. a spike in demand or unexpected outage).
In peak months utilisation can reach over 90% for the month. Weekly peaks push utilisation rates even higher, resulting in service concerns during peak season. To meet the increased demand, Toll
Project 234986 File Auercon Supply Chains Report Part I (Supply Chains) 30 August 2013Revision 0 Page 97
increases their sailing schedule to provide a service 7 days per week, and TT-Line operates daylight sailings.
8.8. Freight Costs
As in any market, a range of factors influence freight pricing. Volume appears to be a major influence on freight prices across the Bass Strait.
It is important to acknowledge that freight prices are negotiated on a commercial basis and the price for similar commodities can vary. Based on industry interviews, the following prices have been inferred for shipping a TEU (dry) across the Bass Strait:
Volume (TEU/yr) Bass Strait Shipping**
Rate ($/TEU) Bass Strait Shipping
($/TEU/km)
High volume shipper >1000 $600-$800 $1.43 - $1.90
Medium volume shipper
100 $800-$1,000 $1.90 - $2.38
Low volume shipper 10 $1,000-$1,200 $2.38 - $2.86
**Wharf gate to wharf gate pricing
Table 39: Bass Strait Crossing Rate
Most freight users regard Bass Strait shipping costs as expensive; however this is not necessarily the case for all shippers.
A comparison of Tasmanian road freight costs and mainland road freight costs indicates they are on par (ranging from $1.09 to 1.16./TEU/km).
On a $/TEU/km basis, sea freight is two to three times more expensive than road freight. For a freight user receiving TFES assistance, costs for shipping between northern Tasmania and Victoria sea freight costs are brought at least in line with mainland road freight costs, if not better.
Rate ($/TEU/km)
Road freight $1.09 - $1.16
Sea freight (Medium volume shipper) $1.90 - $2.38
Sea freight after TFES (Medium volume shipper) $0.54 - $0.69
Table 40: Bass Strait Freight Costs
8.9. Export Freight Costs
Tasmanian exporters face high costs compared to Tasmanian domestic shippers. Exporters have a longer supply chain and often need to reposition empty containers, adding to their costs. The repositioning of containers for domestic shippers appears to be built into freight costs.
Project 234986 File Auercon Supply Chains Report Part I (Supply Chains) 30 August 2013Revision 0 Page 98
Analysis indicates that a low to medium volume shipper would pay $1,403 (or $853 if eligible for TFES) to ship a dry TEU from Tasmania to Melbourne. An exporter would pay $2453 (including the cost of placing product on an export vessel), assuming the same costs to cross Bass Strait.
8.10. Data Availability
Aurecon found there was limited reliable and reportable data on freight volumes, type and cost in the public domain. Some companies and organisations are at critical points in the supply chain and can collect this data for themselves, but it is not available generally.
The absence of data can hamstring planning for the sector; it can also be a barrier to more value adding developments for the sector. Many advances in logistics, such as the routing and tracking of vehicles, are built on data which is increasingly available and collected real time.
The Hunter Valley Coal Chain Coordinator is an outstanding example of the value being achieved through the pooling of information from different industry participants for the benefit of all involved in the industry.
8.11. Market Structure
There is a tendency for industries in Australia to develop such that there are one or two large players and then several small participants. This is generally a good thing as the large players, being large invest in advances that benefit their customers. The banks and supermarkets would be examples of this.
The freight market in Tasmania similarly has some strong players and similarly consumers are well served, with frequent service and access to good information systems. In the course of this study Aurecon received comment that consumers of freight would like to see a wider choice of freight providers. Limited choice is in part the difficulty of small economies.
Project 234986 File Auercon Supply Chains Report Part I (Supply Chains) 30 August 2013Revision 0 Page 99
9. Opportunities for Improvement
9.1. Capacity Expansion for Shipping
Given shipping is near (and sometimes exceeds) capacity limits; an increase in shipping capacity is required. Potential considerations include:
Existing 6 days per week operators to extend to 7 days per week operations.
Encouraging existing shippers to invest in larger vessels or additional vessels.
Improved planning systems to reduce impact of seasonal peak.
Reducing the number of empty containers being shipped.
9.2. Shipping from Bell Bay
A substantial market for freight is based around Bell Bay. This freight does not require a daily service but could benefit the introduction of a weekly service. It may be possible for one of the existing RORO vessels to service Bell Bay on a weekly basis, which would remove the road freight leg to Burnie.
This approach would assist the Low Cost supply chain participants.
9.3. Empty Container Positioning
There is strong stakeholder interest in reducing the volume of empties shipped across Bass Strait. Empty containers represent approximately 27% (simple average of inbound 21% and 33% outbound) of the freight task.
Given that ships crossing Bass Strait are fully utilised, and cargo is sometimes left behind, any reduction in empties should improve the service for freight users and remove costs from the supply chain.
It is likely that the empties problem arises from a mismatch between container types and size, but there is little information about this in the public domain. A freight logistics group, such as the FLCT in the first instance, could commission analysis to understand the nature of the problem more clearly and form a view on whether any improvement is possible.
Project 234986 File Auercon Supply Chains Report Part I (Supply Chains) 30 August 2013Revision 0 Page 100
9.4. Freight Data Base
The timely and comprehensive collection of freight data is recommended. This would assist policy makers and potentially private sector investors to make decisions for the betterment of the freight system.
The collection and publication of freight data would also enhance competitiveness in the state because it would create transparency in some aspects of freight. The collection of data may also be an enabler of more advanced approaches to freight planning.
A suitable collection point for freight data could be TasPorts. Funding would be needed to conduct this work.
9.5. Supply Chain Optimisation
The mathematical field of operations research has advanced to the stage where very sophisticated products could be made available to Tasmanian freight users, and implemented over a several year time frame if necessary.
Opportunities exist to reduce empty backhauls for trucks, intelligently route freight to rail, reduce the number of vehicles on roads and reduce the carriage of empties on ships. This could be done by considering Tasmanian freight as operating in a single system. For example, it would be possible to develop a virtual container park via an online platform to facilitate matching available empty containers with freight users. This system could form a part of a sophisticated planning and scheduling system, allowing freight users to bid for or buy available freight space, or book in advance.
It would be reasonable to expect to achieve a 5-10% reduction in freight costs as an outcome of an optimisation exercise. Such an exercise would require the co-operation of Government and industry.
9.6. Industry Structure
Companies moving large volumes of freight are generally able to negotiate competitive prices. Some smaller operators struggle to do this, suggesting that a cooperative approach may provide the scale necessary to negotiate a reduction in supply chain costs.
In New Zealand, cooperatives operate for their members to market product, conduct research, negotiate packaging services and purchase freight. In doing this they achieve lower rates than individual farmers could in their own right.
There may be an opportunity for the emerging fresh produce industry in Tasmania to band together, where their interests are similar, to invest in shared facilities, purchase freight and improve their supply chains.
Project 234986 File Auercon Supply Chains Report Part I (Supply Chains) 30 August 2013Revision 0 Page 101
9.7. Innovation Forums
In conducting interviews, Aurecon came across several examples of innovation in logistics. There may be an opportunity to share these examples with others in Tasmania – for example, the use of slip sheets for loading containers, where it makes sense should be widely promoted.
It is suggested that Tasmanian freight users work together to share this information so that greater efficiencies can be realised. A forum of interested peers could meet with an innovation agenda in mind. Information could be disseminated through bodies such as the Tasmanian Chamber of Commerce and Industry (TCCI).
9.8. Assistance for Export
The cessation of the AAA service at Bell Bay has resulted in notable cost increases for exporters, and this is likely to impact the viability of export focussed businesses. The additional cost to tranship through Melbourne is in the region of $1,000 to $1,300. Whilst the cost of Bass Strait shipping is high compared to international examples, the burden is significantly less when assistance such as TFES is applied. This produces a scenario where exporters are significantly disadvantaged compared to domestic shippers.
Consideration should be given to measures to assist export shippers and reduce the cost of export supply chains.
Project 234986 File Auercon Supply Chains Report Part I (Supply Chains) 30 August 2013Revision 0 Page 102
10. Appendices
Project 234986 File Auercon Supply Chains Report Part I (Supply Chains) 30 August 2013Revision 0 Page 103
Appendix A
List of Tables and Figures
Table 1: Freight Task Throughput of Tasmania’s Major Ports 2011-12 18 Table 2: Inbound Freight (TEU) Task and Port Market Share 20 Table 3: Outbound Freight (TEU) Task and Port Market Share 20 Table 4: Aquaculture Supply Chain Steps: Dover to Devonport 29 Table 5: Aquaculture Supply Chain Steps: Macquarie Harbour/Strahan to Devonport 30 Table 6: Supply Chain Steps: Chilled Supply Chain 32 Table 7: Supply Chain Steps Longford to Melbourne – Frozen Supply Chain 33 Table 8: Supply Chain Steps: Bell Bay to Melbourne 36 Table 9: Comparison of Supply Chains Elements 38 Table 10: Supply Chain Steps: Launceston to Melbourne 40 Table 11: Vegetable Production in Tasmania (Source: ABS Survey 2009) 42 Table 12: Fresh Vegetables Supply Chain Steps: Farmgate to Melbourne 42 Table 13: Processed Vegetables Supply Chain Steps: Farmgate to Melbourne 43 Table 14: Fruit Supply Chain Steps: Hobart to Melbourne 47 Table 15: Supply Chains Steps: Hobart to Melbourne 49 Table 16: Supply Chain Steps: Boyer to Melbourne 52 Table 17: Major Dairy Producers in Tasmania 57 Table 18: Supply Chain Steps: Farm to Melbourne Distribution Centre 58 Table 19: Supply Chain Steps: Melbourne to Tasmanian Shop 61 Table 20: Representative Supply Chains 65 Table 21: SCOR Model Attributes Definitions 65 Table 22: Summary of Interviews of Tasmania Freight Users 66 Table 23: SCOR Commentary: Fresh 68 Table 24: SCOR Commentary: Low Cost 70 Table 25: SCOR Commentary: Low Inventory 73 Table 26: SCOR Commentary: Perishable 74 Table 27: Indicative Road Freight Operating Costs by vehicle type 77 Table 28: Standard Tasmania Truck Haulage Cost Rates 78 Table 29: Services Provided by Major Transport and Logistics Suppliers in Tasmania 79 Table 30: Indicative Sea Freight Rates 80 Table 31: Notional TEU Rates 80 Table 32: Indicative Empty Container Positioning Costs 82 Table 33: Indicative Charges and Rates Applied To Exports 82 Table 34: A Comparison of Out of Pocket Expenses for Shippers Eligible for TFES 84 Table 35: Comparative Transport Cost Breakdown 88 Table 36: Cost Benchmarking Comparing Transport Costs for 1 TEU between Hobart and Melbourne
to Costs for 1 TEU between Adelaide and Melbourne 90
Project 234986 File Auercon Supply Chains Report Part I (Supply Chains) 30 August 2013Revision 0 Page 104
Animal Oils - Other Gas, Natural Tobacco Manufactures
Armed Forces Goods Mail Tobacco, Raw
Briquettes Oils, Fats, Wax Vegetable Oils
Crude Animal Materials Personal Effects Water Craft
Crude Veg. Materials Precision Goods
Essential Oils Rubber, Other
Project 234986 File Auercon Supply Chains Report Part I (Supply Chains) 30 August 2013Revision 0 Page 107
Appendix C References
Department of Infrastructure, Energy and Resources; Tasmania State Government Tasmanian Freight Survey 2008/09 Major Industrial Sites Tasmania: 2011 Tasmania International Exports: 2011/12 2012 Transport Submission to Infrastructure Australia Western Tasmania Industry Infrastructure Study (May 2012), Sinclair Knight Merz Pty
Ltd International Container Shipping Service Viability For Tasmania (19 February 2013),
Meyrick Consulting Group Pty Ltd International and Domestic Shipping and Ports Study (1st May 2007)
Sinclair Knight Merz Pty Ltd Historic Freight Rate Data And Review Of Tasmania Freight Equalisation Scheme
And Tasmania Wheat Freight Scheme (30 April 2008) Department of Infrastructure, Transport, Regional Development and Local Government;
Australia Government Australian Sea Freight 2009–10 (September 2011) Statistical Report Australian Sea Freight 2010–11 (October 2012) Tasmanian Freight Schemes Parameter Review (October 2011) Freight Rates in Australia 1964–65 to 2007–08 (Information Sheet 28; October 2008) Road Freight Estimates And Forecasts In Australia: Interstate, Capital Cities And Rest
Of State (Report 121; September 2010) A Regional Economy: a case study of Tasmania (Report 116; October 2008) Truck Productivity: sources, trends and future prospects (Report 123; March 2011) Tasmania Corridor Strategy (2007) Tasmanian Freight Equalisation Scheme Ministerial Directions 2008 (November 2009)