15
Project Greener Findings
| Date post: | 18-Dec-2015 |
| Category: |
Documents |
| Upload: | osborn-carpenter |
| View: | 212 times |
| Download: | 0 times |

Project GreenerFindings
© 2010 Naf-Tech. All rights reserved.
Agenda
1. Introduction• Project Carbon Objectives
2. Fuel Additives• The Problem• The Solutions• The Product
3. NAF-TECH Benchmark Tests4. NAF-TECH Test Results5. Illustrated benefit for Green Holdings OPCO’s6. Practical implications and logistics7. Future Project Greener initiatives
© 2010 Naf-Tech. All rights reserved.
Introduction
• Worldwide drive for Green Technologies• A lot of research into new technologies and alternative energy
sources are conducted, worldwide• Large investment into new hardware and deployments required• Long term solution for the environment
• The Reality Check• Large deployment of diesel generators in existing operations• Huge operational expenses
• Diesel• Service and maintenance• End-of-life replacements
• Environmentally unfriendly, leaving large carbon footprint

© 2010 Naf-Tech. All rights reserved.
Introduction (cont)
• For Diesel generators, a short term solution is needed to reduce:
• carbon footprint• operational expenses
• Project Greener- Green Holdings R&D (2009)Research into technologies to reduce carbon footprint and OPEX

© 2010 Naf-Tech. All rights reserved.
Project Greener Objectives
Two types of products available
• Fuel Additives• Chemicals to alter composition of fuel• Little/no scientific proof of savings• Relatively easy and quick to deploy (big-bang approach)• Examples: NAF-TECH
• Mechanical Products• Most products improve engine oil quality• Better oil, less friction, better engine efficiencies• More complicated to deploy (phased-in approach)
• Project Greener Cycle 1Researched and tested Fuel Additives to determine benefits for Green Holdings operations
© 2010 Naf-Tech. All rights reserved.
Fuel Additives – The Problem
Inefficiencies of the Diesel internal combustion cycle
• Only 25%-30% of all the potential chemical energy of the fuel gets converted into kinetic energy due to losses• Into thermal energy and the cooling system• Caused by friction of mechanical parts inside the engine• Incomplete burn phase
• Incomplete burn phaseNormal engines only achieve 70%-80% efficiency
• Fuel is injected under pressure to form a fine mist (droplets)• Only vaporised fuel from the droplet surface burns• Diesel combustion stops when temperature and pressure drops• Larger droplets do not vaporise fast enough to complete burn• Unburned fuel is expelled through the exhaust and into engine parts
© 2010 Naf-Tech. All rights reserved.
Fuel Additives – The Solution
Improve the burn efficiency of Diesel
• Increase octane level of the fuel• Results in a more vicious chemical reaction and combustion not only
during the optimal combustion cycle• Can damage engine because of increased pressure and heat• Altered chemical composition of fuel can increase noxious gasses in
exhaust emissions
• Increase vaporisation of injected fuel• Better vaporisation results in more combustion during the combustion
cycle• More chemical energy converted into kinetic energy• Less unburned fuel and particulates in emissions
© 2010 Naf-Tech. All rights reserved.
Fuel Additives – The Product
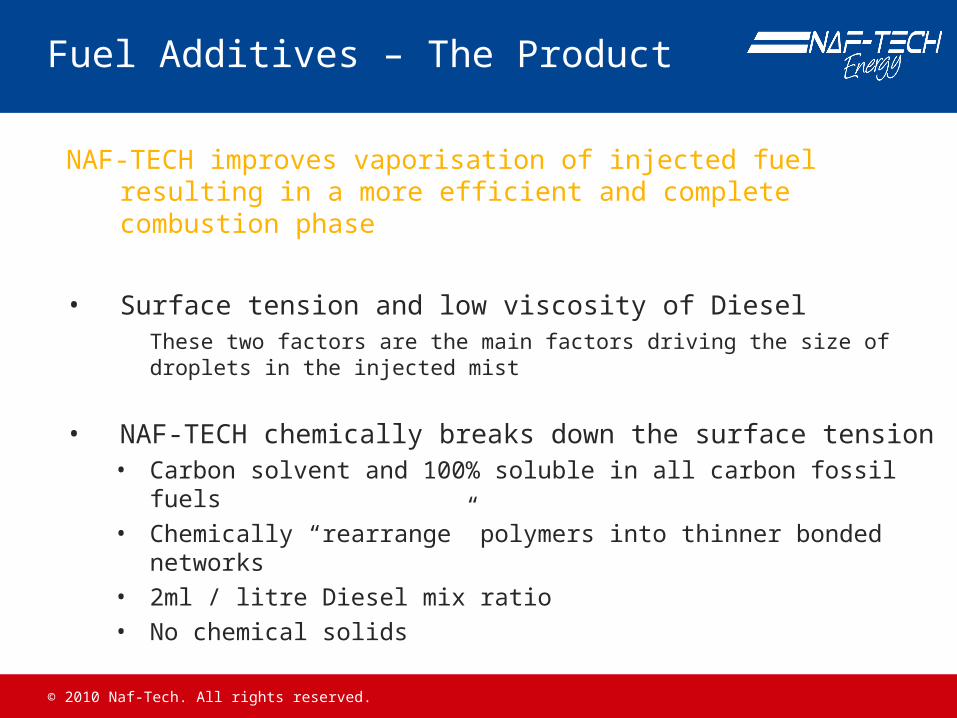
NAF-TECH improves vaporisation of injected fuel resulting in a more efficient and complete combustion phase
• Surface tension and low viscosity of DieselThese two factors are the main factors driving the size of droplets in the injected mist
• NAF-TECH chemically breaks down the surface tension• Carbon solvent and 100% soluble in all carbon fossil fuels• Chemically “rearrange” polymers into thinner bonded networks• 2ml / litre Diesel mix ratio• No chemical solids
© 2010 Naf-Tech. All rights reserved.
Fuel Additives – The Product (cont)
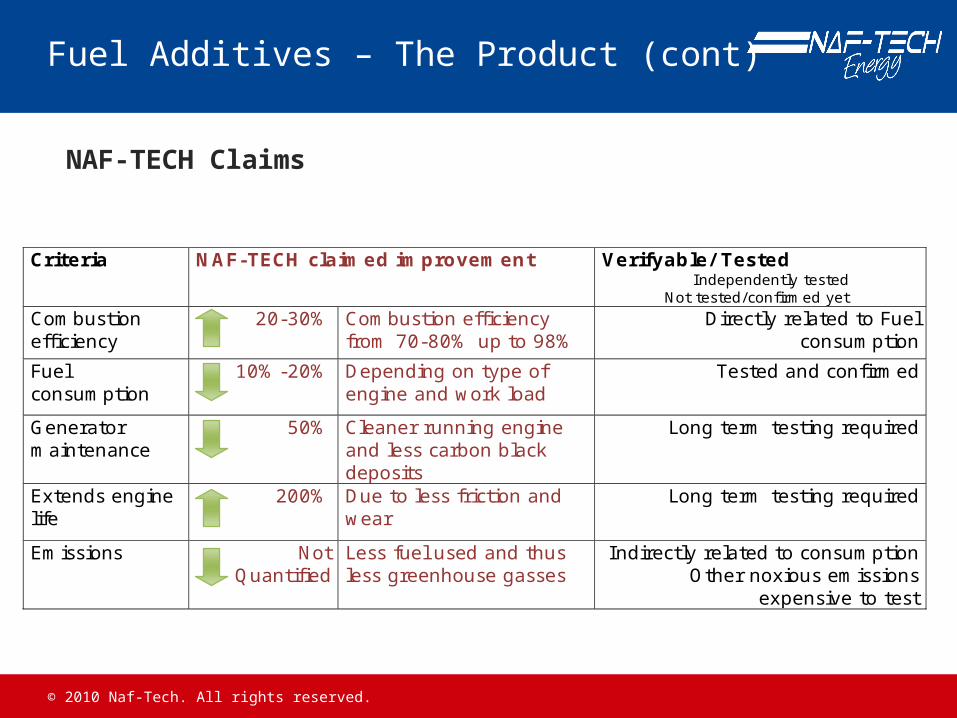
NAF-TECH Claims
Criteria NAF-TECH claimed improvement Verifyable/ Tested Independently tested
Not tested/confirmed yet
Combustion efficiency
20-30% Combustion efficiency from 70-80% up to 98%
Directly related to Fuel consumption
Fuel consumption
10%-20% Depending on type of engine and work load
Tested and confirmed
Generator maintenance
50% Cleaner running engine and less carbon black deposits
Long term testing required
Extends engine life
200% Due to less friction and wear
Long term testing required
Emissions Not Quantified
Less fuel used and thus less greenhouse gasses
Indirectly related to consumption Other noxious emissions
expensive to test
© 2010 Naf-Tech. All rights reserved.
NAF-TECH Benchmark Tests
Besides the added benefits and claims the 1st priority was to verify NAF-TECH’s core claim about fuel consumption.
• Design test procedures to repeatedly test claim
• Independent tests conducted on generator setsDiesel Electric Services, Aer-o-Cure
• Result analysis and compile findings
© 2010 Naf-Tech. All rights reserved.
NAF-TECH Test Results
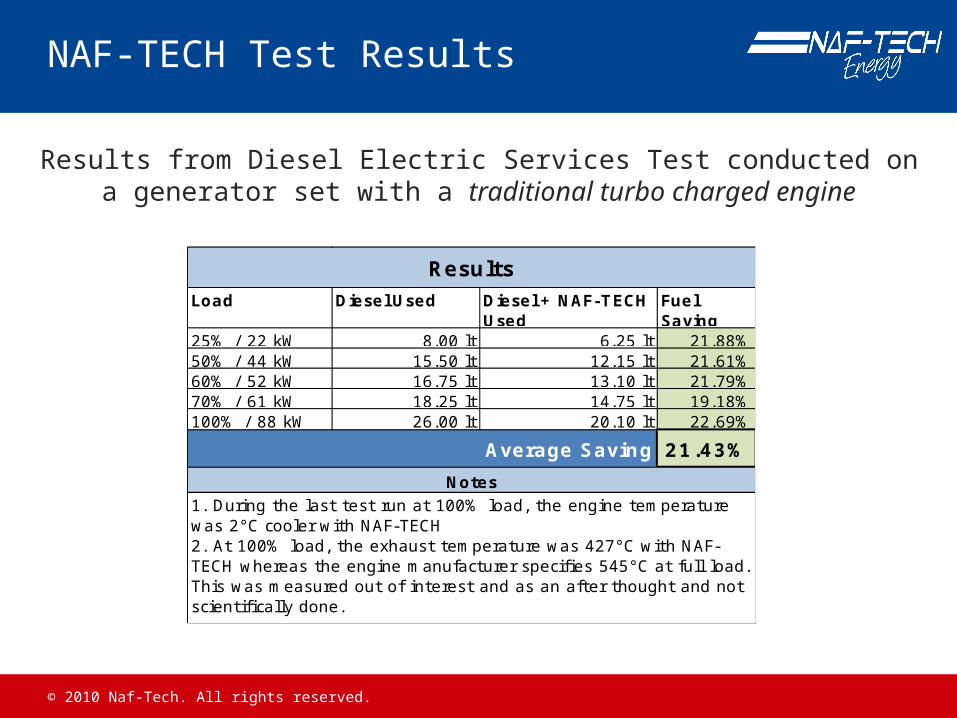
Results from Diesel Electric Services Test conducted on a generator set with a traditional turbo charged engine
Load Diesel Used Diesel + NAF-TECHUsed
Fuel Saving
25% / 22 kW 8.00 lt 6.25 lt 21.88%50% / 44 kW 15.50 lt 12.15 lt 21.61%60% / 52 kW 16.75 lt 13.10 lt 21.79%70% / 61 kW 18.25 lt 14.75 lt 19.18%100% / 88 kW 26.00 lt 20.10 lt 22.69%
21.43%
Notes1. During the last test run at 100% load, the engine temperature was 2°C cooler with NAF-TECH2. At 100% load, the exhaust temperature was 427°C with NAF-TECH whereas the engine manufacturer specifies 545°C at full load. This was measured out of interest and as an after thought and not scientifically done.
Average Saving
Results
© 2010 Naf-Tech. All rights reserved.
Illustrated benefit for Green Holdings Operations
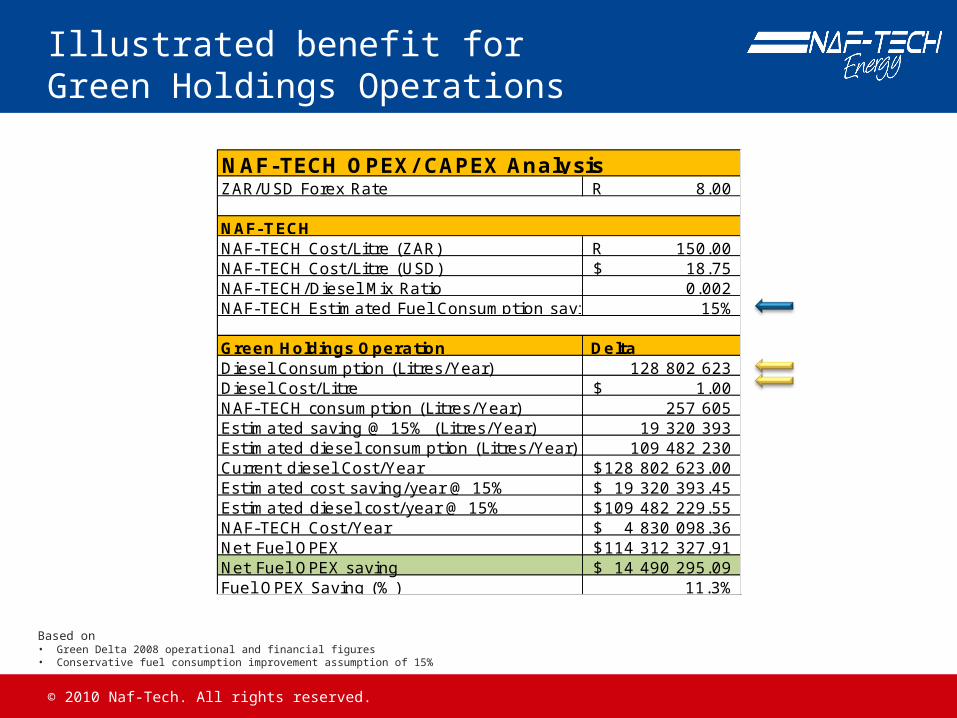
Based on• Green Delta 2008 operational and financial figures• Conservative fuel consumption improvement assumption of 15%
ZAR/USD Forex Rate 8.00R
NAF-TECH Cost/Litre (ZAR) 150.00R NAF-TECH Cost/Litre (USD) 18.75$ NAF-TECH/Diesel Mix Ratio 0.002 NAF-TECH Estimated Fuel Consumption saving 15%
Green Holdings Operation DeltaDiesel Consumption (Litres/Year) 128 802 623 Diesel Cost/Litre 1.00$ NAF-TECH consumption (Litres/Year) 257 605 Estimated saving @ 15% (Litres/Year) 19 320 393 Estimated diesel consumption (Litres/Year) 109 482 230 Current diesel Cost/Year 128 802 623.00$ Estimated cost saving/year @ 15% 19 320 393.45$ Estimated diesel cost/year @ 15% 109 482 229.55$ NAF-TECH Cost/Year 4 830 098.36$ Net Fuel OPEX 114 312 327.91$ Net Fuel OPEX saving 14 490 295.09$ Fuel OPEX Saving (%) 11.3%
NAF-TECH OPEX/ CAPEX Analysis
NAF-TECH

© 2010 Naf-Tech. All rights reserved.
Practical implications and logistics
NAF-TECH Application and deployment• Non-delivery does not affect generator availability• On-site application not practical due to logistics
Best solution is to introduce NAF-TECH in the Diesel supply chain• Local supplier(s) apply/mix NAF-TECH before delivery
• Logistically can still be challenging• Supplier can/will charge extra• NAF-TECH needs to be produced in country
• Import Diesel pre-mixed with NAF-TECH• Cost of NAF-TECH included in Diesel price• Precise control over mix ratio• International Diesel distributor already identified• Politically can be challenging
© 2010 Naf-Tech. All rights reserved.
Future Project Greener initiatives
With approval, its recommended to continue research and testing into
• Mechanical/Oil based products
• Other Fuel Additive products
• Determine/verify NAF-TECH long term and emission benefit claimsEmission claims can hold huge carbon credit implicationsEmission testing is very expensiveLong term benefits regarding maintenance and replacement

Q&A


