Page 1
Research Project for the NATCOM Phase II
( Funded by Ministry of environment and forests through Winrock International
India)
TITLE: Uncertainty reduction in methane and nitrous oxide emission from Indian livestock and inventory preparation
PROJECT LEADER: Madhu Mohini, PS. DCN Division
ASSOCIATES: K.K. Singhal, A.K. Tyagi, K.S.N. Prasad, Sr. Scientist, SRS, NDRI, Bangalore
DURATION: 2 YEARS ( Jan 08-Dec 09)
Page 2
OBJECTIVES:
1) To undertake region specific measurements
methane emissions due to enteric fermentation in
dairy cattle, different manure management
practices.
2) To estimate national methane and N2O
emission from livestock sector using SF6 Tech.
Page 3
Contribution of Livestock
1. Enteric Methane
2. Dung Methane
3. Dung Nitrous oxide
Page 4
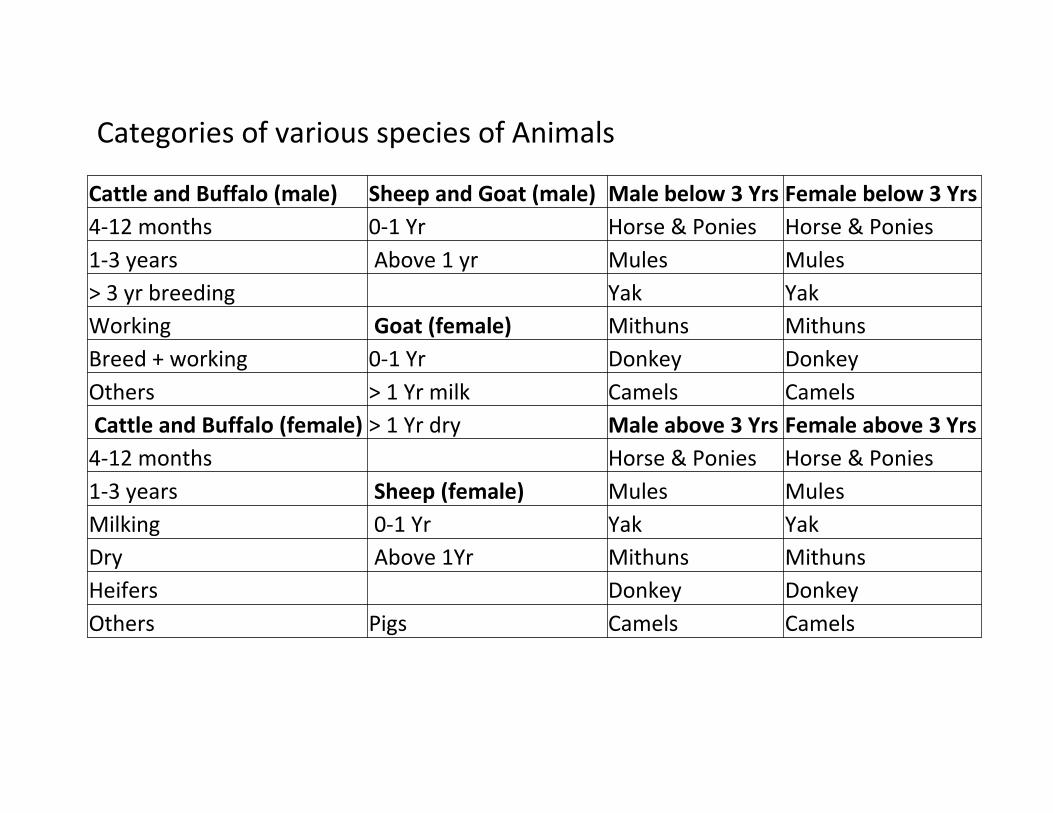
Cattle and Buffalo (male) Sheep and Goat (male) Male below 3 Yrs Female below 3 Yrs
4-12 months 0-1 Yr Horse & Ponies Horse & Ponies
1-3 years Above 1 yr Mules Mules
> 3 yr breeding Yak Yak
Working Goat (female) Mithuns Mithuns
Breed + working 0-1 Yr Donkey Donkey
Others > 1 Yr milk Camels Camels
Cattle and Buffalo (female) > 1 Yr dry Male above 3 Yrs Female above 3 Yrs
4-12 months Horse & Ponies Horse & Ponies
1-3 years Sheep (female) Mules Mules
Milking 0-1 Yr Yak Yak
Dry Above 1Yr Mithuns Mithuns
Heifers Donkey Donkey
Others Pigs Camels Camels
Categories of various species of Animals
Page 5
State Breed Adult Body Weight (kg) Birth Weight (kg)
Male Female Male Female
A.P. Ongole 570 425 28 26
Punganur 244 178 12.8 11.4
Bihar Bachaur 385 318 18-21 17-20
Gujrat Gir 544 310
Kankrej 343 24 23
Tharparkar 294.6 23.1 22.4
Haryana Hariana 499 325 23.34 21.73
Karnataka Amritmahal 500 318 20.8 19.9
Hallikar 340 227 21.3 20.2
Khillari 499 334 22 21.3
Kerala Red Sindhi 450 320 22.5 21.4
Vechur 178 132 11.2 10.2
Maharastra Dangi 363 310 18.4 17.5
Deoni 590 340 23.4 23.0
Gaolao 430 340 19.3 18.5
KrishanaVelly 550 325
Red Kandhari 430 340 20.4 18.7
M.P. Gaolao 430 340 19.3 18.5
Malvi 499 340 21 19
Nimari 390 318 19.9 18.7
Orissa Motu 161 152 8.73 6.55
Binjharpuri 402.9 334 18.2 14.68
Ghumsuri 216
Sahiwal 540 327 22 20
Rajasthan Mewati 385 325 - -
Nagori 363 318 17.5 16.3
Rathi - 295 19.4 19.1
Sahiwal 540 327 22 20
Tharparkar - 295 23.1 22.4
Tamil Nadu Bargur 340 295 18.9 18.1
Kangayam 540 380 22 21
Umbeachery 385 325 - -
U.P. Kenkatha 350 300 19.2 18.9
Kherigarh 476 318 20.7 19.9
Ponwar 318 295 18.5 17.6
Tarai 270-370
W.B.& Sikkim Siri 454 363 21.2 19.9
Body weight and birth weight of different breeds of cattle found in Indian states
Nivsarkar et al. (2000)
Page 6
State Breed Adult Body Weight (kg) Birth Weight (kg)
Male Female Male Female
U.P. Bhadawari 475 425.7 27 25.2
Gujrat Mahasana 565.4 484.2 29.5 28.5
Surti 500 382.6 26.3 24.5
Haryana Murrah 567 516 31.7 30.0
Murrah 567 516 31.7 30.0
Nili-Ravi 567.454 35.1 34.5
Maharastra Pandarpuri - 416.0 28.0 25.6
Nagpuri 520 363.5 29.0 28.1
T.N. Toda 380 380 27.9 28.0
A.P. Godwari 520 452 - -
Paralakhemu
ndi
316.3 - - -
Orissa Manda 296 - - -
Sikamise 250 - 400 - - -
Swamp 316 360 - ---
Body weight and birth weight of different breeds of Indian buffaloes
Nivsarkar et al. (2000)
Page 7
Breed (State) Birth weight
(kg)
At 3
months
At 9 month At 1 year
Jamunapari (UP, MP) 3.75 8.95 14.32 17.78
Beetal (Haryana, Punjab, ) 3.03 9.49 16.96 20.21
Barbari (UP, MP, ) 1.76 6.04 12.21 15.38
Black Bengal ( regions) 1.10 4.53 9.27 11.20
Sirohi (Raj, Gujrat) 3.11 13.47 22.38 25.64
Marwari (Raj, Gujrat) 2.80 12.23 21.75 25.15
Kutchi (Gujrat) 3.28 12.4 22.03 24.92
Jakhrana (Rajasthan)* - - 10.7 18.0
Sangamneri - - 10.1 17.3
Osmanabadi - - 9.83 -
Malabari (Keral, Karnataka)* 8.8 14.4
Ganjam (AP, Karnataka)* 9.5 11.7
Body weight and birth weight (kg) of different breeds of Indian goats.
Acharya (1992)
* Arora (1992)
Page 8
Age Male
crossbred
Male
indigenous
Male Male
Sheep
Male
Goat
0-1 year 2-3 1.8-2.0 1.8 3.0 3.0
1-3 years 2-3 1.8-2.0 1.8 3.0-4.0 3.0-4.0
Breeding 2-3 1.8-2.0 2.2
Breeding+
work
2-3 1.8- 2.5 2.2
Nothing 2.0 1.8 2
Age Female
crossbred
Female
indigenous
female Female
Sheep
Female
Goat
0-1 year 2.0-2.2 2.0 2.0 3.0 3.0
1-3 year 2.5-2.8 2.0 2.2 3.0-4.0 3.0-4.0
Milking 3.0 2.2 2.8
Dry 2.0 2.0 2.5
Heifers 2.0 2.0 2.5
other 1.8 1.8 2.0
Dry matter intake (kg/100 kg b. weight) in different categories of animals
Page 9
Animal category Type of feed CH4 g/kg
DMI
Reference
Cattle (Crossbred)
0-1 yr Conc + Wheat straw 14 –20 Debashish Dey (1998)
1 yr Paddy straw+ fodder 19.26 Srivastava & Garg (2002)
Paddy straw + fodder
+concentrate
18.40
1.5 yr Sahiwal Paddy straw + conc mix. 18.57
Paddy straw+ UMM block 16.02
1-3 yr Conc. + Wheat straw 19-20 Singh et al. (1998)
Holeisten Heifer Conc. + Hay 20.16 Shibata et al. (1992)
Holeisten Heifer Hay 23.98 Shibata et al. (1992)
Steers Conc:Roughage (97:3) 20.0 Horiguchi et al. (2000)
Lactating cows Conc.+ straw ad lib 16.04 Singh et al. (2001)
Lactating cows Conc.+ straw + UMMB 14.24 do
Lactating cows Conc.+ straw + fodder 19-21 Singh et al. (1999)
Lactating cows
(indigenous)
As in Gujrat villages 16.6 ATI (2000)
Exotic lactating Alfalfa + pasture 23.28 Mc Caughey (1999)
Exotic cows Alfalfa hay +silage. 20.85 Shibata et al. (1993)
Methane Emission Factors reported by various workers
Page 10
Buffaloes
0-1 yr Green fodder + conc. 9-11 Mohini et al (unpublis.)
1-1.5 yr Male Jowar fodder + conc. 10.06 Mohini & Singh (2001)
1-1.5 yr Female do 9.25 do
Female calves Maize fodder + conc. 15.97 Mohini & Singh (2001)
Male calves Maize fodder + conc. 18.34 -do-
2 yr Male Conc:Roughage 60:40 14.14 Saraswat et al (2001)
1- 3 yr Conc.+ Wheat straw 10-16 Barman et al. (2001)
Lactating As in villages in Gujrat 18.0 ATI (2000)
Goats Conc :Roughage 30:70* 28.79 Datta et al (2001)
Hay+ conc. 19.24 Shibata et al. ( 1992)
Oat hay** 22.0 Khan et al.(1986)
Oat hay + conc mix I** 24.0 Do-
Oat hay + conc Mix II** 22.0 D0-
Adult Sheep Hay + conc. 18.39 Shibata et al. ( 1992)
Sheep High roughage diet 13.04 Singh and Leng (1989)
Adult sheep Conc:Roughage 80:20 8.63 Horiguchi et al (2000)
Adult sheep High roughage diet 12.76 Haque and Bhar (2001)
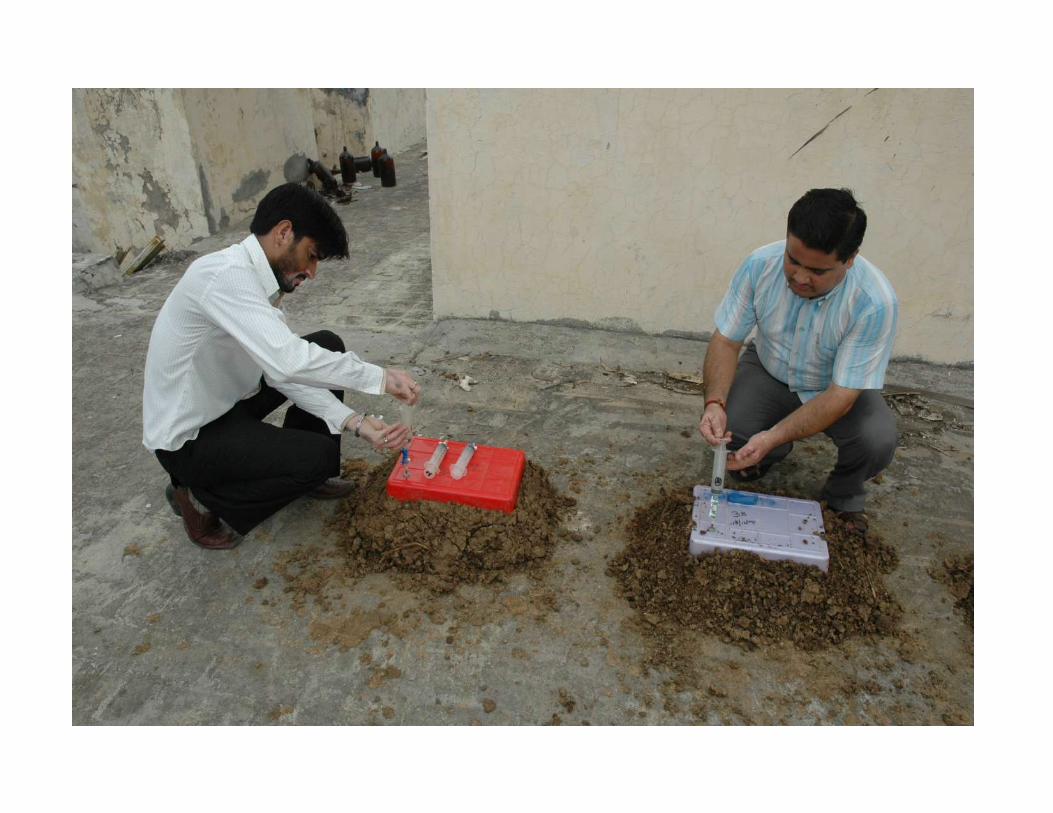
Page 11
Methods for collection of gas from animals
• Use of Douglas bags
• Use of close chamber
• Use of open circuit chamber
• Use of SF6 tracer technique
Page 12
Experiment on cattle:
• Tharparkar, Sahiwal ( Karnal)
• Deoni ( Bangalore)
• Fed Conc. Mix. And Green fodder as
per their requirements
• Experiment on buffaloes ( Murrah and
Bhadwari) were carried out at NDRI,
Karnal and IGFRI, Jhansi
• Some trials on goats were also carried
out at NDRI, Karnal
Page 15
Bhadwari Buffalo
Murrah Buffalo
Page 23
Population DMI EM Milk
C.B 6 10 8 8 9 9 16
IND 31 54 40 44 39 41 24
Buffalo 21 36 43 47 46 49 55
Goat 26 4 3 5
Contribution Comparison (%)
Page 24
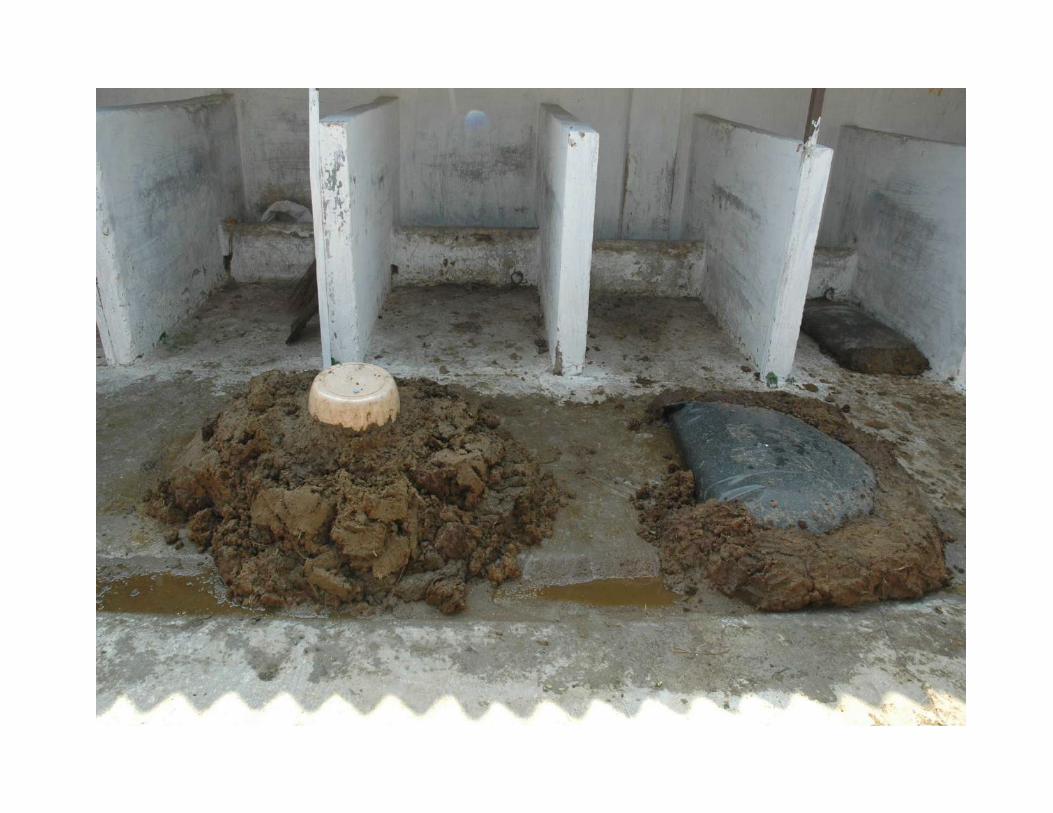
Dung management
Dung cake
Deposition in Pasture
Stored as heap
Page 31
Methane Emission from Dung
Methods Tried
1. Packed in Sheet.
2. Packed in Polybags.
3. Tray was kept on heap of various heights.
4. Kept in heap, daily sample was kept in bottles.
Page 37
Table 1. Methane Emission from Dung
PARAMETERS HEIGHT DAY 1
GAS
RANGE
(%)
MAXIMUM
AVERAGE
(%)
DAY CRACKS
Opened
Daily
15 cm 0.012 0.03-
2.78
2.18 5th 10th
30 cm 0.015 0.8 –
8.55
6.52 5th 6th
45 cm 0.015 0.18-
1.05
0.14 3rd 2nd
Close 15 cm 0.012 0.37-
3.7
3.4 4th -
30 cm - 0.03-
0.86
0.86 2nd 3rd
45 cm The heap got disturbed so the sample could not
be taken.
Page 45
Population DMI
Enteric
Methane Dung
Dung
Methane
Nitrous
Oxide
Total
Methane CO2
eq
(Million)
(Million
Ton) (Tg)
(Million
Ton) (Gg) (Gg) (Tg) (x100000)
Crossbred Cattle 30.32 46.57 0.90 21.64 10.86 0.01 0.90 427.60
Indigenous Cattle 144.08 241.89 4.05 112.47 49.24 0.03 4.05 1926.58
Buffalo 106.64 261.74 4.79 118.55 52.06 0.03 4.79 2281.67
Goat 126.02 24.35 0.29 9.74 4.04 0.00 0.29 139.15
Sheep 65.72 20.55 0.26 8.22 3.41 0.00 0.26 124.87
Horse & Ponies 0.68 0.74 0.01 0.37 0.15 0.00 0.01 3.51
Mules 0.14 0.14 0.00 0.07 0.03 0.00 0.00 0.64
Yak 0.07 0.17 0.00 0.07 0.03 0.00 0.00 0.81
Donkey 0.48 0.52 0.01 0.26 0.11 0.00 0.01 2.49
Camels 0.44 1.01 0.02 0.50 0.21 0.00 0.02 9.61
Pig 13.75 7.15 0.03 3.57 4.45 0.00 0.03 13.96
Mithuns 0.44 0.73 0.01 0.37 0.15 0.00 0.01 6.30
G. Total 488.77 605.56 10.37 275.84 115.71 0.08 10.37 4937.18
Green House gases from livestock as per 2007 data
Page 46
Species Methane
( Gg)
Nitrous oxide (kg) Nitrous oxide
(kg)(NDRI
factor)
Cross bred cattle 9.72 5404.88 956.38
Indigenous cattle 50.88 32879.46 5802.26
Buffalo 49.42 31550.28 5567.70
Pig 4.29 974.21 171.92
Others 0.76 519.26 91.63
Total 115.08 71328.08 12589.89
GHGs from Manure as per 2007 census
These values seems to be very low as compared to other estimates. Values based
on IPCC default values goes in Tg . However based on literature values for
emission of methane it comes to the values mentioned above. N2O values are
calculated on the bases of default values of IPCC (N 1.7 % , N2O 2 %). However
, many uncertainties are still there.(as per NDRI estimate N content and N2O were
taken as 0.3% and 2%
Page 47
Uncertainties still Left
• Feeding of animals kept in rural or urban surroundings is quite different. Hence, the population as well as factors should be further classified.
• There are only rough estimates for the figures for management of dung. Hence, this part requires to be strengthened.
• Methane emission from dung stored as heap still requires to be standardized.
Page 49
Parameter
Population X 105 DMI (million ton) Methane X 106 g
1992 1997 2003 1992 1997 2003 1992 1997 2003
Crossbred
Male 43.70 49.63 44.60 7.53 8.09 6.41 119629.88 144078.72 113408.24
Female 100.18 140.29 187.65 18.50 26.29 34.95 295987.06 512095.89 683552.03
Total 143.89 189.92 232.25 26.03 34.38 41.36 415616.93 656174.61 796960.26
Indigenous
Male 936.89 874.88 750.72 160.72 146.45 124.89 2571576.1 2500338.72 2118079.58
Female 879.50 841.36 784.98 138.95 133.64 126.03 2223337.0 2200192.88 2079071.61
Total 1816.3 1716.24 1535.7 299.67 280.09 250.92 4794913.1 4700531.60 4197151.19
Buffalo
Male 159.67 169.91 160.45 30.28 32.73 27.16 578341.17 529527.53 428438.83
Female 638.52 680.72 762.14 182.71 195.52 219.58 3171715.1 3628475.40 4080912.80
Total 798.19 850.63 922.58 212.99 228.25 246.74 3750056.3 4158002.93 4509351.63
Goat 1075.2 1120.31 1122.5 21.40 22.60 22.35 457645.02 271231.29 268187.02
Sheep 471.23 528.53 576.95 13.56 15.20 17.58 173053.68 193936.35 224370.41
Horse &
Ponies 7.66 6.61 6.01 1.51 0.87 0.79 13779.38 8691.43 7894.51
Mules 1.93 2.21 1.75 0.19 0.22 0.17 1761.13 2019.48 1597.00
Yak 0.58 0.44 0.29 0.12 0.09 0.06 2438.20 921.99 624.88
Donkey 9.67 8.82 6.50 0.95 0.87 0.64 23824.46 8695.07 6405.75
Camels 10.32 9.12 6.32 2.26 2.00 1.38 70062.48 39960.67 27681.60
Pigs 121.75 132.91 135.18 6.22 6.79 6.91 18219.89 27846.93 28321.56
Mithuns 1.54 2.16 2.74 0.38 0.52 0.65 7665.00 9362.25 11615.76
G. TOTAL 4458.4 4567.92 4548.8 585.28 591.88 589.56 9729035.6 10077374.6 10080161.5