55
Project No. NM08MSC-01 FUTURE DESIGN OF PERPETUAL PAVEMENTS FOR NEW MEXICO Project Progress Report December 29, 2009

Project No. NM08MSC-01
FUTURE DESIGN OF PERPETUAL PAVEMENTS FOR NEW MEXICO
Project Progress ReportDecember 29, 2009
What is a Perpetual Pavement?• Defined as an asphalt pavement designed and built to
last longer than 50 years without requiring major structural reconstruction
• Requires only periodic surface renewal in response to distresses confined to the top layers of the pavement
• Comprising of a three-layered asphalt pavement including a wear-resistant and renewable top layer, a rut-resistant and durable intermediate layer, and a fatigue-resistant and durable base layer
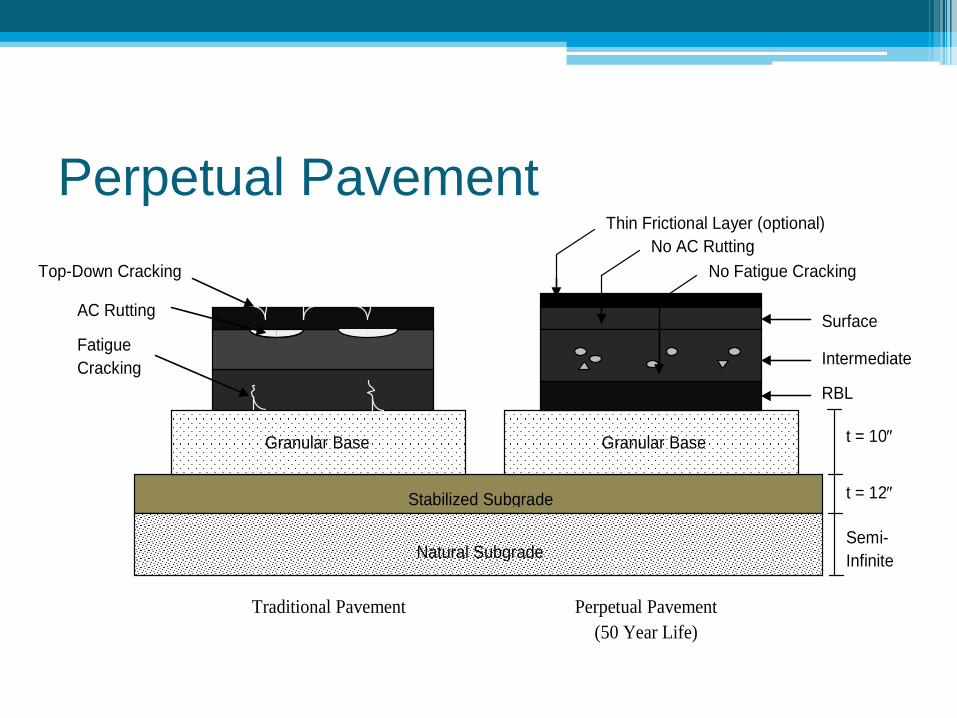
Thin Frictional Layer (optional)
No AC Rutting
Top-Down Cracking
AC Rutting
No Fatigue Cracking
Fatigue Cracking
RBL
t = 10″ Granular Base
Granular Base
t = 12″ Stabilized Subgrade
Semi-Infinite Natural Subgrade
Perpetual Pavement
(50 Year Life)
Traditional Pavement
Intermediate
Surface
Perpetual Pavement

Why Perpetual Pavements?• Asphalt pavements are designed for a 20-year life,
whereas perpetual pavements are expected to perform for 50 years
• Potential fatigue cracking is reduced, and pavement distress is typically confined to the upper layer of the structure
• They are an appealing alternative to concrete pavements where rehabilitation costs and closures to traffic will be minimized
Study Objective• Provide guidance for future designs of perpetual
pavements in New Mexico through the analysis of material properties to prevent deformation and cracking and otherwise produce high performance, long lasting pavements

Study Tasks• Literature review on current practices of perpetual
pavement design• Determine HMA layer stiffness (E*) reduction due to
moisture infiltration• Determine the optimal perpetual pavement structure
using the mechanistic-empirical design approach

Design Tool• AASHTO 2002 Mechanistic-
Empirical Pavement Design Guide (MEPDG)
• Mechanistic-empirical principles, where it assumes that pavement can be modeled as a multi-layered elastic structure
• Advantages include: ▫ Consideration of changing load types▫ Better utilization and characterization
of available materials▫ Improved performance predictions ▫ Accommodation of environmental and
aging effects on materials

Literature Review of Current Practices
• A comprehensive literature review of state DOT and foreign practices regarding design, testing and evaluation of perpetual pavements has been performed▫ Transportation Research Information Services (TRIS) ▫ Transportation Research Record (TRB) ▫ Roads and Bridges (TRIS) ▫ Better Roads (TRIS) ▫ Research In Progress (RIP)
Preliminary Findings from Lit. Review• 19 state DOTs have tested or implemented perpetual
pavements on their highways with about 40 perpetual pavement sections in operation today
• Australia, China, Israel, and the United Kingdom have also implemented perpetual pavements on their highways
• HMA thicknesses range from 6 – 23″ • 11 out of 19 state DOTs use a RBL • 10 out of 19 state DOTs use a FEL in their designs.
70 µε is the most common limiting strain used
Preliminary Findings from Lit. Review
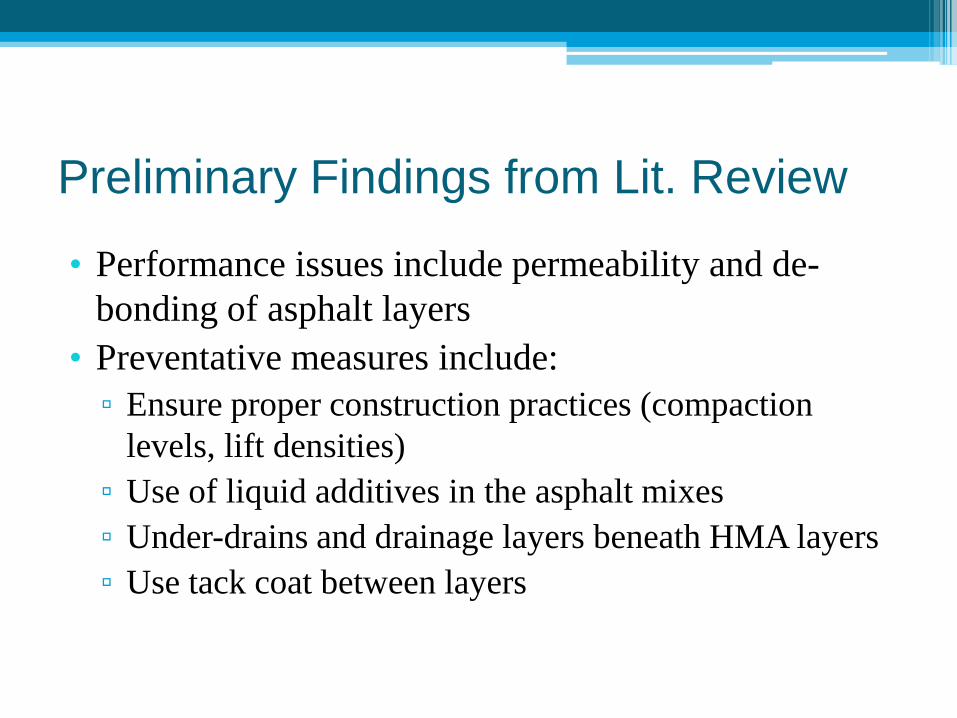
• Performance issues include permeability and de-bonding of asphalt layers
• Preventative measures include: ▫ Ensure proper construction practices (compaction
levels, lift densities)▫ Use of liquid additives in the asphalt mixes▫ Under-drains and drainage layers beneath HMA layers▫ Use tack coat between layers
Perpetual Pavement Design Methods
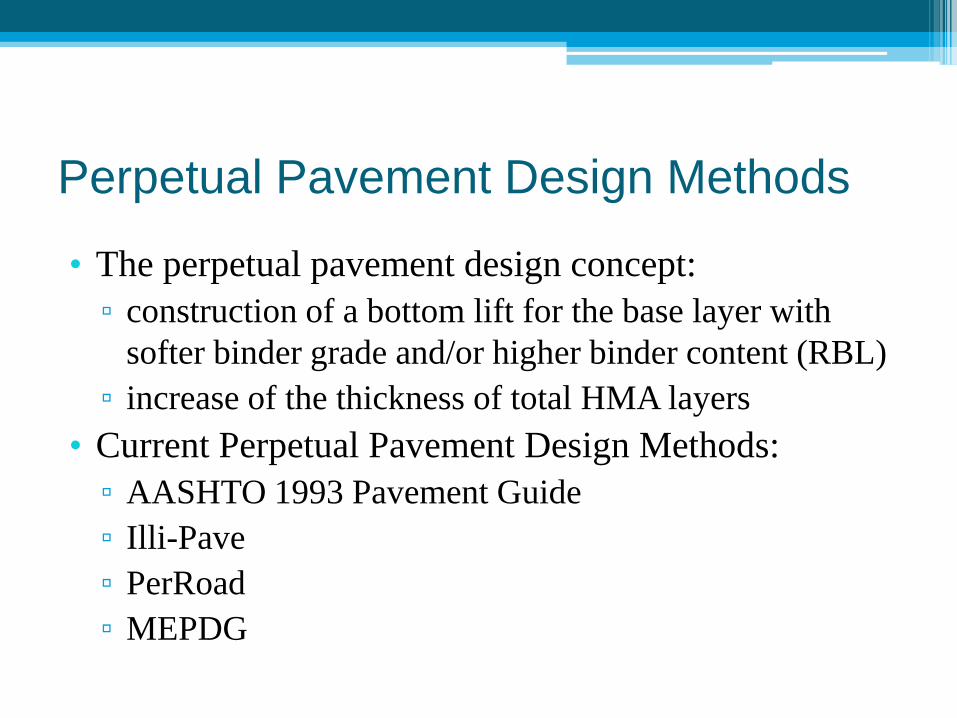
• The perpetual pavement design concept: ▫ construction of a bottom lift for the base layer with
softer binder grade and/or higher binder content (RBL)▫ increase of the thickness of total HMA layers
• Current Perpetual Pavement Design Methods:▫ AASHTO 1993 Pavement Guide▫ Illi-Pave▫ PerRoad▫ MEPDG
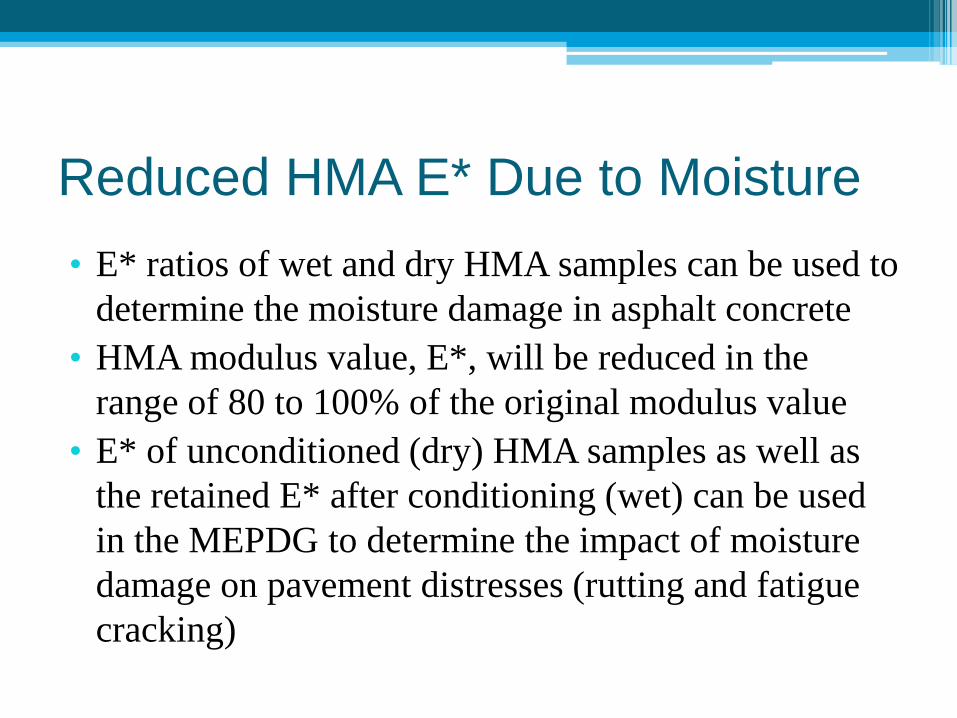
Reduced HMA E* Due to Moisture • E* ratios of wet and dry HMA samples can be used to
determine the moisture damage in asphalt concrete• HMA modulus value, E*, will be reduced in the
range of 80 to 100% of the original modulus value• E* of unconditioned (dry) HMA samples as well as
the retained E* after conditioning (wet) can be used in the MEPDG to determine the impact of moisture damage on pavement distresses (rutting and fatigue cracking)

Example
Dynamic Modulus (E*) = Stress (σ)/Strain(ε)
Moduli RatioStress Strain Modulus Stress Strain Modulus After/(KPa) (µe) (MPa) (KPa) (µe) (MPa) Before
25 539.8 93 5805 451.8 86 5227 0.9010 429.4 94 4578 428.0 106 4053 0.895 351.1 94 3734 342.4 107 3190 0.852 283.7 104 2727 233.6 106 2205 0.811 211.0 104 2030 173.0 107 1619 0.80
Test Freq,
Hz
After ConditioningBefore Conditioning
6.0
HMA Sample
79SP-III
Air Voids,
%
Deg of Sat. %
Optimal Perpetual Pavement Structure
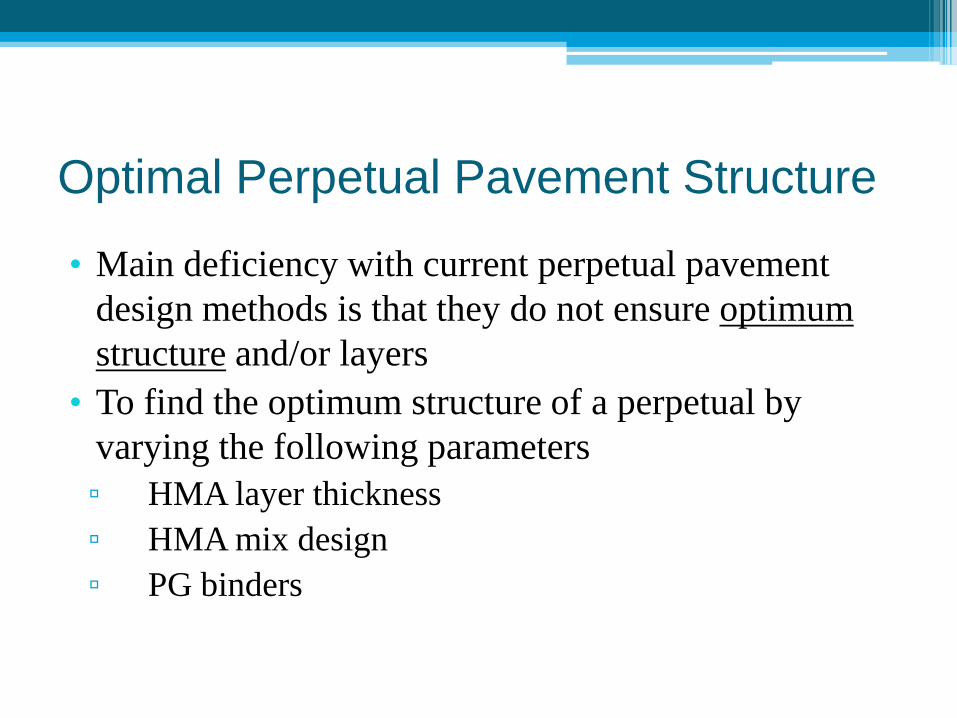
• Main deficiency with current perpetual pavement design methods is that they do not ensure optimum structure and/or layers
• To find the optimum structure of a perpetual by varying the following parameters ▫ HMA layer thickness▫ HMA mix design▫ PG binders

Layer TypeLayer
Thickness (in)Mix
Design PG Binder
Surface, T1
1.5 2 3
SP-III SP-IV
76-22 70-22
Intermediate, T2
10.5 8 5
SP-II SP-III SP-IV
76-22 70-22
Rich Binder Layer (RBL), T3
3 5 7
SP-II SP-III SP-IV
64-22
Granular Base 6 10
A-5 NA
Treated Subgrade
12 A-5 NA
Test Matrix
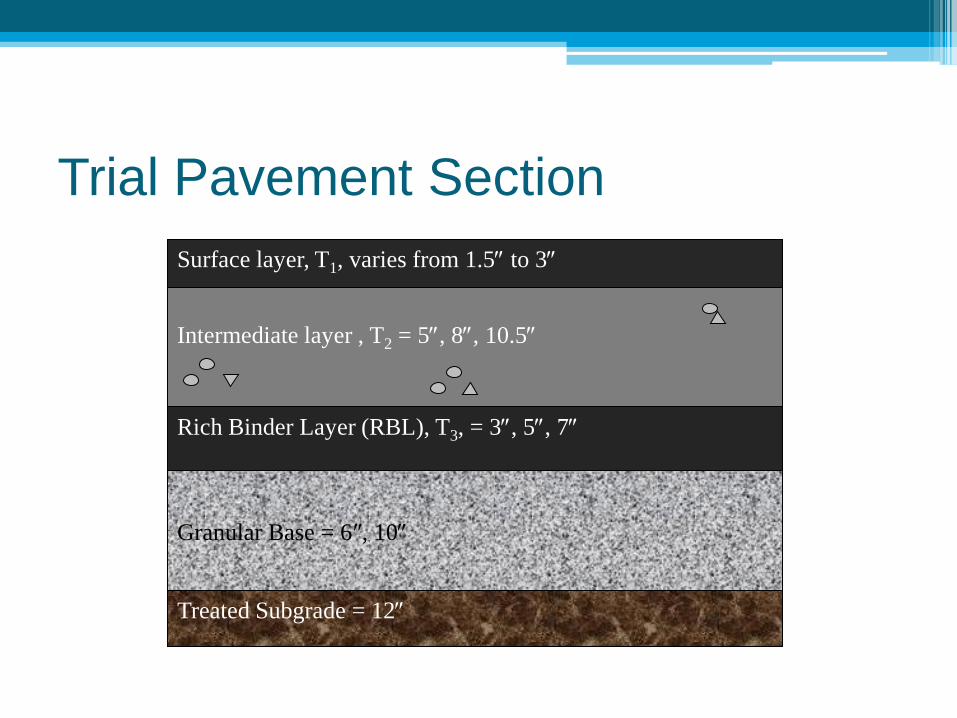
Trial Pavement Section
Treated Subgrade = 12″
Granular Base = 6″, 10″
Rich Binder Layer (RBL), T3, = 3″, 5″, 7″
Intermediate layer , T2 = 5″, 8″, 10.5″
Surface layer, T1, varies from 1.5″ to 3″
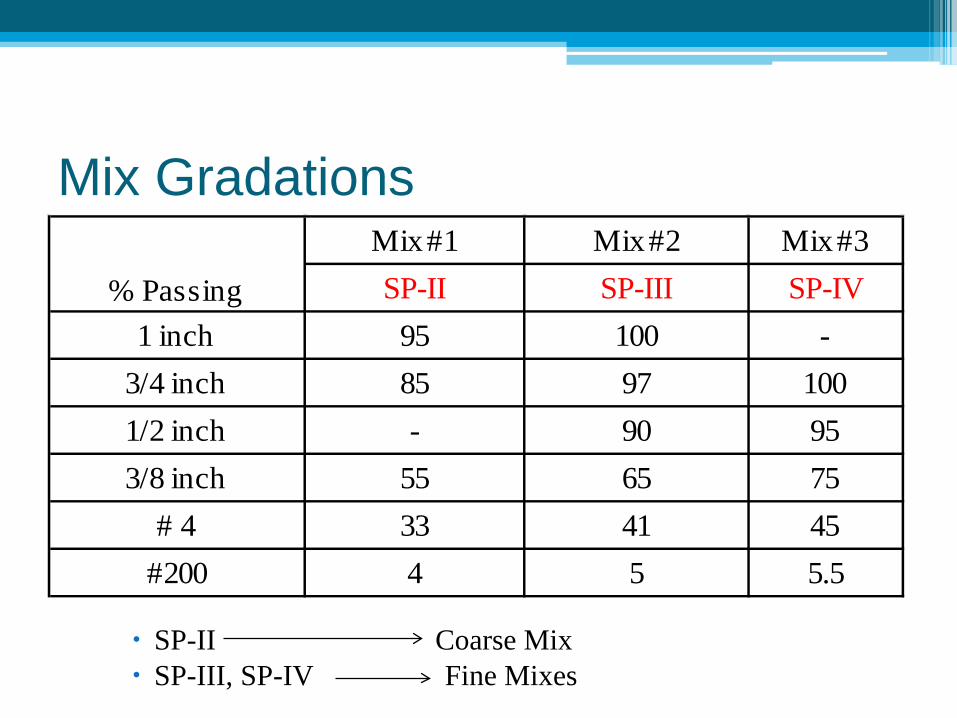
Mix Gradations
SP-II Coarse Mix SP-III, SP-IV Fine Mixes
Mix #1 Mix #2 Mix #3SP-II SP-III SP-IV
1 inch 95 100 -3/4 inch 85 97 1001/2 inch - 90 953/8 inch 55 65 75
# 4 33 41 45#200 4 5 5.5
% Passing
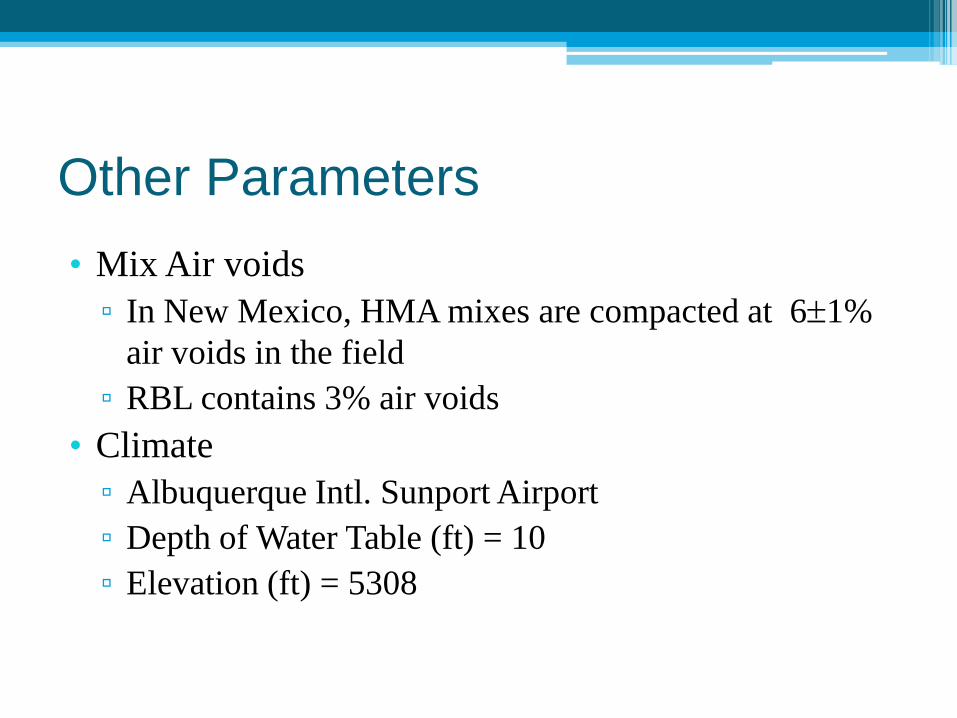
Other Parameters• Mix Air voids ▫ In New Mexico, HMA mixes are compacted at 6±1%
air voids in the field▫ RBL contains 3% air voids
• Climate▫ Albuquerque Intl. Sunport Airport▫ Depth of Water Table (ft) = 10▫ Elevation (ft) = 5308

Traffic Parameters• Traffic – Annual Average Daily Truck Traffic
(AADTT) is varied from 1750, to 5000 and 10,000 ▫ Truck Traffic Classification (TTC) Factor = 1 (mostly
single-trailer trucks)▫ Traffic Growth (compound) = 4%▫ All other input data is set to default values (level 3)

Granular Base Material• Crushed Gravel▫ Modulus (psi) = 20000▫ Compacted Layer = Yes▫ Default values are used for all
other inputs (level 3)
Sieve SizePercent Passing
1″ 1003/4″ 80 - 100# 4 30 - 60# 10 20 - 45# 200 3 - 10
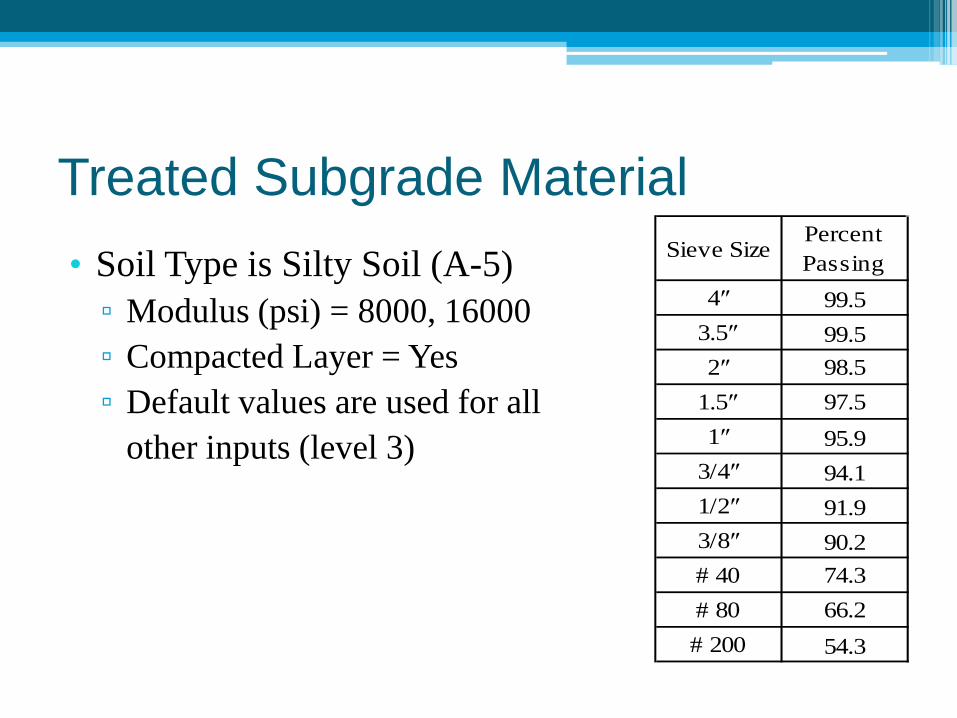
Treated Subgrade Material• Soil Type is Silty Soil (A-5)▫ Modulus (psi) = 8000, 16000▫ Compacted Layer = Yes▫ Default values are used for all
other inputs (level 3)
Sieve SizePercent Passing
4″ 99.53.5″ 99.52″ 98.5
1.5″ 97.51″ 95.9
3/4″ 94.11/2″ 91.93/8″ 90.2# 40 74.3# 80 66.2# 200 54.3

Natural Subgrade Material• Soil Type is Silty Soil (A-5)▫ Modulus (psi) = 5000▫ Compacted Layer = No▫ Default values are used for all
other inputs (level 3)
Sieve SizePercent Passing
4″ 99.53.5″ 99.52″ 98.5
1.5″ 97.51″ 95.9
3/4″ 94.11/2″ 91.93/8″ 90.2# 40 74.3# 80 66.2# 200 54.3
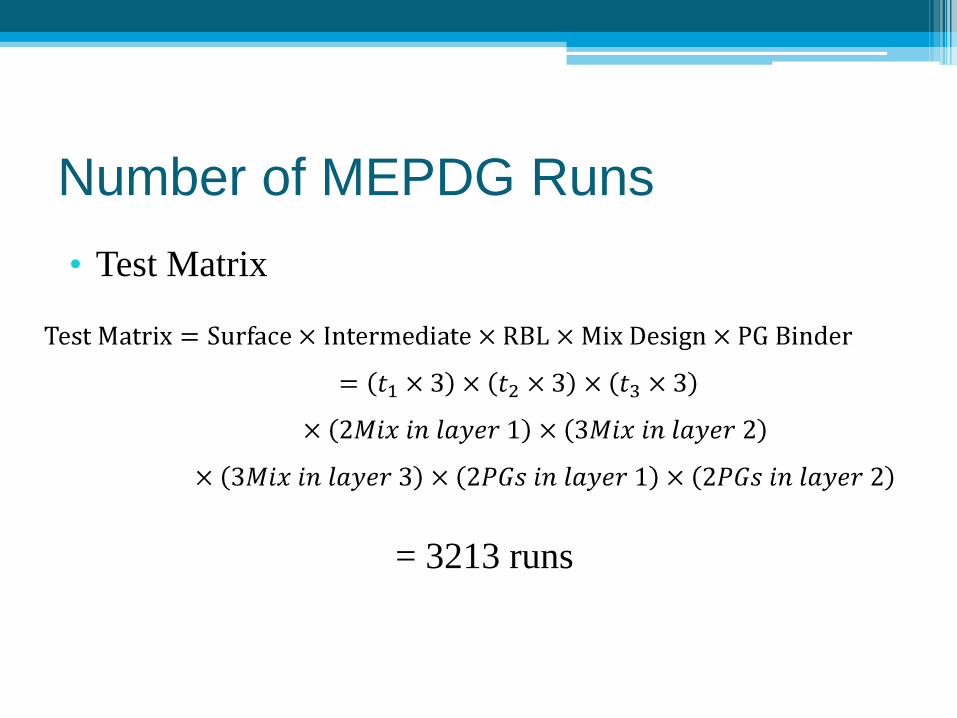
Number of MEPDG Runs• Test Matrix
= 3213 runs
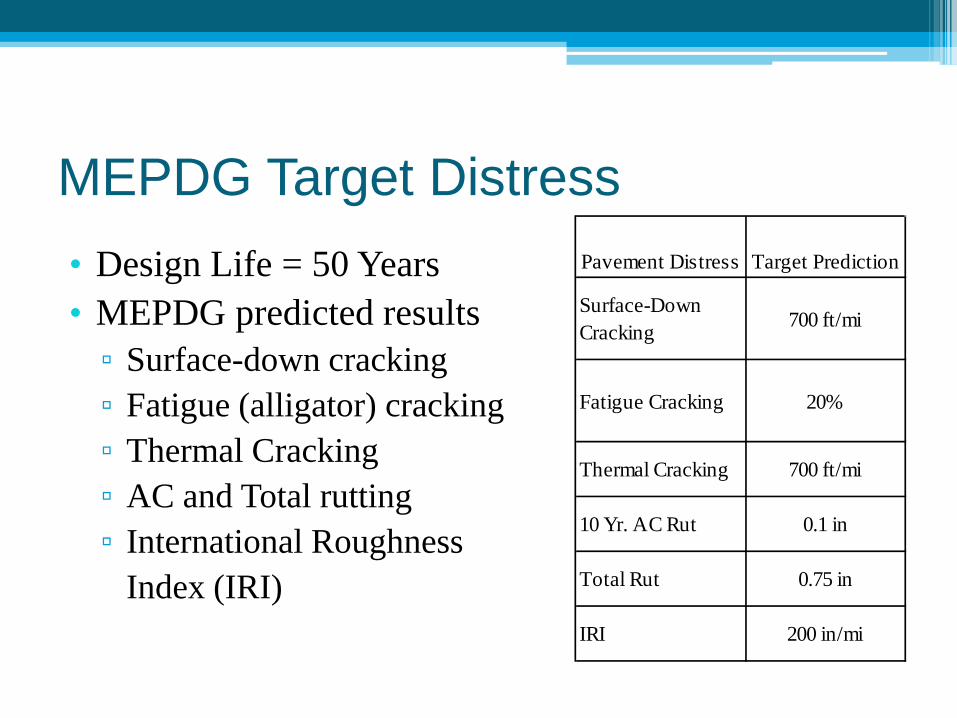
MEPDG Target Distress• Design Life = 50 Years• MEPDG predicted results ▫ Surface-down cracking ▫ Fatigue (alligator) cracking▫ Thermal Cracking ▫ AC and Total rutting ▫ International Roughness
Index (IRI)
Pavement Distress Target Prediction
Surface-Down Cracking 700 ft/mi
Fatigue Cracking 20%
Thermal Cracking 700 ft/mi
10 Yr. AC Rut 0.1 in
Total Rut 0.75 in
IRI 200 in/mi
Results – Flow Chartsa) Total Rut ≤ 0.75″ at the end of 50 Years (No Rehab)

(a) Total Rut ≤ 0.75″ at the end of 50 Years (No Rehab)
Start
1. Bottom-Up Fatigue Cracking Criteria
< 20% After 50 Yrs → Fail 8 PPs
↓ 3205 PPs Pass2. Top-Down Crack
Criteria< 700 ft/mi After 50 Yrs
↓ 3205 PPs Pass
3. Thermal Crack Criteria < 700 ft/mi After 50 Yrs
↓ 3205 PPs Pass4. Total Rut Criteria Total Rut ≤ 0.5″ After 50 Yrs → Fail 3205 PPs
↓ 0 PPs Pass
3213 PPs

Results – Flow Chartsb) AC Rut ≤ 0.5″ at the end of 50 Years (No Rehab)
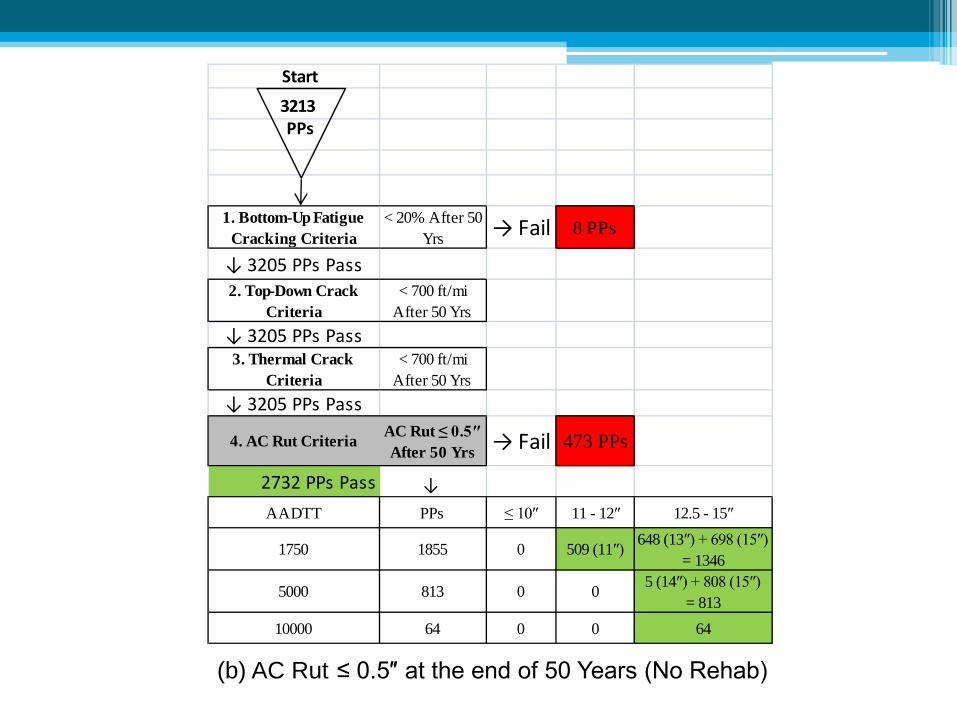
(b) AC Rut ≤ 0.5″ at the end of 50 Years (No Rehab)
Start
1. Bottom-Up Fatigue Cracking Criteria
< 20% After 50 Yrs → Fail 8 PPs
↓ 3205 PPs Pass2. Top-Down Crack
Criteria< 700 ft/mi
After 50 Yrs↓ 3205 PPs Pass3. Thermal Crack
Criteria< 700 ft/mi
After 50 Yrs↓ 3205 PPs Pass
4. AC Rut Criteria AC Rut ≤ 0.5″ After 50 Yrs → Fail 473 PPs
2732 PPs Pass ↓ AADTT PPs ≤ 10″ 11 - 12″ 12.5 - 15″
1750 1855 0 509 (11″) 648 (13″) + 698 (15″) = 1346
5000 813 0 0 5 (14″) + 808 (15″) = 813
10000 64 0 0 64
3213 PPs

Results – Flow Chartsc) AC Rut ≤ 0.25″ at the end of 50 Years
Rehab = AC1→0, AC2+AC3 ≤ 0.05″ after 10 Years
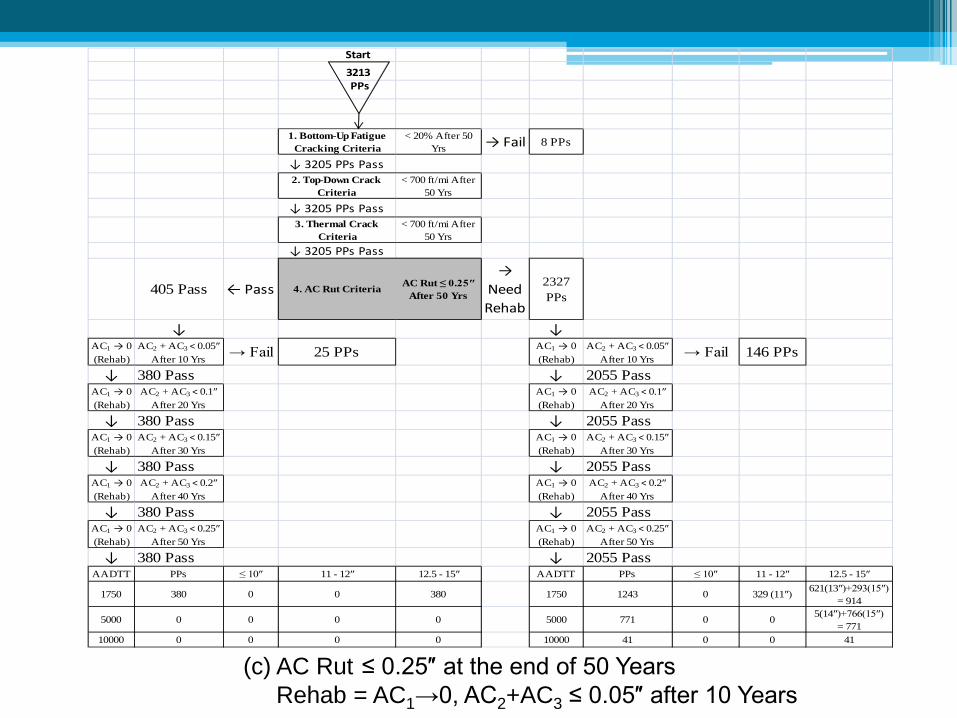
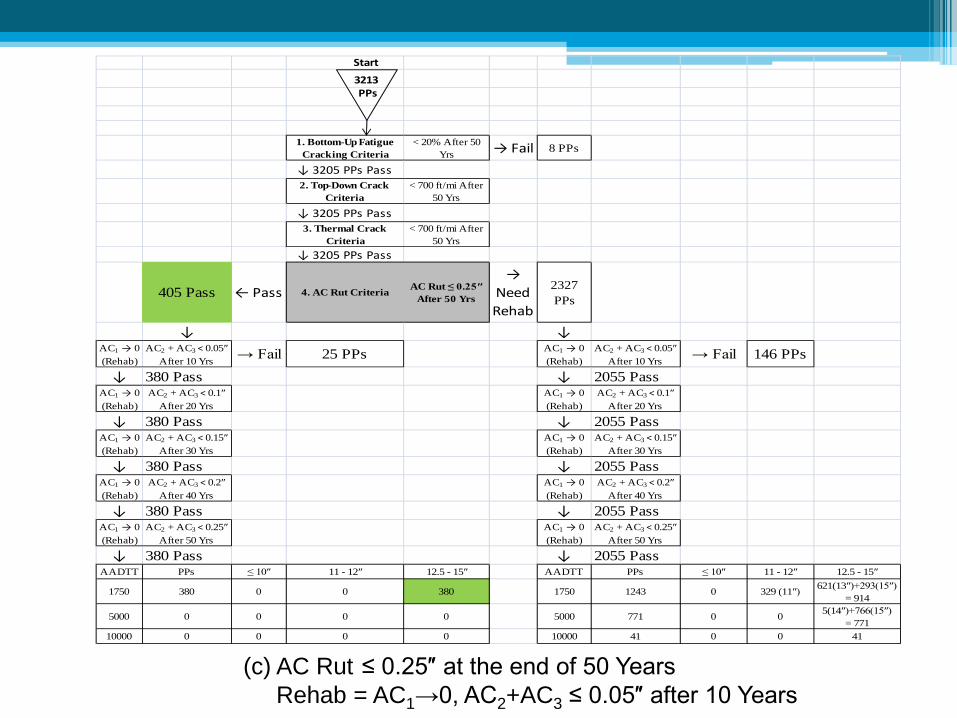
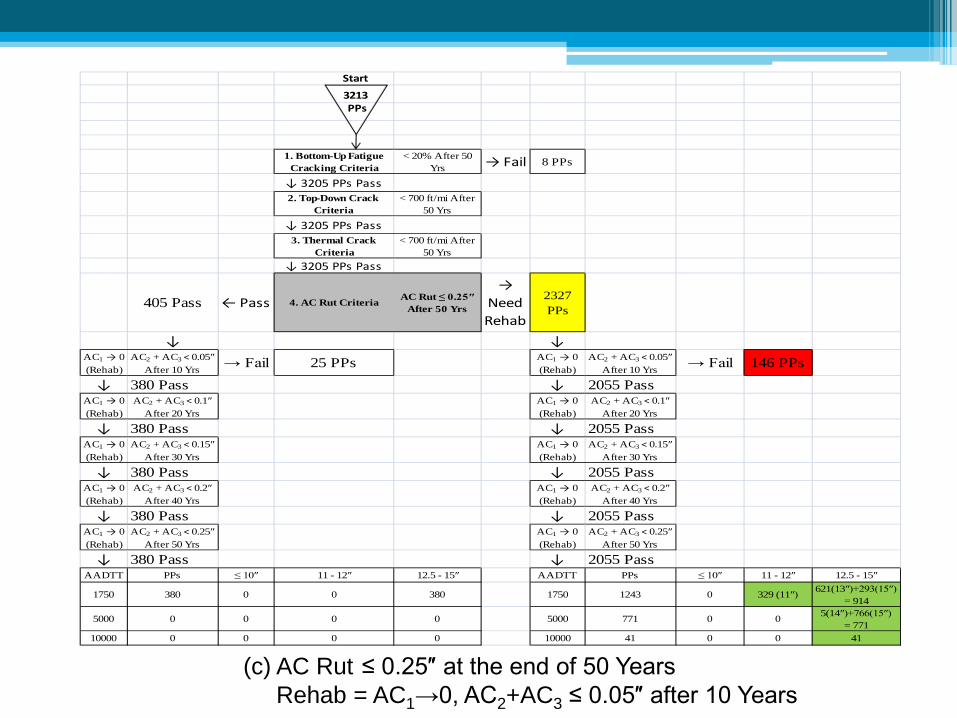
(c) AC Rut ≤ 0.25″ at the end of 50 Years Rehab = AC1→0, AC2+AC3 ≤ 0.05″ after 10 Years
Start
1. Bottom-Up Fatigue Cracking Criteria
< 20% After 50 Yrs → Fail 8 PPs
↓ 3205 PPs Pass2. Top-Down Crack
Criteria< 700 ft/mi After
50 Yrs
↓ 3205 PPs Pass3. Thermal Crack
Criteria< 700 ft/mi After
50 Yrs↓ 3205 PPs Pass
405 Pass ← Pass 4. AC Rut Criteria AC Rut ≤ 0.25″ After 50 Yrs
→ Need Rehab
2327 PPs
↓ ↓AC1 → 0 (Rehab)
AC2 + AC3 < 0.05″ After 10 Yrs → Fail 25 PPs AC1 → 0
(Rehab)AC2 + AC3 < 0.05″
After 10 Yrs → Fail 146 PPs↓ 380 Pass ↓ 2055 Pass
AC1 → 0 (Rehab)
AC2 + AC3 < 0.1″ After 20 Yrs
AC1 → 0 (Rehab)
AC2 + AC3 < 0.1″ After 20 Yrs
↓ 380 Pass ↓ 2055 PassAC1 → 0 (Rehab)
AC2 + AC3 < 0.15″ After 30 Yrs
AC1 → 0 (Rehab)
AC2 + AC3 < 0.15″ After 30 Yrs
↓ 380 Pass ↓ 2055 PassAC1 → 0 (Rehab)
AC2 + AC3 < 0.2″ After 40 Yrs
AC1 → 0 (Rehab)
AC2 + AC3 < 0.2″ After 40 Yrs
↓ 380 Pass ↓ 2055 PassAC1 → 0 (Rehab)
AC2 + AC3 < 0.25″ After 50 Yrs
AC1 → 0 (Rehab)
AC2 + AC3 < 0.25″ After 50 Yrs
↓ 380 Pass ↓ 2055 PassAADTT PPs ≤ 10″ 11 - 12″ 12.5 - 15″ AADTT PPs ≤ 10″ 11 - 12″ 12.5 - 15″
1750 380 0 0 380 1750 1243 0 329 (11″) 621(13″)+293(15″) = 914
5000 0 0 0 0 5000 771 0 0 5(14″)+766(15″) = 771
10000 0 0 0 0 10000 41 0 0 41
3213 PPs
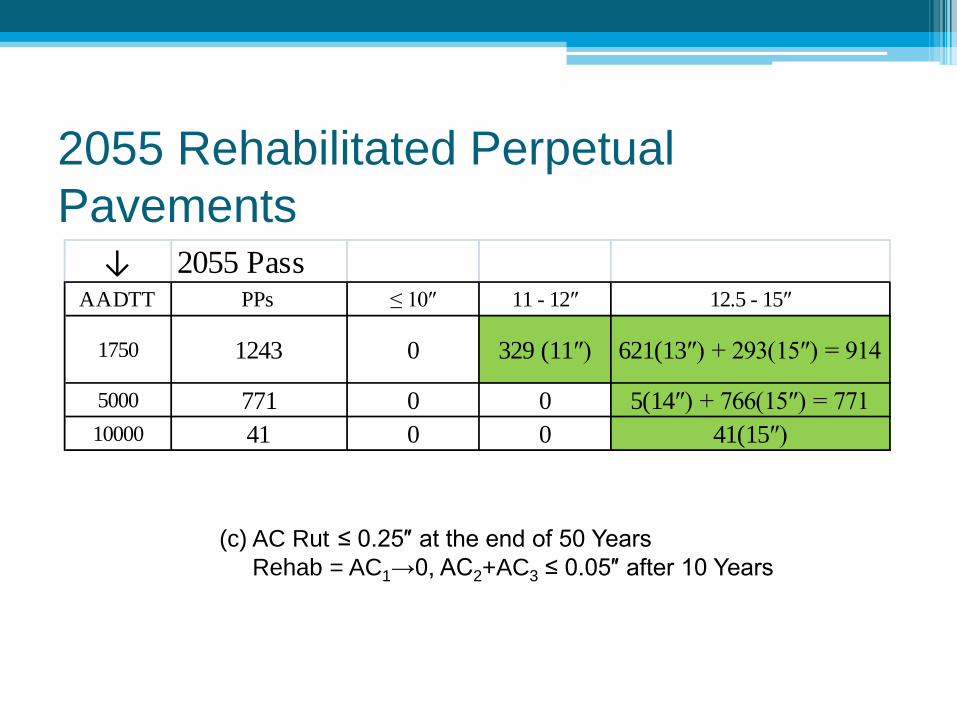
2055 Rehabilitated Perpetual Pavements
↓ 2055 PassAADTT PPs ≤ 10″ 11 - 12″ 12.5 - 15″
1750 1243 0 329 (11″) 621(13″) + 293(15″) = 914
5000 771 0 0 5(14″) + 766(15″) = 77110000 41 0 0 41(15″)
(c) AC Rut ≤ 0.25″ at the end of 50 Years Rehab = AC1→0, AC2+AC3 ≤ 0.05″ after 10 Years
Results – Flow Chartsd) AC Rut ≤ 0.5″ at the end of 50 Years
Rehab = AC1→0, AC2+AC3 ≤ 0.1″ after 10 Years
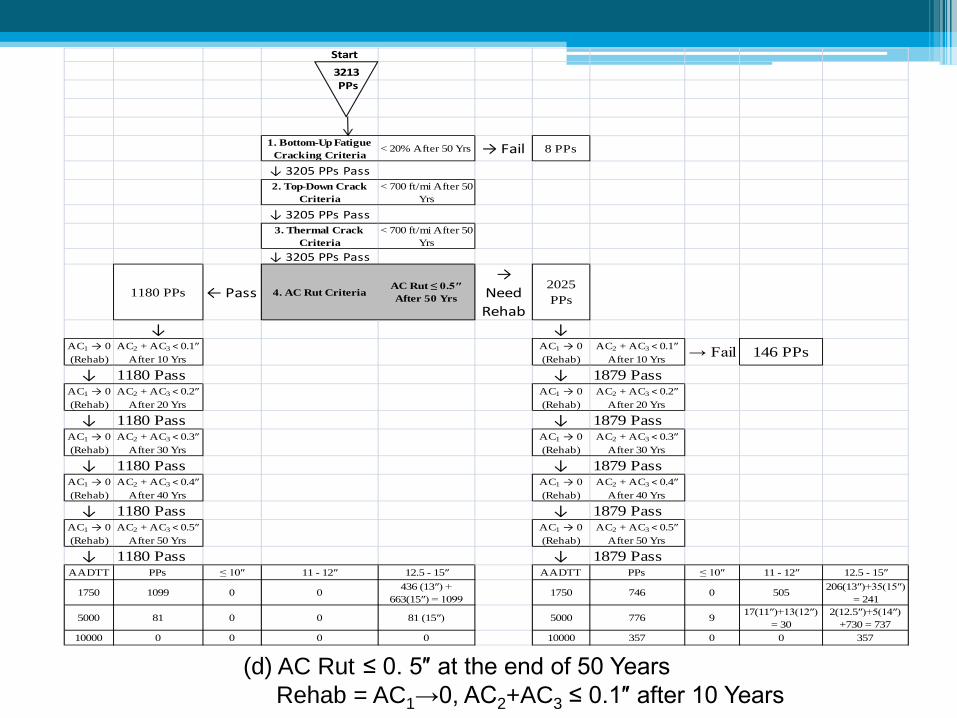
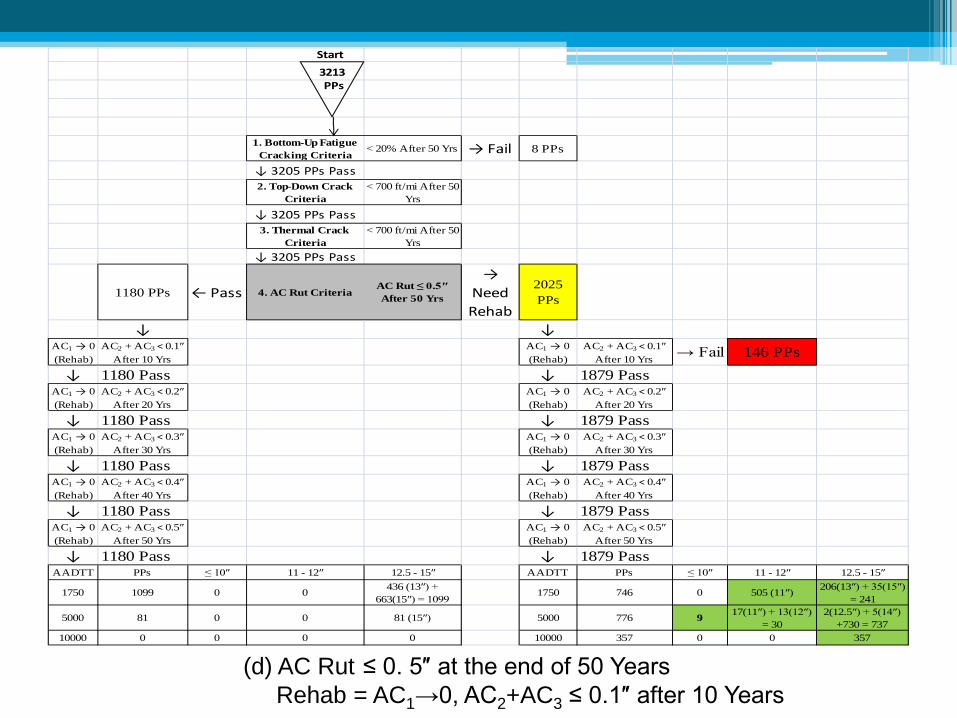
(d) AC Rut ≤ 0. 5″ at the end of 50 Years Rehab = AC1→0, AC2+AC3 ≤ 0.1″ after 10 Years
Start
1. Bottom-Up Fatigue Cracking Criteria
< 20% After 50 Yrs → Fail 8 PPs
↓ 3205 PPs Pass2. Top-Down Crack
Criteria< 700 ft/mi After 50
Yrs
↓ 3205 PPs Pass3. Thermal Crack
Criteria< 700 ft/mi After 50
Yrs↓ 3205 PPs Pass
1180 PPs ← Pass 4. AC Rut CriteriaAC Rut ≤ 0.5″ After 50 Yrs
→ Need Rehab
2025 PPs
↓ ↓AC1 → 0 (Rehab)
AC2 + AC3 < 0.1″ After 10 Yrs
AC1 → 0 (Rehab)
AC2 + AC3 < 0.1″ After 10 Yrs → Fail 146 PPs
↓ 1180 Pass ↓ 1879 PassAC1 → 0 (Rehab)
AC2 + AC3 < 0.2″ After 20 Yrs
AC1 → 0 (Rehab)
AC2 + AC3 < 0.2″ After 20 Yrs
↓ 1180 Pass ↓ 1879 PassAC1 → 0 (Rehab)
AC2 + AC3 < 0.3″ After 30 Yrs
AC1 → 0 (Rehab)
AC2 + AC3 < 0.3″ After 30 Yrs
↓ 1180 Pass ↓ 1879 PassAC1 → 0 (Rehab)
AC2 + AC3 < 0.4″ After 40 Yrs
AC1 → 0 (Rehab)
AC2 + AC3 < 0.4″ After 40 Yrs
↓ 1180 Pass ↓ 1879 PassAC1 → 0 (Rehab)
AC2 + AC3 < 0.5″ After 50 Yrs
AC1 → 0 (Rehab)
AC2 + AC3 < 0.5″ After 50 Yrs
↓ 1180 Pass ↓ 1879 PassAADTT PPs ≤ 10″ 11 - 12″ 12.5 - 15″ AADTT PPs ≤ 10″ 11 - 12″ 12.5 - 15″
1750 1099 0 0 436 (13″) + 663(15″) = 1099
1750 746 0 505 206(13″)+35(15″) = 241
5000 81 0 0 81 (15″) 5000 776 9 17(11″)+13(12″) = 30
2(12.5″)+5(14″) +730 = 737
10000 0 0 0 0 10000 357 0 0 357
3213 PPs
(d) AC Rut ≤ 0. 5″ at the end of 50 Years Rehab = AC1→0, AC2+AC3 ≤ 0.1″ after 10 Years
Start
1. Bottom-Up Fatigue Cracking Criteria
< 20% After 50 Yrs → Fail 8 PPs
↓ 3205 PPs Pass2. Top-Down Crack
Criteria< 700 ft/mi After 50
Yrs
↓ 3205 PPs Pass3. Thermal Crack
Criteria< 700 ft/mi After 50
Yrs↓ 3205 PPs Pass
1180 PPs ← Pass 4. AC Rut CriteriaAC Rut ≤ 0.5″ After 50 Yrs
→ Need Rehab
2025 PPs
↓ ↓AC1 → 0 (Rehab)
AC2 + AC3 < 0.1″ After 10 Yrs
AC1 → 0 (Rehab)
AC2 + AC3 < 0.1″ After 10 Yrs → Fail 146 PPs
↓ 1180 Pass ↓ 1879 PassAC1 → 0 (Rehab)
AC2 + AC3 < 0.2″ After 20 Yrs
AC1 → 0 (Rehab)
AC2 + AC3 < 0.2″ After 20 Yrs
↓ 1180 Pass ↓ 1879 PassAC1 → 0 (Rehab)
AC2 + AC3 < 0.3″ After 30 Yrs
AC1 → 0 (Rehab)
AC2 + AC3 < 0.3″ After 30 Yrs
↓ 1180 Pass ↓ 1879 PassAC1 → 0 (Rehab)
AC2 + AC3 < 0.4″ After 40 Yrs
AC1 → 0 (Rehab)
AC2 + AC3 < 0.4″ After 40 Yrs
↓ 1180 Pass ↓ 1879 PassAC1 → 0 (Rehab)
AC2 + AC3 < 0.5″ After 50 Yrs
AC1 → 0 (Rehab)
AC2 + AC3 < 0.5″ After 50 Yrs
↓ 1180 Pass ↓ 1879 PassAADTT PPs ≤ 10″ 11 - 12″ 12.5 - 15″ AADTT PPs ≤ 10″ 11 - 12″ 12.5 - 15″
1750 1099 0 0 436 (13″) + 663(15″) = 1099
1750 746 0 505 (11″) 206(13″) + 35(15″) = 241
5000 81 0 0 81 (15″) 5000 776 9 17(11″) + 13(12″) = 30
2(12.5″) + 5(14″) +730 = 737
10000 0 0 0 0 10000 357 0 0 357
3213 PPs

1879 Rehabilitated Perpetual Pavements
(d) AC Rut ≤ 0. 5″ at the end of 50 Years Rehab = AC1→0, AC2+AC3 ≤ 0.1″ after 10 Years
↓ 1879 PassAADTT PPs ≤ 10″ 11 - 12″ 12.5 - 15″
1750 746 0 505 (11″) 206(13″) + 35(15″) = 241
5000 776 917(11″) + 13(12″)
= 302(12.5″) + 5(14″) + 730(15″)
= 73710000 357 0 0 357(15″)

Flow Chart Analysis• Pavements carrying 1750 AADTT:▫ 509 pavements with 11″ AC thickness pass the AC Rut
≤0.5″ criterion without requiring rehabilitation for 50 years
▫ In addition, 329 pavements with 11″ AC thickness pass a stricter 10 year AC Rut criterion ≤0.05″ which includes rehab every 10 years
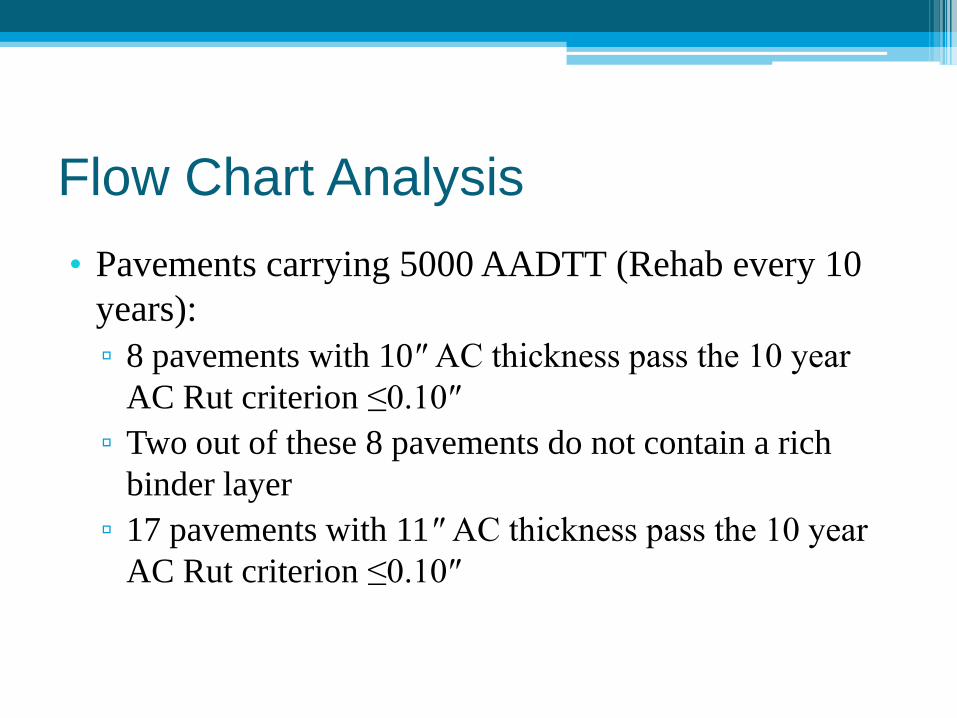
Flow Chart Analysis• Pavements carrying 5000 AADTT (Rehab every 10
years):▫ 8 pavements with 10″ AC thickness pass the 10 year
AC Rut criterion ≤0.10″▫ Two out of these 8 pavements do not contain a rich
binder layer▫ 17 pavements with 11″ AC thickness pass the 10 year
AC Rut criterion ≤0.10″
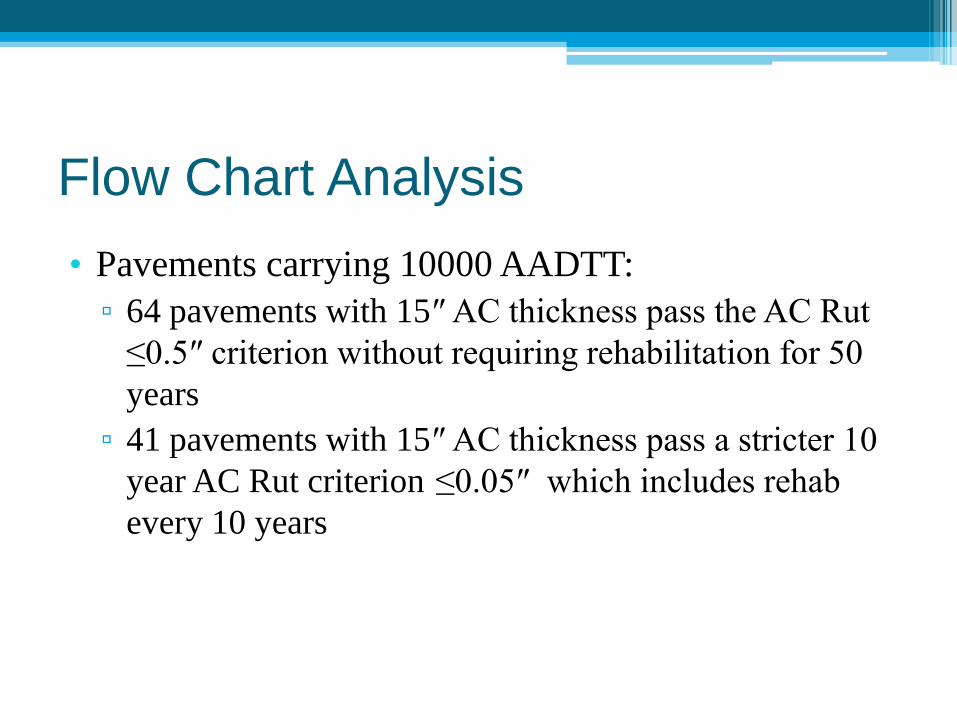
Flow Chart Analysis• Pavements carrying 10000 AADTT:▫ 64 pavements with 15″ AC thickness pass the AC Rut
≤0.5″ criterion without requiring rehabilitation for 50 years
▫ 41 pavements with 15″ AC thickness pass a stricter 10 year AC Rut criterion ≤0.05″ which includes rehab every 10 years
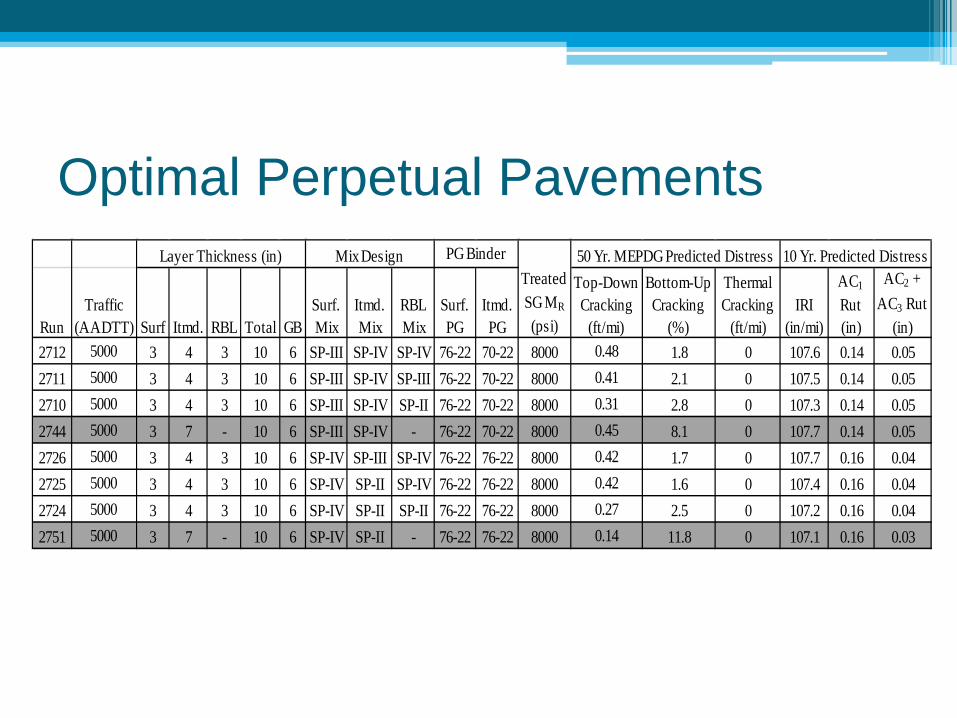
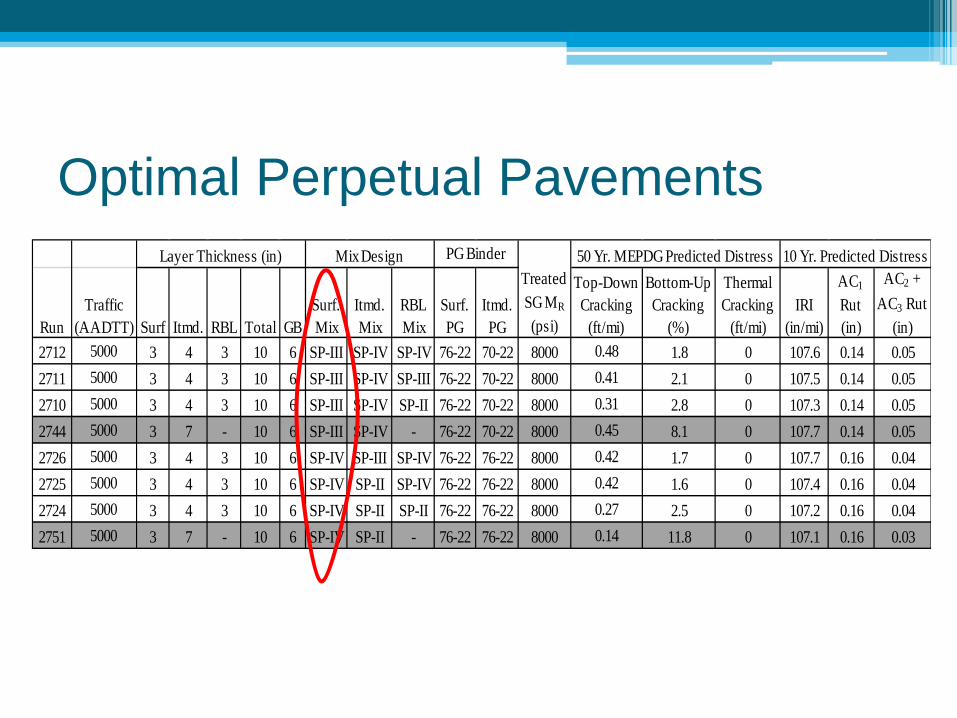
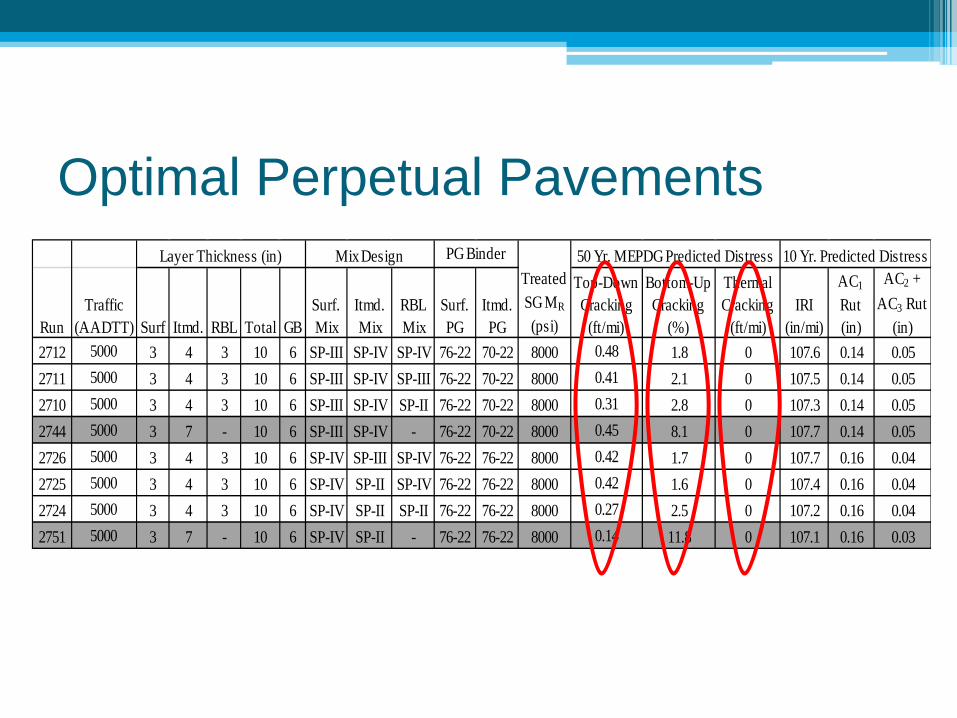
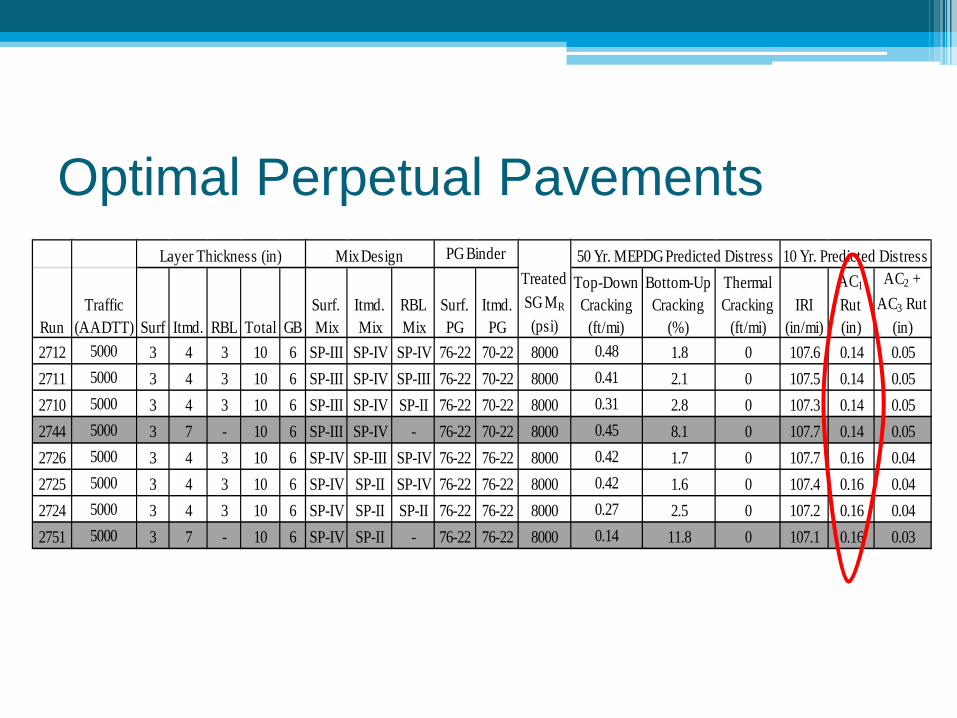
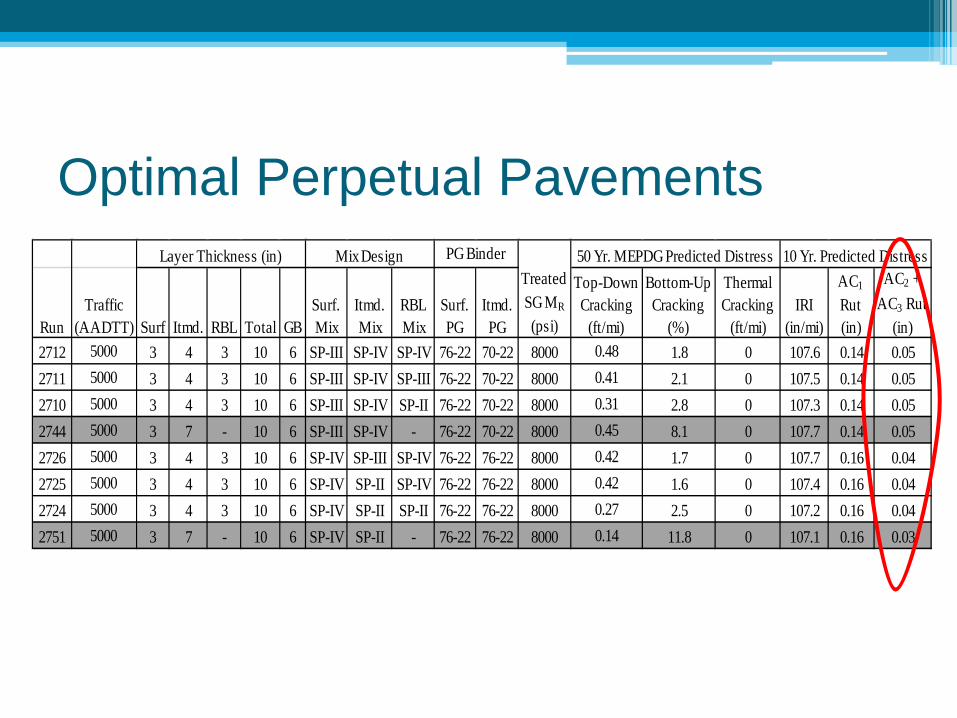
Optimal Perpetual Pavements
RunTraffic
(AADTT) Surf Itmd. RBL Total GBSurf. Mix
Itmd. Mix
RBL Mix
Surf. PG
Itmd. PG
Top-Down Cracking
(ft/mi)
Bottom-Up Cracking
(%)
Thermal Cracking
(ft/mi)IRI
(in/mi)
AC1
Rut (in)
AC2 + AC3 Rut
(in)2712 5000 3 4 3 10 6 SP-III SP-IV SP-IV 76-22 70-22 8000 0.48 1.8 0 107.6 0.14 0.052711 5000 3 4 3 10 6 SP-III SP-IV SP-III 76-22 70-22 8000 0.41 2.1 0 107.5 0.14 0.052710 5000 3 4 3 10 6 SP-III SP-IV SP-II 76-22 70-22 8000 0.31 2.8 0 107.3 0.14 0.052744 5000 3 7 - 10 6 SP-III SP-IV - 76-22 70-22 8000 0.45 8.1 0 107.7 0.14 0.052726 5000 3 4 3 10 6 SP-IV SP-III SP-IV 76-22 76-22 8000 0.42 1.7 0 107.7 0.16 0.042725 5000 3 4 3 10 6 SP-IV SP-II SP-IV 76-22 76-22 8000 0.42 1.6 0 107.4 0.16 0.042724 5000 3 4 3 10 6 SP-IV SP-II SP-II 76-22 76-22 8000 0.27 2.5 0 107.2 0.16 0.042751 5000 3 7 - 10 6 SP-IV SP-II - 76-22 76-22 8000 0.14 11.8 0 107.1 0.16 0.03
10 Yr. Predicted DistressPG BinderMix DesignLayer Thickness (in)Treated SG MR
(psi)
50 Yr. MEPDG Predicted Distress
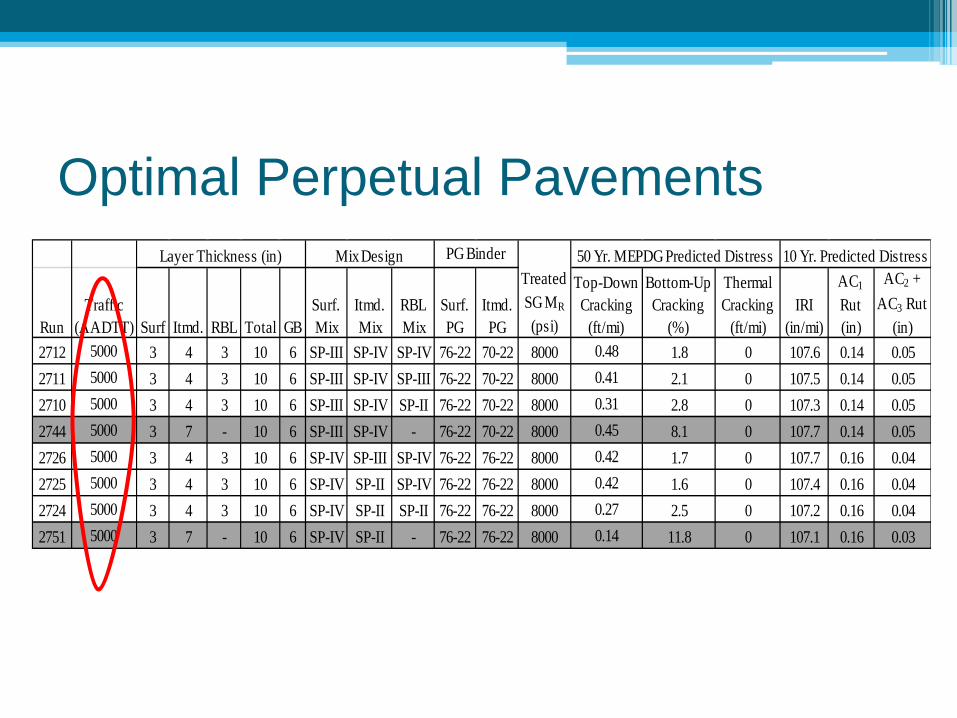
Optimal Perpetual Pavements
RunTraffic
(AADTT) Surf Itmd. RBL Total GBSurf. Mix
Itmd. Mix
RBL Mix
Surf. PG
Itmd. PG
Top-Down Cracking
(ft/mi)
Bottom-Up Cracking
(%)
Thermal Cracking
(ft/mi)IRI
(in/mi)
AC1
Rut (in)
AC2 + AC3 Rut
(in)2712 5000 3 4 3 10 6 SP-III SP-IV SP-IV 76-22 70-22 8000 0.48 1.8 0 107.6 0.14 0.052711 5000 3 4 3 10 6 SP-III SP-IV SP-III 76-22 70-22 8000 0.41 2.1 0 107.5 0.14 0.052710 5000 3 4 3 10 6 SP-III SP-IV SP-II 76-22 70-22 8000 0.31 2.8 0 107.3 0.14 0.052744 5000 3 7 - 10 6 SP-III SP-IV - 76-22 70-22 8000 0.45 8.1 0 107.7 0.14 0.052726 5000 3 4 3 10 6 SP-IV SP-III SP-IV 76-22 76-22 8000 0.42 1.7 0 107.7 0.16 0.042725 5000 3 4 3 10 6 SP-IV SP-II SP-IV 76-22 76-22 8000 0.42 1.6 0 107.4 0.16 0.042724 5000 3 4 3 10 6 SP-IV SP-II SP-II 76-22 76-22 8000 0.27 2.5 0 107.2 0.16 0.042751 5000 3 7 - 10 6 SP-IV SP-II - 76-22 76-22 8000 0.14 11.8 0 107.1 0.16 0.03
10 Yr. Predicted DistressPG BinderMix DesignLayer Thickness (in)Treated SG MR
(psi)
50 Yr. MEPDG Predicted Distress
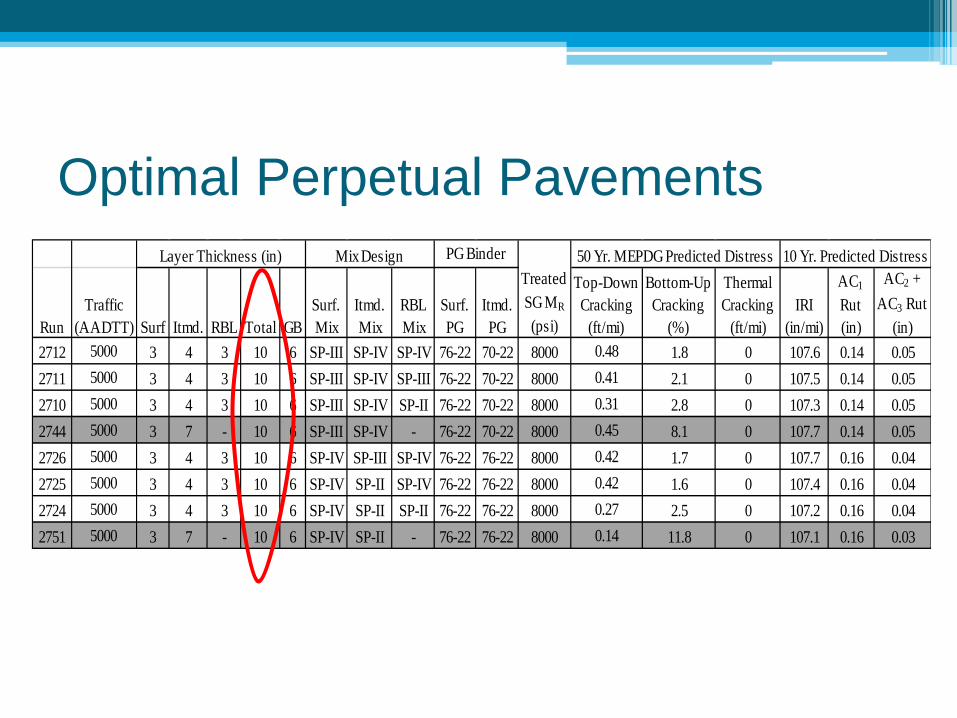
Optimal Perpetual Pavements

Optimal Perpetual Pavements
RunTraffic
(AADTT) Surf Itmd. RBL Total GBSurf. Mix
Itmd. Mix
RBL Mix
Surf. PG
Itmd. PG
Top-Down Cracking
(ft/mi)
Bottom-Up Cracking
(%)
Thermal Cracking
(ft/mi)IRI
(in/mi)
AC1
Rut (in)
AC2 + AC3 Rut
(in)2712 5000 3 4 3 10 6 SP-III SP-IV SP-IV 76-22 70-22 8000 0.48 1.8 0 107.6 0.14 0.052711 5000 3 4 3 10 6 SP-III SP-IV SP-III 76-22 70-22 8000 0.41 2.1 0 107.5 0.14 0.052710 5000 3 4 3 10 6 SP-III SP-IV SP-II 76-22 70-22 8000 0.31 2.8 0 107.3 0.14 0.052744 5000 3 7 - 10 6 SP-III SP-IV - 76-22 70-22 8000 0.45 8.1 0 107.7 0.14 0.052726 5000 3 4 3 10 6 SP-IV SP-III SP-IV 76-22 76-22 8000 0.42 1.7 0 107.7 0.16 0.042725 5000 3 4 3 10 6 SP-IV SP-II SP-IV 76-22 76-22 8000 0.42 1.6 0 107.4 0.16 0.042724 5000 3 4 3 10 6 SP-IV SP-II SP-II 76-22 76-22 8000 0.27 2.5 0 107.2 0.16 0.042751 5000 3 7 - 10 6 SP-IV SP-II - 76-22 76-22 8000 0.14 11.8 0 107.1 0.16 0.03
10 Yr. Predicted DistressPG BinderMix DesignLayer Thickness (in)Treated SG MR
(psi)
50 Yr. MEPDG Predicted Distress

Optimal Perpetual Pavements
RunTraffic
(AADTT) Surf Itmd. RBL Total GBSurf. Mix
Itmd. Mix
RBL Mix
Surf. PG
Itmd. PG
Top-Down Cracking
(ft/mi)
Bottom-Up Cracking
(%)
Thermal Cracking
(ft/mi)IRI
(in/mi)
AC1
Rut (in)
AC2 + AC3 Rut
(in)2712 5000 3 4 3 10 6 SP-III SP-IV SP-IV 76-22 70-22 8000 0.48 1.8 0 107.6 0.14 0.052711 5000 3 4 3 10 6 SP-III SP-IV SP-III 76-22 70-22 8000 0.41 2.1 0 107.5 0.14 0.052710 5000 3 4 3 10 6 SP-III SP-IV SP-II 76-22 70-22 8000 0.31 2.8 0 107.3 0.14 0.052744 5000 3 7 - 10 6 SP-III SP-IV - 76-22 70-22 8000 0.45 8.1 0 107.7 0.14 0.052726 5000 3 4 3 10 6 SP-IV SP-III SP-IV 76-22 76-22 8000 0.42 1.7 0 107.7 0.16 0.042725 5000 3 4 3 10 6 SP-IV SP-II SP-IV 76-22 76-22 8000 0.42 1.6 0 107.4 0.16 0.042724 5000 3 4 3 10 6 SP-IV SP-II SP-II 76-22 76-22 8000 0.27 2.5 0 107.2 0.16 0.042751 5000 3 7 - 10 6 SP-IV SP-II - 76-22 76-22 8000 0.14 11.8 0 107.1 0.16 0.03
10 Yr. Predicted DistressPG BinderMix DesignLayer Thickness (in)Treated SG MR
(psi)
50 Yr. MEPDG Predicted Distress
Optimal Perpetual Pavements

Optimal Perpetual Pavements
RunTraffic
(AADTT) Surf Itmd. RBL Total GBSurf. Mix
Itmd. Mix
RBL Mix
Surf. PG
Itmd. PG
Top-Down Cracking
(ft/mi)
Bottom-Up Cracking
(%)
Thermal Cracking
(ft/mi)IRI
(in/mi)
AC1
Rut (in)
AC2 + AC3 Rut
(in)2712 5000 3 4 3 10 6 SP-III SP-IV SP-IV 76-22 70-22 8000 0.48 1.8 0 107.6 0.14 0.052711 5000 3 4 3 10 6 SP-III SP-IV SP-III 76-22 70-22 8000 0.41 2.1 0 107.5 0.14 0.052710 5000 3 4 3 10 6 SP-III SP-IV SP-II 76-22 70-22 8000 0.31 2.8 0 107.3 0.14 0.052744 5000 3 7 - 10 6 SP-III SP-IV - 76-22 70-22 8000 0.45 8.1 0 107.7 0.14 0.052726 5000 3 4 3 10 6 SP-IV SP-III SP-IV 76-22 76-22 8000 0.42 1.7 0 107.7 0.16 0.042725 5000 3 4 3 10 6 SP-IV SP-II SP-IV 76-22 76-22 8000 0.42 1.6 0 107.4 0.16 0.042724 5000 3 4 3 10 6 SP-IV SP-II SP-II 76-22 76-22 8000 0.27 2.5 0 107.2 0.16 0.042751 5000 3 7 - 10 6 SP-IV SP-II - 76-22 76-22 8000 0.14 11.8 0 107.1 0.16 0.03
10 Yr. Predicted DistressPG BinderMix DesignLayer Thickness (in)Treated SG MR
(psi)
50 Yr. MEPDG Predicted Distress
Optimal Perpetual Pavements
RunTraffic
(AADTT) Surf Itmd. RBL Total GBSurf. Mix
Itmd. Mix
RBL Mix
Surf. PG
Itmd. PG
Top-Down Cracking
(ft/mi)
Bottom-Up Cracking
(%)
Thermal Cracking
(ft/mi)IRI
(in/mi)
AC1
Rut (in)
AC2 + AC3 Rut
(in)2712 5000 3 4 3 10 6 SP-III SP-IV SP-IV 76-22 70-22 8000 0.48 1.8 0 107.6 0.14 0.052711 5000 3 4 3 10 6 SP-III SP-IV SP-III 76-22 70-22 8000 0.41 2.1 0 107.5 0.14 0.052710 5000 3 4 3 10 6 SP-III SP-IV SP-II 76-22 70-22 8000 0.31 2.8 0 107.3 0.14 0.052744 5000 3 7 - 10 6 SP-III SP-IV - 76-22 70-22 8000 0.45 8.1 0 107.7 0.14 0.052726 5000 3 4 3 10 6 SP-IV SP-III SP-IV 76-22 76-22 8000 0.42 1.7 0 107.7 0.16 0.042725 5000 3 4 3 10 6 SP-IV SP-II SP-IV 76-22 76-22 8000 0.42 1.6 0 107.4 0.16 0.042724 5000 3 4 3 10 6 SP-IV SP-II SP-II 76-22 76-22 8000 0.27 2.5 0 107.2 0.16 0.042751 5000 3 7 - 10 6 SP-IV SP-II - 76-22 76-22 8000 0.14 11.8 0 107.1 0.16 0.03
10 Yr. Predicted DistressPG BinderMix DesignLayer Thickness (in)Treated SG MR
(psi)
50 Yr. MEPDG Predicted Distress

Conclusions• None of the 3213 pavements failed by top-down or
thermal cracking at the end of 50 years• Only eight pavements failed by bottom-up cracking at the
end of 50 years• As per AC rutting, 3059 pavements showed less than 0.1″
after 10 years. If they are rehabilitated every 10 years for ≤0.1″ combined AC rut criteria, all 3059 will last 50 years
• All pavements failed by total rutting (0.75″ ). Improved subgrade material (MR of 15.5 ksi) reduces rutting
Future Work for Perpetual Pavements• The fatigue endurance limit (FEL) of asphalt concrete
mixtures is required for the proper design of long-lasting perpetual pavements▫ The FEL is defined as the tensile strain below which no
fracture or fatigue damage occurs▫ Determining FEL for asphalt mixes used in MEPDG will
ensure that pavements are designed to withstand potential fatigue cracking
• Instrumentation of perpetual pavements will allow us to validate MEPDG and ensure perpetual pavement performance

Questions?
Thanks!


