34
Project presentation The study of human factor in industrial safety – response to risk and hazard communication By Joseph Wong
| Date post: | 14-Dec-2015 |
| Category: |
Documents |
| Upload: | tatiana-radford |
| View: | 213 times |
| Download: | 0 times |

Project presentation
The study of human factor in industrial safety – response to risk
and hazard communication
By Joseph Wong

Content
Introduction
Methodology
Result
Expected finding

Introduction
Which of the following would bring the most
hazardous feeling to you???
DANGER DANGER DANGER
CAUTIONCAUTIONCAUTION
WARNINGWARNING
BEWARENOTICE

Component of a warning signBoarder
*Background/Colour
*Symbol/Shape
Element
*Text label/Signal wordWARNING
!
Remark: *Our research would focus on the hazardous perception of these sort of matters
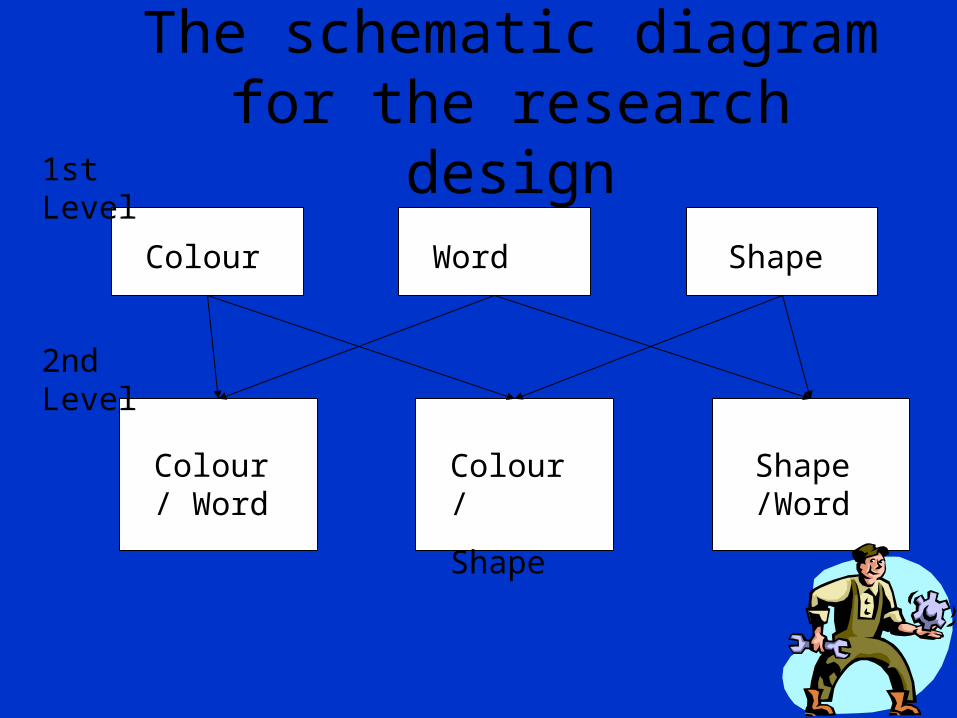
The schematic diagram for the research design
Colour Word Shape
Colour/ Word
Colour/
Shape
Shape/Word
2nd Level
1st Level

Methodology
Study Population
Study Method
Study Material

Study population70 Higher Form student (Form 4) from a government secondary school in Hong Kong
Student profile:
40 female and 30 male
Average age range:
14.5-15 years old

Study Method
-By mean of experiment
-A seven-point scale was provided to rate the the seriousness of hazardous that they would associate with:
-Each colour, word, shape and
-The combination of colour/word, colour/shape and shape/word

Details of matter under testFor level 1 of experiment
Colour:
Red, Yellow, Orange, Green, Blue
Signal word:
Danger, Warning, Caution, Notice, Beware
Sign shape:
Triangle Pentagon Hexagon CircleSquare

Details of matter under testFor level 2 of experiment
Red, Yellow, Orange, Green, Blue
Danger, Warning, Caution, Notice, Beware
Triangle Pentagon Hexagon CircleSquare
Colour/word
Colour/shape
Word/shape

Study Material
A notebook computer
A set of power-point slides
An overhead projector
A white screen for display
And a preprinted rating sheet with 7-point scale for each elements under test

ResultHazardous perception on colour
Mean rating for each colour
3.83
4.03
2.93
3.13
5
3.23
3.7
1.75
2.93
4.13
3.49
3.84
2.26
3.01
4.5
2.51
3.76
2.51
4.66
6.24
Green
yellow
blue
orange
red
Leonard 1997
Total
Female
Male

ResultPerception of hazardous on colour (General)
The ranking order (highest to lowest) is: Red, Yellow, Green Orange and Blue
Mean rating:
Red (4.5), Yellow (3.84), Green (3.49), Orange (3.01), Blue (2.26)
Result consistent with Griffith and Leonard, 1988 with exception of orange

ResultPerception of hazardous on colour (General)
- Consistent with Braun and Silver, 1995; Griffith, 1995; Woglater et al, 1997a, 1998 that red colour connotes highest hazard, i.e not different between people with Western cultures.
- Similar to the ranking order (with expectation of orange) as Rodriguez (1991) and Dunlap et al (1986). i.e Red, Yellow, Green, Blue.

ResultPerception of hazardous on colour (General)
-can differentiate between yellow and orange colour as pointed out by Chapins, 1994; Griffith, 1995; Woglater et al, 1998.
-Showed that the different between the people in Western culture and Eastern culture.

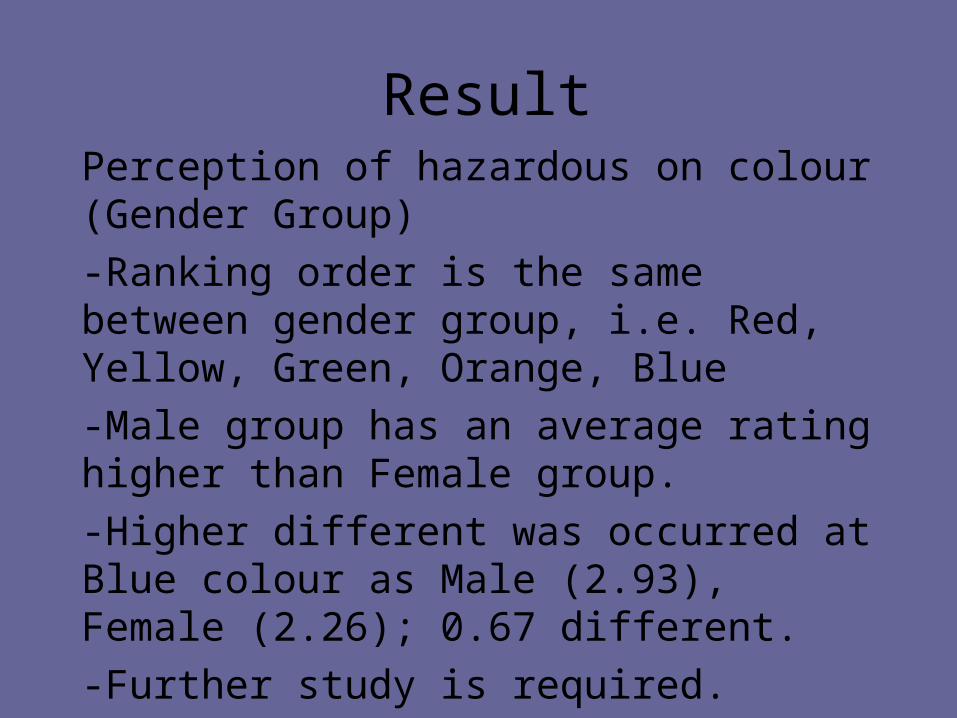
ResultPerception of hazardous on colour (Gender Group)
Mean rating between Gender Group
3.83
4.03
2.93
3.13
5
3.23
3.7
1.75
2.93
4.13
Green
yellow
blue
orange
red
Female
Male
ResultPerception of hazardous on colour (Gender Group)
-Ranking order is the same between gender group, i.e. Red, Yellow, Green, Orange, Blue
-Male group has an average rating higher than Female group.
-Higher different was occurred at Blue colour as Male (2.93), Female (2.26); 0.67 different.
-Further study is required.
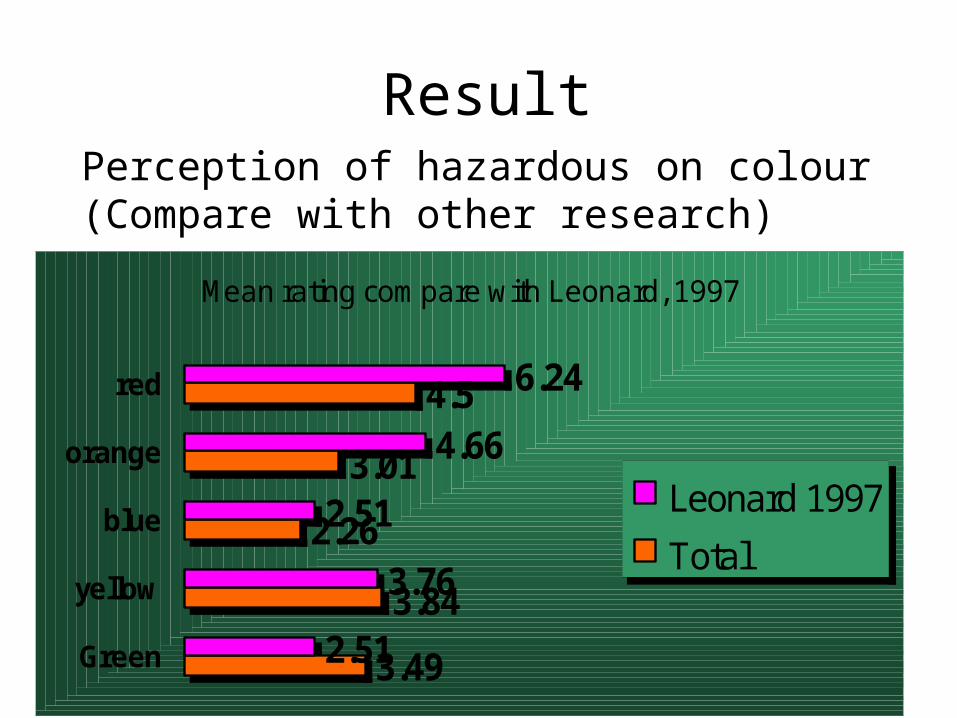
ResultPerception of hazardous on colour (Compare with other research)
Mean rating compare with Leonard, 1997
3.49
3.84
2.26
3.01
4.5
2.51
3.76
2.51
4.66
6.24
Green
yellow
blue
orange
red
Leonard 1997
Total

Result Perception of hazardous on colour (Compare
with other research)
-With exception of orange colour, ranking order is same as Leonard, 1997 as Red, Yellow, Green, Blue.
-Have a closer mean rating in colour yellow and Blue
-Blue and Green were seen to be the least hazardous perception among population in different cultural background
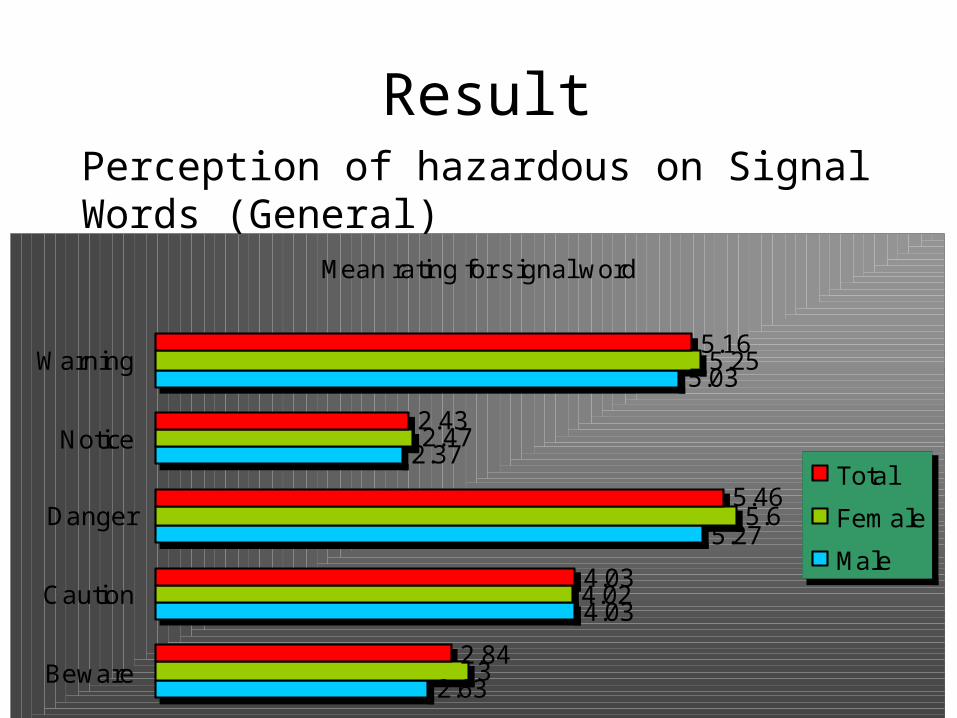
ResultPerception of hazardous on Signal Words (General)
Mean rating for signal word
2.63
4.03
5.27
2.37
5.03
3
4.02
5.6
2.47
5.25
2.84
4.03
5.46
2.43
5.16
Beware
Caution
Danger
Notice
Warning
Total
Female
Male
Result Perception of hazardous on Signal Words
(General)
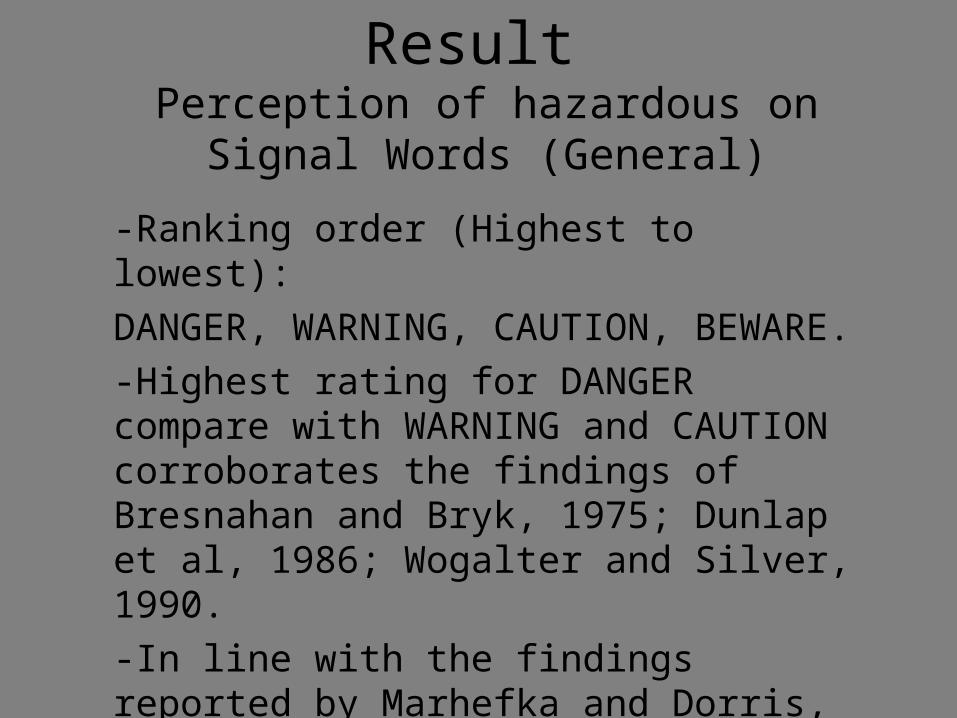
-Ranking order (Highest to lowest):
DANGER, WARNING, CAUTION, BEWARE.
-Highest rating for DANGER compare with WARNING and CAUTION corroborates the findings of Bresnahan and Bryk, 1975; Dunlap et al, 1986; Wogalter and Silver, 1990.
-In line with the findings reported by Marhefka and Dorris, 1990. DANGER >WARNING or CAUTION and WARNING always >CAUTION.

ResultPerception of hazardous on Signal Words
(General)
-Similar to the result worked by Wogalter and Silver, 1990:
College student gave DANGER and WARNING significantly higher than CAUTION, but DANGER and WARNING did not different from each other. 5.46 (DANGER) and 5.16 (WARNING) respectively.

ResultPerception of hazardous on Signal Words
(General)
-Significant differences in connoted hazard between individual pairs of terms, such as DANGER (5.46) and CAUTION (4.03). (Bresnahan and Bryk, 1975 and Dunlap et al, 1986). Thus no major different across study population
- No differentiation problem between WARNING and CAUTION compare with result obtained from the other research

ResultPerception of hazardous on Signal Words
(General)
-Findings on differentiation between WARNING and CAUTION provide support to Wogalter and Silver, 1995 with the ASU college student.

ResultPerception of hazardous on Signal Words
(Gender)Mean rating between gender group
2.63
4.03
5.27
2.37
5.03
3
4.02
5.6
2.47
5.25
Beware
Caution
Danger
Notice
Warning
Female
Male

ResultPerception of hazardous on Signal Words
(Gender)
-Provide same ranking order
-Mean rating between DANGER (5.27/Male) (5.6/Female) and WARNING (5.03/Male) (5.25/Female) is so close between group
-On average female have a higher rating than male
-Both male and female give a close rating to the signal word ‘CAUTION’ as 4.03 and 4.02 respectively

ResultPerception of hazardous on Signal Words
(Gender)
-Female have a higher hazardous perception on signal words than male.
ResultPerception of hazardous on Signal Words (Compare
with other research)

Mean rating compare w ith other research
2.84
4.03
5.46
2.43
5.16
3.39
5.54
1.83
4.02
2.21
3.45
2.53
3.22
6.67
1
4.33
3.78
6.22
2
4.11
5.96
5.96
6.99
4.99
6.44
Bew are
Caution
Danger
Notice
Warning Wogalter et al (1995)
Wogalter et al (1988)com vlo
Wogalter et al (1988)student
Leonard et al (1988)
Lonard (1997)
Current

ResultPerception of hazardous level on Signal word
(compare with other research)
-With exception of the danger, all rating for others signal words in current study is higher than others
-Demographic factors:
Gender, Age and Personality (Wogalter et al, 1999)
-Female may more sensitive to take appropriate action in response to warning

ResultPerception of hazardous level on Signal word
(compare with other research)
-Influence in age significantly influence the result
Middle school student generally assign higher rating than college did (Wogalter et al, 1994)
-Ranking order was consistent across different group

Result for others like shape and the combination of colour, shape and word are in progress!!!!
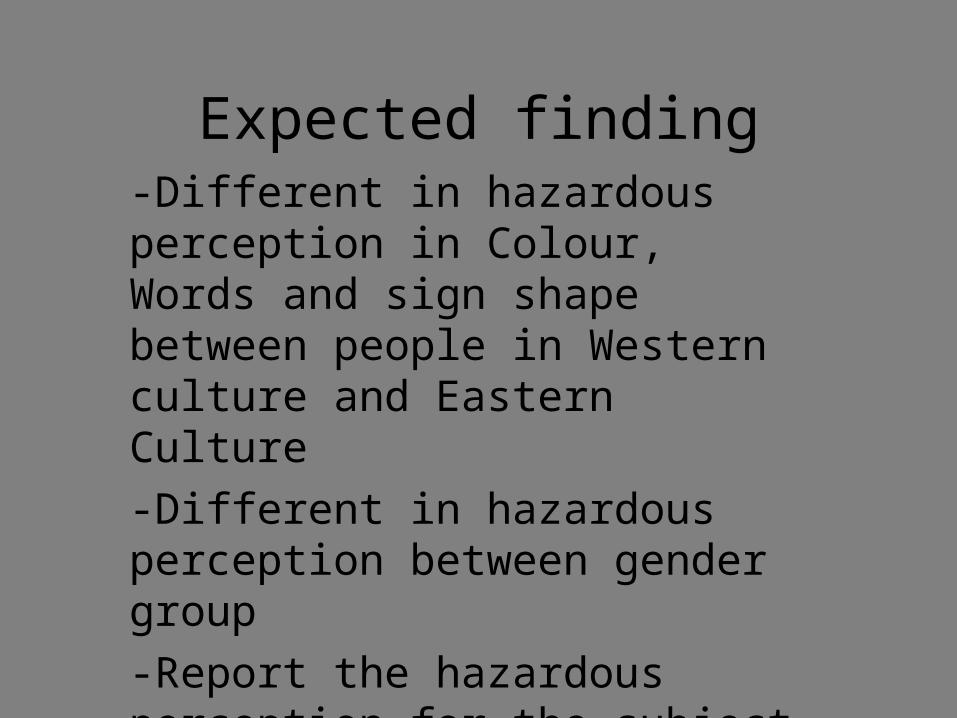
Expected finding-Different in hazardous perception in Colour, Words and sign shape between people in Western culture and Eastern Culture
-Different in hazardous perception between gender group
-Report the hazardous perception for the subject in colour, word and sign shape

The end!!
Thank You!!!


