PROJECT REPORT Terrapoint #: 2009-176-C Project Name: NCC Gatineau Park Originally submitted: 2010-09-01 Presented to: National Capital Commission Ottawa, Ontario Submitted by: Ottawa, Ontario
Transcript
PROJECT REPORT
Terrapoint #: 2009-176-C Project Name: NCC Gatineau Park Originally submitted: 2010-09-01 Presented to: National Capital Commission Ottawa, Ontario Submitted by:
Ottawa, Ontario
NCC Gatineau Park
Project Report
Terrapoint #: 2009-176-C
2
EXECUTIVE SUMMARY
The purpose of this LiDAR project was to provide high accuracy, classified multiple return LiDAR products for a 457km2 area covering the majority of Gatineau Park in the National Capital Region. This project supports the National Capital Commission’s planning and management efforts for Gatineau Park. The LiDAR data were acquired and processed by Terrapoint Canada and the primary deliverable product is classified LiDAR. The elevation data was verified internally prior to delivery to ensure it met fundamental accuracy requirements when compared to kinematic and static Terrapoint GPS checkpoints. Below is the summary for both tests:
The LiDAR dataset was tested to 0.100m vertical accuracy at 95% confidence level based on consolidated RMSEz (0.051m x 1.960) when compared to 1386 GPS kinematic check points.
The LiDAR dataset was tested to 0.122m vertical accuracy at 95% confidence level based on consolidated RMSEz (0.062m x 1.960) when compared to 6 GPS static check points.
All data delivered met or exceeds Terrapoint’s deliverable product requirements as set out by Terrapoint’s I-PROVE program.
3.1. LiDAR Systems ..................................................................................................6 3.1.1. Optech 3100EA LiDAR System ...................................................................6 3.1.2. Riegl LMS-Q560 LiDAR System ....................................................................7 System Details ..............................................................................................................7 The Laser Scanner .......................................................................................................7 3.2. LiDAR System Parameter Overview ..............................................................8 3.3. Aircraft..............................................................................................................9 3.4. Base Station and Control GPS Receivers....................................................10 3.5. Missions Statistics ...........................................................................................10 3.6. Horizontal and Vertical Reference Coordinate System Used ..................10 3.7. Geoid Model Used........................................................................................11 3.8. Data Coverage.............................................................................................11
4. LiDAR Processing........................................................................................................11 4.1. Airborne GPS Kinematic ...............................................................................11 4.2. Generation and Calibration of Laser Points (raw data) ...........................11 4.3. Vertical Bias Resolution.................................................................................12 4.4. Data Classification and Editing ...................................................................12 4.5. Deliverable Product Generation.................................................................13
4. Quality Control ...........................................................................................................14 4.1. Quality Control for Data Acquisition ...........................................................14 4.2. Quality Control for Data Processing............................................................16
5. Positional Accuracy ..................................................................................................19 6. Conclusion ..................................................................................................................20 Appendix A - GPS Validation ..........................................................................................21 Appendix B - Geodetic Control Survey Report...........................................................22
NCC Gatineau Park
Project Report
Terrapoint #: 2009-176-C
4
NCC GATINEAU PARK PROJECT REPORT
1. Introduction LiDAR data is remotely sensed high-resolution elevation data collected by an airborne collection platform. By positioning laser range finding with the use of 1 second GPS with 100 Hz inertial measurement unit corrections; Terrapoint's LiDAR instruments are able to make highly detailed geospatial elevation products of the ground, man-made structures and vegetation. The LiDAR ground extraction process takes place by building an iterative surface model. This surface model is generated using three main parameters: building size, iteration angle and iteration distance. The purpose of this LiDAR data was to produce high accuracy 3D terrain geospatial products to support planning and management activities in the NCC’s administering of Gatineau Park. This report covers the mission parameters and details, processing step outlines, and deliverables. Flightline indexes and a control survey report are included as addenda to this report.
NCC Gatineau Park
Project Report
Terrapoint #: 2009-176-C
5
2. Project Boundary
NCC Gatineau Park
Project Report
Terrapoint #: 2009-176-C
6
3. LiDAR Acquisition
3.1. LiDAR Systems Three LiDAR systems were used to collect the data: Two Optech ALTM 3100EA systems and a Riegl LMS-Q560 system.
3.1.1. Optech 3100EA LiDAR System The Optech ALTM 3100EA system is a new state-of-the-art 100 kHz LiDAR system that enables the combination of accuracy and rapid collection speed due to its high scanning rate.
Table 1 represents a list of the salient features and characteristics for the Optech ALTM 3100 EA system:
CHARACTERISTIC ALTM 3100EA Manufacturer Optech Platform Fixed-wing/Helicopter Scan principle/pattern Sawtooth, uniform across 96% of swath Wavelength(s) (µm) 1.064 Scan angle θ (°) Variable from 0º to +/- 25º Pulse rate (kHz) 0 – 100 Scan rate (Hz) 70 Flying height h minimum-maximum (m) 80 – 3500 Swath width (m) Variable from 0 to 0.93 x altitude (m) Beam divergence (mrad) Dual divergence 0.3 or 0.8 Laser footprint (m) 0.75 @ 1000 m h (typical) Across track point spacing (m) Variable Along track point spacing (m) Variable Point density (points/ sq m) Variable Flying speed typical (km/h) 250 Area/h (sq km/h) Varies Net flying time max/typical (h) Typical at 7 hours No. of echoes per pulse 4 including last Intensity recording Yes Cameras None currently Ground GPS receivers (dual–frequency) Any geodetic grade Airborne GPS receiver (dual–frequency) Geodetic grade dual frequency IMU Manufacturer Litton IMU Frequency (Hz) 200 Attitude precision roll, pitch/heading (°) 0.005 / 0.008 Laser classification Class IV Eyesafe range (m) 70 (in flight) Power requirements 28 VDC @ 35 A (maximum) Operating temperature (°C) -10º to +35º Humidity (%) 0 to 95 non-condensing
NCC Gatineau Park
Project Report
Terrapoint #: 2009-176-C
7
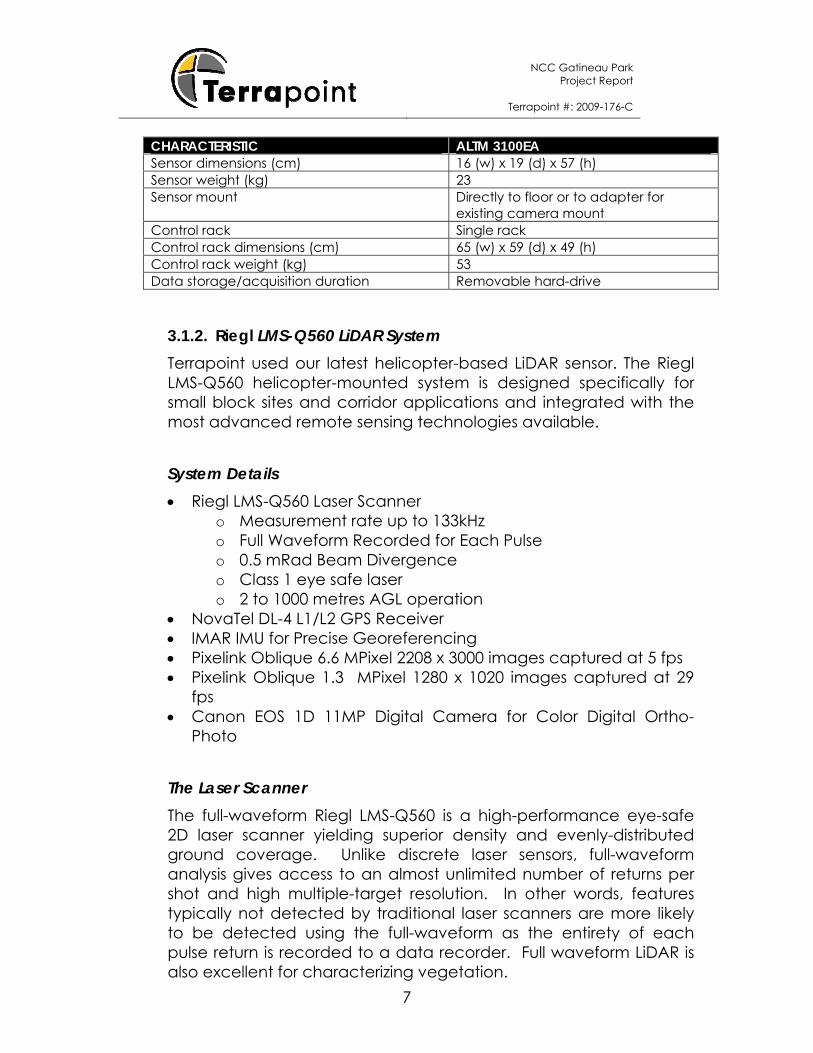
CHARACTERISTIC ALTM 3100EA Sensor dimensions (cm) 16 (w) x 19 (d) x 57 (h) Sensor weight (kg) 23 Sensor mount Directly to floor or to adapter for
existing camera mount Control rack Single rack Control rack dimensions (cm) 65 (w) x 59 (d) x 49 (h) Control rack weight (kg) 53 Data storage/acquisition duration Removable hard-drive
3.1.2. Riegl LMS-Q560 LiDAR System Terrapoint used our latest helicopter-based LiDAR sensor. The Riegl LMS-Q560 helicopter-mounted system is designed specifically for small block sites and corridor applications and integrated with the most advanced remote sensing technologies available.
System Details Riegl LMS-Q560 Laser Scanner
o Measurement rate up to 133kHz o Full Waveform Recorded for Each Pulse o 0.5 mRad Beam Divergence o Class 1 eye safe laser o 2 to 1000 metres AGL operation
NovaTel DL-4 L1/L2 GPS Receiver IMAR IMU for Precise Georeferencing Pixelink Oblique 6.6 MPixel 2208 x 3000 images captured at 5 fps Pixelink Oblique 1.3 MPixel 1280 x 1020 images captured at 29
fps Canon EOS 1D 11MP Digital Camera for Color Digital Ortho-
Photo
The Laser Scanner The full-waveform Riegl LMS-Q560 is a high-performance eye-safe 2D laser scanner yielding superior density and evenly-distributed ground coverage. Unlike discrete laser sensors, full-waveform analysis gives access to an almost unlimited number of returns per shot and high multiple-target resolution. In other words, features typically not detected by traditional laser scanners are more likely to be detected using the full-waveform as the entirety of each pulse return is recorded to a data recorder. Full waveform LiDAR is also excellent for characterizing vegetation.
NCC Gatineau Park
Project Report
Terrapoint #: 2009-176-C
8
3.2. LiDAR System Parameter Overview
The LiDAR data was acquired using the following system configurations. 2.2.1. Fall 2009 Acquisition: Reigl LMS-Q560 System Configuration
Item Parameter Units Aircraft Speed 50 knots
Data Acquisition Height 750 m AGL
Swath Width 866 m
Distance Between Flight Lines 433 m
Overlap 50 %
Scanner Field Of View 30 +/- degrees
Pulse Repetition Rate 50 KHz
Scan Frequency 33 Hz
Number of Returns Per Pulse waveform Discrete returns
Beam Divergence 0.5 mRad
Flight Line Length 40 <X km
NCC Gatineau Park
Project Report
Terrapoint #: 2009-176-C
9
Base Station Distance 20 <X km Resultant Raw Point Density 3 pt/m2 with overlap
2.2.2. Fall 2009 Acquisition: Optech 3100EA System Configuration Item Parameter Units Aircraft Speed 150 knots
Data Acquisition Height 1550 m AGL
Swath Width 676 m
Distance Between Flight Lines 338 m
Overlap 50 %
Scanner Field Of View 16.3 +/- degrees
Pulse Repetition Rate 70 KHz
Scan Frequency 38.6 Hz
Number of Returns Per Pulse 4 Discrete returns
Beam Divergence Narrow mRad
Flight Line Length 40 <X km
Base Station Distance 20 <X km
Resultant Raw Point Density 2 pt/m2 with overlap
2.2.3. Spring 2010 Acquisition: Optech 3100EA System Configuration
Item Parameter Units Aircraft Speed 150 knots
Data Acquisition Height 970 m AGL
Swath Width 826 m
Distance Between Flight Lines 413 m
Overlap 50% %
Scanner Field Of View 25.5 +/- degrees
Pulse Repetition Rate 70 KHz
Scan Frequency 38.7 Hz
Number of Returns Per Pulse 4 Discrete returns
Beam Divergence Narrow mRad
Flight Line Length 40 <X km
Base Station Distance 20 <X km
Resultant Raw Point Density 2 pt/m2 with overlap
3.3. Aircraft Three aircraft were used for the survey. A R-44 Helicopter, registration C-GLMD, with an endurance of approximately 3 hours was used with the Reigl LMS-Q560 LiDAR system. Two Piper Navaho aircraft, a fixed
NCC Gatineau Park
Project Report
Terrapoint #: 2009-176-C
10
wing aircraft with an endurance of approximately 6 hours, were used with the Optech ALTM 3100EA systems. The Navaho registered as C-FVTL was used in the fall of 2009, while C-FYLR flew the spring 2010 missions.
3.4. Base Station and Control GPS Receivers A combination of Sokkia GSR 2600 and NovAtel DL-4+ dual-frequency GPS receivers were used to support the airborne operations of this survey.
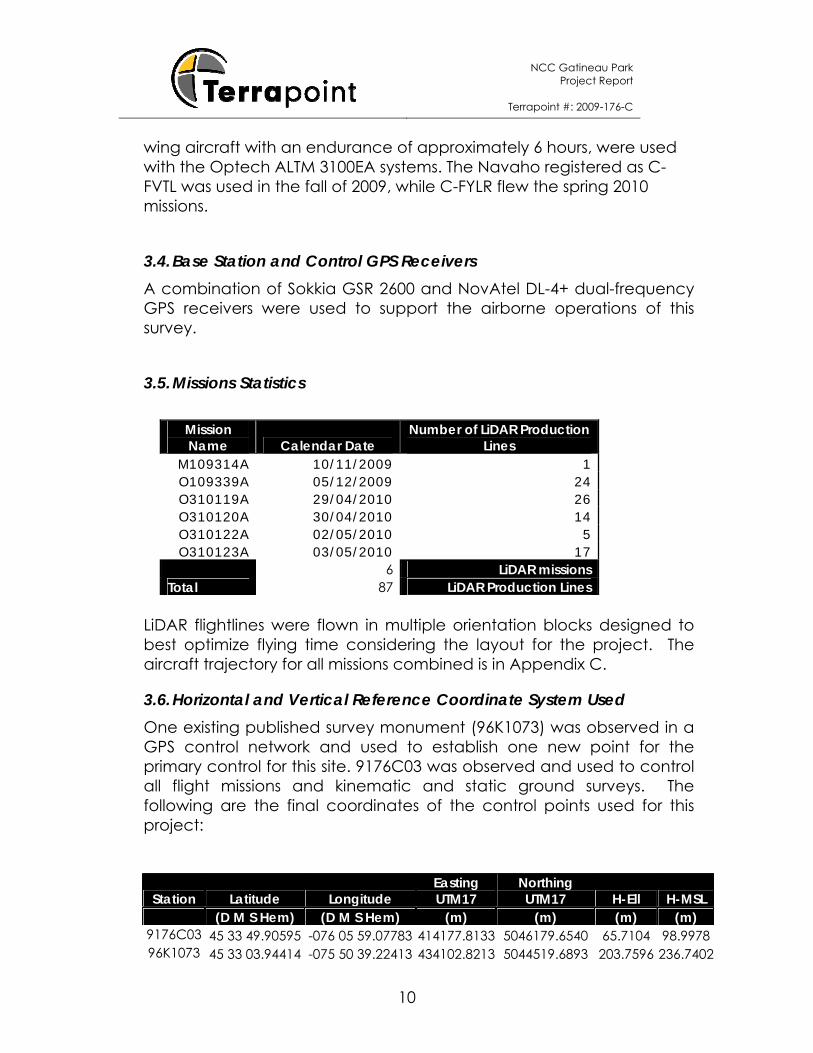
LiDAR flightlines were flown in multiple orientation blocks designed to best optimize flying time considering the layout for the project. The aircraft trajectory for all missions combined is in Appendix C.
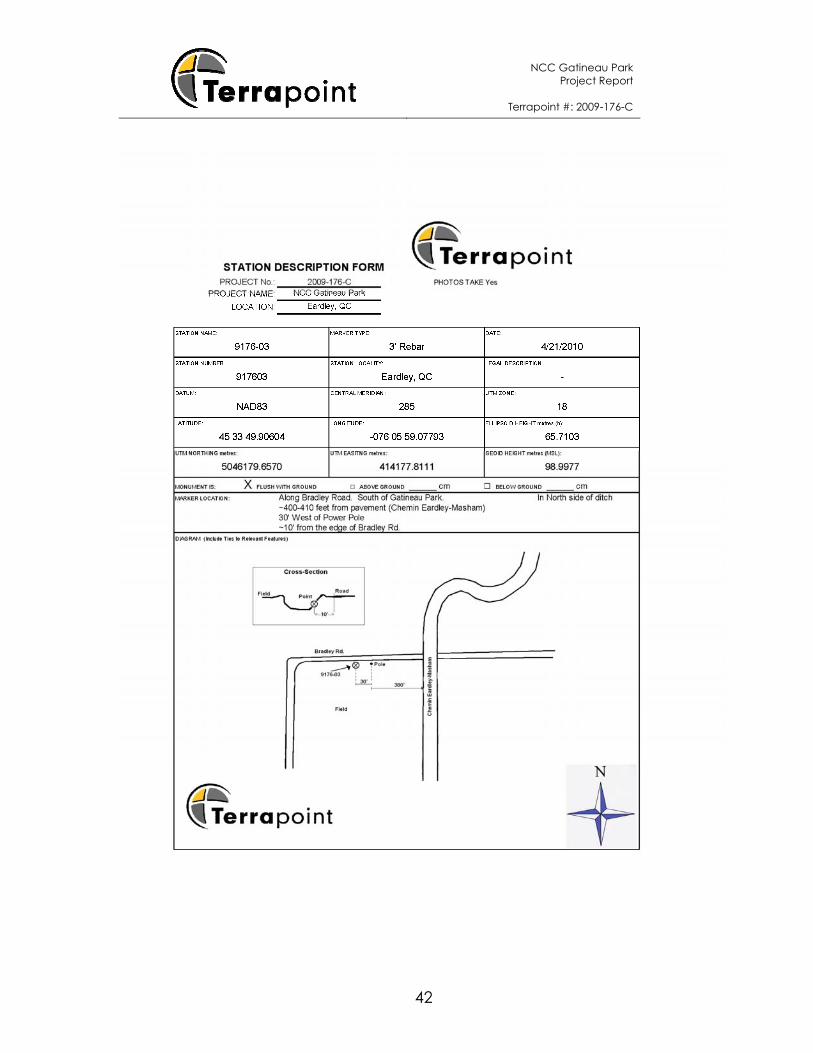
3.6. Horizontal and Vertical Reference Coordinate System Used One existing published survey monument (96K1073) was observed in a GPS control network and used to establish one new point for the primary control for this site. 9176C03 was observed and used to control all flight missions and kinematic and static ground surveys. The following are the final coordinates of the control points used for this project:
Station Latitude Longitude Easting UTM17
Northing UTM17 H-Ell H-MSL
(D M S Hem) (D M S Hem) (m) (m) (m) (m) 9176C03 45 33 49.90595 -076 05 59.07783 414177.8133 5046179.6540 65.7104 98.9978 96K1073 45 33 03.94414 -075 50 39.22413 434102.8213 5044519.6893 203.7596 236.7402
NCC Gatineau Park
Project Report
Terrapoint #: 2009-176-C
11
The published horizontal datum of the stations is NAD83(CSRS) and the vertical datum is CGVD28 The projection used for all deliverables was SCOPQ Zone 9 and units is metres.
For further details concerning the control used in this project including the network adjustment, please see the Geodetic Control Survey Report in Appendix B.
3.7. Geoid Model Used All elevations were referenced to the HT2.0 model, published by Natural Resources Canada (NRCAN), which was used to reduce all ellipsoidal heights to orthometric.
3.8. Data Coverage On a mission and project level, a daily coverage check is performed in the field as per Terrapoint I-Prove requirements and no data voids were detected unless caused by natural features such as open water.
4. LiDAR Processing
4.1. Airborne GPS Kinematic Airborne GPS kinematic data was processed on-site using GrafNav kinematic On-The-Fly (OTF) software. Flights were flown with a minimum of 6 satellites in view (13° above the horizon) and with a PDOP of better than 4. Distances from base station to aircraft were kept to a maximum of 20km. For all flights, the GPS data can be classified as excellent, with GPS residuals of 4cm average or better but no larger than 8cm being recorded.
4.2. Generation and Calibration of Laser Points (raw data) The initial step of calibration is to verify availability and status of all needed GPS and Laser data against field notes and compile any data if not complete. Subsequently the mission points are output using Optech's Dashmap, initially with default values from Optech or the last mission calibrated
NCC Gatineau Park
Project Report
Terrapoint #: 2009-176-C
12
for system. The initial point generation for each mission calibration is verified within Microstation/Terrascan for calibration errors. If a calibration error greater than specification is observed within the mission, the roll pitch and scanner scale corrections that need to be applied are calculated. The missions with the new calibration values are regenerated and validated internally once again to ensure quality. All missions are validated against the adjoining missions for relative vertical biases and collected GPS kinematic validation points for absolute vertical accuracy purposes. On a project level, a supplementary coverage check is carried out, to ensure no data voids unreported by Field Operations are present.
4.3. Vertical Bias Resolution When the LiDAR data was compared to the GPS kinematic and static points, a bias was detected. Hence the following corrections were applied:
Mission Name Bias
Adjustment O109339A +0.19mO310119A +0.10m O310120A +0.07m O310122A Line 32201 +0.19m Line 32202 +0.15m Line 32203 +0.15m Line 32204 +0.15m All other lines +0.10m O310123A Line 32302 +0.20m Line 32303 +0.05m Line 32304 +0.15m Line 32305 +0.15m Line 32308 -0.05m All other lines +0.10m
No additional shift was applied in post production for the classified tiled data.
4.4. Data Classification and Editing The data was processed using the software TerraScan, and following the methodology described herein. The initial step is the setup of the TerraScan project, which is done by importing project defined tile
NCC Gatineau Park
Project Report
Terrapoint #: 2009-176-C
13
boundary index encompassing the entire project areas. The acquired 3D laser point clouds, in LAS binary format, were imported into the TerraScan project and divided into file size optimized tiles. Once tiled, the laser points were classified using a proprietary routine in TerraScan. This routine removes any obvious outliers from the dataset following which the ground layer is extracted from the point cloud. The ground extraction process encompassed in this routine takes place by building an iterative surface model. This surface model is generated using three main parameters: building size, iteration angle and iteration distance. The initial model is based on low points being selected by a "roaming window" with the assumption is that these are the ground points. The size of this roaming window is determined by the building size parameter. The low points are triangulated and the remaining points are evaluated and subsequently added to the model if they meet the iteration angle and distance constraints. This process is repeated until no additional points are added within iteration. A second critical parameter is the maximum terrain angle constraint, which determines the maximum terrain angle allowed within the classification model. The data is then manually quality controlled with the use of hillshading, cross-sections and profiles. Any points found to be of class vegetation, building or error during the quality control process, are removed from the ground model and placed on the appropriate layer. An integrity check is also performed simultaneously to verify that ground features such as rock cuts, elevated roads and crests are present. Once data has been cleaned and complete, it is then verified by a supervisor via manual inspection and through the use of a hillshade mosaic.
4.5. Deliverable Product Generation 4.5.1. LiDAR ASCII files - Ground Once the data has been classified, quality controlled and considered complete, the ground LiDAR points are extracted from the LAS format output to comma delimited ASCII files based on the project tiling scheme. The column order is X, Y, Z, Intensity.
4.5.2. LiDAR ASCII files - Non-Ground Similarly, the non-ground LiDAR points are extracted from the LAS format output to comma delimited ASCII files based on the project tiling scheme. The column order is X, Y, Z, Intensity.
NCC Gatineau Park
Project Report
Terrapoint #: 2009-176-C
14
4.5.3. Contours Contours were generated from the processed LiDAR point clouds linked into a surface using Triangulated Irregular Network (TIN) interpolation methodology in TerraScan. The contours were generated at 1m intervals and were delivered in separate files based on the aforementioned intervals. The native format of the contours is DGN and they were subsequently transformed to SHP using Global Mapper.
4. Quality Control
4.1. Quality Control for Data Acquisition The acquisition of overlapping calibration lines for every mission is key to the QC process since it helps identify any systematic issues in data acquisition or failures on the part of the GPS, IMU or other equipment that may not have been evident to the LiDAR operator during the mission. Ground truth validation is used to assess the data quality and consistency over sample areas of the project. To facilitate a confident evaluation, existing survey control is used to validate the LiDAR data. Published survey control, where the orthometric height (elevation) has been determined by precise differential levelling or GPS observation, is deemed to be suitable. Ground truth validation points may be collected for each of the terrain categories to establish RMSE accuracies for the LiDAR project. These points must be gathered in flat or uniformly sloped terrain (<20% slope) away from surface features such as stream banks, bridges or embankments. If collected, these points will be used during data processing to test the RMSEz accuracy of the final LiDAR data products. The Field Project Manager performs kinematic post-processing of the aircraft GPS data in conjunction with the data collected at the Reference Station. Double difference phase processing of the GPS data is used to achieve the greatest accuracy. The GPS position accuracy is assessed by comparison of forward and reverse processing solutions and a review of the computational statistics. Any data anomalies are identified and the necessary corrective actions are implemented prior to the next mission.
NCC Gatineau Park
Project Report
Terrapoint #: 2009-176-C
15
The quality control of LiDAR data and data products has proven to be a key concern by Terrapoint’s clients. Many specifications detail how to measure the quality of LiDAR data given RMSE statistical methods to a 95% confidence level. In order to assure meeting all levels of QC concerns, Terrapoint has quality control and assurance steps in both the data acquisition phase and the data processing phase. Any acquired data sets that fail these checks are flagged for re-acquisition.
4.1.1. System Logger – Power Up Health Checks The system logging software performs automatic system and subsystem tests on power-up to verify proper functionality of the entire data acquisition system. Any anomalies are immediately investigated and corrected by the LiDAR operator if possible. Any persistent problems are referred to the engineering staff, which can usually resolve the issue by telephone and/or email. In the unlikely event that these steps do not resolve the problem, a trained engineer is immediately dispatched to the project site with the appropriate test equipment and spare parts needed to repair the system. 4.1.2. System Logger – Real Time Acquisition Checks The system logging software continuously monitors the health and performance of all subsystems. Any anomalies are recorded in the System Log and reported to the LiDAR operator for resolution. If the operator is unable to correct the problem, the engineering staffs are immediately notified. They provide the operator with instructions or on-site assistance as needed to resolve the problem.
If any aspect of the data does not appear to be acceptable, the operator will review system settings to determine if an adjustment could improve the data quality. Navigation aids are provided to alert both the pilot and operator to any line following errors that could potentially compromise the data integrity. The pilot and operator review the data and determine whether an immediate re-flight of the line is required. 4.1.3. Post Acquisition Data Check
After the mission is completed, raw LiDAR and imagery data on the removable disk drive is transferred to the Field PC at the field operations staging area. An automated QA/QC program scans the System Log as well as the raw data files to detect potential
NCC Gatineau Park
Project Report
Terrapoint #: 2009-176-C
16
errors. Any problems identified are reported to the operator for further analysis. Data is also retrieved from all GPS Reference Stations, which were active during the mission and transferred to the Field PC. The GPS data is processed and tested for internal consistency and overall quality. Any errors or limit violations are reported to the operator for more detailed evaluation.
4.1.4. Data Viewer Analysis
The Field Project Manager utilizes a data viewer installed on the Field PC to review selected portions of the acquired LiDAR and imagery data, this permits a more thorough and detailed analysis of the data corrupted files or problems in the data itself are noted. If the data indicates improper settings or operation of the LiDAR sensor and camera, the Field Project Manager determines the appropriate corrective actions needed prior to the next mission.
4.1.5. Data Backup with Redundancy
All LiDAR, imagery and GPS data is copied from the Field PC onto two separate removable hard drives: one for transfer to Calibration, and one for local backup. Each hard drive is reviewed to ensure data completeness and readability.
4.2. Quality Control for Data Processing Quality assurance and quality control procedures for the raw LiDAR data and processed deliverables for the DEM and derivative products are performed in an iterative fashion through the entire data processing cycle. All final products pass through a six-step QC control check to verify that the data meets the criteria specified by Terrapoint. The following list provides a step-by-step explanation of the process used by Terrapoint to review the data prior to customer delivery.
4.2.1. LiDAR Calibration 4.2.1.1. Calibration Setup and Data Inventory Data collected by the LiDAR unit is reviewed for completeness and to make sure all data is captured without errors or corrupted values. In addition, all GPS, aircraft trajectory, mission
NCC Gatineau Park
Project Report
Terrapoint #: 2009-176-C
17
information, and ground control files are reviewed and logged into a database.
4.2.1.2. Boresight The LiDAR data is post processed and calibrated as a preliminary step for product delivery initially with default values from the LiDAR system manufacturer or the last mission calibrated for the system. The initial point generation for each mission calibration is inspected for flight line errors, flight line overlap, slivers or gaps in the data, point data minimums, or issues with the LiDAR unit or GPS. If a calibration error greater than the project specification is observed within the mission, the roll, pitch and scanner scale corrections that need to be applied are calculated. The missions with the new calibration values are regenerated and validated internally once again to ensure quality. Flight line swath overlap is confirmed to the adjacent flight lines at the tolerance specified by the client for overlap throughout the project area thus enabling an evaluation of data reproducibility throughout the areas.
4.2.2. Calibrated Ground Truth Validation A preliminary RMSEz error check is performed at this stage of the project life cycle in the raw LiDAR dataset against GPS static and kinematic data and compared to RMSEz project specifications. The LiDAR data is examined in open, flat areas away from breaks and under specified vegetation categories. This step is repeated in production against the final bare earth LiDAR model.
4.3. LiDAR Production
4.3.1. Production Setup Quality Control Once the data enters the bare earth extraction stage, a checklist verifying all the components of the project have been received in good order.
4.3.2. Ground Extraction Quality Control Once the raw LiDAR data is ready for the bare earth extraction stage, all points are classified as ground and non-ground features and the subsequent quality control takes place to ensure an accurate data set is produced:
NCC Gatineau Park
Project Report
Terrapoint #: 2009-176-C
18
The non-ground LiDAR point cloud product is reviewed as LiDAR points and/or surface and attention is placed on locating and eliminating any outlier or anomalous points beyond three-sigma values. LiDAR points returning from low clouds, birds, pollution, or noise in the system can cause spikes. Pit-like low returns can come from returns on building windows (corner reflectors) or from system noise. Either type of point needs to be classified as an error point and eliminated from use by any DEM or derivative products. In addition to these outliers, the non-ground LiDAR point cloud is reviewed for regular looking non-surface errors like scan lines appearing in the data. Also, any localized errors remaining between flight lines are measured and adjusted as needed.
Unusual or odd-looking features and questionable returns are
checked for validity and compared against additional source material such as aerial photos, USGS digital maps, local maps, or by field inspection. Most errors found at this QC step can be resolved by re-calibration of the data set or by eliminating specific problem points.
Any valid non-ground LiDAR points representing vegetation,
buildings and non-regular structures or features like radio towers, water bodies, bridges, piers, are confirmed to be classified into the category specified by the client for these feature types. Additional data sets like commercially available data sources or data sources provided by the client may be used to assist and verify that points are assigned into correct classifications.
After the non-ground LiDAR points are certified as passing for
completeness and for the removal of outliers, attention is shifted to quality controlling the bare earth model. This product may take several iterations to create it to the quality level that the client is looking for. As Terrapoint and the client inspect the bare earth model, adjustments are made to fine tune and fix specific errors.
Adjustments to the bare earth model are generally made to fix
errors created by over aggressive bare earth extraction algorithm results along mountaintops, shorelines, or other areas of high percent slope. Also, vegetation artefacts leave a signature surface that appears bumpy or rough. Every effort is made to remove any vegetation remnants from the bare earth
NCC Gatineau Park
Project Report
Terrapoint #: 2009-176-C
19
model. All adjustments are made by re-classifying points from ground to non-ground or vice versa. All adjustments are made to the LiDAR points and not gridded products to achieve the highest quality results.
4.3.3. Final Bare Earth Ground Truth Validation RMSEz is inspected in the bare earth model and compared to project specifications. RMSEz is examined in open, flat areas away from breaks and under specified vegetation categories. All accuracy results are reported to the 95% confidence interval for the different categories as available and required. A point comparison of a recently acquired or existing high confidence ground survey point to a TIN generated from the bare earth LiDAR surface. The tolerance for comparisons of control data to the LiDAR TIN elevation is that all sides of the TIN triangle must not be longer than 4.5m to ensure an accurate comparison of surface to the discrete points.
5. Positional Accuracy 5.1. Vertical Positional Accuracy Prior to delivery the elevation data was verified internally to ensure it met fundamental accuracy requirements of 29.4cm vertical accuracy at the 95% confidence level (2 sigma = RMSE * 1.96) in all but extremely hilly terrain when compared to Terrapoint kinematic and static GPS checkpoints.
Data is compiled to meet 98cm horizontal accuracy at the 95% confidence level (2 sigma = RMSE * 1.96) The LiDAR dataset was tested to 0.100m vertical accuracy at 95%
confidence level based on consolidated RMSEz (0.051m x 1.960) when compared to 1386 GPS kinematic check points.
The LiDAR dataset was tested to 0.122m vertical accuracy at 95% confidence level based on consolidated RMSEz (0.062m x 1.960) when compared to 6 GPS static check points.
A detailed comparison is provided in Appendix A - GPS Validation.
NCC Gatineau Park
Project Report
Terrapoint #: 2009-176-C
20
6. Conclusion Overall the LiDAR data products submitted to the National Capital Commission meet or exceed both the absolute and relative accuracy requirements set out in the Statement of Services for this project. The quality control requirements of Terrapoint’s I-PROVE program were adhered to throughout the project cycle to ensure product quality.