PROJECT REPORT Project SIARA – Spatial Information Applications in Rural Australia (Stage 1) Leader Dr Don Yule Researchers Ms Elizabeth Thomas (DEPI) Ms Kerin Yates (LPI) Mr Piers Harper (FBA) Partners DEPI Victoria, LPI NSW, Fitzroy Basin Association Report Date 20 December 2013
Transcript
PROJECT REPORT
Project SIARA – Spatial Information Applications in Rural Australia (Stage 1)
Leader Dr Don Yule Researchers Ms Elizabeth Thomas (DEPI)
Ms Kerin Yates (LPI) Mr Piers Harper (FBA)
Partners DEPI Victoria, LPI NSW, Fitzroy Basin Association Report Date 20 December 2013
References and reading. ....................................................................................................... 55
P a g e | 1
1 Executive Summary This Project arises from the considerable, but as yet largely unrealised, benefits that can accrue
from the adoption of precise satellite positioning technologies and their application to cropping systems in Australia.
Specifically, Network Real Time Kinematic (NRTK) services generated from Global Navigation
Satellite Systems (GNSS) in combination with Continuously Operating Reference Station (CORS) networks can be applied to Controlled Traffic Farming (CTF). Bowman (2008) describes the triple bottom line benefits that can be achieved as a result, including an estimated:
• $1.4 billion (68%) increase in farm Gross Margin; • $13.8 million hours (67%) decrease in labour; • 600 million tons (90%) reduction in soil erosion; • 340 million kg (93%) reduction in Nitrogen entering waterways through runoff; • 3.2 million tonnes (62%) reduction in CO2 emissions; and • 640 million litres (62%) reduction in diesel use.
The present report identifies and ranks key barriers to the adoption of NRTK positioning for CTF
as the first step towards realising important benefits for the nation. Subsequent stages of the project will focus on removing the key barriers and thereby aim to lift CORS adoption rates for CTF from the 15% estimated by the GRDC (2010) to 50% by 2020.
The Project methodology focussed on gathering and analysing information using quantitative
and qualitative surveys of grain (and other) growers, cropping contractors and service sector suppliers and advisors located in key agricultural zones of Australia. The quantitative survey focussed on demographics, GNSS positioning and cropping practices using Computer Aided Telephone Interviews (CATI) and personal telephone interviews. The surveys were independently conducted by Kaliber Group in late 2011 and early 2012, producing a data spreadsheet and analysis report used as the basis for this report.
As described below, key barriers to the adoption of NRTK for CTF in Australia have been
identified and ranked.
Key barriers
1. Inadequate awareness and end-user education about CTF and the role of CORS networks to support CTF implementation
• Low understanding of satellite positioning technologies, applications and capabilities.
• Low awareness of the increasing role and value of CORS networks. • Low awareness of the expertise and investment of government in GNSS technology. • Difficulty and expense for machinery dealerships in retaining staff with GNSS
expertise and the risk of biased advice due to commercial interest. • Confusion about how to fully apply CTF in a whole-of-farm system context and the
critical dependence on precise positioning capabilities. • Lower levels of adoption of satellite positioning by older growers and those with
lower education levels. • Confusion about the needed/achieved positioning accuracy when using GNSS
technology for CTF. • Confusion about NRTK/RTK solutions in terms of their ability to accurately establish
and maintain permanent wheel tracks (PWT).
P a g e | 2
• Sub-optimal availability of independent informed advisors. Preferably agronomists and dealers should be providers of independent technical advice and support relating to GNSS, CTF and related software.
• Lack of adequate support services for growers.
2. Lack of consistent machinery standards to support CTF • Many farmers use machinery with different wheel track widths, thereby preventing
full PWT implementation and undermining the benefits of CTF. • Harvesting across the grain, cotton and horticulture industries uses machines with
different wheel spacing, restricting options for growing multiple crops on PWT. • Consistent machinery wheel track spacing is required across all cropping industries
to enable PWT.
3. Earlier GNSS investment decisions • Widespread use of individual reference stations and the use of GNSS equipment
linked to proprietary solutions is limiting uptake of positioning technologies capable of supporting CTF.
• Low awareness of the existence and role of CORS networks and associated services is inhibiting the transition to compatible non-proprietary solutions.
P a g e | 3
Glossary ABS Australian Bureau of Statistics. A/B line Line between two known positions, A and B, which sets the initial direction
of travel (e.g. for sowing, harvesting etc). Subsequent travel paths are parallel to and offset from this line by a known distance. This technique allows Permanent Wheel Tracks (PWT) for Controlled Traffic Farming (CTF) to be established and maintained.
Accuracy The closeness of a measurement to the “truth”. Accuracy is generally
expressed as an interval, confidence level or probability within which the true value is likely to occur with a specified probability. Accuracy is often incorrectly interchanged with precision. The below graphic provides an illustration of the different meanings of accuracy and precision.
Accurate but imprecise Inaccurate but precise Refer also to the term “repeatable accuracy” typically used in Precision
Agriculture (PA). Refer also to Precision. ACTFA Australian Controlled Traffic Farming Association Incorporated. CORS network Continuously Operating Reference Stations (CORS) network comprise Global
Navigation Satellite Systems (GNSS) receivers strategically deployed over a given region. CORS networks continuously observe, model and correct satellite navigation signals using centralised processing facilities to produce a range of multi-modal positioning services. A key service provided by CORS networks is Network Real Time Kinematic (NRTK) data streams.
NRTK corrections are processed to international standards delivering ±2 cm horizontal positioning accuracy to users, regardless of range from contributing reference stations. Australian CORS networks are often sponsored, facilitated, established or managed by industry sectors, governments (state, territory, federal and local), community groups and academic institutions—working in partnerships or alone.
The benefits of CORS networks delivering NRTK capability compared to owner operated or subscription based GNSS rover - base station receiver pairs producing single base RTK include:
• The need for a GNSS end-user to invest in and establish a permanent/semi-permanent GNSS base station is removed, eliminating the time for initial site selection and (daily or otherwise repeated) set-up, any issues of security and power supply, and the possibility of set-up errors.
• CORS networks automatically monitor their own integrity detecting and alerting reference station specific issues. With a single-base RTK setup, problem diagnosis can be difficult and lead to unpredictable down times for dependant GNSS rover end-users.
• Loss of one station from a CORS network does not result in failure of the entire network. Loss of a reference station with single-base RTK results in the termination of farm machinery guidance. With CORS network NRTK correction accuracy typically degrades marginally.
• CORS networks producing NRTK support atmospheric modelling over the entire network area resulting in improved accuracy. With single-base RTK, atmospheric effects are computed using (usually) one location.
• All roving GNSS receivers corrected for position by a CORS network system benefit from being tied authoritatively to and monitored with respect to the national geodetic datum (Geocentric Datum of Australia). Australian State, Territory and Federal Government’s maintain legally traceable coordinates for CORS network antenna positions as a part of national geodetic obligations.
CRCSI Cooperative Research Centre for Spatial Information. CTF Controlled Traffic Farming (CTF) is a farming system based on the
effectiveness and efficiency of Permanent Wheel Tracks (PWT) for all load bearing machinery operations on land used for crop production. CTF is optimised for resource management, productivity, environmental and social benefits and made effective and efficient by PWT.
CTF Zonal CTF Zonal Management supports accurate spatial management of specific Management horticultural zones with operations such as sowing, spraying (herbicides,
insecticides, and fungicides), fertilising and cultivation. DEPI Department of Environment and Primary Industries, Victoria (DEPI). In 2013
the Department of Sustainability and Environment (DSE) merged with the Department of Primary Industries (DPI) to become the DEPI, playing a key role in supporting the state government’s priority to boost productivity in Victoria’s food and fibre sector. DEPI manages Vicmap Position GPSnet, a state-wide CORS network (http://gnss.vicpos.com.au).
DGPS Differential Global Positioning System (DGPS) applies differential corrections
to autonomous Global Positioning System (GPS) receiver measurements, using a second receiver as a reference station making simultaneous measurements at a point with known coordinates. Similarly GNSS constellations can also be used in combination to generate and apply
Differential GNSS (DGNSS) corrections. DGPS accuracies can be an order of magnitude better than autonomous GPS positioning depending on the receiver and technique used. DGPS services may use proprietary formats and are often packaged with GPS/GNSS hardware or made available on a subscription basis.
Drop-out Drop-out is a generic term used for any system problem that prevents the
determination of position. Such problems include GNSS equipment failure, equipment integration issues and failed communication links. Typical circumstances that can lead to Real Time Kinematic (RTK) position correction signal drop-out include the rover receiver being too far from the base station (more than 10-12 km) and satellite signal obstruction caused by terrain, trees, surrounding equipment or other blockages. RTK requires that both the GPS on the machinery and at the base station track a satellite in order for it to be included in the solution. An obstruction at one end will make that satellite unusable. GPS signals are also quite weak so they are susceptible to temporary obstructions, such as trees, as well as radio interference. The communication link between the base station and machinery is also a potential source of drop-outs with obstructions and radio interference both being potential causes. Maintaining line of site to maintain the radio link can be very challenging, particularly on highly vegetated or undulating land. Huge transmission towers have been erected in some locations to try and improve the reach of radio signals. Having received the base station data, the GPS unit on the machinery still needs utilise complex algorithms to converge to a solution. A drop-out may just be because the unit is not able to ‘fix’ the solution. This ‘fix’ can also be incorrectly determined on rare occasions, sometimes by a factor of metres.
DSE Department of Sustainability and Environment (DSE), Victoria. Also refer to
DEPI. FBA Fitzroy Basin Association. GNSS Global Navigational Satellite Systems (GNSS) describes satellite systems
delivering worldwide positioning, navigation and timing (PNT) services to suitably equipped users. Examples include the US Global Positioning System (GPS), the Russian GLONASS system, the Chinese Beidou system and European Galileo system.
GNSS accuracy GNSS enables users with an appropriate receiver to determine their position
in any unobstructed environment by using signals broadcast by satellites orbiting the earth. However, GNSS accuracy can be degraded and made unreliable due to, amongst other things, atmospheric effects, radio-frequency interference, and multipath effects.
Standalone GNSS without corrections are generally accurate to 5 to 10 metres. GNSS satellite signals can be corrected to improve position accuracy using Differential, Real Time Kinematic (RTK) or Network RTK (NRTK) technologies.
GNSS GNSS convergence is the time taken to achieve stable correction status and
P a g e | 6
Convergence produce valid and reliable GNSS positions. GPS The United States Global Positioning System (GPS), the first fully operational
satellite-based Positioning Navigation and Timing (PNT) service available for civilian use.
GRDC Grains Research and Development Corporation. Growers This Project’s quantitative study included Farmers and Contractors
(machinery based crop harvesting and related service suppliers) as growers. Respondents were selected to be farming crops suitable to benefit from GNSS technology.
Inter-row sowing Inter-row sowing describes the practice of planting new crop between rows
of plant stubble residue of a previous crop—facilitated by centimetre accurate RTK/NRTK guidance and PWT.
LPI Land and Property Information (LPI), a division of the Department of Finance
and Services, is the key provider of land information services in New South Wales, Australia. LPI is establishing the CORSnet-NSW CORS network (www.corsnet.com.au).
Mobile delivery Mobile delivery describes the use of a telecommunication network to
transmit a RTK/NRTK correction data stream to a roving GNSS receiver. An external antenna (similar to that associated with mobile phone car-kits) can be used to boost telecommunications network signal in areas of weak reception improving mobile delivery.
Mobile delivery supporting RTK/NRTK services typically requires two-way data transmissions to allow a roving GNSS receiver to communicate its approximate location to a CORS network system. Mobile delivery also allows for specialist system support to remotely interact with roving GNSS receivers used in isolated precision farming applications.
Telstra, Optus and Vodafone telecommunications companies provide indicative coverage maps supporting mobile delivery on their respective websites. Telstra’s Next G service has been found to provide an adequate level of mobile delivery service to reliably receive NRTK corrections, even in remote areas of Victoria.
NBN National Broadband Network. NRTK Network Real Time Kinematic (NRTK) GNSS position correction is based on
raw GNSS satellite data streamed from a network of CORS surrounding the GNSS receiver of an end-user. The CORS central processing facility receives, quality assures, models, optimises and then produces NRTK corrections specific to each GNSS user. Virtual Reference Station (VRS) and Master Auxiliary Concept (MAX or MAC) are examples of proprietary NRTK techniques in commercial use.
Pass to pass Pass to pass accuracy is a term used in the PA industry to indicate the accuracy expected separation or overlap of two passes of an agricultural machine,
particularly for CTF applications, measured over a 15 minute period and
typically estimated at 95% confidence. Refer and compare to Repeatable (also “Year to Year”) Accuracy.
Precision Precision describes the repeatability or spread of the observed positioning
results. Precision is determined by comparing a large number of observations against their mean value and indicates how close repeated observations are to each other. Statistically, precision is expressed in terms of a standard deviation. Precision is often incorrectly interchanged with accuracy. Refer also to Accuracy.
Precision Precision Agriculture (PA) is described as a farming management concept Agriculture (PA) based on observing and responding to intra-field variations. PPP Precise Point Positioning (PPP) is a GNSS positioning method that provides
accuracy in the order of decimetres to centimetres using a single receiver. In this respect PPP fundamentally differs from DGPS, RTK and NRTK. PPP relies on precise satellite clock and orbit information and a lengthy convergence time (up to 30 minutes) to achieve accuracies at the centimetre level. Real-time PPP services are generally available on a subscription basis from commercial providers.
PPP and CORS PPP and CORS can be combined to better model errors, improve accuracy
and significantly reduce convergence times. Some service providers in Australia offer a PPP “fall-back” option when the RTK correction link is unavailable. Overseas, fully integrated services are starting to enter the market, although they are not yet available in Australia.
Permanent Permanent Wheel Tracks (PWT) is an approach to farm machine operation Wheel Tracks where all load bearing wheels use one set of designated wheel tracks. PWT (PWT) applies to tractors, sprayers, spreaders and harvesters. Typically, PWT are
determined by the harvester because the wheel spacing of this machine is hardest to change. Historically, different farm industries have used different wheel spacing, often due to imported machinery and PWT on farms with mixed cropping being challenging. PWT requires all load bearing wheels to always return to the designated wheel tracks with high accuracy. GNSS RTK and NRTK are contemporary technologies able to support this objective.
PWT manages all the machinery and creates zones of wheel tracks, crop rows and inter-rows that can be precisely managed. Field layout has to be designed to ensure PWT drainage. This also controls water erosion and water-logging. Reduced tillage, including no tillage, crop rotation and cropping frequency are supported by PWT. Automated PWT with GNSS (auto-steer) reduces operator stress.
Radio delivery Radio delivery describes how a radio transmitter (usually UHF or VHF) at the
GNSS reference station broadcasts correction data to a roving GNSS receiver. High power radios can broadcast corrections up to 20 km, however undulating terrain, buildings and vegetation can attenuate or entirely block the signal. Commercial licences managed by the Australian Communications and Media Authority (ACMA) are required for some frequency bands and transmission powers.
P a g e | 8
Repeatable Repeatable accuracy (also referred to as “Year to Year” accuracy), is used in accuracy PA to describe how well two farm machine passes are expected to align with
each another. Repeatable accuracy differs from “Pass to Pass” accuracy. In the former case, the two passes are separated by a year or more whereas in the latter, a 15 minute time period exists.
RTK Real Time Kinematic (RTK) positioning supports centimetre-level accuracy
based on a single reference station transmitting a correction signal to the roving receiver. Optimum accuracy is limited to approximately ≤30 km range on account of the impact of distance dependent errors, primarily the ionosphere. RTK can be achieved using either a privately owned and operated GNSS base station (requiring upfront capital cost) or via access to a dealer’s (typically non-networked) GNSS base station or cluster of base stations, a community GNSS base station or CORS network.
Satellite delivery Satellite delivery is a term used in the context of Precision Farming to
describe the transmission of GNSS satellite correction data via geostationary satellite. Satellite delivery requires line of sight between the GNSS end-user and the geostationary satellite. The US Wide Area Augmentation System (WAAS) is an example of a Continental wide Space Based Augmentation System (SBAS) system that utilises satellite delivery via geostationary satellite.
Satellite This Project’s survey questions used “GPS positioning” and “satellite Positioning positioning technology” as synonyms since these are terms common to technology growers and advisors. Growers and advisors also commonly use the term
“GPS guidance” in association with Precision Farming. Strictly speaking, GPS positioning uses GPS satellites only. By contrast satellite positioning technology takes into account signals from other GNSS as well as commercial satellite delivered correction streams provided through private sector companies such as Omnistar, John Deere and Terrastar.
SIARA Spatial Information Applications for Rural Australia — this Project. SPP Single Point Positioning (SPP) is the fundamental GPS/GNSS technique using
a single GPS/GNSS receiver and standard GPS/GNSS signals to obtain positions. Standard car navigation systems and mobile phones with satellite positioning capability typically determine locations by SPP.
VRT Variable-Rate Technologies (VRT) incorporate agricultural equipment with
flow controllers that allow variable-rate application of inputs such as seeds, fertiliser, and weed or pest control.
Yield monitor Yield monitors spatially measure and record crop yields. Zero till Zero till (also called “No till” farming) is a farming method that avoids
disturbing the soil by tillage. Benefits of Zero till include reduced erosion with increased retention of water and nutrients. Zero till was introduced 30 years ago and has been heavily supported by research and grower groups.
2 Context This Project arises from the considerable, but as yet, largely unrealised potential benefits that
can accrue from the adoption of precise satellite positioning technologies and their application to cropping systems in rural Australia.
Specifically, NRTK correction services generated from GNSS in combination with CORS networks
can be applied to facilitate CTF. Bowman (2008) demonstrates the significant triple bottom line benefits that can be achieved through the adoption of spatially enabled cropping systems such as CTF, including an estimated:
• $1.4 billion (68%) increase in farm Gross Margin; • $13.8 million hours (67%) decrease in labour; • 600 million tons (90%) reduction in soil erosion; • 340 million kg (93%) reduction in Nitrogen entering waterways through runoff; • 3.2 million tonnes (62%) reduction in CO2 emissions; and • 640 million litres (62%) reduction in diesel use.
Significant investment has been made over almost two decades to encourage and support crop
management with Precision Agriculture (PA) using various satellite and agronomic systems such as GNSS and CTF respectively. Until recently, investment in GNSS technology for PA and CTF mainly focussed on single purpose, proprietary satellite position correction solutions and support. This technology enabled individual “early adopters” to benefit from combining GNSS guidance technologies with advanced, spatially enabled agricultural practices and systems such as CTF.
More recently, agricultural machinery dealers in particular, have broadcast subscriber based RTK
position corrections by installing individual GNSS base stations connected to tower mounted radio antennas to transmit position correction services to local farmers in range—typically a few tens of kilometres. Some of the most recent GNSS position correction implementations by local dealers have been non-networked clusters of GNSS base stations each connected to a tower mounted radio antenna. A patchwork broadcast pattern of independent RTK position correction services is thus established to support the needs of farmers located across multiple farming districts.
During the last few decades the spatial industry has been following a parallel course to PA with
regard to satellite technology adoption while also playing a pioneering research and development role in the computation and use of GNSS position corrections for high accuracy positioning and navigation applications. By around the year 2000, Australian state governments such as Victoria, NSW and Queensland had piloted and assessed CORS networks streaming NRTK corrections via the internet to be superior to single base stations or isolated clusters of non-networked GNSS base stations using broadcast radio techniques, delivering RTK.
Ongoing use and indeed proliferation of single or clusters of non-networked base stations for PA
was ultimately considered at state government level (particularly Victoria)—to be market failure. Independent evidence, such as that given by Chapman and Neale (2007) reinforced this view, with the authors noting that “…Australian Growers have purchased enough RTK base stations to provide a fully networked solution to an area 3.5 times the area of Australia. …The future should be in fully networked RTK solutions.”
As a consequence of this market failure and a desire to remove a significant barrier to entry (i.e.
the need for users to own and operate their own GNSS base station), a number of state governments have funded the expansion of multi-modal CORS networks. Accordingly CORS network infrastructure
P a g e | 10
installation and NRTK coverage accelerated in the mid 2000 period onwards, particularly in rural farming regions. CORS networks in some jurisdictions are now either fully complete (e.g. Victoria) or development is well underway (e.g. NSW).
The private sector has also partnered government, or less frequently gone ahead alone, to
install, operate, expand, integrate and manage CORS networks to target profitable markets and provide innovative and value added services. SmartnetAus, AllDayRTK, Omnistar CORS and RTKNetWest CORS are examples of such private sector companies providing NRTK coverage across significant parts of Australia and in particular rural areas.
This Project (SIARA) recognises the potential impact of developments in GNSS CORS and CTF on
Australia’s cropping industry and acknowledges that uptake of these technologies falls behind expectations. It aims to identify the key barriers to adoption of high accuracy (±2 cm horizontal1) GNSS positioning in the cropping sector and therefore the adoption of CTF. SIARA aligns well with the goals of the CRCSI to facilitate the adoption of spatial information technologies by key end-user industries and thereby bring substantial benefit to the nation.
Project partners include:
• CRCSI; • CTF Solutions; • Fitzroy Basin Association (FBA); • Department of Environment and Primary Industries (DEPI) Victoria; and • Land and Property Information (LPI) NSW.
Partners are either current or prospective users of high accuracy satellite positioning in rural
areas or facilitator/operators of GNSS CORS networks with an interest in promoting adoption and securing benefits to end-users. The Project does not attempt to extrapolate findings from other countries or from other sectors to the Australian cropping industry.
1 All subsequent references to positioning accuracy assume horizontal accuracy only.
P a g e | 11
2.1 Access to positioning infrastructure
Positioning technologies such as GPS have revolutionised farming practices across Australia in recent years. In response to the perceived opportunities they provide, a number of studies have been conducted since the mid-2000s examining the costs and benefits of adoption in various industries. For example, the economic benefits of precision GNSS delivered via a standardised national (CORS) network in 2008 and projected to 2030, were estimated by the Allen Consulting Group in 20082 as shown in Table 2.1.
Table 2-1. Current and future benefits (measured as a contribution to GDP) due to Precision GNSS (Source: Allen Consulting, 2008)
These studies also found that achieving the benefits has been restricted by low adoption levels. For example, the Allen Consulting Group identified a number of barriers to adoption for agriculture, including:
• relatively high up-front costs of equipment changeover; • unreliable or limited network coverage; • high upfront cost of installing a GNSS base station (in the absence of a network); and • the need for new managerial skills (such as, field layout, more night operations when
conditions were better, matching wheel track widths) to implement the technology.
The report also referred to the then-limited national CORS network coverage as a barrier. Since that time, Australian Federal and State Governments have been investing in and managing GNSS CORS networks at the jurisdictional level.
2 Allen Consulting Group (2008) Economic Benefits of High Resolution Positioning Services, prepared for Victorian Department of Sustainability and Environment and the Cooperative Research Centre for Spatial Information, page ix. For each sector and year a range of benefits is given, based on conservative and optimistic adoption rates respectively.
P a g e | 12
The extent and location of installed public and private CORS infrastructure as at January 2013 is depicted by Hausler and Collier (2013) (Figure 2.1).
Figure 2.1 Government funded CORS infrastructure across Australia (Source: Hausler & Collier, 2013)
Victoria, NSW and Queensland State Governments have invested significantly to install, operate and expand CORS networks, namely Vicmap Position GPSnet, CORSnet-NSW and SunPos respectively. These government CORS networks have been developed in partnership with industry, all levels of government, community groups and academic institutions.
Initial coverage for each CORS network concentrated on population centres to deliver services
for multimodal use. As sufficient CORS have been established in rural areas to support NRTK service generation, particularly in Victoria and NSW, both state governments have worked to attract precision farmers as major CORS network users.
All government CORS networks support the mobile delivery of NRTK correction data allowing
users to achieve a nominal ±2 cm horizontal accuracy at 95% confidence. Sub-metre real-time streams and post-processing position correction data are also available from government CORS networks and typically used for appropriate tasks in agriculture, construction, mining, surveying, mapping and emergency response.
CORSnet-NSW delivers NRTK correction data to farmers in the coverage area depicted in Figure
2.2. CORSnet-NSW currently comprises 139 stations (as at November 2013). Farmers can log into the network and access the correction data through a subscription service available from Authorised Resellers. The number of Authorised Resellers has increased over time. In late 2013, a Premium Authorised Reseller arrangement commenced to allow the sale of LPI CORSnet data. Promotion of CORS services through commercial resellers should make a strong contribution to the awareness of farmers. More information about CORSnet-NSW in Agriculture is available at www.corsnet.com.au.
Figure 2.2 NSW government CORSnet-NSW infrastructure and RTK/NRTK coverage, Nov2013 (Source: LPI, 2013)
The current map (Figure 2.2) shows significant additional coverage for agricultural areas when compared to the network at the time of the survey (Figure 2.3). It is expected that re-running the survey would show greater current awareness of CORSnet-NSW.
Figure 2.3 NSW government CORSnet-NSW infrastructure and RTK/NRTK coverage around time of SIARA survey, Dec 2011 (Source: LPI, 2013)
P a g e | 14
Victoria’s CORS network, Vicmap Position-GPSnet™, comprises 119 CORS (as at July 2013) with
state-wide NRTK correction coverage (Figure 2.4). CORS correction services are distributed under the Vicmap brand of products and services using a wholesale licensing model through Value Added Resellers (VARs). More information about Vicmap Position-GPSnet™ in Agriculture is available at: www.dse.vic.gov.au/property-titles-and-maps/maps-imagery-and-data/data/gpsnet.
Figure 2.4. Victorian government Vicmap Position GPSnet infrastructure, July 2013 (Source: DEPI, 2013)
Fitzroy Basin Association Incorporated (FBA) is facilitating the establishment of at least 30 CORS as a network across the whole of central Queensland through funding under the Reef Rescue component of the Australian Government’s Caring for our Country program. FBA CORS network installation “…is all but complete …There are 2 stations to be installed, …” (T. Neale 2013, pers. comm., 31 July 2013). Figure 2.5 depicts the proposed CORS network infrastructure and coverage.
Figure 2.5. Proposed Fitzroy Basin CORS network infrastructure and coverage (Source: Fitzroy Basin
Association, 2013)
P a g e | 15
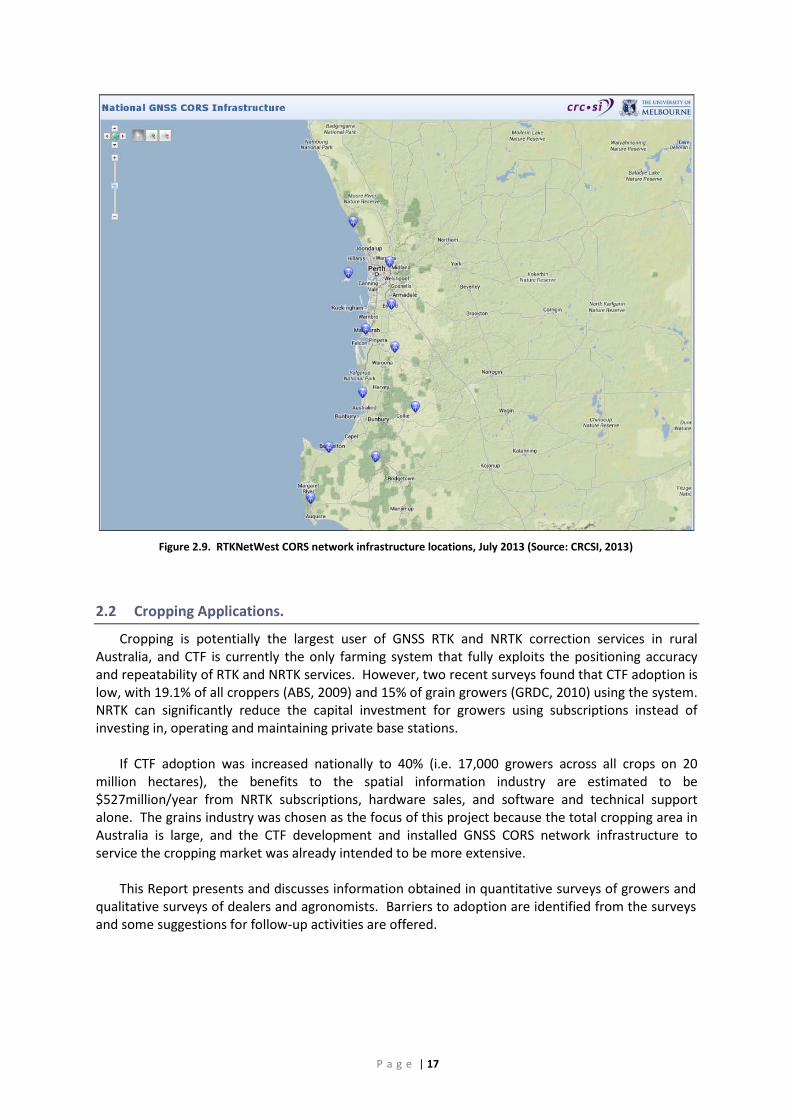
Examples of commercial CORS network infrastructure and NRTK correction service coverage by private sector providers SmartNetAus (2013), OmniSTAR CORS (Ultimate Positioning 2013), AllDayRTK (Position Partners 2013) and RTKNetWest (2013), either solely, in partnership with other private sector companies and or with government agencies, are depicted in Figures 2.6, 2.7, 2.8 and 2.9 respectively.
Figure 2.6. SmartNetAus CORS Site Map depicting contributing CORS and RTK Network coverage, July 2013 (Source: SmartNetAus, 2013)
Figure 2.7. OmniSTAR CORS infrastructure and NRTK coverage
for Tasmania (Source: Ultimate Positioning, 2013)
P a g e | 16
Figure 2.8. AllDayRTK Network Map depicting contributing Australian CORS and RTK Network
coverage, July 2013 (Source: Position Partners, 2013)
P a g e | 17
Figure 2.9. RTKNetWest CORS network infrastructure locations, July 2013 (Source: CRCSI, 2013)
2.2 Cropping Applications.
Cropping is potentially the largest user of GNSS RTK and NRTK correction services in rural Australia, and CTF is currently the only farming system that fully exploits the positioning accuracy and repeatability of RTK and NRTK services. However, two recent surveys found that CTF adoption is low, with 19.1% of all croppers (ABS, 2009) and 15% of grain growers (GRDC, 2010) using the system. NRTK can significantly reduce the capital investment for growers using subscriptions instead of investing in, operating and maintaining private base stations.
If CTF adoption was increased nationally to 40% (i.e. 17,000 growers across all crops on 20
million hectares), the benefits to the spatial information industry are estimated to be $527million/year from NRTK subscriptions, hardware sales, and software and technical support alone. The grains industry was chosen as the focus of this project because the total cropping area in Australia is large, and the CTF development and installed GNSS CORS network infrastructure to service the cropping market was already intended to be more extensive.
This Report presents and discusses information obtained in quantitative surveys of growers and
qualitative surveys of dealers and agronomists. Barriers to adoption are identified from the surveys and some suggestions for follow-up activities are offered.
P a g e | 18
3 Project Methodology SIARA (Stage 1) aimed to rigorously and reliably analyse why adoption rates of NRTK technology
for CTF are so low and objectively identify the key barriers to adoption. To achieve this aim, a research methodology was designed to gather via independent survey, demand and supply side barriers to usage of GNSS and CORS technology and its application to PA—particularly CTF. Crop growing zones were selected from eastern state jurisdictions to ensure a representative sample of responses.
The research focussed on three study areas in the Wimmera region of Victoria, central west
NSW and the Fitzroy Basin in central Queensland. Growers (predominately grains, but also some horticulture and cotton) in each area and the service sector (GNSS distributors and dealers, and agronomists) were surveyed about GNSS positioning and cropping practices. Growers represent the primary sector of the agricultural industry that benefit from the adoption of CORS network services and CTF practices. Kaliber Group (www.kalibergroup.com.au, now redirecting internet searches to KG2 at www.kg2.com.au), a provider of agribusiness information and related survey services, was engaged to conduct surveys.
A quantitative Computer Aided Telephone Interview (CATI) survey of growers was conducted in
October-November 2011 and January-March 2012, and a qualitative survey of the service sectors (Distributors/ Dealers and Agronomists) in April 20123 using Kaliber’s databases. Questionnaires were developed by Kaliber Group and the Project partners. The quantitative grower survey covered three main sections:
• GNSS Positioning: − use and non-use; − equipment; − benefits; − problems; − future plans; − government positioning networks, and − sources of advice.
• Cropping Practices: − practices used; − farming problems; − PWT and machinery; − use of contractors; − record keeping; − inter-row sowing; and − sources of advice.
3 Substantial CORS network expansion has occurred across Western NSW (CORSnet-NSW) Fig. 2.2, Central Queensland (FBA CORS) Fig. 2.4 and Tasmania (OmniSTAR CORS) Fig. 2.6 since the date of the surveys and the production of this report.
Two qualitative surveys were conducted by telephone interviews of distributors and dealers for
the positioning issues and agronomists for cropping practices. The questionnaires drew on some findings from the earlier grower surveys to focus discussions with the advisor groups.
Analysis of the results was conducted by Kaliber Group and included the interrelationships
across the three sections of the quantitative surveys. Kaliber Group prepared a spreadsheet, Quantitative Key Findings Summary and qualitative report (Distributors/Dealers and Agronomists) to present the results, which have been used in the preparation of this report.
There were a total of 268 respondents to the quantitative survey, 105 from Victoria, 108 from NSW and 55 from Qld. This included 17 professional contractors who provided farm services but did not own farmland. It was not possible to obtain more responses from Queensland as it was a busy time for growers. The surveys were also affected by flooding in target areas. Rescheduling the survey a few times did not improve the responses.
The age distribution across states is presented in Figure 3.1. The average age of growers
surveyed was 51.7 years.
Figure 3.1 Age distribution across states. n = 268
Most grower education was School Certificate4 (42%), followed by School Leaving5 (24%) and then tertiary graduate (23%), as shown in Figure 3.2.
Figure 3.2. Grower education levels. n = 268
Farm types included in the survey were grains only (47%), mixture of grains and livestock (41%), horticulture (8%) and cotton (4%). The average property size was 3,478 hectares, larger in Queensland (average 5,489 ha) and smaller in Victoria (average 2,022 ha). The average area of grain in 2011 was 1,814 ha.
The 20 horticulture growers included in the survey all grew permanent crops, mainly grapes and
citrus. These growers set up plant spacing once and have little need for on-going GNSS and CORS correction services. Potential use of GNSS in horticulture is more likely in the seasonal vegetable industries, which were not included in these surveys. The 9 cotton growers had an average sown area of 723 ha in 2011. It was expected that these horticulture and cotton growers would raise different issues about CORS to grain growers, hence their inclusion in the surveys. However, use of data from these two farm types is limited by the small sample sizes and is not included in this report, unless otherwise stated.
4 School Certificate – the certificate awarded for completing Years 9 and 10 in NSW.
5 In 2009, the minimum school leaving age in most Australian jurisdictions was 15 or 16. However, in Queensland, students were required to continue their education until 17, either at school or through some combination of training and employment.
Some contractors were included in the grower surveys. Twenty four percent of growers generated off-farm income from contracting, but were not identified in other questions. Of the 17 professional contractors, 5 were fulltime, generating all their income, and 12 had seasonal businesses generating over half of their income. The average area serviced was 15,700 ha and a wide range of services are provided. Harvesting (76%) is the most common, sowing (35%) is second (Figure 3.3). Contractors are younger than growers, with an average age of 41.6 years.
Figure 3.3. Professional Contractor services. n = 17
This is a small sample but contractors are a significant component of the grains industry and they have been included in the following analysis.
P a g e | 22
4 Analysis of survey results The results are discussed in three sections:
• Quantitative Grower Survey on Positioning; • Quantitative Grower Survey on Cropping Practices; and • Qualitative Surveys of Dealers, Distributors, and Agronomists.
The objective of this analysis is to identify barriers to adoption of NRTK in the context of CTF.
These barriers will be discussed in the following chapter.
4.1 Quantitative Grower Survey of Use of Positioning – RTK/NRTK
Overall, the survey of growers found that 79% of those surveyed use some form of satellite positioning technology. Reasons for investment include better efficiencies (47%), reduced overlaps and instances of missed treatment areas (33%), reduced operator stress (25%) and reduced labour time and requirements (25%). Of the 21% of growers not using satellite positioning technology, 57% said they intended to adopt the technology within 3 years.
4.1.1 Users of Positioning Technology. Regardless of the level of education and age, the majority of growers use some form of GPS
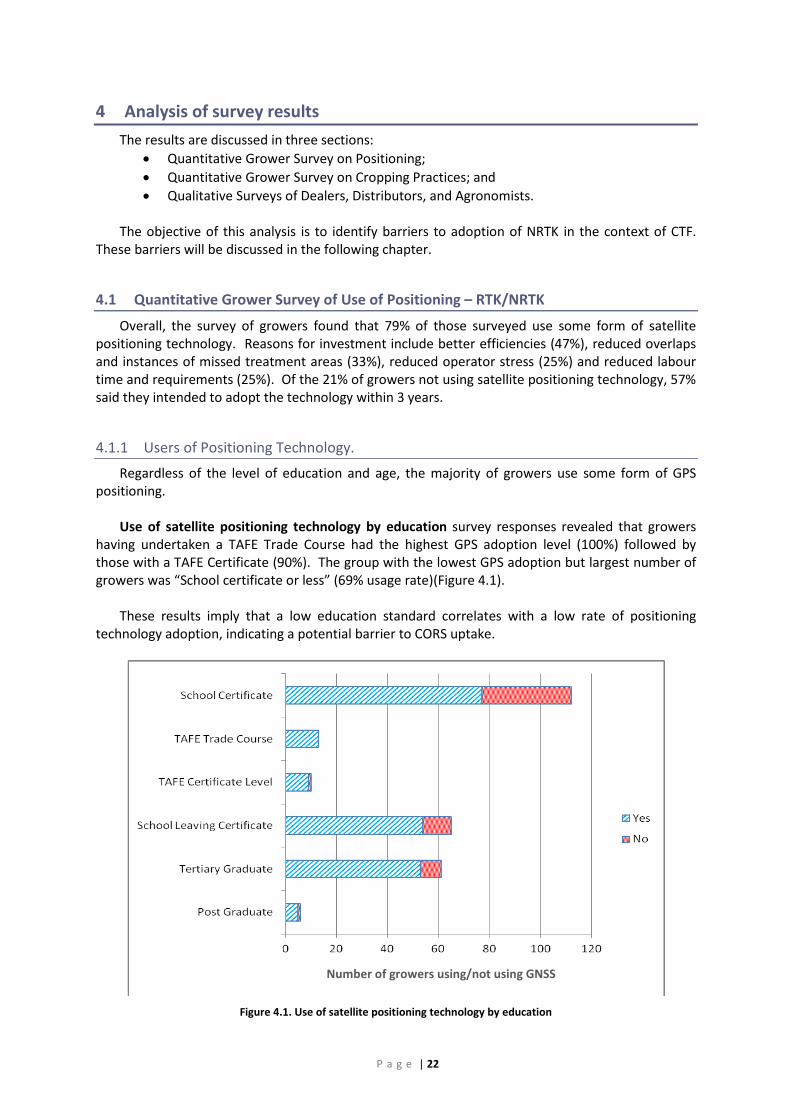
positioning. Use of satellite positioning technology by education survey responses revealed that growers
having undertaken a TAFE Trade Course had the highest GPS adoption level (100%) followed by those with a TAFE Certificate (90%). The group with the lowest GPS adoption but largest number of growers was “School certificate or less” (69% usage rate)(Figure 4.1).
These results imply that a low education standard correlates with a low rate of positioning
technology adoption, indicating a potential barrier to CORS uptake.
Figure 4.1. Use of satellite positioning technology by education
Number of growers using/not using GNSS
P a g e | 23
Use of satellite positioning technology by age group survey responses were highest for growers
under 45 (87%) and lowest for those aged 55-65 (69%) (Figure 4.2). This result implies that advancing age, particular in the years from 55 to 65, correlates with low
positioning technology adoption and may be an additional barrier in CORS uptake.
Figure 4.2. Use of satellite positioning technology by age group
GNSS usage by farm type survey responses revealed that 66% of grain growers (n=109) and 67%
of grain/livestock growers (n=78) use GNSS positioning (Figure 4.3). These results show that the highest adoption rates of GNSS positioning were in the grains only
sector while the grain/livestock, cotton and horticulture sectors were lower by comparison.
Figure 4.3. GNSS usage by farm type
Number of growers using/not using GNSS
Number of growers using/not using GNSS
P a g e | 24
GNSS usage by farm size survey responses indicated that 75% of all surveyed properties exceeded 2,000 ha. They included 78% of grain properties, 79% of grain/livestock properties, and 78% of cotton properties (Figure 4.4).
While Figure 4.4 reveals that farms larger than 2,000 ha in area had the highest use of GNSS
(78%), the GNSS accuracy by farm size survey results (Figure 4.5) showed that farms larger than 2,000 ha also used higher accuracy GNSS, with 78% of growers (n=83) using 3 cm accuracy or better.
Figure 4.4. GNSS usage by farm size (# of respondents)
Figure 4.5. GNSS accuracy by farm size (# of respondents)
The combined survey results from GNSS usage by farm size and GNSS accuracy by farm size
show that smaller farms (< 2000 ha) correlate with lower adoption of GNSS positioning generally and RTK/NRTK corrections in particular.
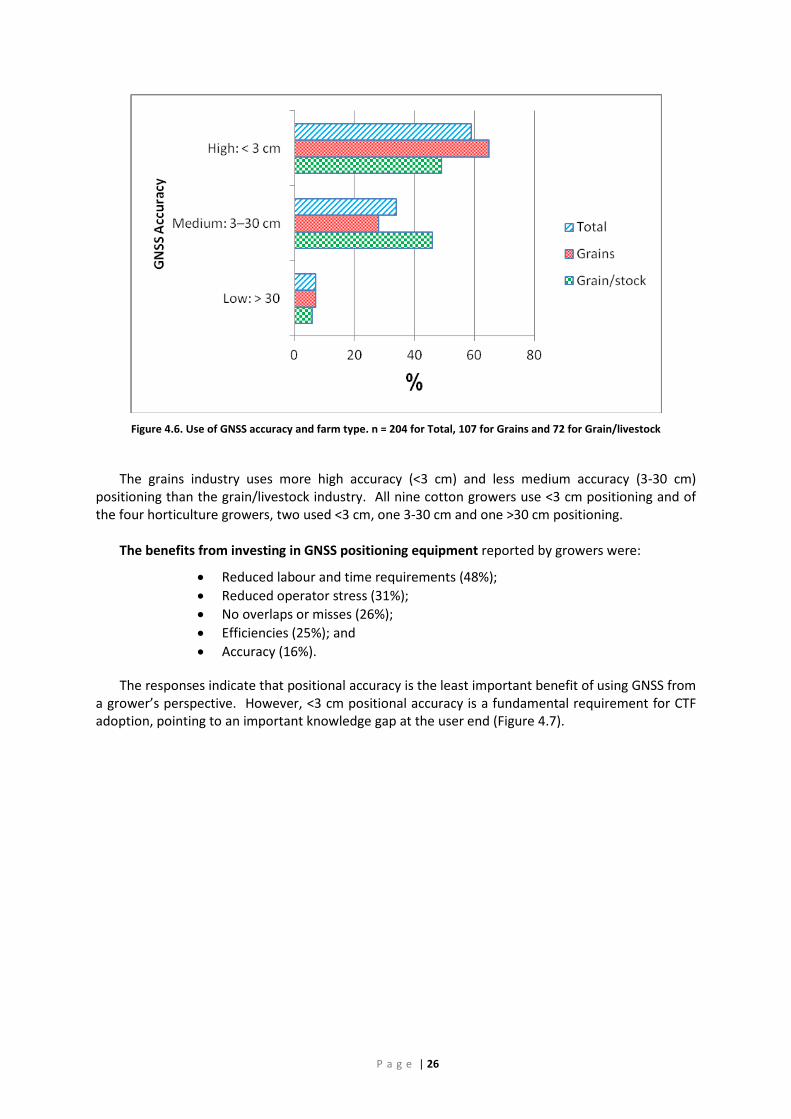
Use of GNSS accuracy and farm type survey results revealed that 59% of growers who use
satellite positioning technology reported use of better than 3 cm accuracy. It can be inferred that
P a g e | 25
these farmers have access to an RTK or NRTK correction source and associated base station infrastructure. See the glossary (page 8) for more information on RTK and NRTK.
Thirty four percent reported in the 3–30 cm accuracy range. To achieve this accuracy, the
farmers would be either using a Differential GPS (DGPS) correction or Precise Point Positioning (PPP). Both of these services require base station infrastructure, although the base stations can be located much further away from the machinery utilising the corrections. Global services such as Omnistar HP, Omnistar G2 and John Deere’s Starfire can produce medium accuracies with “pass to pass” performance over short terms at the lower end of the stated range (few centimetres) but drift out to the higher end of the range (few decimetres) when “repeatability” is assessed “year to year”.
Seven percent nominated >30 cm or low accuracy (Figure 4.6). This would suggest that they are using ‘free to air’ GPS without any correction information being used. It is quite common that the GPS hardware sold in DGPS, PPP and ‘free to air’ scenarios is upgradable to RTK with an unlock code. However, upgrading may also require the purchase of a base station which can be costly. 32% of respondents who did not use GPS nominated cost as a reason
To crosscheck the accuracy used, growers were asked to report the model of equipment used
and 53% reported “don’t know” highlighting a lack of knowledge with regard to the real performance of their equipment. This indicates another potential barrier to adoption as appropriate equipment upgrades are needed in order to benefit from CORS correction services.
Similarly, while over half of the respondents reported that their GPS achieves better than 3cm
accuracy, the capability did not correspond to the implementation of benefits like Permanent Wheel Tracks (PWT)6. 92% of those who reported adopting permanent wheel tracks used GPS, however only two thirds (67%) of them reported that their GPS was accurate to better than 3cm. Conversely, over half of those who reported that their GPS was more accurate than 3cm did not adopt permanent wheel tracks (53%).
6 When farmers establish GPS systems, it is most common that they set an AB line for the first
‘pass’ in each paddock and nominate their spacing for each additional parallel pass. The more accurate their GPS, the less overlap they need to allow to ensure the entire cropping area is covered. Simply removing this overlap can produce significant savings in fuel, time and inputs .A farmer utilising a GPS system with accuracy better than 3cm would only need to allow minimal overlap, and by inference, should automatically be running on the same tracks day after day, year after year.
There may be a number of reasons why the use of very accurate GPS systems and adoption of
PWT do not line up. It may be the way the terms are interpreted, or the fact that farmers operate machinery with varying wheel spacing, resulting in having a set of permanent tracks for each machine. However, a contributing factor is also likely to be a lack of understanding about GPS accuracy. While Governments across Australia have high levels of expertise in GPS technology, Government was not nominate as a source of advice for GPS technology, and Government (specifically the relevant Departments of Primary Industry) was only nominated as a source of advice for new technologies by 2% of respondents.
P a g e | 26
Figure 4.6. Use of GNSS accuracy and farm type. n = 204 for Total, 107 for Grains and 72 for Grain/livestock
The grains industry uses more high accuracy (<3 cm) and less medium accuracy (3-30 cm)
positioning than the grain/livestock industry. All nine cotton growers use <3 cm positioning and of the four horticulture growers, two used <3 cm, one 3-30 cm and one >30 cm positioning.
The benefits from investing in GNSS positioning equipment reported by growers were:
• Reduced labour and time requirements (48%); • Reduced operator stress (31%); • No overlaps or misses (26%); • Efficiencies (25%); and • Accuracy (16%).
The responses indicate that positional accuracy is the least important benefit of using GNSS from a grower’s perspective. However, <3 cm positional accuracy is a fundamental requirement for CTF adoption, pointing to an important knowledge gap at the user end (Figure 4.7).
P a g e | 27
Figure 4.7. Benefits of investing in GNSS positioning equipment
Problems reported by GNSS positioning users were ranked from most to least important as
shown in Table 4.1. Seventy eight percent of growers surveyed who use GNSS positioning reported a range of problems, the most significant being satellite “drop out” (45%) followed by failure to achieve the desired accuracy (17%).
Problem %
Satellite drop out 45
Accuracy 17
Reliability 7
Compatibility with other equipment 6
Repeatability 5
Servicing 4
Complexity/ Not User Friendly 4
Software / System Malfunction 3
Variable standards 3
Breakdowns 2
Screen Failure 2
Restart times 1
Don't know 1
Manoeuvrability 0
Cost 0
Table 4-1. Problems reported by GNSS positioning users
P a g e | 28
It is a reasonable expectation that with any new technology, user problems will arise. For example positioning problems can arise from a range of factors that are not immediately obvious to a user such as GNSS base-rover pair range effects on RTK accuracy, unpredictable solar/upper atmosphere effects and position correction signal latency. In the absence of specific information, such problems are often described as “satellite dropout” (refer to Glossary).
It is also reasonable to combine the survey responses for problems about accuracy (17%) and
repeatability (5%) (refer to Glossary for definitions of accuracy and repeatability) for a total of 22% of problems relating to positioning outcomes experienced by growers. Anecdotal evidence of confusion about scientific terms used in relation to GNSS such as accuracy and precision combined with PA industry specific terms such as repeatability, pass to pass accuracy, and year to year accuracy, is well known. Such terms are used in a wide range of equipment brochures and related information and frequently quoted to prospective purchasers without qualification.
Improved education of lay GNSS users in the PA industry about satellite positioning and measurement terminology will help reduce and/or correctly identify problem reporting in the future.
Survey responses to Sources of advice for satellite guidance (Figure 4.8) indicated dealerships
were the most common source of advice in all states (43%). In Figure 4.8, Neighbours (12%) are combined with Relatives (5%) to form the category “Friends” (17%), the second most common source of advice in relation to positioning matters.
Figure 4.8. Sources of advice for satellite guidance (number of respondents, 268, expressed as %)
Linked to the previous question, survey responses to Level of satisfaction with level of support
(from GNSS advice provider) revealed 89% of growers who use GNSS positioning technology reported they were either satisfied or very satisfied with their GNSS advice provider (Figure 4.9).
P a g e | 29
Figure 4.9. Level of satisfaction with GNSS advice provider (number of respondents expressed as %)
Survey responses to Sources of support for GNSS problems (Figure 4.10) revealed that, when
problems arose, 76% of growers reported going to their dealership for assistance. Other sources of support included machinery consultants, agronomists and the internet were 12% or less, while 8% of growers reported having “no problems” with their GNSS equipment.
Figure 4.10. Sources of support for GNSS problems (number of respondents, 212, expressed as %)
P a g e | 30
Survey responses to Level of satisfaction with level of support (GNSS problem resolution) indicated that 81% of growers were satisfied or very satisfied with the level of support provided to resolve a GNSS problem when needed (Figure 4.11).
Figure 4.11. Level of satisfaction with level of support (number of respondents expressed as %)
Survey responses to Use of own base station or subscriptions? (Figure 4.12) compares the
relative adoption of owner-operated GPS/GNSS base stations, to subscriber access to a service provider, or a combination of both, across industry sectors, state jurisdictions, and as a total. Victoria has a comparatively low rate of GNSS base station ownership (29%) and comparatively high (58%) subscriber rate in contrast to both NSW and Qld. This could be explained by the early CORS network (GPSnet) rollout, expansion into rural areas and then promotion by the Victorian Government and Value Added Resellers compared to the other jurisdictions.
Figure 4.12. Use of own base station and subscriptions. n = 212
P a g e | 31
4.1.2 Awareness of State-based positioning networks
Have you heard of state GPS networks? (e.g. government CORS networks CORSnet-NSW, Vicmap Position GPSnet and SunPos,) (Figure 4.13), responses varied from a high of 49% in Victoria to a low of 7% in Queensland. It should be noted that SunPos does not extend into the FBA region. The overall awareness result across NSW, Qld and Vic was 30%, representing just 63 growers out of 212 who use GPS positioning equipment. Since the survey date, CORS network coverage has significantly increased, particularly in NSW, and this can be expected to increase overall awareness.
Figure 4.13. “Have you heard of {state} GPS network?”
Growers who were aware of government CORS networks reported that the factors most likely to influence take up were price (43%), coverage (24%), improved accuracy (27%) and level of dissatisfaction with current GPS solution (8%).
Fifty four percent of growers who were aware of government CORS networks were unsure of the
strengths, with a further 11% reporting there were no strengths. Other growers reported the strengths as accessibility/coverage (19%), increased accuracy (11%) and cost effectiveness (8%).
Of those who knew about the networks but didn’t use them (only n=22), the reasons reported
were that they couldn’t see a benefit (36%), it wasn’t available in their area (32%) and cost (27%). The main influencing factors that would induce these growers to use government CORS networks were price (43%), improved accuracy (24%) and available coverage (24%). Other influencing factors that would deter growers from using these networks were complexity of use (10%), happy with current approach (8%) and suspect reliability (8%). The majority of respondents felt that there was potential to use other government data and services in combination with on-farm positioning services (65%).
Growers were also asked about the weaknesses of CORSnet-NSW/SunPos/Vicmap Position
GPSnet. Sixty five percent reported they were unsure of what the weaknesses of the systems were, 13% reported cost and 8% coverage/interference.
P a g e | 32
When asked for the perceived benefits of these systems, growers reported greater accuracy (24%), accessibility and coverage (13%), no benefits (11%), and don’t know (48%). With almost half the survey respondents not knowing what the benefits of CORS were, the need and opportunity for CORS related information to be made available to potential users is clear. The responses particularly highlight knowledge gaps relating to availability of government CORS networks, their coverage and benefits.
4.1.3 Farmers who don’t use GPS Technology
When surveyed about Reasons for not using GPS technology by state (Figure 4.14), 22% of the growers, and 29% of contractors, reported that they did not use GNSS. Their reasons included:
• No need for the technology (49%); • Cost was too high (32%); • Not suitable for their operation (12%); • Little or no benefit (14%); • Needed more information (7%); or • It was too difficult (11%).
Figure 4.14. Reasons for not using GPS technology by state
P a g e | 33
When surveyed about the GPS accuracy required for future purchase by farm type (Figure 4.15), responses included 57% of the non-users who indicated they intended to use it within the next 5 years to achieve:
• Convenience/time saving; • Improved productivity; • Less operator errors; • Electronic history storage; • Less operator stress; • Cost saving and upgrading equipment.
When asked what accuracy they would buy, 36% said <5 cm, and 48% did not know. This survey result reveals a trend towards increasing adoption of GNSS technology and also for
high accuracy positioning. However the responses also indicate that such adoption is for reasons other than to support CTF.
Figure 4.15. GPS accuracy required for future purchase by farm type (% of growers)
Importantly the survey responses show that over 90% of growers will use GNSS within a few years. The challenge will be to adequately inform growers and guide them towards appropriate GNSS technology such as NRTK and also to adopt appropriate CTF practices. Personal, business and operational benefits enabled by high accuracy satellite positioning will become complementary rather than primary goals.
P a g e | 34
4.1.4 State based conclusions
Victoria
Victoria led Australia in the establishment of a jurisdiction wide, state government operated and managed, cooperative CORS network (GPSnet) from the mid 90’s onwards. The Victorian government also led the trialling of GPSnet NRTK corrections for agriculture and subsequently supported research and development to specifically support CTF. The success of NRTK trials using mobile delivery via the internet, combined with the identified market failure/duplication of GPS/GNSS infrastructure, together with the publication of the report on economic benefits of high resolution positioning by Allen Consulting (2008), encouraged the Victorian government to further invest in expanding GPSnet coverage. The Positioning Rural Victoria (PRV) project achieved state-wide CORS coverage in 2011.
The PRV project secured funding from federal (Auscope) and state government (regional
development and primary industries) and engaged directly with key CTF thought leaders, CORS network champions and partners for its application to PA. The PRV project included GPSnet CORS network data processing centre duplication and receiver upgrades to full GNSS capability and network processing to provide a reliable, robust and effective service for multimodal use and commercial exploitation by the private sector. GPSnet adoption in the PA industry was performed in partnership with VARS that were typically PA equipment dealers. Key agronomists were also informed about the benefits of GPSnet in support of the VAR strategy. The VAR approach has proven to be successful. However existing farmer investment decisions to own and operate GPS base stations prior to CORS network availability, combined with aggressive marketing from agricultural machinery dealers in support of company funded clusters of non-networked GPS base station/s and or proprietary SBAS services has constrained uptake.
A key barrier to the migration from owner-operated GPS base stations and first time adoption of
CORS network services and NRTK specifically for CTF, from a Victorian perspective, centres on combating avoidable confusion in the PA market about the benefits or otherwise of RTK versus NRTK services and their respective providers. An ongoing authoritative and definitive education and awareness program directed at growers, grower groups, grower advisers/agronomists, PA machinery dealers, and CTF/PA associations would be considered a major step forward in the removal of a key barrier to CORS network and CTF adoption in Victoria. The standardisation, adoption by agricultural manufacturers, and promotion to growers of specific machine wheel widths to support PWT for CTF practice combined with clear and comprehensive information about how to perform CTF and maintain PWT would be equally important.
NSW
On 26 August 2011 (around the time of the SIARA survey), CORSnet-NSW added its 65th station. By 21 November 2013, this had risen to 139 active stations. The lower number of stations and area of coverage at the time of the survey (as shown in Figure 2.3) would have contributed to lower awareness of CORS networks in NSW. The NSW survey results showed a low level of awareness of government CORS networks with only 12% awareness in Moree, 7% in Narrabri and 33% in the Griffith survey areas. These areas were chosen to include a mix of key agricultural users (i.e. ‘Grain Specialist’, ‘Grain / Livestock’, ‘Cotton’, ‘Grapes / Wine / Orchard’ from the Kaliber database of contacts). The CORSnet-NSW network was not then established in these areas. Awareness is expected to have been improved by attending ‘field days’ (which bring together growers, agricultural dealers and advisers) and ‘roadshow’ visits by CORSnet-NSW staff focussed on agricultural dealers. This work, together with some regional newspaper publicity, should have improved awareness, especially in the surveyed areas of Moree and Narrabri.
P a g e | 35
A major barrier to the use of Government run CORS networks is the perceived level of support
and service that will be provided. LPI explored alternative avenues for delivering correction services to users via commercial arrangements. This was aimed at increasing the number of users and to extend helpdesk service availability. The hours of support provided by resellers exceed the business hours support previously available.
Significant work was undertaken by LPI to improve the resilience of existing services to foster a
reputation of high reliability. Reporting to resellers and interested parties on availability has undergone some improvement.
P a g e | 36
4.2 Quantitative Grower Survey of Cropping Practices
The survey obtained grower comments to measure the current adoption of CTF and identify barriers to further adoption. The key aspects measured were:
• What cropping practices are used, what are the realised benefits and problems? • How do farmers use PWT, the basic component of CTF; is this linked to GPS use; and
does PWT and GPS use increase wider adoption of improved practices? Survey responses to Use of Cropping Practices (Figure 4.16) shows that Zero till is the most
widely used PA practice and Variable Rate Technology (VRT) the least. Three spatially based practices (PWT, Inter-row sowing and VRT) are least used, and the simplest technologies (yield monitor and computer records) are in moderate use.
Figure 4.16. Use of cropping practices as % for all growers (n = 222), grains industry (n = 118) and grains/livestock
industry (n = 104)
Zero till was introduced some 30 years ago. Zero till has been heavily supported by research and grower groups and more recently the taxation system through the “Conservation tillage refundable tax offset” where the federal government offers a refundable tax offset for purchase of an eligible no-till seeder, used in conservation tillage farming practices.
Computer records are largely for financial purposes and few are related to spatial technology
use. PWT and inter-row sowing have similar adoption. Except for zero till, the grains industry is a higher adopter of spatially and non-spatially enabled cropping practices than the grains/livestock industry.
Overall the responses indicate that growers have adopted Zero Till for cropping but not spatially-
based practices such as PWT, inter-row sowing and VRT. Compared to GNSS uptake, new cropping practice uptake has been very low. This may be due to growers being able to quickly achieve savings on inputs such as fuel, fertiliser and weedicide by enabling agricultural machine auto-guidance using GNSS. By comparison, encouraging change to contemporary, spatially based cropping practices with less obvious and longer term benefits is more difficult.
P a g e | 37
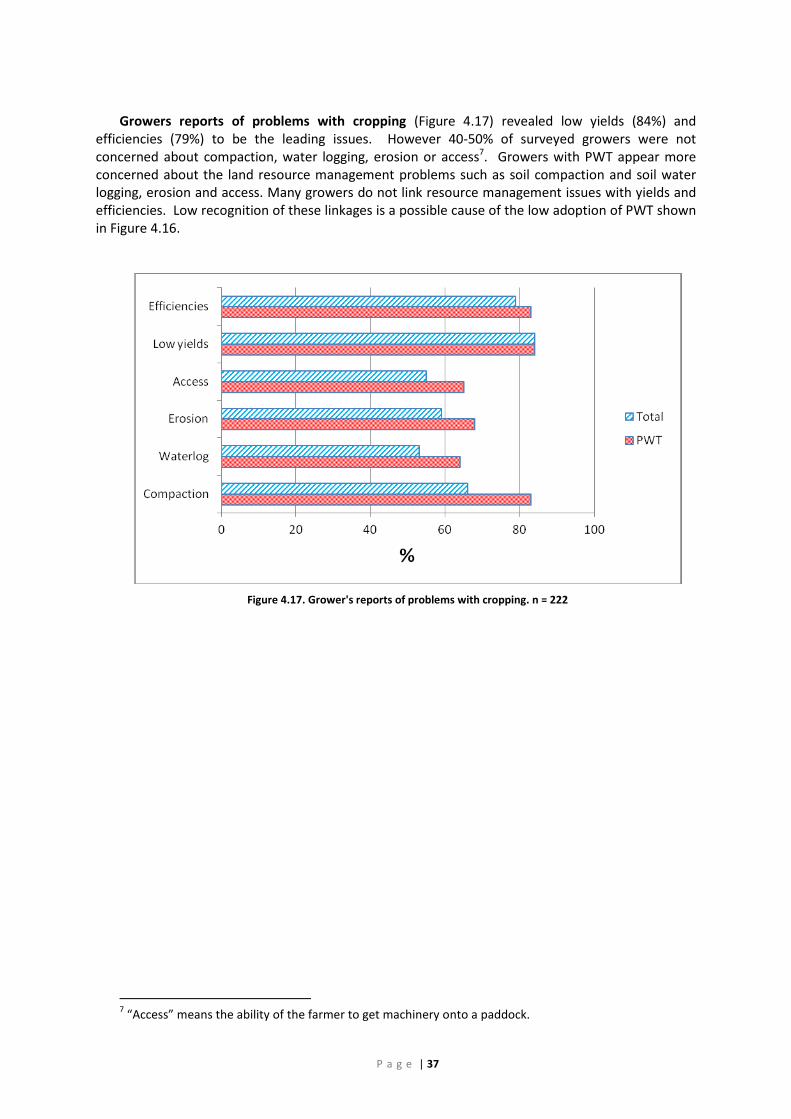
Growers reports of problems with cropping (Figure 4.17) revealed low yields (84%) and
efficiencies (79%) to be the leading issues. However 40-50% of surveyed growers were not concerned about compaction, water logging, erosion or access7. Growers with PWT appear more concerned about the land resource management problems such as soil compaction and soil water logging, erosion and access. Many growers do not link resource management issues with yields and efficiencies. Low recognition of these linkages is a possible cause of the low adoption of PWT shown in Figure 4.16.
Figure 4.17. Grower's reports of problems with cropping. n = 222
7 “Access” means the ability of the farmer to get machinery onto a paddock.
P a g e | 38
Survey responses to The impact of PWT and GNSS accuracy on use of other practices are summarised in Figure 4.18. The Y-axis of the graph shows the farming practices of interest while the X-axis shows percentage adoption. The variables under consideration are “Total” adoption, “PWT” adoption, “GNSS” adoption, High accuracy GNSS adoption (“<3 cm”) and Medium accuracy GNSS adoption (“3-29 cm”). The chart shows, for example, that Zero Till has the highest Total adoption of all practices and that over 90% of Zero Till farmers are claiming to use PWT. At the same time, only about 70% of the Zero Till farmers are using GNSS, with approximately equal numbers of GNSS users employing High accuracy and Medium accuracy GNSS positioning8.
Further, the survey responses revealed that growers using PWT and High accuracy GNSS (<3 cm)
have increased use of other practices. The increase is highest for PWT and inter-row sowing, the two practices that require high accuracy guidance. Sixty two percent of PWT users have adopted inter-row sowing compared to the overall adoption of 35%. More PWT users also use zero till (95% compared to an average of 73%). By contrast the 34% of growers using Medium accuracy GNSS (3–29 cm) had no higher adoption of any practice. The survey responses imply that the adoption of RTK/NRTK and PWT practices supports much higher adoption of improved cropping practices.
Figure 4.18. The impact of PWT and GNSS accuracy on use of other practices. n = Total (222), PWT (75), GNSS (204), <3
cm (120), 3-29 cm (69)
8 It is clear that these results, based solely on respondent feedback, contain contradictions. For example PWT adoption requires high accuracy GNSS, but the results indicate that more farmers claim to use PWT than are using high accuracy GNSS. This highlights the confusion that exists in the industry with regard to these technologies and their requirements.
P a g e | 39
Survey responses to The use of PWT for operations on grain and grain/livestock farms question are summarised in Figure 4.19. Three different farm operations are shown on the Y-axis and % adoption on the X-axis. The variables under consideration are “Total” PWT adoption, PWT adoption by “Grains” only farmers, PWT adoption by mixed “Grains/livestock” farmers, High accuracy GNSS adoption (“<3 cm”) and Medium accuracy GNSS adoption (“3-29 cm”). The chart shows, for example, that “Spraying” is the farm activity that employs PWT, and that for this activity, Grains-only farmers have a higher adoption rate than the Grains/Livestock farmers.
Again, the information on complementary GNSS usage is contradictory in that PWT usage
demands high accuracy GNSS, but a considerable proportion of users are reporting that they use medium accuracy GNSS. Further, the results to this question indicate that the use of PWT for harvest was much less than for sowing or spraying (41% compared to 80–90%) suggesting that the same wheel tracks are not used for all operations. The high use of PWT for sowing and spraying indicates that growers recognise the value of PWT. PWT use is also generally higher in the grains industry than grains/livestock, and much higher with <3 cm GNSS than medium accuracy GNSS in the 3–29 cm range.
Figure 4.19. The use of PWT for operations on grain and grain/livestock farms. n = 95
Growers recognise the value of PWT but still tend to use a mixture of machinery with different (2m and 3m) wheel track widths, leading to sub optimum outcomes for CTF and highlighting the need for improved information and education of existing practitioners. The grains/livestock industry has adopted PWT for sowing and spraying but not for harvesting, the latter becoming another target for improved information and education.
P a g e | 40
Survey responses to Wheel track width of tractors (sowing), sprayers and harvesters are shown in Figure 4.20 to further clarify PWT usage. Growers use either 2 m or 3 m wheel track widths for sowing and spraying, with similar adoption rates, and 3 m for harvesting (noting that only 5 growers used harvesters with 2 m wheel widths). Standard grain harvesters are 3 m and cotton 2 m.
Figure 4.20. Wheel track width of tractors (sowing), sprayers and harvesters. n = 91
Thirty four percent of all growers (i.e. 34% of 222 = 75) report using PWT (Figure 4.16). Of these 75 growers, 36% (I.e. 12% of all growers) use tractors with 3m wheel spacing, and 38% (13% of all growers) use sprayers with 3m wheel spacing (Figure 4.20). Assuming these growers with 3m wheel spacing also use 3m for harvesting, the use of PWT for all operations across all growers is 12 – 13%. The remaining 21-22% of growers who report “using PWT” in practice have a mixture of 2m and 3m machinery. This highlights that larger industry surveys, such as ABS and GRDC which only ask “do you use PWT or CTF?” are probably over reporting adoption. The use of PWT is summarised in Figure 4.21.
Figure 4.21. A summary of PWT use
The survey could not identify and analyse the characteristics of growers using 3 m for all operations.
P a g e | 41
The 21% “PWT 2m and 3m” Growers, and presumably their advisers, are obviously confused about PWT. Growers using both 2 m and 3 m tracks cannot achieve the full benefits of CTF. Harvest traffic will destroy much of the soil benefits created during crop growth; will be less efficient since the harvester wheel tracks are not compacted and make zero till, inter-row sowing, VRT, yield monitoring and crop measurements more difficult. Outcomes can be expected to be lower yields, inefficiencies and poorer soil health as depicted in Figure 4.17 and the system wide benefits of profitability and sustainability will not be fully achieved. Harvesters have different wheel spacing across the grain, cotton and horticulture industries. This restricts options for growing multiple crops on PWT. Machinery standards across all cropping industries are needed. The availability of a standard machine chassis or wide span tractors could overcome these issues. The survey responses indicate shortcomings and opportunities concerning machinery standards and PWT/CTF adoption:
• 66% of growers have no PWT (Figure 4.21), a major shortcoming for CTF adoption; • 21% of growers adopt “ PWT 2m and 3m” (Figure 4.21) leading to soil compaction and
unrealised benefits; • varying machinery wheel spacing (Figure 4.20) is a shortcoming for PWT adoption,
highlighting the need to investigate machinery wheel space options and standards across cropping industries; and
• the opportunity exists to use the 13% of growers correctly implementing PWT (Figure 4.21) as case-studies and mentors for broader CTF adoption.
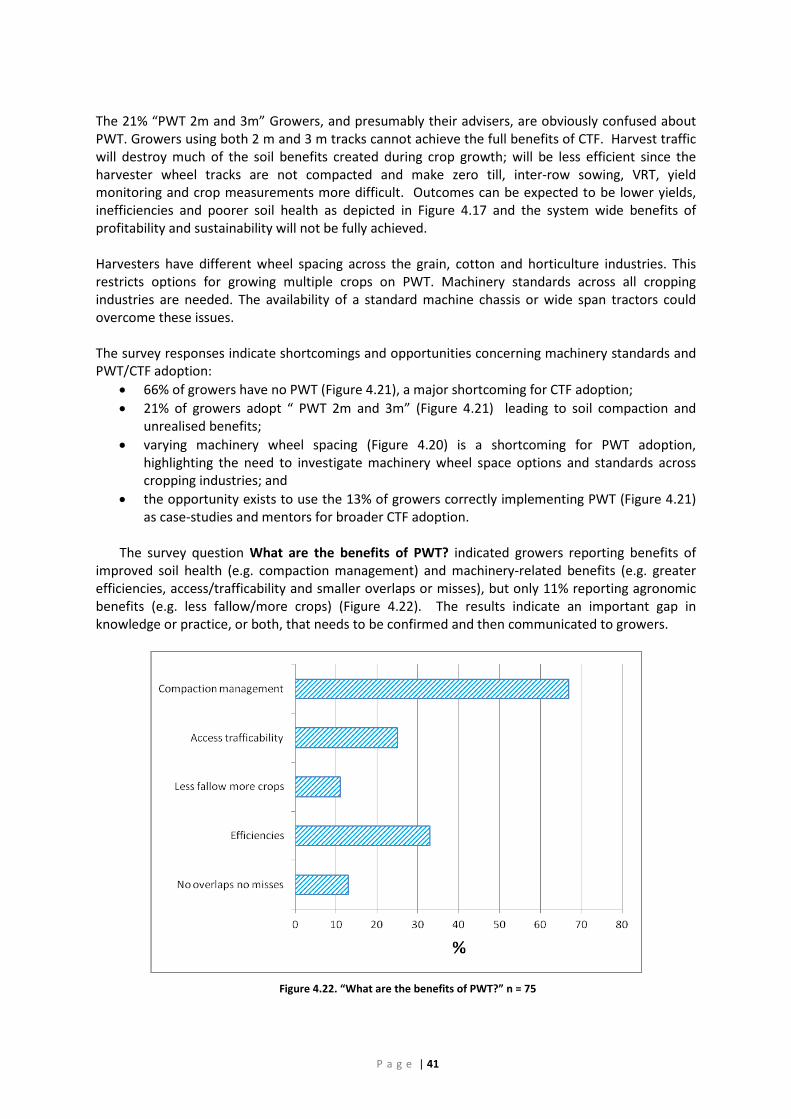
The survey question What are the benefits of PWT? indicated growers reporting benefits of
improved soil health (e.g. compaction management) and machinery-related benefits (e.g. greater efficiencies, access/trafficability and smaller overlaps or misses), but only 11% reporting agronomic benefits (e.g. less fallow/more crops) (Figure 4.22). The results indicate an important gap in knowledge or practice, or both, that needs to be confirmed and then communicated to growers.
Figure 4.22. “What are the benefits of PWT?” n = 75
P a g e | 42
PWT users recognise that PWT is a solution to the soil and machinery problems listed in Figure 4.17, but growers are not reporting agronomic and productivity benefits for the main farm problems of low yields and cropping efficiencies. The survey responses indicate that the wider farming systems benefits of PWT are not being achieved. “PWT 2m and 3m” users in Figure 4.21 may be a reason for this outcome.
The survey question What problems do growers have with PWT? revealed that 88% of growers
are experiencing problems with PWT including9: “get deep” (41%) and other problems totalling about 20% including; “get rough”, wet spots, erosion, compaction and weeds (Figure 4.23).
Figure 4.23. What problems do growers have with PWT? n = 75
The responses indicate a similar proportion of benefits to problems. Perceived and actual problems are both barriers to the adoption of CTF. Current advice to rotate tracks10 for spraying and use designed layouts to ensure drainage of PWT, aim to address these issues. However further research is needed to clarify the problems and to assess if the currently advised options reduce them. With PWT, the wheel tracks should be managed as a distinct zone.
9 “Get deep” Wheel tracks get unacceptably deep over time, relative to cropped zones, due to compaction
and erosion “Get rough” Wheel tracks get rough over time due to machine bounce, making them unsuitable for use “Wet spots” Water collects in wheel tracks due to poor drainage, causing get deep and get rough problems “Erosion” Excess water runoff (caused by poor layout and/or water management) gouges wheel track “Compaction” Soil compaction caused by repeated driving over the same tracks “Weeds” Hardy and sometime weedicide resistant plants grow in the wheel tracks which can then
germinate elsewhere, particularly in the crop growing zone.
10 If sprayer width is 2 or 3 times the width of the planter and the sprayer is used multiple times during the season, “rotate tracks” means using different planter tracks for each spraying session. Benefits include all tracks are evenly compacted for the harvester. Using dedicated spray tracks will cause them to become deeper and non-used tracks will become softer – leading to problems with access.
P a g e | 43
In relation to PWT Set-up survey responses showed that growers (n = 75) reported that 34% used RTK GPS, 14% used contractors with GNSS (possibly RTK), 29% used other GPS/unspecified, 10% used marker arms (device that leaves a physical mark on the ground that guides the next pass of the machine), 6% used repeated driving, and 4% used A/B lines.
These results suggest that up to 50% of PWT set-ups can be expected to be the result of high
accuracy GNSS (RTK GNSS, contractors with GPS and A/B lines) and about 40% used less accurate guidance (other GNSS, marker arms and repeated driving). Earlier survey results (Figure 4.6) inferred that many growers may not know the accuracy being achieved by their GNSS.
In relation to Use of grazing by PWT growers 13-28% of respondents report stock grazing in
cropping paddocks before planting and after harvest (Figure 4.24). The survey showed that grain/livestock growers graze stock more than grain growers particularly after harvest.
Figure 4.24. Use of grazing by PWT growers. n = Total (75), Grains (52), Grain/livestock (23)
Grazing compromises the benefits of soil health, zero till and inter-row practices, all achieved from adopting PWT. It is encouraging from the point of view of soil compaction avoidance that so little grazing was reported. From the responses it is clear that PWT users in the grain industry have largely rejected grazing as a component of their cropping systems. No information was obtained on grazing from non-PWT growers.
P a g e | 44
Paddock layout. The survey found that 95% of the 75 PWT growers farmed up and back11. Of these PWT growers farming up and back, 48% farmed downslope, 26% farmed across slope and 40% didn’t know (this could mean a combination). The downslope adoption could reflect growers with 3 m PWT and suggests that 52% of growers have not received appropriate farm layout advice. The survey indicated that the majority of PWT growers have not sought (or perhaps have not needed) farm layout advice.
Use of Computer Record Keeping. The 56% of growers (Figure 4.16) with computer records use
over 20 different computer programs, and 19% reported they didn’t know which software they used. The most popular packages identified by respondents were Phoenix 20%, PAM 11%, Quicken 9%, Excel 6%, Microsoft 6%12, Quick Books 5% and Cash Manager 4%. These tend to focus on financial and paddock/farm performance and programs with detailed spatial data analysis capability is just 2%. The major GNSS providers, Trimble (including CASE) and John Deere, are now providing software with spatial capabilities. The survey responses indicate that few growers have computer software with spatial data analysis capability, potentially constraining the uptake of high accuracy GNSS and CTF.
Inter-row sowing is of interest because it requires <3 cm GNSS guidance and PWT to achieve
sowing between previous crop rows. Seventy eight growers reported use of Inter-row sowing. Of the 78, 40% use GNSS (with 22% <3 cm high accuracy), and 61% use PWT (Figure 4.18). While these reports confirm that growers need GNSS and PWT to achieve Inter-row operations, 39% claimed to do Inter-row sowing without PWT and 18% without <3 cm guidance. More information is needed to determine if the 39% claiming to practice Inter-row sowing without PWT and 18% without high accuracy GNSS are actually achieving the desired outcome and how they do this, if indeed they do. It is more likely that the survey responses indicate over-reporting of Inter-row sowing adoption as a result of grower confusion, similar to the PWT case noted in Figure 4.20. It is likely that many growers are practicing Inter-row sowing inappropriately and thus become candidates for better information on how to achieve PWT.
The survey also asked about problems with and benefits of Inter-row sowing. Problems were
identified with: machinery13 45% (accuracy14, cost15, blockages16, holding track17, GNSS drop-out, accessibility and old equipment18), and agronomy 17% (heavy stubble, weeds and disease). Forty percent reported no problems.
Benefits reported were machinery 42% (efficiency, accessibility, convenience and ease), soil
health 40% (improved soil, stubble retention) and agronomy 32% (higher yield, water management and disease control). Four percent reported no benefits.
11 “Up and back” means that the machinery is turned 180° at the end of each run and returns along a path
parallel and adjacent to the previous run. The less preferred historical alternative is to drive in concentric loops around the paddock.
12 “Microsoft”, a generic software term used by some respondents. 13 Machinery - machines, equipment and implements. 14 Accuracy - the ability to sow inter-row, i.e. between the previous crop rows – refer to top right hand
image on front cover of this report. 15 Cost - relates to machinery changes which are typically easy and cheap if the grower is already adopting
PWT 16 Blockages - interference from previous stubble, due to not being in the inter-row space or previous
stubble knocked into the inter-row by machinery or graving. Refer to top right hand image on front cover of report noting how “clean” the inter-row is.
17 Holding track - machines staying in the PWT 18 Old machinery - machinery needing replacement
P a g e | 45
In summary similar numbers of growers report machinery problems and benefits. The reported benefits are system benefits and solutions to the problems identified in Figure 4.17. The reports of higher yields are particularly significant.
Responses to the survey question seeking Reason given by growers for not using PWT? revealed
machinery and cost (52%), not suited to the farm operations (43%), and no need/no benefit (22%) as the main reasons (Figure 4.25). Such reasons most likely highlight perceptions and misconceptions by growers that are best addressed at the individual grower level through improved “one on one” education and awareness processes leading to adoption and change particularly of practices and culture.
Figure 4.25. Reasons given by growers for not using PWT. n = 171
PWT growers reported achieving benefits (Figure 4.22) and overcoming implementation issues but that knowledge needs to be communicated to those who are either not adopting PWT at all, or are informing the 21% (Figure 4.21) not practicing PWT correctly. Future information programs targeting prospective PWT growers need to ensure correct implementation and the avoidance of implementation issues.
P a g e | 46
Survey responses to Sources of advice regarding cropping practices indicated 88% of growers use agronomists, 25% the media (which includes the internet), 17% grower groups and 9% DPI (Figure 4.26). Growers predominantly use one-on-one contact particularly with agronomists for advice on cropping practices.
Figure 4.26. Sources of advice regarding cropping practices? n = 268
Sources of advice regarding new technologies such as electronics, information technology and
spatial information was surveyed and growers reported using one-on-one contacts (reseller and reseller agronomist, machinery dealer consultant and friends 76%) and mixed media (internet, field days and media 69%) but these are diverse groupings. By comparison grower groups are a much less significant source of advice at 22% (Figure 4.27).
These results suggest that media sources are an important avenue for growers to access advice
about new technologies. However growers also rely on a diverse range of other sources.
Figure 4.27. Sources of advice regarding new technologies
The survey responses indicate that growers rely on multiple information channels to stay informed about new technologies and that a broad based approach is needed to inform modern farmers about contemporary technologies they plan to use and provide the one-on-one delivery sources that growers prefer.
P a g e | 47
Industry Sectors
Contractors
The details of the contractors surveyed are included in Chapter 3. Contractors differ to growers in machinery operated, use of GNSS, PWT, software, sources of advice, and are younger (41.6 to 50.7 years). PWT growers use contractors mainly for harvesting (61%) and spraying (24%), and 28% do not use contractors. These growers report that contractors use their (the growers’) PWT all the time (41%), some of the time (27%) and never (32%). Thirty three percent of growers reported no problems but 52% reported problems with machinery19. Grain/livestock farms use contractors more than grains.
Contractors are a large part of the grain industries, harvesting 260,000ha each year, but only
30% use PWT with <3 cm GNSS. Contractors with PWT machinery can service non-PWT farms and this happens for harvesting. There are examples in grain and cane growing of contractors offering all services on PWT to optimise use of their modified harvesters.
Contractors are currently low adopters of high accuracy GNSS and PWT but could become
leaders for change by setting up PWT at harvest, particularly in the grain/livestock industry.
Grains and Grain/livestock Industries The Grains industry is a higher adopter of improved practices than the Grains/livestock industry.
The solutions developed in Grains should be transferred to Grains/livestock. The survey provides details of specific issues with grain/livestock growers and contractors.
4.3 Qualitative Surveys
Two qualitative surveys were conducted, one with GNSS equipment dealers/distributors, the other with agronomists addressing CTF and cropping practices.
The qualitative surveys involved a small number of respondents but provided valuable
perspectives as each respondent had several clients across large areas. Recall that the earlier reported quantitative surveys found that GNSS dealers/distributors and agronomists are the most important advisors to growers.
The qualitative surveys are discussed below in relation to:
• grower understanding of GNSS and CTF practices; • grower understanding of GNSS and CTF system applications; • grower investments; and • services provided.
4.3.1 GNSS Equipment Dealers and Distributors
Collectively the respondents operated across the cropping areas of eastern Australia and in the last 12 months had supplied 29 base stations, 213 guidance systems and 153 auto-steer units (mainly retro-fit). Most growers sought entry-level GNSS equipment but interest in advanced
19 Problems with machinery related issues – survey responses were machine widths (25%), wheel tracks (15%), not sticking to the tracks (10%), compatible GPS (6%) and 5% for availability , cost, and compaction. The average across planting, spraying and harvest is 33% use by grains and 44% by grains/livestock
P a g e | 48
systems was increasing. Subscriptions to satellite position correction services are now more common than individual base station ownership. One distributor had 450 subscribers.
GNSS dealers and distributors have engineering competencies and do not advise about on-farm
applications (seen as agronomic services). Their services now cover a range of complementary products such as yield monitoring and variable rate applications. Services are changing as machinery manufacturers offer more GNSS equipment and new tractors now have GNSS and auto-steer built in as standard.
GNSS dealers and distributors’ responses to increasing adoption included: • Cost, ease of use and ease of setup are considerations but costs are coming down and most
new machinery has some GNSS built in. Dealers generally offer the complete range from entry-level to sophisticated systems.
• Basic aspects of accuracy, reliability, and service and support are understood, but growers are now looking to upgrade to advanced applications such as precision farming but the benefits are not clearly demonstrated (from the dealers perspective).
• Dealers only offer advice on GNSS and expect agronomists to offer advice on applications. • The main benefits of GNSS are reduced overlap, reduced stress and fatigue of operators, and
reduced input costs. • Government networks are not widely recognised and concerns were expressed about
reliability, availability, pricing, servicing, coverage, State border impacts, and access to information.
• GNSS subscription services are now much more common than owning base stations. Supply of equipment will probably reduce but servicing will increase. Increasing use of subscriptions is an opportunity for CORS network correction service suppliers. The qualitative survey of agronomists and dealerships highlighted that service is a key barrier to wider adoption and utilisation of GPS systems. Comments included “Clients who use GPS struggle to keep them running”, “There’s a real lack of knowledge on how it works” and “The skills are not there, particularly in back-up and service”. Servicing GPS technology is a new area of business for many machinery dealerships and some feel it is not their area of expertise. Further utilisation of GPS is also stagnated by this lack of knowledge: “Once you get past auto steer, a lot of growers struggle with ‘what am I going to do next, how am I going to utilize the technology moving forward’.”
• Growers seek different accuracies to suit their particular farming application but adoption of higher accuracy RTK position correction is increasing. Dealers have the skills to match needs to solutions and said they are confident of the achievable accuracy and repeatability of their products.20
• The dealers’ role is to supply the equipment, set it up and ensure it operates. This is expanding to include new hardware/software to measure (including height), map and automate more farming operations and to handle the vast amounts of data that are generated. Dealers are comfortable with these specialist hardware/software services, and some specialists can process, interpret and provide advice based on the information.
• Dealers are very confident that their products are effective and reliable and offer new products (higher accuracy, yield monitoring and variable rate). Products are generally
20 Commercial interest has resulted in some misinformation about the level of accuracy achieved. This has
resulted in the benefits of government networks being under-promoted.
P a g e | 49
aligned with one supplier and they don’t see compatibility as a big issue. They supply everything that is needed.
• The following challenges are limiting the uptake of GNSS positioning and PWT in agriculture: − cost of technology; − improvement of CORS network reliability and accuracy; − increasing trend towards tractor and implements sold with on-board “precision”
equipment; − predisposition of farmers to work together with base station sharing; − longevity of after-market systems and equipment; − incompatibility of technology brands; − potential increase in automated implement set up and operation; − uptake of research results and the comparative demand for private versus public
funded trials; and − upgrading of broadband and telephone networks across rural Australia.
The survey responses indicated that dealers and distributors: • are concerned about machinery manufacturer actions; • are not confident to recommend CORS quality and support to growers; • think growers don’t understand the technologies and have poor information support; • are dependent on supply companies for technical information, advice, training and support,
but want more whole of industry information about technology, innovations and competitor offerings;
• have preferred communications channels that differ from agricultural channels; • face rapid changes and struggle to keep up with those changes; and • want more technology demonstrations to encourage PA industry wide adoption.
The survey responses indicate that future information programs should focus on making GNSS CORS network related information available to support dealers supplying solutions to the precision agriculture industry that:
• are centralised and authoritative (particularly about CORS network quality and support); • integrate with a whole of agricultural industry approach; and • demonstrate the benefits to consolidate industry wide support.
4.3.2 Agronomists
Eighteen agronomists were interviewed covering private, re-seller, public (government), PA and GIS advisers and grower groups from across eastern Australia. Agronomists on average had 70 clients, covering an area of 100,000 ha and serviced a broad range of grain crops and cotton growers. Agronomists surveyed were much younger than growers; 77% between 25 and 44, and 23% between 45 and 65. Eighty seven percent were university graduates.
The Qualitative Survey of agronomists focussed on cropping and farm management practices. Agronomists’ responses to increasing adoption of CTF were:
• Agronomists are aware of GNSS, PWT, machinery and improved practices and benefits but they report little in-depth knowledge, poor access to information and poor understanding.
• Agronomists specialise in agronomy and cropping systems but not farming systems that include GNSS, PWT and machinery. In general agronomists are not confident with spatial technologies and practices or the applications and benefits of holistic farming systems.
P a g e | 50
• CTF and cropping practice aren’t core business for agronomists (or dealers) and growers have few sources for advice and support. There is no clear process to support farming system adoption.
• Agronomists provide advice and growers make the decisions, generally following the recommendations. Agronomists also research innovations for growers within their core business, and seek information, training and up-skilling from the public sector (Government, grower groups, Universities) and multi-media.
• Agronomists lack support services for the new farming system technologies and practices. Applications are seen as more and more complex.
• Agronomists have tools to assess the economics of linear cropping practices but not for farming systems where sharing, contracting and partnerships are often efficient.
• Agronomists have well-established access for core business activities but need new services if new technologies and practices are to become core business. This will involve new support services and possibly new business structures.
• Adoption processes. Current processes do not suit the new technologies particularly within a systems structure that has many components and interactions.
Agronomists, as key advisers to growers, should, as a part of their normal business service, be
able to offer advice on GNSS and CTF. However the survey indicates more information needs to be made available to them.
4.3.3 Qualitative Assessment of GNSS Dealers/Distributors and Agronomists in Summary The market has become more specialized over the past 5 years or so with the proliferation of
highly specialized equipment and technologies to measure map and automate more and more in farming operations. This has meant that the traditional roles of agronomist, manufacturer and distributor have become less distinct. Where once there were independent and company aligned agronomists and machinery dealers, there is now another tier of technical agronomists who offer advice on GPS and spatial technologies while not necessarily marketing any one specific brand. In addition, there are very few precision agronomists in Australia and even a smaller number who understand the GPS/CORS technology, mechanical engineering needed to integrate GPS/CORS into farm machinery, economics of precision agriculture at the farm level and practical application of controlled traffic farming.
The two sectors (GNSS dealers/distributors and agronomists) have similar structures, processes
and challenges. Both sectors reported an inability to service new needs of growers, particularly the integration of spatial technologies and CTF. GNSS dealers/distributors and agronomists provide broad, professional services, are very influential and effective, and are typically younger and more educated than growers.
The sectors operate as individuals or small groups linked to a few specific suppliers and focussed
on specific competencies and interests. They are not comfortable outside their core business. Each has a large client base and aim to supply everything that is needed, within their expertise. They report broad recognition of new developments (e.g. GNSS, PWT, machinery and practices) but little in-depth knowledge, poor access to information and poor understanding. Current structures are limited for farming systems that include GNSS, spatial information, PWT, machinery, new practices, automation, large databases, and farmer sharing and contracting.
Both sectors are based on one-on-one relationships with growers, a limited range of products
and practices, good information and training sources (e.g. suppliers, Government, Universities), and
P a g e | 51
experience of research of innovations. Growers’ needs with respect to spatial technologies and holistic farming systems (CTF) are not currently included.
The qualitative surveys indicated that education and awareness about GNSS/CORS network and
CTF/PWT technologies as deficient/ineffective for GNSS dealers/distributors and agronomists respectively in their business dealings with growers.
P a g e | 52
5 Barriers to adoption of CORS networks for CTF This Project’s quantitative and qualitative surveys aimed to identify the current status of
adoption of precise satellite positioning for CTF in Australia. The subsequent analysis of survey results has discerned key reasons why current levels of adoption are low and has identified a range of constraints to future adoption.
The on-farm application and integration of advanced spatial technologies (e.g. GNSS and CORS)
and agronomic (CTF and PWT) practices is a relatively recent phenomenon. Better user understanding of how these technologies work together to support improved cropping practice in particular and PA more generally can be expected to increase adoption.
Time-poor farmers confronted by the need to appropriately acquire and apply contemporary
technologies, products and practices can be forgiven for not fully understanding the intricacies of technologies such as GNSS, especially for high accuracy applications such as CTF. To illustrate this point, when growers were asked to report on the model of GNSS equipment they used, over half (53%) responded “don’t know”, highlighting that a lack of technical knowledge and expertise is a fundamental barrier to appropriate equipment purchases or upgrades to benefit from CORS correction services.
Understandably the surveys found that growers rely on a range of sources for advice in relation
to new technologies and farming systems, particularly one-on-one relationships with advisers and equipment suppliers. However the surveys indicate that some advisers may not be providing optimum information to growers due to issues such as confusion, proprietary interests and general lack of awareness.
The GPS and spatial technologies market has become more specialized over the past 5 years or
so with the proliferation of highly specialized equipment and technologies to measure map and automate more and more in farming operations. This has meant that the traditional roles of agronomist, manufacturer and distributor have become less distinct. Where once there were independent and company aligned agronomists and machinery dealers, there is now another tier of technical agronomists who offer advice on GPS and spatial technologies while not necessarily marketing any one specific brand.
Key barriers to increasing adoption of CORS and CTF, as revealed by the survey responses and
analysis are set out in the sections that follow. An overview of issues affecting NRTK adoption for CTF
A trend of increasing adoption of GNSS by the cropping industry over the next few years was revealed from grower survey responses. This creates an opportunity to influence decision making, to ensure appropriate equipment choices are being made to support optimal implementation of CTF.
Many past decisions made by growers relating to the purchase and use of high accuracy GNSS
technologies have been motivated by the prospect of quick financial gains through direct input savings and rapid return on investment. Such reasoning is understandable when compared to the less obvious, more complex, long term farming system benefits associated with the use of high accuracy GNSS in support of CTF. Sub optimal use of high accuracy GNSS was found to have been compounded by poor GNSS technology investment decisions and use, leading to sub-optimal CTF implementation. Compounding this situation, few growers have computer software with spatial data analysis capability also limiting the uptake of high accuracy GNSS and CTF. These findings highlight
P a g e | 53
the consequences of low awareness and inadequate end-user education, which emerge as significant barriers to increasing adoption of NRTK for CTF.
Through lack of coordination, significant duplication of GNSS base station investments have
occurred across much of Australia’s cropping districts. More recently, in agricultural areas of Victoria, NSW, Qld and Tasmania, government and private sector CORS networks, delivering non-proprietary independent GNSS correction services have become available, providing suitably equipped growers with the positioning accuracies and reliability needed for CTF.
The survey found that agricultural dealerships are a primary source of support and advice for
growers. However agricultural dealers often sell and support a single brand of GNSS equipment. Often such systems do not support interoperability, thereby limiting the opportunity for growers to exploit independent NRTK positioning services. GNSS equipment tied to proprietary formats and solutions represent a significant barrier to the adoption of high accuracy CORS services, tying farmers to proprietary offerings
Survey responses indicate that awareness of CORS network availability is variable. Limited
knowledge and high levels of confusion prevail in the cropping industry about what CORS networks are and how their services can be exploited. Advisers and equipment suppliers are likewise ill-informed in relation to the availability of CORS network services and the pros and cons of their use.
It follows that the absence of high quality information, couched in accessible language is a key
barrier to overcoming confusion, raising awareness, building confidence and demonstrating value in CORS and high accuracy GNSS for CTF. There is also the need for government specialists to engender a trusting relationship with stakeholders and counter miss-information with authoritative and coherent advice. An overview of issues affecting CTF adoption by the cropping industry
Previous grower surveys (e.g. by GRDC) have tended to over report the adoption rates for CTF, largely due to the non-specific nature of the questions asked of growers. By contrast survey responses in this report indicate that many growers claiming to implement CTF and related PA techniques (e.g. PWT) are not achieving appropriate positional accuracy (<±3 cm).
For example, while 92% of growers who reported using PWT used GNSS, only 67% reported that
their GNSS was accurate to ±3 cm. Conversely, 53% of those who reported that their GNSS was accurate to ±3 cm did not adopt PWT. These contradictory statistics paint a confusing picture demonstrating that many growers are not fully implementing or realising the benefits of CTF. Inevitably this has led to some frustration and disillusionment on the part of growers, both with their use of high accuracy GNSS and with the concept of CTF more generally.
Survey responses confirmed that significant changes in the cropping industry are required before
the full range of benefits from CTF can be realised. While the adoption of consistent, robust and precise GNSS positioning is fundamental, other constraints also exist. Two of particular note include the use of agricultural machinery with non-standard wheel track widths and the lack of farm layouts that support CTF adoption.
P a g e | 54
6 Conclusion The Project confirmed low adoption of precise GNSS (NRTK) for CTF by crop growers and low
adoption of CTF more generally. In order of importance, the key barriers to adoption were found to be:
1. Inadequate awareness and end-user education about CTF and the role of CORS networks to support CTF implementation.
2. Lack of consistent machinery standards to support CTF. 3. The impact of existing GNSS investment decisions to fully support CTF practice.
The Project gathered information from growers and service providers through quantitative and qualitative surveys to measure and assess technical knowledge and adoption issues. Overall, CTF needs to be recognised as a whole-of-farm system that offers substantial triple bottom line benefits. The need for accurate and robust positioning, standardised machinery wheel track widths and appropriate farm layout designs are fundamental pre-requisites of full CTF implementation.
At present, there is obvious confusion amongst growers about the accuracy being achieved when using various GNSS positioning technologies for CTF. For example, although 59% of growers using GNSS claim to achieve ±3 cm accuracy in the field, other data (specifically relating to PWT implementation) clearly indicates that only about half of this group are actually achieving the ±3 cm accuracy level. A further constraint to adoption is the difficulty of implementing CTF on farms with small crop production areas. This will need to be specifically addressed. In addition, optimum application of NRTK is being hindered by hardware compatibility issues and the imposition of proprietary data standards by manufacturers.
Government and private sector CORS networks are emerging as a significant resource for growers to achieve high accuracy positioning using NRTK correction services for CTF, without the need to operate and maintain individual base stations. The significance of CORS services is increasing as CORS network coverage expands across Australia. It is expected that the level of awareness since the survey would have improved due to this network coverage expansion and the increased involvement of commercial resellers. The knowledge and experience of CORS network providers and that of other industry sectors with widespread adoption of CORS technology (e.g. surveying and mining) should be drawn upon to support adoption by the grains industry.
The proposal for SIARA Stage 1 noted that “the success of the activities of the CRCSI will be measured by the extent to which research outputs are adopted and utilised by the user community and by the impacts that ensue”. Addressing the identified key barriers above will help ensure a holistic approach to future CORS and CTF adoption, achieving change and realising benefits efficiently and effectively.
P a g e | 55
References and reading. ABS (2009). 2007/08 Land Management and Farming in Australia. 4627.0. www.abs.gov.au.
Allen Consulting (2008). Economic benefits of high resolution positioning services, prepared Victorian Department of Sustainability and Environment and the Cooperative Research Centre for Spatial Information., page ix.
Bowman, K. (2008). Economic and environmental analysis of converting to Controlled Traffic Farming. Proc 6th Australian Controlled Traffic Farming Conference, Dubbo, NSW. P 61-69. ACTFA.
CRCSI (2013). RTKNetWest CORS network infrastructure locations: National CORS Infrastructure, http://feynman.thinkspatial.com.au/natgnss/
DEPI (2013). Vicmap Position GPSnet, http://www.dse.vic.gov.au/property-titles-and-maps/maps-imagery-and-data/data/gpsnet
Fitzroy Basin Association (2013). New CORS network to connect CQ growers - April 29, 2013, http://www.fba.org.au/new-cors-network-to-connect-cq-growers/
Hausler G., and Collier P. (2013). National Positioning Infrastructure: Where are we now? IGNSS Society 2013 Symposium, Gold Coast, Queensland, 16-18 July, 2013.
Janssen V., Haasdyk J., McElroy S. ( 2011). Network RTK: Same look and feel... only better . Position, 56, 20-24.
Millner J. (2009). The benefits of high accuracy positioning services for Victorian agriculture, mining and regional industries. IGNSS 2009 Conference, Surfers Paradise, Qld.
Position Partners (2013). AllDayRTK, http://www.alldayrtk.com.au/network-map/
Routley, R., Sadras, V., and Hoffman A. (2010). Benchmarking farm water use efficiency in eastern Australian dry land cropping. Proc 15th ASA Conference, Lincoln, NZ. www.agronomy.org.au .
SmartNet Aus (2013). SmartNet Aus Site Map, http://smartnetaus.com/home/index.php?q=node/16
Yule, D. F. (2007a). Unifying spatial technologies across agriculture and between other sectors and agriculture. CRCSI Re-bid Workshop, Sydney, Nov., 2007.
Yule, D. F. (2007b). CTF and PA tools – the perfect match. Proc 5th Australian Controlled Traffic Farming and Precision Agriculture Conference. Perth, WA. p201–206. ACTFA.
Yule, D. F. (2009). GNSS + CTF = high performance for agricultural cropping systems. IGNSS 2009 Conference, Surfers Paradise, Qld.
Yule, D. F. (2010). Controlled Traffic Farming and Cropping Productivity. Outlook 2010 Conference. ABARE.