48
Health Care Survey of DoD Beneficiaries 2004 Annual Report Katherine Bencio Megan McHugh Rebecca Nyman Eric Schone PROJECT REPORT

Health Care Survey of DoD Beneficiaries 2004 Annual Report
Katherine Bencio
Megan McHugh
Rebecca Nyman
Eric Schone
PROJECT REPORT


Health Care Survey of DoD Beneficiaries 2004 Annual Report
April 2005
Katherine Bencio
Megan McHugh
Rebecca Nyman
Eric Schone
600 Maryland Avenue, S.W., Suite 550Washington, DC 20024-2512(202) 484-9220www.mathematica-mpr.com
P R O J E C T R E P O R T
Project Officer:Lt. Col. MichaelHartzell, DVM, MPH


Contents
iii
P O L I C Y R E P O R T
Chapter 1: Introduction . . . . . . . . . . . . . . . . . . . . . . . . . . . . . . . . . . . . . . . . . . . . 1
Chapter 2: Beneficiaries’ Choices of Health Plan and Provider Type . . . . . . . . 4
Chapter 3: TRICARE Prime Enrollees’ Ratings of Doctors and Health Plan Improve . . . . . . . . . . . . . . . . . . . . . . . . . . . . . . . . . . . . . 6
Chapter 4: Most Active Duty Prime Enrollees Do Not Have Personal Doctors . . 8
Chapter 5: Standard/Extra Users’ Health Plan Ratings Are Improving . . . . . . . 10
Chapter 6: Medicare and TRICARE for Life . . . . . . . . . . . . . . . . . . . . . . . . . . . . 12
Chapter 7: Civilian Health Plans . . . . . . . . . . . . . . . . . . . . . . . . . . . . . . . . . . . . . 14
Chapter 8: Care at MTFs, Civilian Facilities, and the VA . . . . . . . . . . . . . . . . . 16
Issue Briefs . . . . . . . . . . . . . . . . . . . . . . . . . . . . . . . . . . . . . . . . . . . . . . . . . . . . . . 19
Issue Brief: Smoking and Smoking Cessation Policies . . . . . . . . . . . . . . . . . . . . 21
Issue Brief: TRICARE Civilian Network . . . . . . . . . . . . . . . . . . . . . . . . . . . . . . 24
Issue Brief: Referrals to Specialists . . . . . . . . . . . . . . . . . . . . . . . . . . . . . . . . . . . . 27
Issue Brief: Reservists’ Insurance Coverage . . . . . . . . . . . . . . . . . . . . . . . . . . . . . 30
HCSDB Issue Brief: Overweight Children in the Military Health System . . . . 33
HCSDB Issue Brief: Experiences of Children with Special Health Care Needs in TRICARE . . . . . . . . . . . . . . . . . . . . . . . . . 36
P R O J E C T R E P O R T


Chapter 1: Introduction
1
P O L I C Y R E P O R T
The TRICARE Annual Report presents a summaryof results from the Health Care Survey of DoD
Beneficiaries (HCSDB) for 2004. According to the2004 HCSDB:
• Health plan ratings, personal doctor ratings, andspecialist ratings for all TRICARE Prime enrolleeshave improved from their levels in 2002.
• Health care ratings of Prime enrollees are lowerrelative to civilian benchmarks than enrollees’ratings of doctors and health plan and have notimproved since 2002.
• More than 60 percent of active duty Primeenrollees do not have a personal doctor or nurse.
• Active duty Prime enrollees rate their doctors, theirhealth plan and their health care lower and reportmore problems getting access to specialists than doother enrollees.
• Since 2002, health plan ratings of TRICAREStandard/Extra users have improved relative tocivilian benchmarks. Ratings of doctors and healthcare now equal or exceed civilian benchmarks.
• Compared to 2002, military treatment facility(MTF) users report longer waits for appointmentsand longer waits in doctors’ offices. They reportless helpful staff and less time with doctors.
• Since 2002, the proportion of active duty familymembers using MTFs has fallen from 64 percent to 58 percent.
• Breast and cervical cancer screening rates of Primeenrollees exceed Healthy People 2010 (HP2010)goals, but first trimester prenatal care and hyper-tension and cholesterol screening rates do not.
• Prime enrollees in the north (New England, theMidwest, and Mid-Atlantic) who rely onTRICARE’s civilian network for most of their careare more likely than network users from otherregions to report problems finding network special-ists or getting needed care.
• Fifty-three percent of Prime enrollees referred to acivilian specialist by a military primary care manag-er (PCM) report that their PCM usually or alwaysknew enough about their specialty care, comparedto 68 percent referred by a civilian PCM to acivilian specialist.
• Thirty-nine percent of reservists’ families retainreservist civilian coverage after becoming eligiblefor TRICARE. Of reservist family members whoretain the reservist’s civilian coverage, 30 percentdo so even though the employer pays none of the premium.
• According to their parents, 40 percent of MHSchildren 6 to 11 and 47 percent of children 12 to17 watch 3 or more hours of television per day
• Parents of children with special healthcare needswho use TRICARE report more problems findinga personal doctor, seeing specialists and gettingneeded care than do other TRICARE parents.
About the HCSDB
The HCSDB is a worldwide survey of militaryhealth system (MHS) beneficiaries conducted eachyear since 1995 by the Office of the AssistantSecretary of Defense/TRICARE ManagementActivity (TMA). Congress mandated the survey underthe National Defense Authorization Act for fiscal year1993 (P.L. 102-484) to ensure regular monitoring of
P R O J E C T R E P O R T

MHS beneficiaries’ satisfaction with their health careoptions. The survey is administered each quarter to astratified random sample of adult beneficiaries, andonce each year to the parents of a sample of childbeneficiaries. Any beneficiary eligible to receive carefrom the military health system on the date thesample is drawn may be selected. Eligible beneficiariesinclude members of the Army, Air Force, Navy,Marines, Coast Guard, Public Health Service,National Oceanic and Atmospheric Administration,and mobilized members of the National Guard andReserves. Although many of the beneficiaries useTRICARE Prime, TRICARE Standard, or TRI-CARE Extra, others rely on Medicare or on civilianhealth insurance plans.
The samples are drawn from the Defense Enroll-ment Eligibility Reporting System (DEERS) and arestratified by the location of a beneficiary’s home, healthplan, and reason for eligibility. In 2004, 200,000 benefi-ciaries from both inside and outside the United States were sampled for the adult survey. A total of35,000 beneficiaries from the United States weresampled for the child survey. Sampling methods aredescribed in the 2004 HCSDB Adult Sample Report and2004 Child Sample Report. The National ResearchCorporation administers the survey, allowing benefici-aries to respond by mail or on a secure website.
Responses to the survey are coded, cleaned, andedited and assembled in a database. Duplicate andincomplete surveys are removed. A sampling weight isassigned to each observation, adjusted for non-response. The contents of the database are describedin the 2004 HCSDB Codebook and Users Guide.
Questions in the 2004 HCSDB were developed byTMA or were taken from other public domain healthcare surveys. Many questions were taken from theConsumer Assessment of Health Plans Survey(CAHPS), Version 3.0. CAHPS contains core andsupplemental survey questions that are used by com-mercial health plans, the Center for Medicare and
Medicaid Services (CMS), and state Medicaidprograms to assess consumer satisfaction with theirhealth plans.
Most survey questions change little from quarter toquarter so that responses can be followed over time.Supplementary questions are added each quarter tolearn more about the latest health policy issues. In2004, questions were added to address the adequacyof TRICARE’s civilian network, beneficiaries’ experi-ences with referrals, beneficiaries’ perceptions ofpatient safety, reservists’ health coverage, and anumber of other topics.
About This Report
This report presents results for all surveys adminis-tered in 2004, 2003, and 2002. It includes responsesfrom all beneficiaries eligible for MHS benefits,including children, who reside in the US.
Beneficiaries are eligible for military health benefits ifthey are currently active duty or are dependents ofactive duty. Groups eligible due to active duty statusinclude National Guard and Reserves mobilized formore than 30 days and their dependents. Beneficiariesalso are eligible if they have retired following a career inthe uniformed services or are the dependents of aretiree. MHS beneficiaries may receive care frommilitary facilities or MTFs that are financed and operat-ed by the uniformed services, or from civilian facilitiesthat are reimbursed by the Department of Defense.
This report is organized based on the coverageoptions of beneficiaries. Chapter 2 describes thechoices of eligible beneficiaries among differenthealth plans and providers of care. Subsequentchapters describe satisfaction with health care,access to care, and preventive care received bybeneficiaries using different coverage optionsincluding Prime, Standard and Extra, TRICAREfor Life, and civilian coverage. The results arepresented as percentages calculated using adjustedsampling weights. Other graphs present resultsaccording to the most used type of facility. When
2
P R O J E C T R E P O R T

3
results are compared between years or to an exter-nal benchmark, the difference is tested for statisti-cal significance, accounting for the complex sampledesign. Results that differ significantly from anexternal benchmark (p < .05) are bolded.
Results from CAHPS questions are compared toresults from the National CAHPS BenchmarkingDatabases (NCBD) for 2003, 2002, and 2001, whichassemble results from surveys administered to hun-dreds of civilian health plans. Benchmarks are adjust-ed for age and health status to correspond to thecharacteristics of beneficiaries shown in the graph.For example, benchmarks in graphs presenting civilianhealth plan ratings are adjusted to the age and healthstatus of beneficiaries using civilian health plans, whilethe same benchmarks for Prime users are adjusted tothe age and health status of beneficiaries who usePrime. For preventive care measures, such as theproportion of women screened for cervical cancer,results are compared with HP2010 goals. HP2010goals are set by the government to promote goodhealth through healthy behavior, such as immuniza-tion, screening for illness, and avoiding unhealthyhabits. Benchmarks are described in more detail in the2004 HCSDB Technical Manual.
In 2004, questions from version 3.0 of CAHPSwere used for the first time. Prior to 2004, CAHPSversion 2.0 questions were used. With this change, thewording of several questions used in this report alsochanged. To compare results from 2004 with resultsfrom 2003 and 2002, we performed two adjustmentsto rates calculated from previous years. First, wecompared results from the 2001 and 2002 NCBD,based on CAHPS 2.0, with results from the 2003NCBD, based on CAHPS 3.0. We adjusted eachproportion from our report in 2002 and 2003 byadding the change in the estimated benchmark tothese earlier numbers. For two other questions, weperformed an additional adjustment by estimating ashift factor to account for differences in the effect ofthe question wording between HCSDB respondents
and other CAHPS respondents. The methodology isdescribed in the 2004 HCSDB Technical Manual.
Other reports prepared from the HCSDB are theTRICARE Beneficiary Reports and TRICARE ConsumerWatch. The Beneficiary Reports is an interactive web-based document that compares TRICARE Regions,Services, and MTFs using scores calculated fromsurvey results. The Consumer Watch contains a briefsummary of results from the Beneficiary Reports andissue briefs that use survey questions to address healthpolicy issues affecting the MHS. Both appear quarterly.
Often based on supplementary survey questions,the issue briefs investigate special topics of immediateinterest to beneficiaries and MHS leadership. Theissue briefs for 2004 concerned 1) beneficiaries’perceptions of the adequacy of TRICARE’s civiliannetworks, 2) smoking and smoking cessation underTRICARE, 3) referrals to specialists under TRICAREPrime, and 4) reservists’ coverage. Two children’sissue briefs cover experiences of children with specialhealth care needs and factors affecting childhoodobesity. These issue briefs make up the last six chap-ters of this report.
P R O J E C T R E P O R T

4
Chapter 2: Beneficiaries’ Choices of Health Plan and Provider Type
Beneficiaries of the military health system arecovered by a wide range of health plans, most of
them provided or supplemented by the Department ofDefense. Active duty are largely restricted to TRI-CARE Prime, but their dependents may choose fromPrime, Standard/Extra, or civilian policies. Retireesalso may choose Prime, Standard/Extra, or civiliancoverage, with a substantial minority eligible forVeterans Administration care through CHAMPVA.Medicare-eligible retirees are eligible for TRICAREfor Life, which provides TRICARE benefits to paydeductibles and coinsurance left over from Medicare.Figure 1 shows the proportion of adults covered byeach of these options. Beneficiaries were asked whichhealth plan they relied on for most of their care.According to their responses, Prime is the plan mostused by MHS eligibles, covering nearly half, whileMedicare/TRICARE for Life provides coverage forthe second largest group, 23 percent of eligiblebeneficiaries. Standard/Extra provides care for onlyabout 8 percent of respondents, substantially less thanthe 17 percent who are covered by civilian plans.
Together those four coverage types are responsible for97 percent of eligible beneficiaries.
Almost all active duty are covered by Prime andalmost all retirees age 65 and over are covered byTRICARE for Life. Active duty family members andyounger retired families choose among several options.As shown by Figure 2, four-fifths of active duty familymembers who responded to the survey are covered byPrime. The remaining one-fifth are divided amongcivilian plans and Standard/Extra, with 11 percentcovered by civilian plans and 8 by Standard/Extra.
Retired beneficiaries also are more likely to choosePrime than Standard/Extra. As shown in Figure 3, alittle more than half of retired respondents rely on aTRICARE plan, and that group chooses Prime by twoto one over Standard/Extra. Most of the remainingbeneficiaries, nearly two-fifths of all retirees and theirfamily members, have civilian insurance of some kind.
Beneficiaries who use civilian insurance, TRICAREfor Life, or TRICARE Standard/Extra receive careprimarily from civilian providers. Prime enrollees,
Prime49%
Standard/Extra8%
Medicare23%
Civilian17%
VA3%
Figure 1: Health plan used for most care 2004
P O L I C Y R E P O R TP R O J E C T R E P O R T
90
10
81
11
09
79
11
08
80
0%
20%
40%
60%
80%
100%
Civilian Prime Standard/Extra
VA
Perc
ent
2002 2003 2004
Figure 2: Active duty family members choice of health plan

5
P R O J E C T R E P O R T
however, may get care either from civilian managedcare support contractors or from military treatmentfacilities (MTFs) operated by the uniformed services.Thus, the proportion of beneficiaries that gets careprimarily from MTFs is less than the proportionenrolled in Prime. As shown in Figure 4, the majorityof eligible beneficiaries (56 percent) get care primarilyfrom civilian facilities. Another 5 percent use VAfacilities and about two-fifths rely on MTFs.
Results in Figure 5 indicate that active duty familieshave shifted from MTFs to civilian facilities in recentyears. Since 2002, the proportion getting most of theircare from MTFs has fallen from 64 percent to
58 percent, with a corresponding shift to civilianfacilities. Figure 6 shows that, among retirees, two-thirds of whom use civilian facilities, no shift is appar-ent. Notably, 8 percent of retirees say that they getmost of their health care from VA facilities, a higherproportion than the 6 percent of retirees who reportedthat they relied on the VA as a health plan.
MTF39%CTF
56%
VA5%
Figure 4: Patient's usual source of care 2004
3835
18
5
3835
6
17
3538
6
16
0%
10%
20%
30%
40%
50%
Civilian Prime Standard/Extra
VA
2002 2003 2004
Perc
ent
Figure 3: Retired, less than 65, choice of health plan
0
64
36
0
62
38
0
58
41
0%
10%
20%
30%
40%
50%
60%
70%
80%
CTF MTF VA
2002 2003 2004
Perc
ent
Figure 5: Active duty family members usual source of care
7
69
24
8
67
25
8
67
25
0%
10%
20%
30%
40%
50%
60%
70%
80%
Perc
ent
2002 2003 2004
CTF MTF VA
Figure 6: Retired, less than 65, usual source of care

Chapter 3: TRICARE Prime Enrollees’ Ratings of Doctors and Health Plan Improve
6
P R O J E C T R E P O R T
TRICARE Prime is the health plan through whichmost MHS care is delivered. This chapter
describes how beneficiaries rate Prime and the carethey receive through Prime. It also describes howbeneficiaries perceive their access to both primary carephysicians and specialists, factors which are stronglyinfluenced by the number and type of doctorsemployed by the health plan and the policies govern-ing referrals and use of doctors for primary care.
Health plan ratings for Prime have improved inrecent years. As shown in Figure 7, the proportiongiving their health plan a high rating increased froman adjusted rate of 51 percent in 2002 to 53 percentin 2004. Health plan ratings are higher relative to thecivilian benchmark than are health care ratings. Whilethe proportion of Prime enrollees giving their healthcare a high rating is about 12 percent below thebenchmark, plan ratings are about 5 percent below.
Figure 8 shows one of the ways in which Primediffers from civilian plans. An important differencebetween Prime and civilian plans is the low proportionof Prime users with personal doctors. More than 80 percent of beneficiaries in the benchmark database
identify a single person as their personal doctor ornurse, compared to about half of Prime enrollees.Though efforts have been made to promote a personaldoctor-patient relationship, the proportion with apersonal doctor has not increased since 2002. Primeenrollees also are more likely than the civilian norm toreport problems in finding a personal doctor they arehappy with. In 2004, 53 percent of Prime enrolleesreported no problem finding a personal doctor, com-pared to a civilian norm of 63 percent. However, whileproblems finding a personal doctor have not dimin-ished since 2002, ratings of personal doctors, for thosewho have them, have risen slightly. The proportiongiving their personal doctor a high rating has increasedfrom 64 to 66 percent in that time.
Problems seeing a specialist or getting approval fortreatments are other ways in which the staffing of ahealth plan or its policies for referrals or utilizationmanagement may affect beneficiaries. Figure 9 showsthat Prime beneficiaries report delays in approvalsthat are similar to civilian norm. In 2004, 82 percentreported no problems with delays, compared to an
51
58
50
58 5358
70
58
30%
40%
50%
60%
70%
80%
90%
100%
Health care Health plan
2002 2003 2004 Benchmark
Perc
ent
Figure 7: Prime enrollees' health care and health plan ratings
64
5554
63
5554
66
5351
72
63
85
20%
40%
60%
80%
100%
Has personal doctor
No problemfinding
personal doctor
Personal doctorrating
8 or above
2002 2003 2004 Benchmark
Perc
ent
Figure 8: Prime enrollees' personal doctors

7
P R O J E C T R E P O R T
84 percent benchmark. Prime enrollees were morelikely to report problems seeing specialists than theywere to report delays in treatment. Fifty-six percentof Prime enrollees reported problem-free access tospecialists, compared to 69 percent in the NCBD.However, beneficiaries were less likely to give theirspecialists low ratings than to report problems inseeing them. In 2004, 67 percent of beneficiaries rated their specialist at 8 or above, compared to a 72 percent NCBD benchmark. Prime enrollees givinghigh ratings to specialists increased from an adjustedvalue of 64 in 2002 to its current level.
Preventive care provided to Prime enrolleesexceeds HP2010 goals in several dimensions and fallsshort in others. Figure 10 shows that, compared toHP2010 goals, women in Prime receive cancer screen-ing—both Pap smears and mammography—at ratesexceeding the target in each year from 2002 to 2004.However, the proportion of pregnant or recentlypregnant enrollees reporting that they receivedprenatal care in their first trimester was below theHP2010 goal of 90 percent.
Figure 11 shows that the rate for hypertensionscreening, defined as the proportion of beneficiarieswhose blood pressure was checked in the past 12 months and who know whether it is too high, isbelow the goal set for all adults, as is the proportion
whose cholesterol was checked in the past 5 years.Both of these screens, though appropriate for all ages,reflect conditions that increase in prevalence andimpact with age, and younger beneficiaries are lesslikely to receive them. Prime, with its predominantlyyounger population comprised of active duty and theirfamilies, is less likely to achieve these goals than areplans with older population groups. Similarly, thenon-smoking rate for Prime enrollees is 79 percent,compared to an HP2010 goal of 88 percent. However,smoking rates fall with age, and the low non-smokingrate reflects in part the young population.
82
5864
82
5765
82
56
67
84
7269
20%
40%
60%
80%
100%
Delays awaitingapproval
Getting to see a specialist
Specialist rating 8 or above
Perc
ent
2002 2003 2004 Benchmark
Figure 9: Prime enrollees' access to specialists
86
93
8386
94
83
8893
83
70
9090
60%
70%
80%
90%
100%
Mammography Pap smear Prenatal care
2002 2003 2004 Benchmark
Perc
ent
Figure 10: Prime enrollees' cancer screening and prenatal care
78
75
90
7976
91
7976
91
88
80
95
60%
70%
80%
90%
100%
Hypertensionscreen
Cholesterol screen
Non-smoking
2002 2003 2004 Benchmark
Perc
ent
Figure 11: Prime enrollees' preventive care

8
Chapter 4: Most Active Duty Prime Enrollees Do Not Have Personal Doctors
Though active duty are predominantly enrolled inPrime, their experience is different from other
Prime enrollees. They are restricted to militaryfacilities for the most part, and may receive carethrough sick call or in other ways that have no equiv-alents in the civilian health care system. As shown byFigure 12, this group rates their health care quite low.Only 51 percent give their health care a rating of 8 orhigher, compared with a civilian norm of 68 percent.Health plan ratings also are below the civilian norm,with 46 percent giving their plan a high rating,compared to a civilian norm of 57.
Active duty are less likely than are other Primeusers to have a personal doctor or nurse. As shown byFigure 13, only 37 percent report having a singlepersonal doctor or nurse, a decline from rates report-ed in 2002 of 40 percent, and less than half of thecivilian norm. Though active duty are less likely thanother Prime users to have identifiable personal doc-tors or nurses, they are no more likely than otherenrollees to report problems finding a personaldoctor. Fifty-four percent report no problem finding a personal doctor or nurse, compared to a norm of
63 percent. However, active duty do give their doctorslow ratings, as far below the benchmark as the ratingsthey give their health plan. Among active duty with apersonal doctor, 60 percent rate their doctor 8 orhigher, compared to a norm of 71 percent.
Figure 14 shows that active duty are more likely toreport problems getting to see specialists than infinding a personal doctor. Fifty percent report no
P R O J E C T R E P O R T
5144
50
42
5146
57
68
30%
40%
50%
60%
70%
80%
90%
100%
Health care Health plan
2002 2003 2004 Benchmark
Perc
ent
Figure 12: Active duty health care and health plan ratings
60
83
5259
83
52
62
84
50
7167
84
20%
40%
60%
80%
100%
Delays awaitingapproval
Getting to see a specialist
Specialist rating 8 or above
2002 2003 2004 Benchmark
Perc
ent
Figure 14: Active duty access to specialists
5953
40
5652
40
6054
37
7163
83
20%
40%
60%
80%
100%
Has personal doctor
No problemfinding
personal doctor
Personal doctor rating
8 or above
2002 2003 2004 Benchmark
Perc
ent
Figure 13: Active duty personal doctors

9
P R O J E C T R E P O R T
problem getting to see a specialist, compared to acivilian rate of 67 percent, and 62 percent rate theirspecialist at 8 or above, 9 percent below the bench-mark. However, 84 percent report that delays whileawaiting approval for treatment are no problem,similar to the civilian benchmark.
Like other Prime enrollees, active duty exceedHP2010 goals for cancer screening—both mammogra-phy and Pap smears—and fall short of the goal forprenatal care (Figure 15). The rate for hypertensionscreening (90 percent) and cholesterol screening (77 percent), presented in Figure 16, also are less thanthe HP2010 goals of 95 percent and 80 percent, respec-tively. The non-smoking rate of 78 percent amongactive duty is the lowest of all enrollment groups.
96
82 82
96
82 82
97
8185
70
9090
60%
70%
80%
90%
100%
Mammography Pap smear Prenatal care
Perc
ent
2002 2003 2004 Benchmark
Figure 15: Active duty cancer screening and prenatal care
77
89
7678
90
7678
90
77
88
80
95
60%
70%
80%
90%
100%
Hypertensionscreen
Cholesterol screen
Non-smoking
2002 2003 2004 Benchmark
Perc
ent
Figure 16: Active duty preventive care

10
Standard/Extra is TRICARE’s PPO option.Beneficiaries may pay coinsurance to see any
provider who accepts TRICARE, or may see mem-bers of TRICARE’s civilian network at a lower cost.As described in Chapter 2, this option is the fourthmost frequently chosen coverage type among eligiblebeneficiaries, used by about 8 percent. However, it isthe alternative to Prime for active duty family mem-bers and retirees under age 65 who choose coveragefrom the Department of Defense. Recent legislationhas reduced the cost to active duty family members ofusing Standard/Extra. Ratings of health care, healthplan, and personal and specialist doctors underStandard/Extra all have increased.
Beneficiaries covered by Standard/Extra are morelikely to rate their health care highly than their healthplan, but health plan ratings have improved since2002. As shown in Figure 17, the proportion givingtheir health plan a rating of 8 or above has risen from50 to 57 percent, while the proportion rating theirhealth care 8 or above now exceeds the civilian bench-mark at 78 percent.
Like other TRICARE groups, the proportion ofStandard/Extra beneficiaries who say they have apersonal doctor is lower than the NCBD norm, in thiscase 82 percent, compared to 91 percent, as shown inFigure 18. The proportion with personal doctors,though lower than the benchmark, does not appear tobe due to unusual difficulties in finding a personaldoctor, either in the network or outside of it. Sixty-four percent report no difficulty in finding a personaldoctor, compared to 65 percent in the NCBD.Seventy-nine percent give their personal doctor a highrating, an increase of 4 percent since 2002.
Figure 19 shows that neither delays awaitingapproval nor problems finding specialists appear to begreat problems for Standard/Extra users. Eighty-ninepercent report no delays awaiting approval and 74 percent report no problems in seeing specialists,similar to civilian standards. The proportion givingtheir specialists high ratings has improved from 73 to 79 percent since 2002.
Chapter 5: Standard/Extra Users’ Health Plan Ratings Are Improving
P R O J E C T R E P O R T
75
50
75
54
78
57
75
63
2002 2003 2004 Benchmark
30%
40%
50%
60%
70%
80%
90%
100%
Perc
ent
Health care Health plan
Figure 17: Standard/extra users' health care and healthplan ratings
75
61
8178
58
81 79
64
82
75
65
91
20%
40%
60%
80%
100%
Has personal doctor
No problem finding
personal doctor
Personal doctorrating
8 or above
Perc
ent
2002 2003 2004 Benchmark
Figure 18: Standard/extra users' personal doctors
11
P R O J E C T R E P O R T
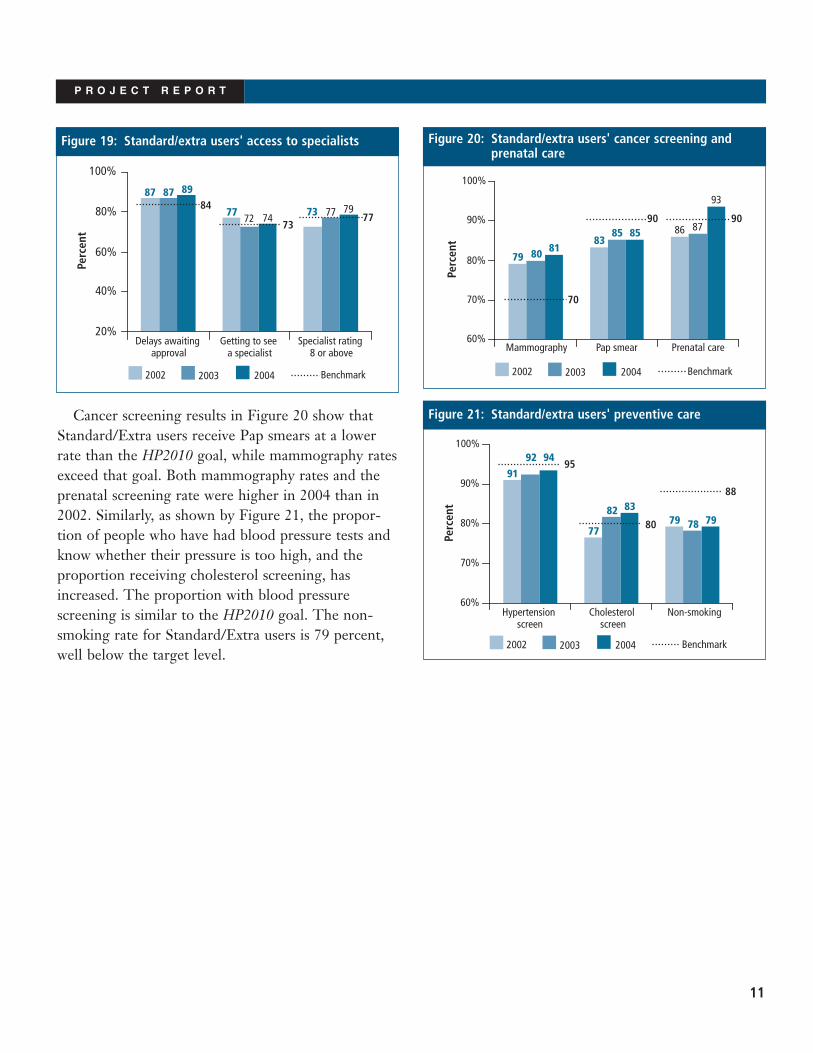
Cancer screening results in Figure 20 show thatStandard/Extra users receive Pap smears at a lowerrate than the HP2010 goal, while mammography ratesexceed that goal. Both mammography rates and theprenatal screening rate were higher in 2004 than in2002. Similarly, as shown by Figure 21, the propor-tion of people who have had blood pressure tests andknow whether their pressure is too high, and theproportion receiving cholesterol screening, hasincreased. The proportion with blood pressurescreening is similar to the HP2010 goal. The non-smoking rate for Standard/Extra users is 79 percent,well below the target level.
87
77 73
87
7277
89
747984
7377
Delays awaitingapproval
Getting to see a specialist
Specialist rating 8 or above
20%
40%
60%
80%
100%
Perc
ent
2002 2003 2004 Benchmark
Figure 19: Standard/extra users' access to specialists
83
79
8685
80
87
8185
93
9090
70
60%
70%
80%
90%
100%
Mammography Pap smear Prenatal care
2002 2003 2004 Benchmark
Perc
ent
Figure 20: Standard/extra users' cancer screening andprenatal care
79
91
7778
92
8279
94
8388
80
95
60%
70%
80%
90%
100%
Hypertensionscreen
Cholesterol screen
Non-smoking
Perc
ent
2002 2003 2004 Benchmark
Figure 21: Standard/extra users' preventive care

Chapter 6: Medicare and TRICARE for Life
12
P R O J E C T R E P O R T
The 2000 National Defense Authorization Act(NDAA) entitled beneficiaries who pay their
Medicare Part B Premium to coverage from TRICAREfor most costs not covered by Medicare. Since then,satisfaction with health care and their health plansamong Medicare-eligible TRICARE beneficiaries hasincreased. Ratings of both health care and health planby beneficiaries with Medicare coverage have continuedto increase during the period of this report. The pro-portion rating their health care 8 or above, shown inFigure 22, rose from 86 to 89 percent between 2002and 2004, while the proportion rating their health plan8 or above rose from 82 to 85 percent.
As indicated by Figure 23, the proportion ofMedicare beneficiaries with a personal doctor is 94 percent, which is similar to age- and health status-adjusted benchmarks. About 80 percent report noproblem finding a personal doctor they are happy with,which is similar to the norm for those with civiliancoverage. Similarly, personal doctor ratings improved,with the proportion rating their personal doctor 8 or above rising from an adjusted value of 83 percentto 85 percent, in the period from 2002 to 2004.
Figure 24 demonstrates that access to specialists isalso not a problem for beneficiaries of TRICARE forLife. Fewer than 5 percent report problems withdelays awaiting approval for treatment. Eighty-sevenpercent report that they experience no problems inseeing a specialist, which is well above the NCBD.Specialist ratings are also high, with 87 percent ratingtheir specialist 8 or above.
8286 86
8985
89
77
84
30%
40%
50%
60%
70%
80%
90%
100%
Health care Health plan
Perc
ent
2002 2003 2004 Benchmark
Figure 22: Medicare health care and health plan ratings97
8783
98
8787
96
8787888381
20%
40%
60%
80%
100%
Delays awaitingapproval
Getting to see a specialist
Specialist rating 8 or above
2002 2003 2004 Benchmark
Perc
ent
Figure 24: Medicare access to specialists
8379
93
8578
94
8578
94
82
74
96
20%
40%
60%
80%
100%
Has personal doctor
No problem finding
personal doctor
Personal doctorrating
8 or above
2002 2003 2004 Benchmark
Perc
ent
Figure 23: Medicare personal doctors

13
P R O J E C T R E P O R T
The preventive care received by Medicare benefici-aries, shown in Figures 25 and 26, is consistent withthe age profile of this group. The mammography rateexceeds the HP2010 goal of 70 percent by a widemargin, though the Pap smear rate is less than 80 percent. However, many physicians do not recom-mend routine Pap smears for women over 70 years ofage. Similarly hypertension screening and cholesterolscreening exceed Healthy People 2010 goals. The highrate of screening for hypertension and hypercholes-terolemia reflect their increased prevalence andgreater concern about the problem of heart disease asbeneficiaries become older.
77
8478
85
75
85 90
70
30%
40%
50%
60%
70%
80%
90%
100%
Mammography Pap smear
Perc
ent
2002 2003 2004 Benchmark
Figure 25: Medicare cancer screening
87
9694
88
9794
88
9597
88
80
95
60%
70%
80%
90%
100%
Hypertensionscreen
Cholesterol screen
Non-smoking
2002 2003 2004 Benchmark
Perc
ent
Figure 26: Medicare preventive care

Chapter 7: Civilian Health Plans
14
P R O J E C T R E P O R T
Civilian health plans are the third most commonsource of coverage among MHS beneficiaries.
Because many beneficiaries pursue careers afterretirement, retirees are likely to have civilian cover-age, with at least some employer cost sharing.Similarly, active duty family members with civilianemployment may use their employer-provided cover-age in preference to TRICARE. They make thatchoice based on the relative cost of the two optionsand the attractiveness of the benefits.
Figure 27 shows that beneficiaries who have electedcivilian coverage rate their health care and health plansimilarly to non-military beneficiaries with civiliancoverage. Sixty-six percent give their health plan and81 percent give their health care high ratings. Healthcare ratings have increased by 4 percent since 2002.Beneficiaries are approximately as likely to have apersonal doctor or nurse as beneficiaries in the bench-mark database, 90 percent of civilian MHS eligiblescompared to 91 percent of beneficiaries contained inthe NCBD (Figure 28). MHS eligibles with civiliancoverage are more likely than beneficiaries in the
NCBD to report that they had no problem finding apersonal doctor or nurse they were happy with.
Beneficiaries with civilian insurance are less likelyto report problems getting to see a specialist or delayswhile awaiting approval than are beneficiaries in theNCBD, as shown in Figure 29. Ninety percent ofMHS eligibles with civilian coverage report no with
77
66
79
66
81
66 66
78
30%
40%
50%
60%
70%
80%
90%
100%
Health care Health plan
2002 2003 2004 Benchmark
Perc
ent
Figure 27: Beneficiaries with civilian coverage health careand health plan ratings
93
7784
92
808390
828378
75
85
20%
40%
60%
80%
100%
Delays awaitingapproval
Getting to see a specialist
Specialist rating 8 or above
2002 2003 2004 Benchmark
Perc
ent
Figure 29: Beneficiaries with civilian coverage access to specialists
7673
90
7773
90
7874
90
77
67
91
20%
40%
60%
80%
100%
Has personal doctor
No problem finding
personal doctor
Personal doctorrating 8 or above
Perc
ent
2002 2003 2004 Benchmark
Figure 28: Beneficiaries with civilian coverage personal doctors
15
P R O J E C T R E P O R T
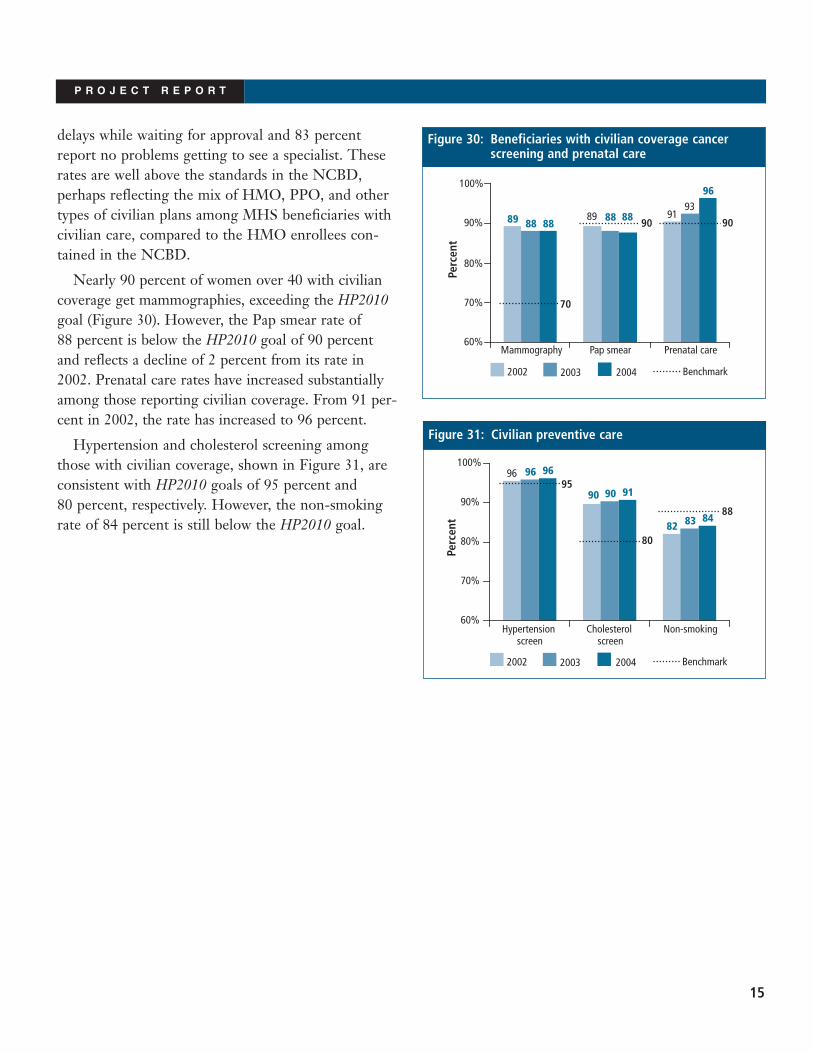
delays while waiting for approval and 83 percentreport no problems getting to see a specialist. Theserates are well above the standards in the NCBD,perhaps reflecting the mix of HMO, PPO, and othertypes of civilian plans among MHS beneficiaries withcivilian care, compared to the HMO enrollees con-tained in the NCBD.
Nearly 90 percent of women over 40 with civiliancoverage get mammographies, exceeding the HP2010goal (Figure 30). However, the Pap smear rate of 88 percent is below the HP2010 goal of 90 percentand reflects a decline of 2 percent from its rate in2002. Prenatal care rates have increased substantiallyamong those reporting civilian coverage. From 91 per-cent in 2002, the rate has increased to 96 percent.
Hypertension and cholesterol screening amongthose with civilian coverage, shown in Figure 31, areconsistent with HP2010 goals of 95 percent and 80 percent, respectively. However, the non-smokingrate of 84 percent is still below the HP2010 goal. 82
96
90
83
96
90
84
96
91
88
80
95
60%
70%
80%
90%
100%
Hypertensionscreen
Cholesterol screen
Non-smoking
2002 2003 2004 Benchmark
Perc
ent
Figure 31: Civilian preventive care
9189 8993
8888
96
8888 9090
70
60%
70%
80%
90%
100%
Mammography Pap smear Prenatal care
2002 2003 2004 Benchmark
Perc
ent
Figure 30: Beneficiaries with civilian coverage cancerscreening and prenatal care

Chapter 8: Care at MTFs, Civilian Facilities, and the VA
16
P R O J E C T R E P O R T
About two-fifths of MHS eligibles get their carefrom MTFs, but the majority of those who rely
on a TRICARE plan to provide their health care useMTFs. Figures 32 and 33 report several measuresrelated to the functioning of a clinic or hospital forbeneficiaries who use MTFs for most of their healthcare. These measures include the availability ofappointments, waits in the doctor’s office, helpfulnessof office staff, and length of time spent with doctors.
All measures show slight worsening. As shown inFigure 32, the proportion reporting that staff areusually or always helpful declined from an adjustedvalue of 84 percent to 81 percent, compared to abenchmark of 88 percent. The proportion reportingthat they get enough time with their physiciansdeclined from 81 to 79 percent, compared to an 83 percent benchmark.
Routine appointments also appear to be less readilyavailable. The proportion of beneficiaries reportingthey could usually or always get appointments whenthey want them, shown in Figure 33, declined froman adjusted value of 69 to 65 percent, compared to abenchmark of 79 percent. Waits in the doctor’s office
are less of a problem than waits for appointments,compared to civilian norms. The rate for MTFs is 51 percent, compared to a civilian norm of 52 per-cent. Yet in 2002 and 2003, long waits at MTFs werebetter than or comparable to the civilian norm.
Beneficiaries generally report more positive experi-ences at civilian facilities than at military ones, asshown in Figure 34. The proportion of MHS benefi-ciaries at civilian facilities reporting that staff arehelpful (93 percent) exceeds the civilian benchmark.The proportion reporting that they get enough timewith their physicians (89 percent) is also slightly above the civilian norm. There is no evidence of any worsening trend in physicians’ availability or staff helpfulness.
According to beneficiaries’ reports, availability ofappointments at civilian facilities exceeds the normfrom the NCBD. Eighty-nine percent reported thatthey could get an appointment when they wanted it,as shown in Figure 35. That percentage is nearlyidentical to percentages in 2002 and 2003. Users ofcivilian facilities report waits in the doctor’s officesimilar to the NCBD benchmark. Fifty-nine percent
69
55
67
52
65
51 52
79
30%
40%
50%
60%
70%
80%
90%
100%
Short wait in doctor's office
Timely routine care
Benchmark
Perc
ent
2002 2003 2004
Figure 33: Waiting for care at MTFs
8184
8083
798188
83
30%
40%
50%
60%
70%
80%
90%
100%
Staff are helpful Patient gets enough time
Perc
ent
2002 2003 2004 Benchmark
Figure 32: Patients' experiences at MTFs

17
P R O J E C T R E P O R T
usually or always wait less than 15 minutes, comparedto an adjusted benchmark of 58 percent.
Users of civilian facilities include beneficiaries withmany different coverage types: TRICARE for Lifeenrollees, users of civilian health plans, Standard/Extrausers, and Prime enrollees who rely on the civiliannetwork. Figures 36 and 37 show the experiences atcivilian facilities of a more homogenous group, thePrime enrollees. Prime enrollees who use civilianfacilities report less positive experiences than do other users of civilian providers, but more positive
experiences than do MTF users. Seventy-nine percentof Prime civilian facility users report that routineappointments are readily available (Figure 37) and 84 percent report that doctors spend enough time withthem (Figure 36). Eighty-seven percent report that staffare helpful. Fifty-three percent report short waits in thedoctor’s office, similar to the benchmark. Rates for allaspects of care, including waits in the doctor’s office,waits for routine care, helpfulness of staff and time with doctors are similar to the benchmarks and none of these rates have changed significantly from theirvalues in 2002.
89
55
88
53
89
59
84
58
30%
40%
50%
60%
70%
80%
90%
100%
Short wait in doctor's office
Timely routine care
2002 2003 2004 Benchmark
Perc
ent
Figure 35: Waiting for care at civilian facilities
9489
9489
938992
88
30%
40%
50%
60%
70%
80%
90%
100%
Staff are helpful Patient gets enough time
2002 2003 2004 Benchmark
Perc
ent
Figure 34: Patients' experiences at civilian facilities
8489
8388
8487
8884
30%
40%
50%
60%
70%
80%
90%
100%
Staff are helpful Patient gets enough time
2002 2003 2004 Benchmark
Perc
ent
Figure 36: Prime enrollees' experiences at civilian facilities
53
80
50
80 79
5353
79
30%
40%
50%
60%
70%
80%
90%
100%
Short wait in doctor's office
Timely routine care
Perc
ent
2002 2003 2004 Benchmark
Figure 37: Prime enrollees’ waits at civilian facilities

18
P R O J E C T R E P O R T
As shown by Figure 38, beneficiaries who use theVA give high marks for helpfulness of office staff, andtime with their doctors. Ninety-one percent reportthat staff are usually or always helpful, similar to theadjusted NCBD benchmark. Eighty-six percent reportthat they get sufficient time with doctors at the VA,compared to a benchmark of 85 percent. In neithercase has the rating changed substantially since 2002.
Waits for routine appointments at VA facilities fall short of the benchmark, as shown in Figure 39.Seventy-six percent say that appointments are usuallyor always available, while the benchmark is 82 per-cent. The proportion that usually or always experi-ences short waits in the doctor’s office (51 percent) isless than the benchmark of 56 percent.
8790
8789
8691
8590
30%
40%
50%
60%
70%
80%
90%
100%
Staff are helpful Patient gets enough time
Perc
ent
2002 2003 2004 Benchmark
Figure 38: Patients' experiences at VA facilities
46
77
47
77
51
7682
56
30%
40%
50%
60%
70%
80%
90%
100%
Short wait in doctor's office
Timely routine care
Perc
ent
2002 2003 2004 Benchmark
Figure 39: Waiting for care at VA facilities

19
Issue Briefs
These issue briefs first appeared in TRICARE Consumer Watch:
• Smoking and Smoking Cessation Policies appeared in May 2004
• Network Adequacy appeared in August 2004
• Referrals to Specialists appeared in November 2004
• Reservists’ Insurance Coverage appeared in March 2005
These issue briefs first appeared on the Health Care Survey of DoD Beneficiarieswebsite:
• Experiences of Children with Special Health Care Needs in TRICARE appeared inJanuary 2005
• Overweight Children in the Military Health System appeared in January 2005
P R O J E C T R E P O R T


21
Issue Brief: Smoking and Smoking Cessation Policies
The armed forces have long had a reputation as anenvironment in which tobacco use is accepted and
common.1 Cigarettes were included as part of the K-rations and C-rations provided to the militaryduring World War II.2 Drill instructors and companycommanders used smoking breaks as both reward andpunishment. Early studies found that rates of tobaccouse among the military were higher than those ofcivilians. However, beginning in the 1970s, theDepartment of Defense (DoD) changed its policies todiscourage tobacco use and smoking rates have sincedeclined substantially.
The DoD took its first major step to reduce smok-ing by discontinuing cigarettes in K-rations and C-rations to soldiers and sailors in 1975.3 Then in1986, a new DoD policy ended promotional activitiesby tobacco companies aimed primarily at DoD person-nel; established a system to monitor use of tobaccoproducts in DoD facilities; initiated smoking preven-tion and cessation programs; and proposed establish-ment of a Health Promotion Coordinating Commit-tee.4 That same year, tobacco use during boot campwas banned.3 In 1996, tobacco prices in militarycommissaries were increased, resulting in a one-yeartobacco sales drop of 20 percent.5 In 1997, an executiveorder banned smoking, effective in 1998, in all interiorspace owned, rented or leased by the executive branch,6
except, temporarily, for certain Morale, Welfare, andRecreation (MWR) facilities. By December 2002, allDoD facilities were mandated smoke free.
In 1999, the DoD established the Alcohol Abuse andTobacco Use Reduction Committee (AATURC). TheCommittee developed a strategic plan to reduce thesmoking rate, promote a tobacco-free lifestyle, educatecommanders on how to encourage healthy lifestyles,and reduce access to tobacco.7 Since its creation, the
Committee has supported policies to bring tobaccoprices at commissaries within 5 percent of local prices,helped to make MWR facilities smoke-free, andcoordinated with the American Legacy Foundation todevelop a DoD anti-tobacco marketing program.8
Besides regulations and price increases to reducetobacco use, the military health system (MHS) offersmedical assistance. Tobacco cessation programs andmedications are available from military treatmentfacilities (MTFs) of all services, though medicationavailability depends on the MTF’s budget. In 2001,the MHS established a clinical practice guideline forcessation in the primary care setting. The guidelineassists providers in detecting symptoms, assessingtreatment readiness, determining the appropriatesetting and intensity of treatment, and deliveringindividualized interventions.9
Figure 1 shows smoking rates calculated from theHCSDB for each beneficiary category, standardized totheir age and sex distribution for 2003. Smoking ratesfor all groups declined between 1998 and 2003. The
P R O J E C T R E P O R T
B BB B B BJ
J JJ J J
HH H
H H H
FF F F F F
1998 1999 2000 2001 2002 20035%
15%
25%
35%
B Active duty J Active duty family member
H Retired <65 F Retired 65+
Perc
ent
Figure 1: Smoking rates by beneficiary category

22
P R O J E C T R E P O R T
active duty rate fell from 26 percent to 22 percent andthe rate for family members of active duty fell a similaramount, from 21 to 18 percent. Most of the measureddrop in smoking rates occurred between 1998 and2001, as rates changed little between 2001 and 2003.
As shown in Figure 2, the proportion of smokerswho were counseled to quit increased for each benefi-ciary group. That increase was smallest for activeduty, whose rate went from 63 to 67 percent.
Each branch of service provides resources toencourage cessation. Each service offers similarprovider training courses, for example, on prescribingnicotine replacement therapy medication and encour-aging cessation. The Army and Navy offer links tosmoking cessation resources on wellness-promotionwebsites. For example, the US Army Center forHealth Promotion and Preventive Medicine and theNavy’s Environmental Health Center provide websiteswith resources for both clinicians and patients.
Figure 3 shows smoking rates by service affiliationof the beneficiary’s sponsor. These rates are age-sexstandardized to be comparable between services. Allsmoking rates have fallen, with the largest apparentdrop experienced by the Navy. Navy rates fell from
27 percent to 21 percent. The Air Force rate waslowest of the services in each year, falling from 23 percent to 18 percent. Figure 4 shows how manyhave been counseled to quit by service.
Counseling rates have increased for all threeservices, but differences between the services appearto have narrowed over time. Air Force counselingrates were highest in each year from 1999 to 2003,but the spread between the highest and lowest ratedecreased from 8 percent to 3 percentage points.
Figure 5 shows that Standard/Extra users’ age-sexadjusted smoking rates are highest compared to Primeand civilian insurance users and have increased since2001. As shown by Figure 6, counseling rates haveincreased for all enrollment groups. Counseling rateswere lowest for Standard/Extra users compared toPrime users and users of civilian insurance before2003, when the rate jumped from 60 to 72 percent.
Although tobacco cessation programs and medica-tions are available at MTFs, TRICARE policy specifi-cally excludes reimbursement for cessation-relatedexpenses.10 However, AATURC has encouragedTRICARE to add a cessation benefit. In 2003, TRICARE proposed a demonstration program forsuch a benefit, to be piloted in a limited area in 2004or 2005, covering counseling and prescription andover-the-counter medications with preauthorization.10
B
B
BB
B
J
J
J J JHH
H HH
F F F
F F
1999 2000 2001 2002 200350%
60%
70%
80%
B Active duty J Active duty family member
H Retired <65 F Retired 65+
Perc
ent
Figure 2: Counseled to quit by beneficiary category
B BB
B B B
JJ J
J J J
H
HH
HH
H
1998 1999 2000 2001 2002 200315%
20%
25%
30%
B Air ForceJ ArmyH Navy
Perc
ent
Figure 3: Smoking rates by sponsor service affiliation

23
P R O J E C T R E P O R T
Notes1Bray, Robert, Laurel Hourani, Kristine Rae, et al.
“2002 Department of Defense Survey of HealthRelated Behaviors Among Military Personnel.”
2Conway, Terry. “Tobacco Use and the UnitedStates Military: A Longstanding Problem.” TobaccoControl. Volume 7, 1998.
3Williams, Larry. “Tobacco Cessation and theDepartment of Defense/Department of Veterans AffairsPopulations.” Presentation at the 2004 TRICAREConference in Washington, DC. January 28th, 2004.
4Department of Defense. “DoD Directive Number1010.10.” March 11, 1986. At http://www.sbasap.com/files/d101010p.pdf.
5Philpott, Tom. “Commissary Director BealeInterviewed.” Naval Affairs. Fleet Reserve Association.At http://www.fra.org/navalaffairs/9904/na9904a.html.
6Kozaryn, Linda. “DoD to Phase Out Smoking atRecreation Facilities.” American Forces InformationService. April 14, 2000.
7AATURC. “Tobacco Use Prevention StrategicPlan.” April 2, 1999. At www.tricare.osd.mil/hpp/aaturc_actionplan_tobacco.html.
8Messelheiser, Dean . “DoD Tobacco UseCessation: What’s Working Now and the ChallengesAhead.” Presentation at the 2004 TRICAREConference in Washington, DC. January 28th, 2004.
9Tobacco Use Cessation Workgroup. “VHA/DoDClinical Practice Guideline to Promote Tobacco UseCessation in the Primary Care Setting.” Athttp://www.oqp.med.va.gov/cpg/TUC/G/TUC_CPG.pdf.
10Grissom, Joyce. “Benefits and AdministrativePrograms Under Development.” Presentation at theRegion 3 TRICARE Management ActivityConference on August 7, 2003.
B B
B
B BJ J
J J J
H
H
HH
H
1999 2000 2001 2002 200315%
20%
25%
30%
35%
B Civilian/VAJ PrimeH Standard/Extra
Perc
ent
Figure 5: Smoking rates by enrollment group
BB
BB
B
JJ
JJ
J
HH
H HH
1999 2000 2001 2002 200355%
60%
65%
70%
75%
80%
B Air ForceJ ArmyH Navy
Perc
ent
Figure 4: Counseled to quit by sponsor service affiliation
B B
B B B
J J
J J J
H
HH
H
H
1999 2000 2001 2002 200345%
55%
65%
75%
B Civilian/VAJ PrimeH Standard/Extra
Perc
ent
Figure 6: Counseled to quit by enrollment group

Issue Brief: TRICARE Civilian Network
24
P R O J E C T R E P O R T
When Prime, TRICARE’s health maintenanceorganization (HMO) option, was phased in
between 1994 and 1997, HMOs were growing inpopularity, enrolling increasing numbers of beneficiar-ies with private insurance, Medicare or Medicaid.HMOs lowered costs to consumers by negotiatingpayment discounts with providers, restricting patients’choice of doctor and treatments, and requiring doc-tors to bear financial risk for their patients’ costs. Inrecent years, however, patients have demanded agreater choice of providers and fewer restrictions onuse. By withdrawing or threatening to withdraw fromhealth networks, providers have capitalized ondemand for choice and have been rewarded byincreases in practice revenue and reduced oversightfrom health plans.1 HMOs forced to make higherpayments to providers and to reduce constraints onpatients’ use now face higher costs. HMOs haveresponded by raising the premiums paid by benefici-aries and their employers and raising charges topatients seeking care, making HMOs less attractive to consumers. Between 1999 and 2003, the proportionof American employees covered by HMOs or point-of-service (POS) health plans declined from 52 percent to 41 percent.2 Among Medicare benefici-aries, the proportion with HMO coverage droppedfrom 17 percent to 12 percent.3 In commercialmarkets, preferred provider organizations (PPOs) are now the most popular type of health plan, with a54 percent share.4
At present, HMO expansion continues underMedicaid, where containing costs is more importantthan beneficiary choice. Medicaid HMOs have pre-served their momentum by permitting their providernetworks to narrow and by focusing on Medicaidbusiness. Networks have narrowed because of low
payment rates and administrative burdens and becauseMedicaid HMOs continue to employ risk-basedcontracts with their physicians.5
TRICARE Prime now confronts a health caremarket where provider payments have increased andphysicians are willing to withdraw from networks thatare restrictive or offer low payment rates. Policymakers are concerned that low TRICARE paymentsmay result in decreased access for military beneficiar-ies. In response, payment rates for physicians inAlaska and Idaho were increased, which helpedcontractors to recruit more specialists in those areas.6
However, payment increases alone may not solvenetwork problems. Though managed care contractorscomplain that low reimbursement hinders recruit-ment, most physicians who leave the network citeother reasons.7
Results from the HCSDB, shown in Figure 1,indicate that the proportion of non-active duty enrolleeswho rely on the civilian network has remained about 40 percent or above since the beginning of 2003. Ineach quarter, about 30 percent of enrollees who havetried to use the network reported problems getting thecare they want from it and 30 percent who needed aspecialist reported problems finding a network special-ist. Twenty percent learned that a doctor they wanted tosee had left the network. The survey results do not giveevidence of worsening problems.
Retirees and their dependents and the familymembers of reservists are the heaviest users of thecivilian network. As shown in Table 1, 49 percent ofretired enrollees and their family members get mostor all of their care from the network, compared to 37 percent of active duty dependents. Among activeduty dependents, 61 percent of reservist family mem-bers rely on the civilian network. Though retirees

25
P R O J E C T R E P O R T
report fewer problems than do active duty families infinding the care or specialist they want from thenetwork, they are more likely to report that a doctorthey wanted to see had dropped out. Reservists aremore likely than other active duty family members toencounter problems finding care or specialists theywant, and are also more likely to report wanting tosee a doctor who had left the network.
More reservist families may use the networkbecause fewer of them live near a MTF. Enrolleeswho live at an inconvenient distance from militaryfacilities are most likely to be civilian network users.As shown in Table 2, 62 percent of enrollees livingoutside a MTF catchment area report getting all ormost of their care from the network. These remoteusers are no more likely to report problems seeingnetwork specialists but are more likely to reportwanting to use a physician who left the network thanare enrollees living a short drive from a MTF.
Table 3 indicates that the region where the enrolleesare least likely to use the network and the region withthe greatest access problems is the north (New England,the Midwest and Mid-Atlantic). Forty percent ofenrollees in the north use the civilian network for all ormost care compared with 43 percent in the west (thePacific coast, Southwest and Great Plains) and 48 percent in the south. Thirty-three percent in thenorth report problems finding a network specialistcompared to 30 percent in the south and 26 percent inthe west. Similarly, 34 percent in the northern regionreport problems getting the care they want compared to 29 percent of southerners and 27 percent of westerners.
B
B
B
B B B
J
J J J
J
H
HH
H
H
H
F
F
F F F
F
Q1 CY03
Q2 CY03
Q3 CY03
Q4 CY03
Q1 CY04
Q2 CY04
15%
20%
25%
30%
35%
40%
45%
50%
B Use network for most or all care
J Problems finding specialist
H Problems getting desired care from network
F Preferred physician left network
Figure 1: Prime enrollees use of TRICARE civilian network
Table 2. Network use by catchment area residence:Q3 CY03 to Q2 CY04
In Out of catchment catchment
Use network for most or all care 31% 62%
Problems finding specialist 30% 30%
Problems getting desired care from network 29% 30%
Preferred physician left network 19% 24%
Table 3. Network use by region: Q3 CY03 to Q2 CY04North South West
Use network for most or all care 40% 48% 43%
Problems finding specialist 33% 30% 26%
Problems getting desired care from network 34% 29% 27%
Preferred physician left network 22% 23% 21%
Table 1. Network use by beneficiary category:Q3 CY03 to Q2 CY04
Of active duty Retirees Active duty family members
and family Otherdependents member Reservist active duty
Use network for most or all care 49% 37% 61% 33%
Problems finding specialist 28% 32% 37% 32%
Problems gettingdesired care from network 27% 33% 35% 32%
Preferred physician left network 23% 19% 25% 18%

26
P R O J E C T R E P O R T
Recent developments in health care markets thathave weakened managed care and strengthenedproviders’ positions have left enrollees more vulnera-ble to shortages of doctors in the TRICARE network.Network use is lowest and network problems havebeen greatest in the north. Retirees and reservists’families appear to be most sensitive to problems withthe civilian network because they are more likely torely on it. Though there is no evidence from theHCSDB that network problems are increasing,reservists are likely to make up a growing part of theenrolled population, increasing the populations’sensitivity to network access problems. The newgeneration of managed care support contracts createsan opportunity to overcome these problems.
Notes1White, Justin, Robert E. Hurley and Bradley C.
Strunk. Getting Along or Going Along? Health Plan-Provider Contract Showdowns Subside. Issue BriefNo. 74 Center for Studying Health System Change.January, 2004
2Kaiser Family Foundation and Health ResearchEducation Trust. Employer Health Benefits: 2003.Menlo Park, California and Chicago, Illinois, 2003.
3Gold, Marsha and Lori Achman. ShiftingMedicare Choices, 1999-2003. MonitoringMedicare+Choice Fast Facts. December, 2003.
4KFF & HRET. op. cit.5Draper, Debra A., Robert E. Hurley and Ashley C.
Short. 2004. Medicaid Managed Care: The LastBastion of the HMO? Health Affairs 23(2): 155-167.
6United States General Accounting Office.Oversight of the TRICARE Civilian Network ShouldBe Improved. July, 2003.
7U.S. GAO op. cit.

Issue Brief: Referrals to Specialists
27
P R O J E C T R E P O R T
Under TRICARE Prime, military and civilianphysician networks both provide care to enrolled
patients. By permitting patients to get care from bothsources, Prime increases patients’ access to health careresources. However, combining the two networkscreates challenges in care coordination and manage-ment. HPA&E recently conducted focus groups withphysicians and patients to learn about problems withreferrals to specialists under Prime.1 Both doctors andpatients described barriers affecting access to special-ists and communication between primary care man-agers (PCMs) and specialists. Questions were addedto the HCSDB to learn more about these barriers.
Access to specialists
Before obtaining an appointment with a specialist,TRICARE enrollees must consult their PCM for areferral. Referrals from the PCM may be directed to aparticular specialist or clinic, or to a particular special-ty. In either case, TRICARE Access to Care standardsrequire that the enrollee be provided an appointmentwithin four weeks.2
Figure 1 shows the proportion of enrolled patientswho obtained appointments with civilian and MTFspecialists within 4 weeks, by region. In spite of accessstandards, many enrollees report long waits for bothdirect care and civilian appointments. One sixth ofthose seeing civilian specialists and one fifth of thoseseeing military specialists report a wait of longer than4 weeks. In the north, waits for military specialists areparticularly long.
Twenty-four percent in the north report waitingmore than 4 weeks to see a military specialist com-pared to 17 percent in the south and 18 percent in thewest. There is less regional variation in waiting timesfor civilian specialists. In both the north and west
region, 18 percent report waits of more than 4 weeks,compared to 15 percent in the south.
Patients who are referred to specialists may see acivilian specialist who is convenient to them or con-sult a direct care specialist. However, patients arereferred to direct care specialists in preference topurchased care specialists if direct care specialists areavailable. In some regions, the civilian network maycontain few members in the desired specialty. Inregions where PCMs are reluctant to make referralsto civilian specialists or where the civilian network isweak, patients may be forced to travel long distancesif their local MTF does not staff many specialists.
Figure 2 shows that travel times are longest in thenorth region. Eighteen percent report traveling overtwo hours to see a specialist at a MTF. Patients inthat region are also likely to spend a long time travel-ing to see civilian specialists, with 15 percent report-ing trips of more than two hours. Overall, Primepatients are only slightly more likely to make longtrips for MTF specialty care (14 percent) than forcivilian care (12 percent). The results indicate that
MHS
West
South
North
10% 15% 20% 25%
Civilian specialistMilitary specialist
Figure 1: Waiting more than 4 weeks to see a specialist

28
P R O J E C T R E P O R T
preferences for MTF care do not greatly increase thepatient’s travel burden.
Communication with specialists
PCMs are responsible for managing the care thepatient receives from all sources. By awareness of allthe patient’s specialty care, the PCM can avoid unnec-essary tests and treatments and manage all chronicand acute conditions. Focus groups revealed that bothdoctors and patients were concerned that communica-tion between PCMs and specialists was poor. HCSDBresults also indicate problems.
As shown in Table 1, information gets from special-ists to PCMs by different routes depending onwhether the referring PCM and specialist are militaryor civilian. PCMs learn about the patient’s treatmentby talking to the specialist 37 percent of the timewhen both specialist and PCM are civilian and 20 percent of the time when the PCM is military andthe specialist is a civilian. Military PCMs communicatewith civilian specialists most often through the patient.Twenty-seven percent of patients with military PCMsreport that they are responsible for keeping their PCMinformed about their treatment from specialists. Bycontrast when the specialist is military, neither civiliannor military PCMs are likely to communicate directly
with the specialist. Military PCMs are most likely to refer to the patient record (34 percent), whilecivilian PCMs most often refer to the patient record(24 percent) or the patient (23 percent).
As a result, many patients do not feel that theirPCM gets enough information about their specialtycare. As shown in Figure 3, only 52 percent ofpatients think their military PCM usually or alwaysknows enough about their care from civilian special-ists. Communication is rated best when both PCMand specialist are civilian. Sixty-eight percent withcivilian PCMs think that their PCM usually or alwaysknows enough about their care from civilian special-ists. Whether the specialist is from direct care orpurchased care, patients with civilian PCMs feel thattheir PCM is better informed about their specialtycare than do patients with military PCMs.
MHS
West
South
North
5% 10% 15% 20%
Civilian specialistMilitary specialist
Figure 2: Traveling more than 2 hours to see a specialist Table 1. How PCMs and specialists communicateCommunication method*
By patient Through Doctor torecord patient doctor
PCM Specialist Percent
Military Military 34 19 11
Civilian 15 27 20
Civilian Military 24 23 14
Civilian 11 20 37
*Omitted categories: Don’t know, PCM does not keep track.
MilitaryPCM
CivilianPCM
50% 55% 60% 65% 70%
Civilian specialistMilitary specialist
Figure 3: PCM usually/always knows enough about thecare received from a specialist, by PCM

29
P R O J E C T R E P O R T
Conclusions
Long waits for appointments and long trips to seespecialists vary by region, and appear to be mostfrequent in the north. These problems may beexplained by weaknesses in the civilian network.Strengthening the civilian network may help toovercome them. Communication problems are great-est when civilian specialists provide care to patients ofmilitary PCMs. To ensure high quality care, moremust be done to break down barriers between themilitary and civilian networks.
Notes1Cohen, R, Zeidman, E and Schone, E. The
TRICARE Referral and Authorization Process: Findingsfrom Focus Groups with Providers and Beneficiaries.Mathematica Policy Research, Washington DC. July, 2004.
2United States General Accounting Office. FactorsAffecting Contractors’ Ability to Schedule Appointments(GAO-00-137). Washington, DC: July 2000.

Issue Brief: Reservists’ Insurance Coverage
30
P R O J E C T R E P O R T
In recent years, both the number of mobilizedreservists called to active duty, and the length of
their deployments, have increased dramatically. As ofDecember 31, 2003, there were 183,746 mobilizedreservists, and the average length of duty was 319 days.1,2 Mobilization results in many changes inthe lives of reservists and their families, one of whichis how the reservist and his or her family may receivetheir health care.
When tours of duty are 30 days or less, theUniformed Services Employment and ReemploymentRights Act of 1994 protects reservists’ employer-provided health benefits, but if the length of duty is 31 days or more, civilian coverage continues only ifthe employee pays for coverage or the employeragrees to continue it. Reservists mobilized for morethan 30 days are covered by TRICARE Prime, andmost receive their care at military treatment facilities(MTFs). Dependents of reservists mobilized for more than 30 days are entitled to network or MTF care from TRICARE Prime, to TRICAREStandard/Extra, or TRICARE Prime Remote if theydo not live near MTFs.
As the number of military reservists called to activeduty, and their length of service increases, congresshas taken steps to improve reserve members’ healthbenefits. Congress has produced legislation to pro-mote the goals of ensuring that reservists have contin-uous coverage, that their financial burdens arereduced, and that disruption in the doctor-patientrelationship is avoided.3
To promote continuous coverage, the NationalDefense Authorization Act (NDAA) of 2005 makespermanent two provisions included in the 2004NDAA, allowing reservists and their families to
become eligible for TRICARE benefits up to 90 daysbefore and retain them as long as 180 days after,mobilization.4 The 2005 NDAA also extends coverageby allowing reservists who commit to continuedservice in the Selected Reserves to purchase TRICARE Standard for themselves and family mem-bers after they demobilize.5 TRICARE is providingthe benefit under the name TRICARE ReserveSelect, beginning in April, 2005.6
The 2005 NDAA reduces reservists’ financialburdens by waiving deductibles for reservists called toactive duty for more than 30 days, to ensure thatmobilized reservists do not pay deductibles for bothprivate health insurance and TRICARE. The legisla-tion also extends a waiver allowing physician pay-ments 15 percent above TRICARE’s maximum forreservists’ family members to avoid disrupting patient-doctor relationships.
Civilian Coverage Prior to Mobilization
Results from the HCSDB describe the healthinsurance coverage of reservists and their familiesbefore and after mobilization, who bears the cost ofcoverage, and how access to primary care and special-ist physicians has changed. Table 1 shows that mostreservists and their family members are covered underthe reservist’s policy before mobilization. Sixty-two
Table 1. Civilian insurance coverage of reservists and family members of reservists before mobilization
Family membersReservist of reservist
Civilian insurance through reservist’s policy 62% 62%
Civilian insurance through family member’s policy 14% 24%
No civilian health insurance 24% 13%

31
P R O J E C T R E P O R T
percent of mobilized reservists are covered undertheir own policy and the same percentage of familymembers had coverage through the reservist’s policy.A total of 76 percent of reservists and 87 percent offamily members surveyed had civilian coverage. Thedifference is because only 14 percent of reservists but24 percent of family members have coverage througha non-reservist family member’s policy.
Keeping Civilian Coverage after Activation
Table 2 indicates that most reservists and theirfamilies rely on TRICARE following mobilization.Sixty percent of family members say they rely onTRICARE only, and another 21 percent use bothcivilian coverage and TRICARE. Substantial propor-tions continue to carry civilian coverage, including 30 percent of reservists and a total of 40 percent offamily members.
As shown in Figure 1, continuing civilian coverage,even with TRICARE benefits, may represent a finan-cial burden. Of reservists who keep their civiliancoverage, more than half pay at least partial premi-ums. Forty-three percent receive a partial subsidyfrom their employer, while 8 percent receive nocontribution. Family members are still more likely tokeep their reservist’s civilian coverage, even when theymust pay for it. Nearly two thirds of those who retaintheir civilian coverage pay at least part of the premi-um and 30 percent retain coverage even though thereservist’s employer provides no assistance.
Reservist Family Members’ Access Under TRICARE
As shown in Figure 2, most family members usingTRICARE thought that the difficulty in seeing theirpersonal doctor or preferred specialist was the sameafter mobilization as it was before the reservist wasmobilized. However, more report that access topersonal doctors and specialists has worsened thanreport that it has improved.
Table 2. Reservists retaining civilian coverageReservists
Kept civilian coverage 30%
Dropped coverage 70%Reservists’ families
Use only civilian coverage 19%
Use civilian coverage and TRICARE 21%
Use only TRICARE 60%
Reservists’Families
Reservists
Employer paid all Employer paid part
No employer help
0% 10% 20% 30% 40% 50% 60% 70%
Figure 1: Employer contributions for reservists retainingcivilian coverage
Difficulty seeing the personal doctor they
wanted to see
Difficulty seeing the specialist they wanted
to see
0%
5%
10%
15%
20%
More difficult Less difficult
Perc
ent
Figure 2: Family members’ access to physicians underTRICARE following mobilization

32
P R O J E C T R E P O R T
Conclusion
Findings from the HCSDB indicate that nearlynine out of ten reservist family members were coveredby civilian insurance when their reservist was mobi-lized, 62 percent through the reservist’s policy.Though most of those covered by their reservist’sinsurance rely on TRICARE for coverage followingmobilization, 40 percent use civilian coverage for allor part of their care. Nearly a third of those whoretain civilian coverage do so even when they mustbear the full price of coverage. They retain coveragein spite of recent efforts to relieve them of financialburdens and to make relying on TRICARE easier.
Most family members who rely on TRICAREreport that their access to physicians has improved orstayed the same since mobilization. However, substan-tial numbers report that access to personal doctorsand specialists has worsened. Helping beneficiarieswho face poorer access under TRICARE or who areunwilling to give up civilian coverage even when theymust bear its full premium are specific goals of recentlegislation and TRICARE Reserve Select. Monitoringaccess and coverage decisions will indicate whetherthese efforts have been successful.
Notes1Department of Defense. “National Guard and
Reserve Mobilized.” Weekly News Release. Accessedat http://www.defenselink.mil/releases/archive.html.Retrieved 2/28/05.
2Office of the Secretary of Defense, ReserveAffairs, Employer Support of the Guard and Reserve.“Congressional Response.” Prepared for HouseReport 108-187. March 31, 2004
3FY 2005 National Defense Authorization Act.4These two provisions were to expire on Dec 31,
2004. Eligibility begins as soon as reservists receivetheir orders for activation or 90 days before activation(whichever is later), as long as their activation is formore than 30 days.
5Reservists must be called or ordered to active dutyon or after September 11, 2001. For each period of 90 consecutive days of active-duty service, the reservistis entitled to one year of TRICARE coverage while ina non-active duty status.
6“Coming Soon-TRICARE Reserve Select HealthPlan for Certain National Guard and ReserveMembers.” News Release, March 25, 2005. Athttp://www.tricare.osd.mil/news/2005/news0506.cfm.

HCSDB Issue Brief: Overweight Children in the Military Health System
33
P R O J E C T R E P O R T
In recent years, pediatricians have raised the alarmthat a “pandemic” of childhood obesity is affecting
American youth. Excess body weight in children canlead to many health problems, including type 2diabetes, once an adult disease, which has becomeincreasingly common in children. Overweight youthare also likely to become overweight adults, riskingnumerous health problems, including cancer, respira-tory conditions, and cardiovascular disease, as well aspremature death.1 The Centers for Disease Controland Prevention (CDC) has established standards forchildren’s weight based on the the distribution ofchildren’s height and weight during the 1970s.According to these standards, children are overweightif their body mass index (BMI), an index calculatedfrom their weight and height, is at or above the 95th percentile for children of their age and gender.Children are at risk for becoming overweight if theirBMI is above the 85th percentile but below the 95th percentile.
Prevalence
In the Health Care Survey of DoD Beneficiaries forchildren, parents are asked to report the estimatedheight and weight of a selected child. As shown inFigure 1, among DOD beneficiaries ages 6 to 17,BMI’s from parental reports indicate that approximate-ly 13 percent of children are overweight, and another17 percent are at risk for becoming overweight.
Within the sample of children 6 to 17, more boysare overweight than girls (16 percent compared to 11 percent), and children whose reporting parent isless educated are more often overweight than arechildren whose parent has at least some college
(16 percent compared to 13 percent with a highschool education). More black children are overweightand at risk for being overweight than are children ofother races or ethnicities.
Overweight13%
At risk17%
Normal63%
Underweight6%
Figure 1: Percent of children age 6 to 17 at, below,or over normal weight
Age 6 to 11 Age 12 to 170%
10%
20%
30%
40%
50%
60%
70%
80%
0 to 1 times/week 2 to 4 times/week
5 to 7 times/week
Perc
ent
Figure 2: Frequency of vigorous exercise

34
P R O J E C T R E P O R T
Physical Activity
Obesity arises when energy intake in the form offood exceeds energy expended through physicalactivity. Causes of obesity may be divided into thosethat reduce energy expenditure and those thatincrease intake. To identify the role of these factors,questions in the HCSDB ask about children’s exercise,television watching and consumption of fast foods.
According to their parents, children become lessactive as they get older. Fifty-six percent of childrenaged 6 to 11 and 38 percent aged 12 to 17 are vigor-ously active for at least 20 minutes 5 or more days perweek, where vigorous activity means exercise thatcauses heavy breathing or sweating. Nine percent ofyounger children and 19 percent in the older groupare vigorously active once per week or less.
Children who are overweight according to theirparents exercise less often than children of normalweight. As shown in Figure 3, 49 percent of over-weight children age 6 to 11 and 57 percent who are ofnormal weight exercise vigorously 5 or more days aweek, while 27 percent of overweight older childrenand 40 percent who are of normal weight exercisethat frequently.
Watching Television
Television watching and similar activities cansubstitute for physical activity, contributing to obesity.According to their parents, 40 percent of children 6 to 11 and 47 percent of children 12 to 17 watch 3 or more hours of television a day. Only 8 percent ofthe older group and 9 percent of the younger groupwatch one hour or less. Among overweight children,television watching is still more frequent: 58 percentin the older group and 49 percent in the youngerwatch 3 or more hours.
As shown in Figure 5, television watching is highestamong black children. Comparing overweight children with children of normal weight by race, 71 percent of overweight black children watch televi-sion 3 or more hours per day, compared to 36 percentof white children of normal weight.
Eating Fast Food
Obesity is also promoted when, through anunhealthy diet, energy intake is increased compared toenergy expended. One indicator for an unhealthy diet may be how often a child eats at a fast foodrestaurant. As shown by Figure 6, among DOD
Age 6 to 11 Age 12 to 170%
10%
20%
30%
40%
50%
60%
70%
80%
OverweightNormal
Perc
ent
Figure 3: Obesity and frequent vigorous exercise
Age 6 to 11 Age 12 to 170%
10%
20%
30%
40%
50%
60%
70%
80%
Less than 1 hr 1 to 3 hrs 3 or more hrs
Perc
ent
Figure 4: Daily television watching

35
P R O J E C T R E P O R T
beneficiaries ages 6 to 11, 18 percent never eat fastfood and 15 percent eat it three or more times a week.Among children 12 to 17, 15 percent never eat fastfood and 25 percent eat it three times a week or more.Fast food does not appear to be strongly associatedwith obesity, however. About a quarter of adolescentchildren of all weight categories eat fast food frequent-ly, as do 20 percent of obese and 15 percent of normalweight among children 6 to 11.
Conclusion
As in the civilian population, the number of over-weight children indicated by the HCSDB suggeststhat obesity is a growing problem in the MHS.Behavior that makes children more likely to beoverweight, such as not exercising enough, watchingmany hours of television and eating unhealthily aremore common among older children. Black childrenalso appear to be at greater risk for these reasons.Programs or communications to promote a healthylifestyle may be especially important for these groups.
Notes1U.S Surgeon General. “Overweight and Obesity:
Health Consequences.” The U.S. Surgeon General’sCall to Action to Prevent and Decrease Overweightand Obesity. Retrieved 12/13/04. http://www.surgeon-general.gov/topics/obesity/calltoaction/factsheet03.pdf.
Non-Hispanic white
Non-Hispanic black
Hispanic Other races20%
30%
40%
50%
60%
70%
80%
Normal Overweight
Perc
ent
Figure 5: Frequent television watching by race/ethnicityand weight
Age 6 to 11 Age 12 to 170%
10%
20%
30%
40%
50%
60%
70%
80%
Never 1 or 2 times/week 3 or more times/week
Perc
ent
Figure 6: Fast food consumption

HCSDB Issue Brief: Experiences of Children with Special Health Care Needs in TRICARE
36
P R O J E C T R E P O R T
Children with special health care needs (CSHCN)are “children who have or are at increased risk for
chronic physical, developmental, behavioral, oremotional conditions and who also require health andrelated services of a type or amount beyond thatrequired by children generally.” Among childrenwhose parents responded to the Health Care Surveyof DoD Beneficiaries (HCSDB), 26 percent who useTRICARE Prime or Standard/Extra for most of theircare were identified from survey responses asCSHCN.1 Many CSHCN need a wide range ofservices and may be at risk for poor health outcomesbecause their care, coordination of needed services, oraccess to care are inadequate. Recent studies ofCSHCN showed that 7 percent do not obtain neededspecialty care (Mayer, et al. 2004); 11 percent do notreceive needed therapy services; and 9 percent do notreceive needed mobility aids (Dusing, et al. 2004).
According to American Academy of Pediatrics(AAP) guidelines, doctors and health plans servingCSHCN should be particularly attentive to the needfor “accessible, comprehensive, continuous, compas-sionate and family-centered” care (American Academyof Pediatrics, 1999). Doctors and nurses must work toovercome families’ lack of information aboutresources, and to coordinate medical and non-medicalservices. With TRICARE, active duty parents ofchildren with special needs are served by programsthat provide access to needed services, assist parentswhen they must change duty stations, and provide
financial and other assistance purchasing neededservices or equipment (GAO, 2001).
Health Care Ratings
Most parents who rely on TRICARE give highmarks for the health care their children receive. Asshown in Table 1, among both CSHCN and non-CSHCN, about half of parents who respond give thehighest ratings (9 or 10) on a 1 to 10 scale to theirpersonal doctor or nurse (53 percent for CSHCN and50 percent for others), specialist (55 percent forCSHCN compared to 52 percent), and overall healthcare (53 percent for both).
In several dimensions of care that are particularlyimportant to CSHCN, their parents report bettercare than do parents of non-CSHCN. As shown inFigure 1, 78 percent of CSHCN have a personaldoctor or nurse compared to 67 percent of non-CSHCN. Similarly, parents of CSHCN are morelikely than non-CSHCN parents to report that theirchild’s personal doctor has spoken with the familyabout how the child is feeling, growing, or behaving.However, these results also indicate that of CSHCN,who are the children most in need of a personaldoctor, more than 20 percent did not have one.
Figure 1 also shows that 56 percent of families withCSHCN who got care from more than one type ofprovider or used more than one type of service gothelp coordinating their child’s care compared to 51 percent of families with non-CSHCN. Though
1HCSDB questions that identify CSHCN concernchildren’s need for prescription medicine; use of care oreducational services; or limitations in their ability to do thethings most children of the same age can do. The questionsare widely used by researchers into children’s health toidentify CSHCN.
Table 1. Health care of CSHCN and non-CSHCNCSHCN Non-CSHCN
Percent
Health care rated 9 or above 53 53
Personal doctor rated 9 or above 53 50
Specialist rated 9 or above 55 52

37
P R O J E C T R E P O R T
parents of CSHCN were more likely than parents ofnon-CSHCN to get help coordinating care, theirresponses indicate that nearly half of both CSHCNand non-CSHCN did not get the help they needed.
Another dimension of care particularly important toCSHCN is “family-centeredness.” Table 2 shows that, for families that have had to make decisions about theirchild’s health care, families with CSHCN and non-CSHCN report very similar experiences. About four-fifths of both groups say their doctors consistently involvethe family as much as the family wants in decisions abouttheir child’s care. Approximately three-fourths of parentsfor both populations, report their doctors offer choicesabout the child’s health care; 80 percent of parents reportthat these doctors discuss the pros and cons of theirchild’s treatment options; but only 71 percent of
CSHCN parents and 70 percent of non-CSHCN, saytheir doctors ask what choice the family prefers.
Access to Care
Many parents report that children who rely onTRICARE for their health care encounter accessproblems. As they do in the civilian population,CSHCN in TRICARE encounter problems morefrequently than do other children. For example, asshown in Figure 2, 51 percent of parents with non-CSHCN felt it was a problem to find their child apersonal doctor or nurse with whom they were happybut 67 percent of families with CSHCN reported thatproblem. More parents of CSHCN than parents ofnon-CSHCN also report it is a problem to see aspecialist or to get tests or treatments that theirdoctor thinks are needed.
Similarly, when children need special services, moreCSHCN than non-CSHCN encounter problemsmeeting their needs. As shown in Figure 3, parents of CSHCN report more problems getting prescrip-tion medicine (25 percent compared to 17 percent),special medical equipment (41 percent compared to25 percent), and special therapy (60 percent comparedto 43 percent).
Child has a personal doctor or nurse
Provider has spoken with the family about the child
Parent gets helpcoordinating care
40%
45%
50%
55%
60%
65%
70%
75%
80%
CSHCN Non-CSHCN
Perc
ent
Figure 1: Primary care for CSHCN and non-CSHCN
Table 2. Getting help with children’s special needsDoctors usually or always … CSHCN Non-CSHCN
Percent
Involve the family 82 81
Offer choices 77 76
Discuss pros and cons 80 80
Ask family what they prefer 71 70
Finding a personal doctor or nurse
Seeing a specialist Getting necessary care
10%
20%
30%
40%
50%
60%
70%
Non-CSHCNCSHCN
Perc
ent
Figure 2: Problems obtaining needed care by CSHCN and non-CSHCN

38
P R O J E C T R E P O R T
Because they must interact frequently with theirhealth plans to get access to the treatments theirchildren need, parents of CSHCN experience moreproblems with their health plans than do parents ofnon-CSHCN.
As shown by Figure 4, families with CSHCN aremore likely than other families to encounter delays
caused by waiting for health plan approval. Forty-sixpercent of CSHCN parents report problems withdelays compared to 30 percent of non-CSHCNparents. Compared to other families, more familieswith CSHCN encounter problems in finding infor-mation about how their health care plan works (55 percent compared to 48 percent), getting neededhelp from customer service lines (55 percent com-pared to 47 percent), and dealing with paperwork (34 percent compared to 25 percent).
Choice of Health Plan
From the health plan choices available throughTRICARE, 16 percent of CSHCN rely on TRICARE Standard/Extra for most of their carecompared to 11 percent of non-CSHCN (Figure 5).Fewer CSHCN than non-CSHCN are enrolled in TRICARE Prime (69 percent compared to 74 percent). As shown in Table 3, parents of CSHCN rate health care from their health planssimilarly to parents of non-CSHCN but care fromStandard/Extra is rated higher than care from Primeby parents from both groups.
Forty-four percent of both populations gave thebest ratings (a 9 or 10 on a 1 to 10 scale) to carereceived through TRICARE Prime and 59 percent ofboth populations gave high ratings to care receivedthrough TRICARE Standard/Extra. By contrast,health plan ratings are higher from parents relying on
Prescription medicine
Special medical
equipment
Special therapy
Treatmentor
counseling
10%
20%
30%
40%
50%
60%
70%
Non-CSHCNCSHCN
Perc
ent
Figure 3: Problems obtaining special services by CSHCNand non-CSHCN
Delays waiting for health plan
approval
Finding information
about health plan
Getting needed help
from customer service
Filling outhealth plan paperwork
20%
25%
30%
35%
40%
45%
50%
55%
60%
65%
70%
Non-CSHCNCSHCN
Perc
ent
Figure 4: Problems with health plan service by CSHCN and non-CSHCN
Prime74%
Standard/Extra16%
CSHCN Non-CSHCN
Prime69%
Standard/Extra11%
Other16%
Other14%
Figure 5: Choice of health plan

P R O J E C T R E P O R T
Prime for their children’s care than from parentsrelying on Standard/Extra.
In spite of large differences in ratings of health careand health plan between Prime and Standard/Extra,ratings of their plans by CSHCN parents are general-ly consistent with ratings by non-CSHCN parents. Asshown in Table 3, parents of children enrolled inTRICARE Standard/Extra, whether CSHCN or non-CSHCN, are less likely to report access problems,and are more likely to report favorably on interactionswith doctors and the family centeredness of their carethan parents of children enrolled in TRICARE Prime.Parents of children enrolled in Prime rate their healthplan higher than do Standard/Extra users and havefewer problems getting information about their healthbenefits. However, Prime enrollees are more likelythan Standard/Extra users to experience delays wait-ing for approval.
Conclusion
The quality of health care for CSHCN who areenrolled in TRICARE or who use TRICAREStandard/Extra appears to be equal to, or better than,that of other children who use these health plans.However, care can be improved in many ways importantto children with special health care needs. ManyCSHCN, particularly in Prime, do not have a personaldoctor, and their parents do not get information or helpin coordinating care that they need. Also, like children incivilian health plans, more CSHCN than non-CSHCNencounter problems in accessing needed care andinteracting with their health plan. Parents of CSHCNwho use Standard/Extra rate their child’s health care andaccess to care higher than do Prime users, but have moreproblems than Prime users getting information anddealing with paperwork. For parents who rely on Primeto provide care for their CSHCN, the goal of coordinat-ed, family-centered care may be promoted by ensuringthat such children have a personal doctor.
ReferencesAmerican Academy of Pediatrics. “Care Coordination:
Integrating Health and Related Systems of Carefor Children with Special Health Care Needs.”Pediatrics, vol. 104, no. 4, Oct 1999, pp 978-81.
Dusing SC, Skinner AC, Mayer ML. “Unmet Needfor Therapy Services, Assistive Devices, andRelated Services: Data from the National Survey ofChildren with Special Health Care Needs.” AmbulPediatr, vol. 4, no. 5, Sep-Oct 2004, pp. 448-54.
Mayer ML, Skinner AC, Slifkin RT. “Unmet need forroutine and Specialty Care: Data from the NationalSurvey of Children with Special Health Care Needs.”Pediatrics, vol. 113, no. 2, Feb 2004, pp. e109-15.
Silver EJ, Stein RE. “Access to Care, Unmet HealthNeeds, and Poverty Status Among Children Withand Without Chronic Conditions.” Ambul Pediatr,vol. 1, no. 6, Nov-Dec 2001, pp. 314-20.
United States Government Accounting Office. DisabilityPrograms Need Improvement and Face Challenges(GAO-02-73). Washington DC: Oct 2001.
Table 3. Health care and health plan featuresPrime Standard/Extra
CSHCN Non-CSHCN CSHCN Non-CSHCN
Percent
Health care
Health care rated 9 or above 44 44 59 59
Child has personaldoctor or nurse 75 66 89 78
Provider understandscondition affects family 74 67 86 85
No problem getting needed care 70 83 79 88
No problem seeing a specialist 55 67 64 78
Health plan
Health plan rated 9 or above 41 44 30 31
No problem with paperwork 68 77 59 64
No problem with delays awaiting approval 52 69 62 80
No problem withcustomer service 46 54 41 45


PR INCETON OFF I C E
PO Box 2393Princeton, NJ 08543-2393
(609) 799-3535Fax: (609) 799-0005
WASH INGTON OFF I C E
600 Maryland Avenue, S.W., Suite 550Washington, DC 20024-2512
(202) 484-9220Fax: (202) 863-1763
CAMBR IDGE OFF I C E
955 Massachusetts Avenue, Suite 801Cambridge, MA 02139
(617) 491-7900Fax: (617) 491-8044
Mathematica strives to improve public well-being by bringing the highest
standards of quality, objectivity, and excellence to bear on the provision of information collection and analysis to our clients.
Visit our website at www.mathematica-mpr.com


