Contents 1 Ansprechpartner Prof. Dr. Andreas Löschel (ZEW) L 7, 1 ‐ 68161 Mannheim Postfach 10 34 43 68034 Mannheim E‐Mail [email protected]Telefon +49 621‐1235‐200 Telefax +49 621‐1235‐206 Strategic Trade Policy and Critical Raw Materials in Stainless Steel Production Project Report Mannheim, 12. September 2013
2008). Johnson et al. (2008) calculate the energy needed to produce one ton
of austenitic stainless steel in three scenarios. One reflects the current average
mix between virgin materials and scrap3, while the other two represent a ton
solely produced from scrap and solely produced from virgin materials, respec‐
tively. They find that producing one ton of austenitic stainless steel needs en‐
ergy inputs of 53 GJ over the whole lifecycle in the current scenario, emitting
3.6 tons of CO2. If only scrap is used, the value decreases to 26 GJ (1.6 t CO2).
If only virgin ores are used, 79 GJ of energy are needed (5.3 t CO2).
Stainless steel scrap is collected and the contents of alloying elements are
analysed. Different types of scrap are then blended according to customer
specifications. These specifications are similar to the most important grades of
stainless steel. If necessary, virgin materials, such as ferrochrome, are added.
While the availability of virgin materials is determined by the location of their
deposits and their extraction costs, the availability of scrap reflects production
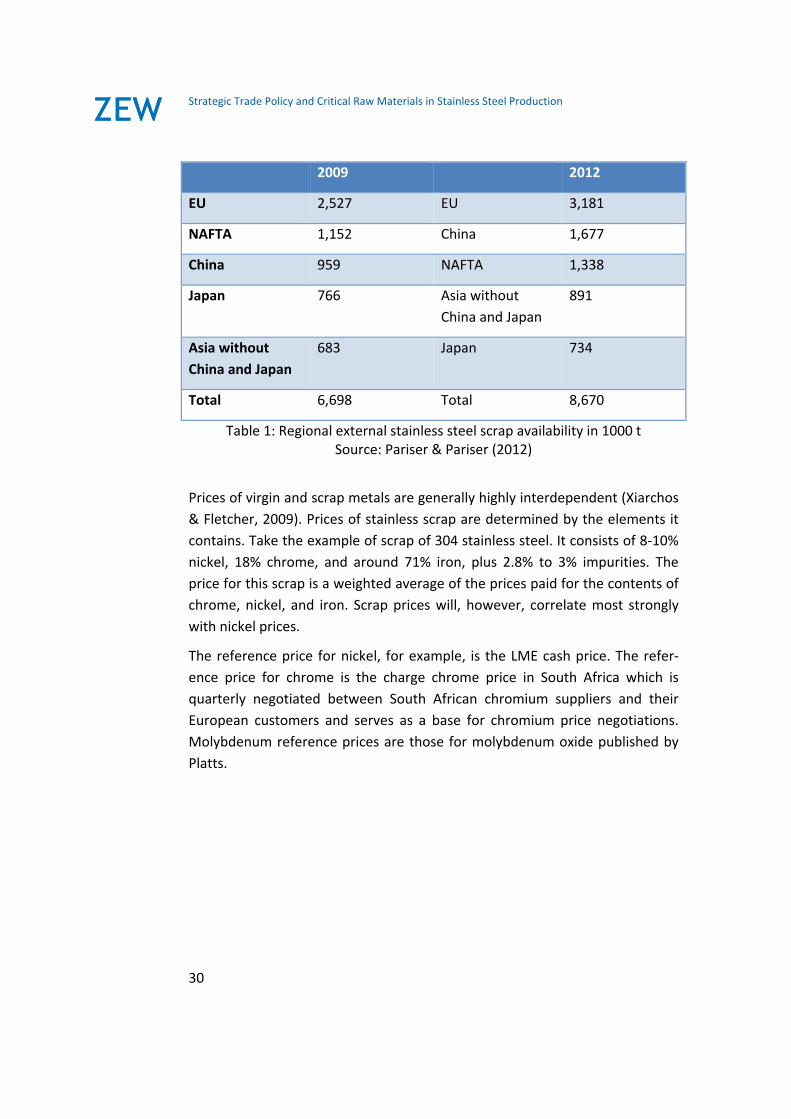
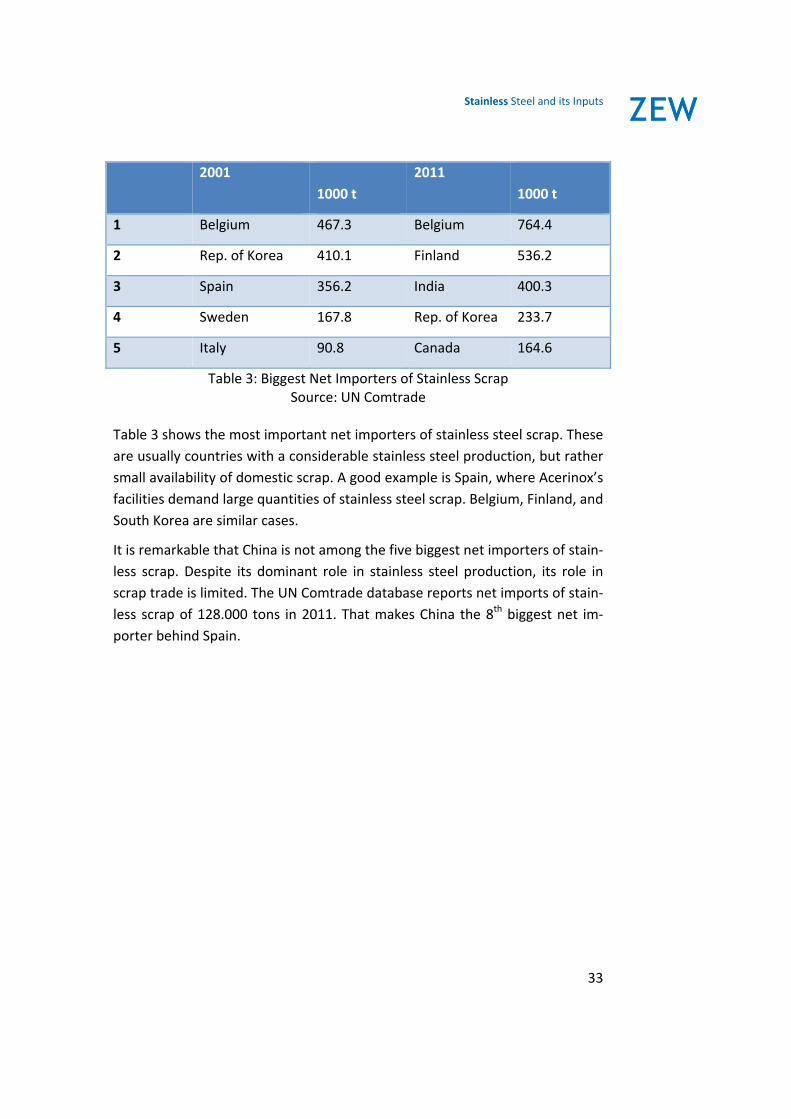
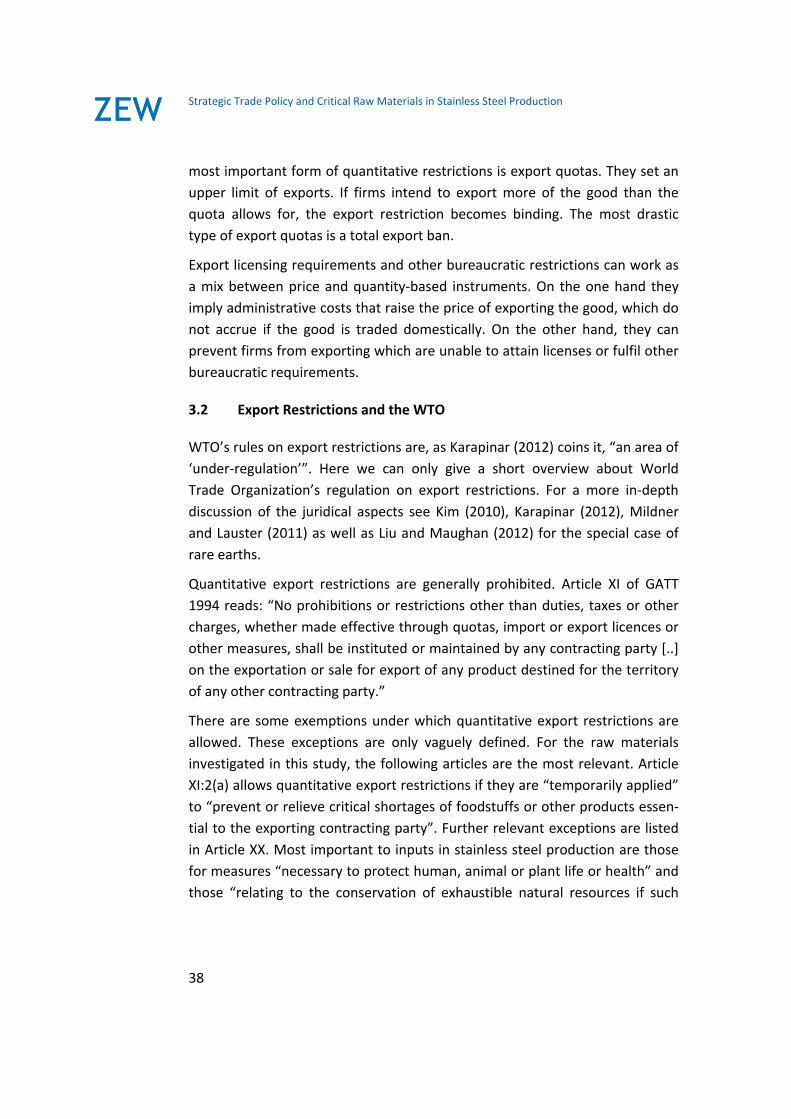
and consumption patterns. Table 1 shows how much external scrap is availa‐
ble in some key regions. The availability is generally calculated based on actu‐
ally traded scrap and therefore somewhat dependent on current market pric‐
es. Not surprisingly, large amounts of scrap are available in industrialised re‐
gions like the EU, the NAFTA, and Japan. China does catch up, however. The
quantity of stainless steel scrap available increased worldwide from 6.7 million
tons in 2009 to 8.7 million tons in 2012. It should be noted that most Chinese
scrap is new scrap, while old scrap is much more important in the EU or the
US.
3 They assume 42% for chromium, 43% for nickel, and 67% for iron.
Strategic Trade Policy and Critical Raw Materials in Stainless Steel Production
30
2009 2012
EU 2,527 EU 3,181
NAFTA 1,152 China 1,677
China 959 NAFTA 1,338
Japan 766 Asia without
China and Japan
891
Asia without
China and Japan
683 Japan 734
Total 6,698 Total 8,670
Table 1: Regional external stainless steel scrap availability in 1000 t Source: Pariser & Pariser (2012)
Prices of virgin and scrap metals are generally highly interdependent (Xiarchos
& Fletcher, 2009). Prices of stainless scrap are determined by the elements it
contains. Take the example of scrap of 304 stainless steel. It consists of 8‐10%
nickel, 18% chrome, and around 71% iron, plus 2.8% to 3% impurities. The
price for this scrap is a weighted average of the prices paid for the contents of
chrome, nickel, and iron. Scrap prices will, however, correlate most strongly
with nickel prices.
The reference price for nickel, for example, is the LME cash price. The refer‐
ence price for chrome is the charge chrome price in South Africa which is
quarterly negotiated between South African chromium suppliers and their
European customers and serves as a base for chromium price negotiations.
Molybdenum reference prices are those for molybdenum oxide published by
Platts.
Stainless Steel and its Inputs
31
Prices are usually discounted compared to their reference prices. The discount
lied in a ballpark of 10% for nickel, 15% for chrome, and 30% for Molybdenum4
in the last few years (Pariser & Pariser, 2012).
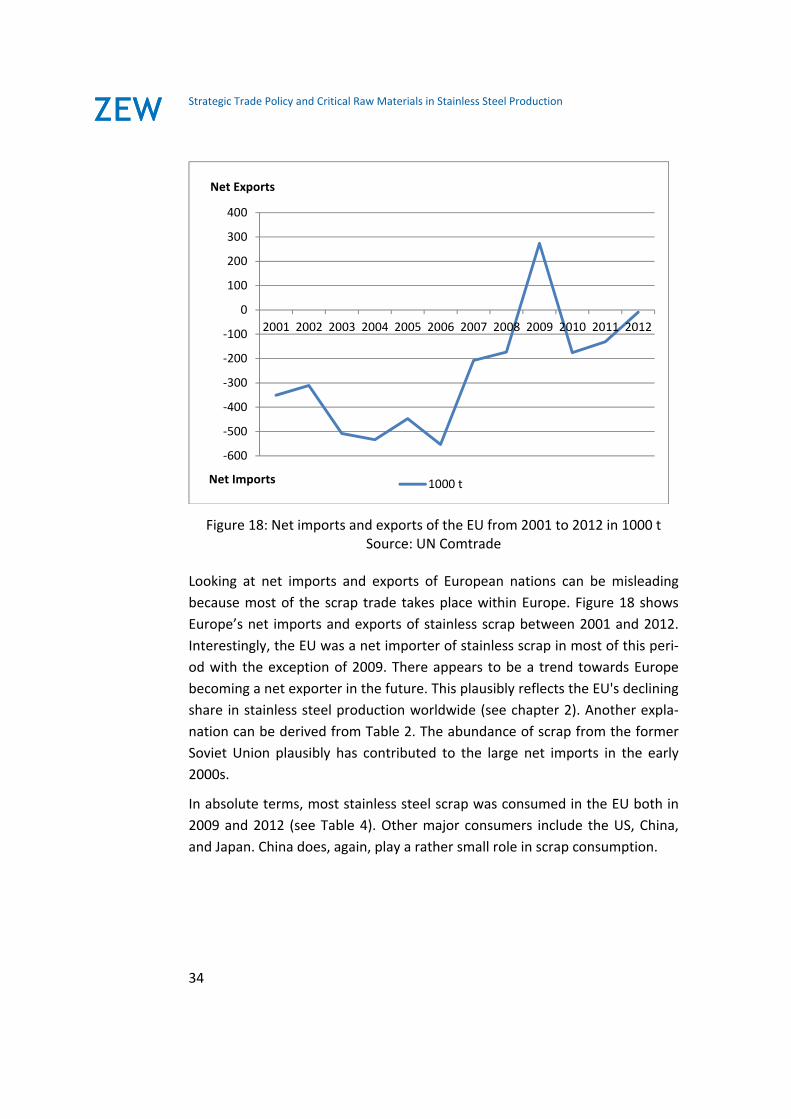
Figure 17: Trade of stainless steel scrap
Source: UN Comtrade
4 The reference prices for molybdenum vary with the molybdenum content of the scrap. The higher the content, the lower the discount. For a molybdenum content of 2%, the discount is around 20%. If the content is lower, the discount increases.
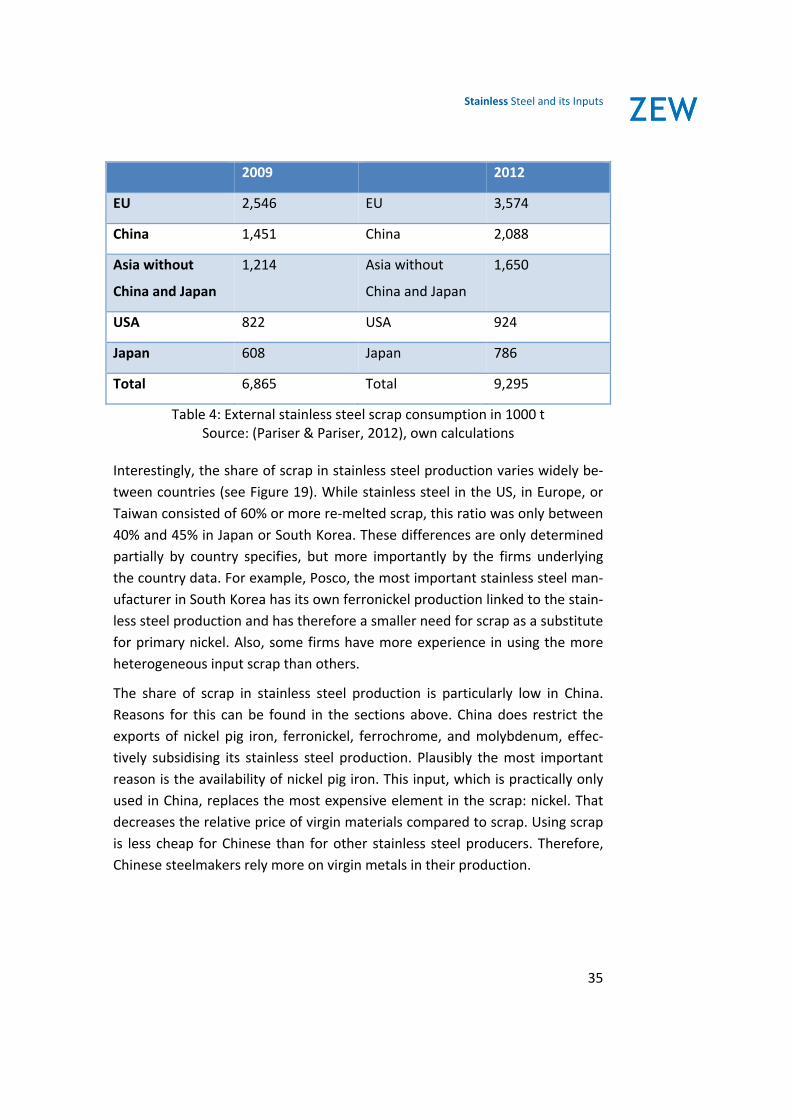
Table 4: External stainless steel scrap consumption in 1000 t Source: (Pariser & Pariser, 2012), own calculations
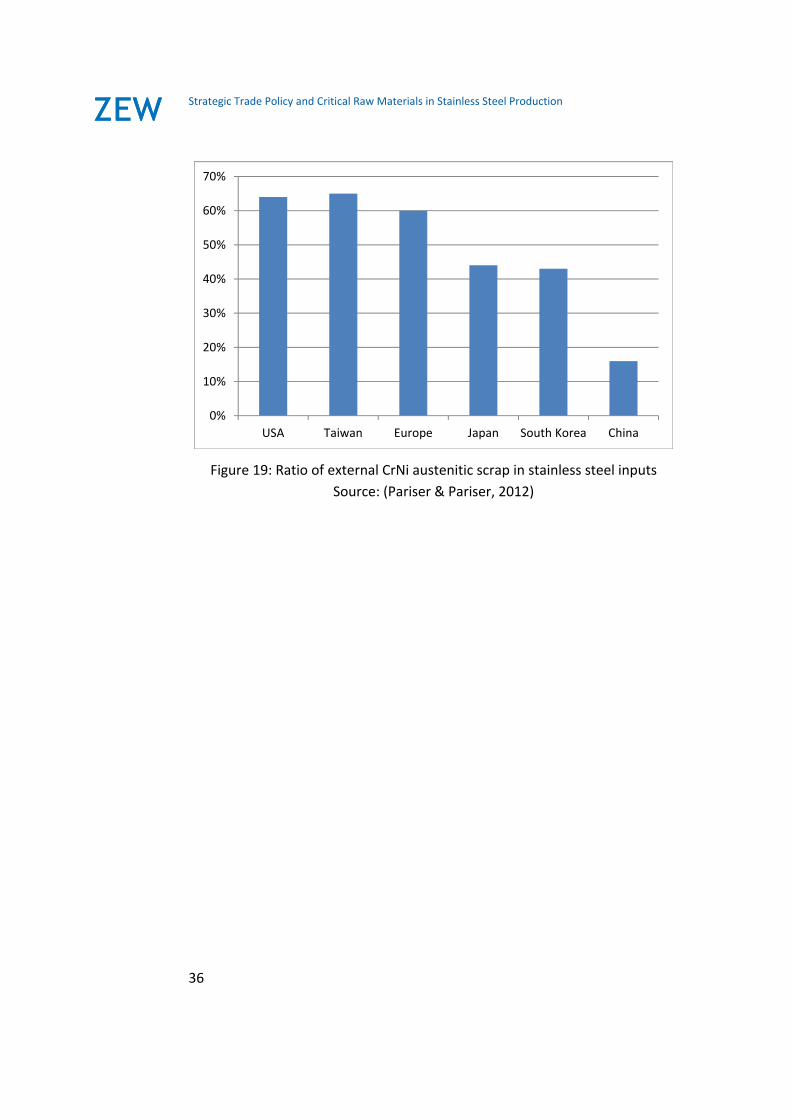
Interestingly, the share of scrap in stainless steel production varies widely be‐
tween countries (see Figure 19). While stainless steel in the US, in Europe, or
Taiwan consisted of 60% or more re‐melted scrap, this ratio was only between
40% and 45% in Japan or South Korea. These differences are only determined
partially by country specifies, but more importantly by the firms underlying
the country data. For example, Posco, the most important stainless steel man‐
ufacturer in South Korea has its own ferronickel production linked to the stain‐
less steel production and has therefore a smaller need for scrap as a substitute
for primary nickel. Also, some firms have more experience in using the more
heterogeneous input scrap than others.
The share of scrap in stainless steel production is particularly low in China.
Reasons for this can be found in the sections above. China does restrict the
exports of nickel pig iron, ferronickel, ferrochrome, and molybdenum, effec‐
tively subsidising its stainless steel production. Plausibly the most important
reason is the availability of nickel pig iron. This input, which is practically only
used in China, replaces the most expensive element in the scrap: nickel. That
decreases the relative price of virgin materials compared to scrap. Using scrap
is less cheap for Chinese than for other stainless steel producers. Therefore,
Chinese steelmakers rely more on virgin metals in their production.
Strategic Trade Policy and Critical Raw Materials in Stainless Steel Production
36
Figure 19: Ratio of external CrNi austenitic scrap in stainless steel inputs
Source: (Pariser & Pariser, 2012)
0%
10%
20%
30%
40%
50%
60%
70%
USA Taiwan Europe Japan South Korea China
Basics of Export Restrictions
37
3 Basics of Export Restrictions
3.1 Definition and Types of Export Restrictions
Like many other forms of trade restrictions, export restrictions can be erected
in many different ways, some of which can be fairly subtle. This complicates
the definition of export restrictions. In this study, we rely on the definition
adopted by the WTO panel deciding the “United States ‐ Measures Treating
Exports Restraints as Subsidies” case in 2001 (WTO, 2001a). It defines export
restrictions as “a border measure that takes the form of a government law or
regulation which explicitly limits the quantity of exports or places explicit con‐
ditions on the circumstances under which exports are permitted, or that takes
the form of a government‐imposed fee or tax on exports of the products cal‐
culated to limit the quantity of exports”.
Export barriers are multifaceted and vary from case to case, but can be classi‐
fied broadly into price and quantity‐based instruments. Price based instru‐
ments directly and explicitly introduce a gap between domestic and foreign
prices of the goods. They influence quantities exported indirectly. The most
frequent form of price based instruments is an export tax.
The terms ‘export taxes’, ‘export tariffs’ or ‘export duties’ are used synony‐
mously in this study. They denote duties levied on exports of a good, either ad
valorem on its price or specific as a per‐unit tariff. In some cases, such as the
current Russian export tariffs on nickel, per‐unit tariffs are adjusted regularly
to the world market prices (see subsection 6.1.1). Another price‐based regula‐
tion is minimum export prices defined by the government. They become bind‐
ing in situations where world market prices for the good are below the mini‐
mum level defined by the government.
Price‐based instruments can take unusual forms. Price and Nance (2010) pre‐
sent an example from India. Between November 2009 and April 2010, state‐
owned India Railways raised freight rates for iron ore intended for export by
50%. Because transportation costs make up about 80% of the total cost of that
ore large effects of this instrument are implied.
Quantitative measures directly limit the physical amount of a good exported.
Indirectly, they introduce a gap between domestic and foreign prices. The
Strategic Trade Policy and Critical Raw Materials in Stainless Steel Production
38
most important form of quantitative restrictions is export quotas. They set an
upper limit of exports. If firms intend to export more of the good than the
quota allows for, the export restriction becomes binding. The most drastic
type of export quotas is a total export ban.
Export licensing requirements and other bureaucratic restrictions can work as
a mix between price and quantity‐based instruments. On the one hand they
imply administrative costs that raise the price of exporting the good, which do
not accrue if the good is traded domestically. On the other hand, they can
prevent firms from exporting which are unable to attain licenses or fulfil other
bureaucratic requirements.
3.2 Export Restrictions and the WTO
WTO’s rules on export restrictions are, as Karapinar (2012) coins it, “an area of
‘under‐regulation’”. Here we can only give a short overview about World
Trade Organization’s regulation on export restrictions. For a more in‐depth
discussion of the juridical aspects see Kim (2010), Karapinar (2012), Mildner
and Lauster (2011) as well as Liu and Maughan (2012) for the special case of
rare earths.
Quantitative export restrictions are generally prohibited. Article XI of GATT
1994 reads: “No prohibitions or restrictions other than duties, taxes or other
charges, whether made effective through quotas, import or export licences or
other measures, shall be instituted or maintained by any contracting party [..]
on the exportation or sale for export of any product destined for the territory
of any other contracting party.”
There are some exemptions under which quantitative export restrictions are
allowed. These exceptions are only vaguely defined. For the raw materials
investigated in this study, the following articles are the most relevant. Article
XI:2(a) allows quantitative export restrictions if they are “temporarily applied”
to “prevent or relieve critical shortages of foodstuffs or other products essen‐
tial to the exporting contracting party”. Further relevant exceptions are listed
in Article XX. Most important to inputs in stainless steel production are those
for measures “necessary to protect human, animal or plant life or health” and
those “relating to the conservation of exhaustible natural resources if such
Basics of Export Restrictions
39
measures are made effective in conjunction with restrictions on domestic pro‐
duction or consumption”.
Export duties are not generally prohibited if regulation on this issue was not
part of additional agreements during the accession of a country. The most
favored nation principle applies for export restrictions.
Article X of GATT 1994 requires members to publish data about trade related
laws and regulations. This generally includes export restrictions as well. There
is, however, no comprehensive database available for export restrictions.
3.3 Empirical Literature on Export Restrictions
While the literature on export restrictions on stainless steel inputs is thin, a
number of scientific papers and reports have analysed export restrictions on
natural resources more generally. Probably the most important example is the
WTO’s World Trade Report of 2010, which dealt with trade in natural re‐
sources, including export barriers on those (WTO, 2010). An overview about
export restrictions on raw materials can also be found in Piermartini (2004)
and Latina et al. (2011). Kim (2010) provides information about a large number
of export restrictions and shows an increasing prevalence of export barriers
from 2003 to 2009. Price et al. (2008) review export restrictions as well as oth‐
er raw materials related policies in China, Russia, India, and the Ukraine.
The closest papers to our study with respect to the empirics are Korinek and
Kim (2010), and Price and Nance (2010). Korinek and Kim (2010) analyse ex‐
port restrictions applied on chromium, molybdenum, and rare earths. Price
and Nance (2010) investigate export restrictions on inputs in steel production.
They focus on iron ore, coke, and steel scrap, which are needed to produce
carbon steel. Fliess and Mård (2012) analyse the OECD’s inventory on export
restrictions covering 2009 and 2010. The paper is insofar related that their
data also forms the point of departure for our empirical research.
Research analysing the effects of export restrictions, either ex‐post or ex‐ante,
is mostly restricted to agricultural goods. Some case studies can be found in
Piermartini (2004). Other papers include Martin and Anderson (2011) as well
as Warr (2001).
Strategic Trade Policy and Critical Raw Materials in Stainless Steel Production
40
4 Economic Effects of Export Restrictions
4.1 Basic Framework
In this section, we harness modern trade theory to explain the effects of ex‐
port barriers as a first step towards understanding the incentive to use them.
We discuss them using the simple diagrams that are the theorist’s tool of
choice. This basic analysis already allows to deduct some important incentives
to restrict exports.
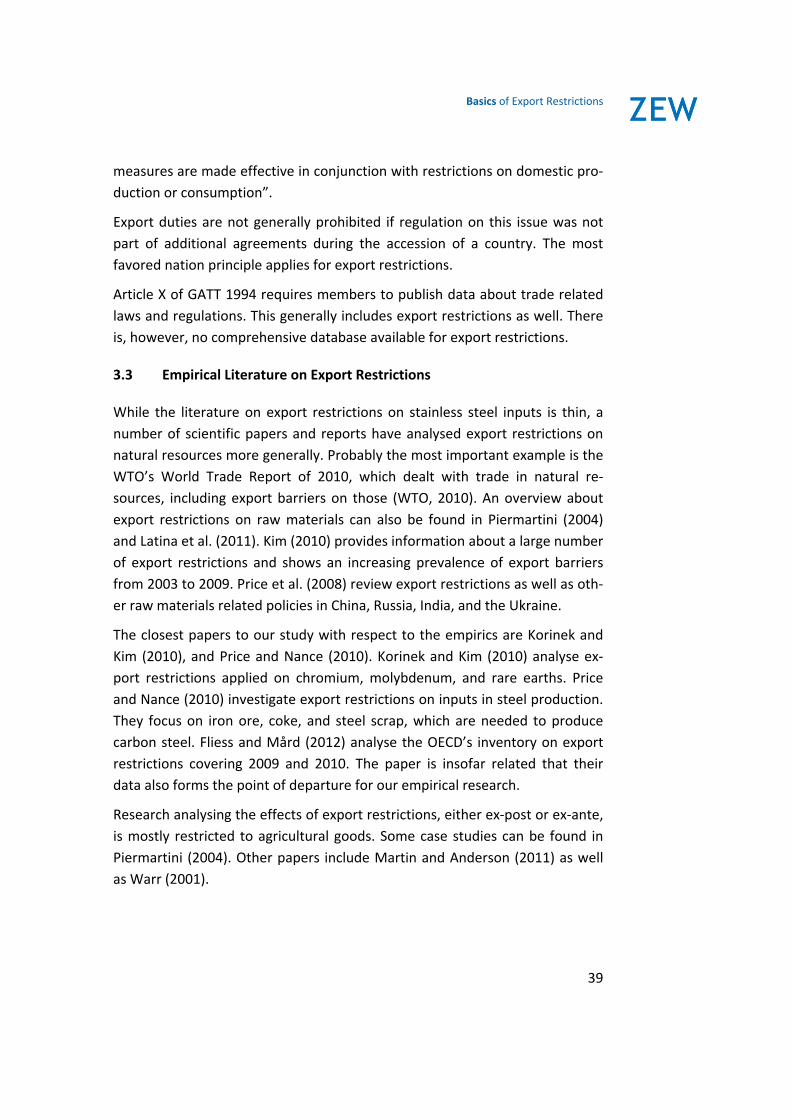
Figure 20 depicts the domestic market in a country called ‘home’ for a good
and its interaction with the world market. The good, which we call g for the
sake of brevity, can represent nickel, chrome, stainless scrap, or some other
input in stainless steel production. We will use the same framework of analysis
in the whole chapter.
In Figure 20 as well as the following figures in this chapter, p represents prices
for good g and q the quantities produced and consumed, respectively. ex is
the amount of g exported. If ex is negative, the good is imported.
Figure 20: Comparison between free trade and autarky
The left side of Figure 20 shows the domestic supply curve Sd and the domestic
demand curve Dd. Both depend on price level p. If no international trade takes
place, the intersection of supply and demand marks the equilibrium in autarky
paut and qaut.
Economic Effects of Export Restrictions
41
The interaction between domestic and world market is shown on the right
side of Figure 20. For each price greater than paut, domestic supply produces
more of good g than domestic demand wants to consume. The country ex‐
ports to the world market. If prices are lower, domestic supply does not satisfy
demand and country d is a net importer. The export supply curve Sw is derived
from these considerations. It denotes the difference between domestic supply
and domestic demand for each price p. There is a positive supply to the world
market for p> paut and a negative one for p< paut. Export supply faces a residual
demand from the world market, depicted by the curve DRes. It shows how
much nickel, chrome, or scrap a country can export for any given price.
Figure 4 is a meaningful representation of international trade in goods for
which trade costs are relatively small. In such a case, the so‐called ‘law of one
price’ holds and the local prices are close to the world market price. The free
trade equilibrium is given by the intersection of export supply and residual
demand. Price p*, domestically consumed quantity q*D and domestically pro‐
duced quantity q*S form the equilibrium. The country is a net exporter with
the amount of exports denoted by ex*.
4.2 Export Restrictions in Large and Small Countries
What are the effects of introducing an export tax of t per unit of the raw ma‐
terial exported? When discussing the effects of an export tax, trade theory
reminds us that two cases have to be differentiated: the large country and the
small country.
The terms large and small country should not be interpreted as the size or the
number of inhabitants of that nation. A country is termed ‘large’ if it possesses
a nickel, chrome, molybdenum, or scrap sector that is large enough such that
the sector’s behaviour has effects on world market prices. Technically speak‐
ing, it faces a less than perfectly elastic residual demand.
A country is termed ‘small’, on the other hand, if its export or import decisions
do not affect world market prices. Its residual demand curve is horizontal, it
can only decide to supply for a given world market price or abstain from doing
so.
Strategic Trade Policy and Critical Raw Materials in Stainless Steel Production
42
We first discuss what happens if a large country implements an export tax of t.
Now buyers on the world market do not only have to pay what the domestic
producer receives, but also the tax. This shifts the export supply curve Sw up to
Sw’. The world market exhibits a new equilibrium with quantity ex’ exported at
an international price of pw’. The former is lower than under free trade, while
the latter is higher. Domestic prices lie below world market levels. The differ‐
ence must equal t, otherwise there would be room for arbitrage. The new do‐
mestic price pD’ lies below the free trade price. Consumption in d is expanding
to qD’, while production of the good g is decreasing to qS’. The grey area is the
government revenue generated by the export tax.
Figure 21: Effects of an export tax for a large country
When evaluating the welfare effects of an export tax, two things need to be
compared. The reddish triangles on the left side of Figure 21 equal the
deadweight loss introduced by the export tax. A too large quantity of the raw
material is used, which means the stainless steel sector expands beyond opti‐
mal levels. The quantity of raw materials produced is too small. The so‐called
‘deadweight loss’ is a loss of welfare in the country introducing the tax. It is
‘deadweight’ since no other country benefits from this domestic welfare loss.
The hatched area displays the terms‐of‐trade effect. The terms‐of‐trade are
defined as the prices that a country receives for its exports divided by the
prices of its imports. An export tax on q increases home’s exports prices. That
means the exporting country can buy a greater amount of goods abroad for
what it receives for its exports. This represents a welfare gain for country d. If
Economic Effects of Export Restrictions
43
the terms‐of‐trade effect is larger than the deadweight losses, home enjoys
welfare gains from the export tax.
The rest of the world unambiguously loses from the introduction of an export
tax. It faces a higher world market price and the implied deadweight loss.
Gains in the exporting nation are generated at the expenses of the rest of the
world.
Against the background of the ‘large’ country case, we now compare this to
the effects that the introduction of an export tax has in a small country. Recall
that a small country’s supply is not large enough to influence world market
prices. Its residual demand curve DRes is horizontal.
Dd Sd
DRes
Sw
p p
q exq*D q*S ex*
p*=
qD‘qS‘
pw‘
pD‘
ex‘
t
S‘w
Figure 22: Effects of an export tax for a small country
Figure 22 depicts the small country case. As it will turn out later, many export
barriers on scrap metals in developing countries are such cases. The small
country is not able to change the world market price, so the immediate effect
of its export tax is a drastic reduction of exports, from ex* to ex’. The unaf‐
fected world market prices also mean that country d will not enjoy gains in
terms‐of‐trade. Since exports dwindle, tax revenue is small. What basically
happens is a domestic redistribution of wealth from the suppliers of the re‐
source to its domestic consumers, plus notable deadweight losses due to im‐
plied inefficiencies. It is apparent that a small country does not have the pos‐
sibility to increase its welfare using export restrictions based on arguments
derived from this model.
Strategic Trade Policy and Critical Raw Materials in Stainless Steel Production
44
4.3 Winners and Losers
Irrespective of whether a country can achieve overall welfare gains from ex‐
port restrictions or not, their introduction always gives rise to a redistributive
element. Some sectors lose from trade restrictions, some benefit, both within
and between countries.
In the country implementing an export tax the domestic demand side benefits
from the export restriction. If an exporting country erects barriers for export‐
ing chromium ores, it is the ferrochrome sector which benefits. If ferrochrome
exports are hindered, it is the stainless steel sector which gains from facing
lower prices and expanding production. The consumer surplus is larger due to
the export restriction. The supply side has to bear parts of the costs or, in case
of a small country, the whole costs. It receives a lower price and produces less
than under free trade.
The division of costs between the domestic supply side and foreign firms de‐
pends strongly on the market power a nation has. If a country has strong mar‐
ket power and its residual demand is inelastic, costs are imposed on the rest of
the world. If it does possess weak market power, domestic supply bears most
of the cost.
An export restriction on a raw material is an indirect subsidy for downstream
firms, in our case stainless steel producing firms. This subsidy also affects fur‐
ther downstream sectors. Stainless steel production in that country is subsi‐
dised and the output gets cheaper. This lowers the costs of manufacturing
firms using stainless steel. The subsidy is passed through the value chain. If
trade is not perfectly costless, domestic sectors benefit disproportionately. It
is, however, challenging to quantify these effects empirically.
Figure 23 shows who wins and who loses in an importing country if exports of
an input in stainless steel production are restricted. Let’s use stainless steel
scrap as an example. Effects are a mirror‐image to what happens in the ex‐
porting country. The introduction of an export tax increases the world market
price from p* to pW. The stainless steel sector reacts by lowering its produc‐
tion, leading to a welfare loss. Domestic scrap owners and traders benefit. The
scrap collecting sector expands beyond optimal levels. The magnitude of this
Economic Effects of Export Restrictions
45
effect depends on how elastic scrap demand and supply reacts on the export
barriers.
Di
p
q
Si
p*
pw‘
Figure 23: Effects of the tax in an importing country
Importing countries might not be endowed with the raw material on which the
export restrictions are applied. In this case, only the demand side will be af‐
fected. This resembles the European situation for nickel, chrome, and molyb‐
denum.
Factors of production are affected by export taxes as well. Mobile factors will
move to the sector which benefits from the restriction (the steel sector in the
domestic country, mining, or recycling sectors abroad). Immobile factors are
not able to move to other sectors and will be affected more strongly. Owners
of mining licenses in the domestic country or to owners of capital specific to
steelmaking abroad will suffer from devaluation.
4.4 Taxes and Quantitative Restrictions
So far, only taxes restricting exports were part of our analysis. Quantitative
limitations to exports, such as quotas, non‐automatic licensing, or export pro‐
hibitions, play an important role in practice as well. In this subsection, we
compare the effect of a quantitative export restriction with those of a tax.
Strategic Trade Policy and Critical Raw Materials in Stainless Steel Production
46
Figure 24: Export quota
Figure 24 displays the effect of an export quota of exquo. When carefully com‐
paring Figure 24 to Figure 21, one can see that the export quota exquo yields
the same exports, price differentials and terms‐of‐trade effects than the tariff
t in Figure 21. This is a more general result. For each tariff t, there is an equiva‐
lent quota which yields the same implicit tariff (Baghwati, 1965).
The theoretical equivalence is based on the very strong assumptions of perfect
competition in supply, demand, and auctioning of the quotas. Otherwise, tar‐
iffs are preferable from an efficiency standpoint because they leave less room
for manipulating the prices.
If an export quota represents a binding restriction, a shadow price is implied.
In figure 5 the shadow price equals the tariff t in figure 2. The implied rent is
the yellow area.
A general problem is the mechanisms used to allocate the licenses or the quo‐
ta and to specific firms. This is often done in an intransparent manner leaving
room for corruption and nepotism.
4.5 Why Export Restrictions Became More Prevalent after 2002
The number of export restriction applied to natural resources has increased
significantly after 2002 (Kim, 2010). This can be explained by increased incen‐
tives for introducing them after 2002, when the market turned from a buyers’
Economic Effects of Export Restrictions
47
to a sellers’ market, in particular because of China’s dynamic growth (Stürmer,
2008).
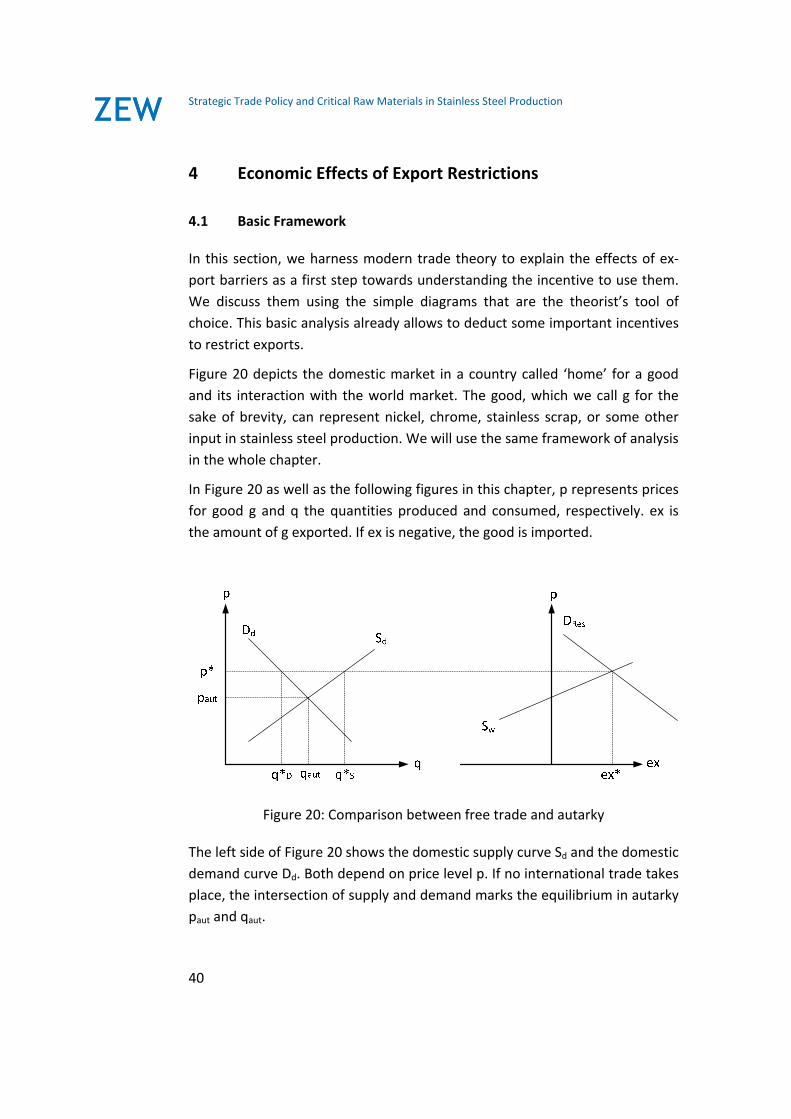
Figure 25 and Figure 26 show why there are more incentives to introduce ex‐
port restrictions after 2002 than there were before. Figure 25 depicts the situation before 2003. Sufficient capacities were availa‐
ble for many natural resources – including those needed in steel production –
to satisfy the respective demand. This means export reductions by a country
could easily be absorbed by supply in the rest of the world. Exporting coun‐
tries face an elastic residual demand.
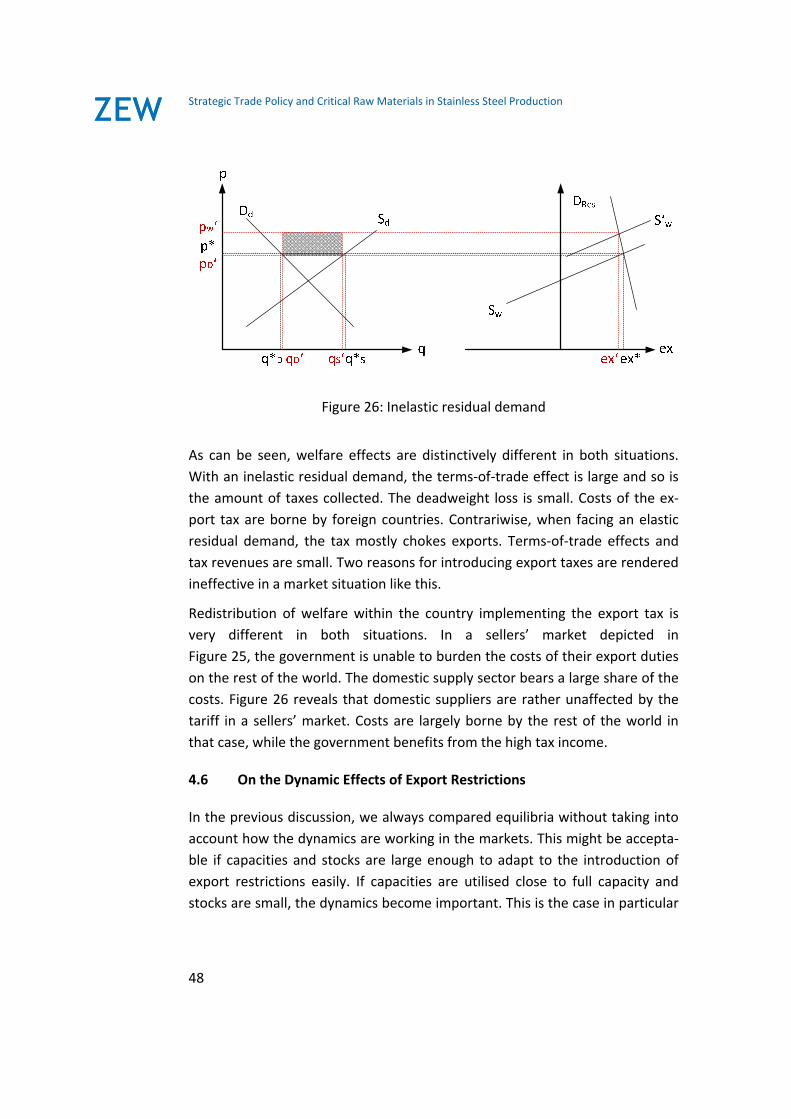
Figure 26 corresponds to the situation where Chinese demand growth in‐
creased the utilisation of capacities. If home country’s export supply changes
now, other countries find it much harder to adjust their production, leading to
an inelastic residual demand for d’s exports.
Figure 25: Elastic residual demand
Strategic Trade Policy and Critical Raw Materials in Stainless Steel Production
48
Figure 26: Inelastic residual demand
As can be seen, welfare effects are distinctively different in both situations.
With an inelastic residual demand, the terms‐of‐trade effect is large and so is
the amount of taxes collected. The deadweight loss is small. Costs of the ex‐
port tax are borne by foreign countries. Contrariwise, when facing an elastic
residual demand, the tax mostly chokes exports. Terms‐of‐trade effects and
tax revenues are small. Two reasons for introducing export taxes are rendered
ineffective in a market situation like this.
Redistribution of welfare within the country implementing the export tax is
very different in both situations. In a sellers’ market depicted in Figure 25, the government is unable to burden the costs of their export duties
on the rest of the world. The domestic supply sector bears a large share of the
costs. Figure 26 reveals that domestic suppliers are rather unaffected by the
tariff in a sellers’ market. Costs are largely borne by the rest of the world in
that case, while the government benefits from the high tax income.
4.6 On the Dynamic Effects of Export Restrictions
In the previous discussion, we always compared equilibria without taking into
account how the dynamics are working in the markets. This might be accepta‐
ble if capacities and stocks are large enough to adapt to the introduction of
export restrictions easily. If capacities are utilised close to full capacity and
stocks are small, the dynamics become important. This is the case in particular
Economic Effects of Export Restrictions
49
for resources and steel markets, where notable investment is needed to adjust
capacities and the adjustment can take years.
Export restrictions can contribute to price spikes on world markets in periods
when capacities are highly utilised. They decrease supply on the world market
leaving it more vulnerable to shocks. Martin and Anderson (2011) have ana‐
lysed this effect for the food price surge between 2005 and 2008 for rice and
wheat. They find that more than 45% of the international price increases were
induced by trade restrictions for rice and about 29% for wheat.
Investment decisions themselves are also distorted. If capacities are built up
according to the incentives generated by trade restrictions, their profitability
will be reduced if the restrictions are dropped again. Stranded investments
can occur. This is particularly problematic because parts of these investments
are sunk and cannot be transferred to other activities.
Additional problems are implied if investment decisions are made under
somewhat myopic expectations. Let us assume that the steel sector outside of
the home country faces increased prices due to an export tariff on one of its
inputs. Now every firm faces the decision to either pay a higher price for this
intermediate good or to invest in a technology reducing the need for that in‐
put. If firms do not take into account that other steelmakers face the same
decision, the overall investment in the technology to replace the input will be
too high. Prices are driven down to a level that is too low for many invest‐
ments to be profitable ex post. The same can happen on the supply side. The
same can happen to on the supply side. If raw material prices are driven up by
trade restrictions, incentives for new mining investments grow. This can lead
to a “gold rush” and overinvestment.
Strategic Trade Policy and Critical Raw Materials in Stainless Steel Production
50
5 Why Do Countries Restrict Exports?
Chapter 4 outlined effects of export restrictions on raw materials using the
tools of graphic analysis. Export restrictions lower domestic price levels for the
resource and, if the country has market power, raise the world market price.
Domestically, the lower prices benefit those sectors that consume the raw
material while the suppliers suffer. The result of the export restriction is a dis‐
tortion in the resource market, with levels of consumption that are too high
and levels of supply that are too low. Internationally, export restrictions on
raw materials change the so‐called ‘terms‐of‐trade’: International prices for
exports of the raw material rise. The country thus receives higher prices for its
exports and can buy more foreign goods in return.
Why do countries introduce export restrictions they result in distortions? The
above summary of the main effects of such restrictions points to many of the
current explanations in the literature for their use. This chapter will make
these explanations more explicit. We will find, for example, that if welfare
gains from the terms‐of‐trade effect are larger than the welfare losses from
distorted markets, export restrictions are beneficial for a country. Such an
outcome is more likely, for instance, if supply for the raw material operates
close to capacity constraints and if demand does not react elastically on price
changes. This and additional arguments are compiled and applied to the mar‐
kets of nickel, chrome, molybdenum, and stainless steel scrap. Jointly, the
arguments enable us to characterise three groups of countries regarding their
propensity to employ export restrictions.
The summary of arguments first fixes a reference point in the form of the free
trade benchmark. We then show how export restrictions can sometimes be
justified even at the global level as second‐best instruments in the presence of
externalities. Moving on to the national level, we present the reasons why
governments might find it in their narrow national interest to pursue export
restrictions. Finally, export restrictions might not be motivated so much by
national interest, but by special interest group politics. These political econo‐
my factors give rise to the final set of arguments that explain the presence and
shape of export restrictions.
Why Do Countries Restrict Exports?
51
5.1 Free Trade Benchmark
An analysis of the merits, or not, of trade restrictions naturally starts from the
benchmark of free trade. The reason is a central result in trade theory that
under a set of fairly general conditions, global society would choose a system
of free trade as the organising principle of the international exchange of goods
and services. Under free trade, each country specialises in producing those
goods for which it has a comparative advantage. By specialising in a limited
number of goods sold on large markets, economies of scale can be realised.
Free trade also ensures competition on a worldwide scale, thereby encourag‐
ing efficient use of resources and innovation. The existence and general ac‐
ceptance of this benchmark is what underpins the global efforts towards a
universal regime of free trade.
What this chapter will show in detail is that the difficult historical path to‐
wards a universal regime of free trade highlights the two main obstacles
standing in the way of a global free trade regime. One obstacle is that there
are instances where deviations from free trade are advantageous even from a
global perspective. One such instance is the presence of externalities that can
stem, for example, from learning effects in developing countries or from envi‐
ronmental damages connected with the extraction and processing of raw ma‐
terials. If better instruments to cope with these problems are unavailable,
export restrictions can sometimes be justified as a so‐called ‘second‐best’ in‐
strument. Another instance is a situation where governments are not able, for
example due to weak institutions, to generate the fiscal revenues for neces‐
sary public services with less distorting sources of revenues. In such cases, the
conditions under which free trade is globally optimal are violated, and export
restrictions can conceivably improve on the outcome. At the same time, they
can also do more damage. A case‐by‐case analysis is required.
The second, and politically more salient, obstacle to universal free trade is its
prisoners’ dilemma nature: While globally advantageous, countries as a whole
or politically powerful groups within countries can find that they individually
prefer to restrict trade, particularly when most other countries are trading
freely. This pursuit of narrow national policy interests can generate its own
negative externalities: A country can increase its citizens’ welfare at the ex‐
penses of others’. The terms‐of‐trade effect found in chapter 4 is a first exam‐
Strategic Trade Policy and Critical Raw Materials in Stainless Steel Production
52
ple for a type of policies commonly referred to in the trade literature as ‘beg‐
gar‐thy‐neighbour’.
The likelihood of retaliatory measures by other countries is a main reason why
‘beggar‐thy‐neighbour’ has become less popular among governments that
take a broad national interest. Its pursuit is typically not in their interest if
gains in one sector have to be accomplished at the expense of losses in many
others. For reasons of political economy, however, governments often weigh
gains and losses differently in different sectors. For example, a government
that does not only consider national welfare, but also benefits from support by
special interest groups, can find trade restrictions an attractive tool for fur‐
thering the interests of powerful industries or groups of people at the expense
of others. These interest group effects create another form of externalities,
with the negative effects arising either in other sectors of their own country or
abroad.
5.2 Export Restrictions as Second Best Instruments
5.2.1 Government Revenues
Some export barriers yield government revenues. This is the case for export
taxes and tariffs, but also for export quotas, if they are sold or auctioned to
exporting firms.
Income from export taxes are a small to negligible source of revenues for most
governments. A notable exception is Russia. Between 2006 and 2010, export
tax revenues comprised a share of more than 20% of federal government rev‐
enues (International Trade Centre, 2012).
Export duties can be a convenient way to generate government revenues,
particularly in developing countries. If these nations lack infrastructure and
institutions necessary to collect income or consumption‐based taxes, they
need some other source of income. If the country exports goods which have to
be shipped abroad or transported by trains, exports can be monitored well
and transaction costs of collecting taxes are comparatively low.5
5 Piermartini et al. (2004) points out that monitoring export taxes is not without pitfalls either.
Why Do Countries Restrict Exports?
53
A major drawback of relying on export tax revenue for budgetary purposes is
their volatility. If raw materials’ prices are high, the government will see large
tax revenues. When they are low, tax income collapses. This is usually the case
when the world economy is on a downturn. Export tariffs tend to amplify
business cycles. This can be prevented by setting up buffer funds, but these
funds didn’t prove to be working well in the past for many nations
(Piermartini, 2004).
5.2.2 State of Development
Export restrictions act as an indirect subsidy for downstream sectors using the
good whose exports are hindered as an intermediate input. The subsidies
might be directed towards stainless steel production, but can also aim at more
upstream firms. The proposed South African export restrictions on chromium
ore is explicitly meant to protect domestic ferrochrome production
(Seccombe, 2012) which, in turn, is an input to stainless steel production.
The most widely cited reason justifying these subsidies is the infant industry
argument. The basic idea is that developing countries are specialised in indus‐
tries lacking value added or dynamic development. They cannot extend their
production to sectors exhibiting higher value added or dynamics because they
lack experiences in producing the respective goods. Thus, they are stuck in an
industry structure preventing higher growth rates (see Melitz (2005) for trade
restrictions as a measure to protect infant industries).
Firms could overcome this handicap in a learning‐by‐doing manner. The more
they produce, the more they learn, and the less are their costs. If learning oc‐
curs not only within firms, but also spills over to other firms in the industry, an
externality arises. Firms do not fully internalise the knowledge they generate
and produce at suboptimal levels. The country is stuck in a situation where the
industry does not start producing because of high initial costs and the exter‐
nality.
This theory gives a normative argument for intervention. The first best instru‐
ment is a subsidy on production which internalises the learning externality.
Subsidising an input of this industry using export restriction is only a second
best instrument. It does not only subsidise production but also biases the rela‐
Strategic Trade Policy and Critical Raw Materials in Stainless Steel Production
54
tive prices of inputs towards the raw material. This leads to an increased use
of the resource, which is not intended.
There are reasons why direct subsidies on production are unavailable. Devel‐
oping countries might, for instance, face liquidity constraints preventing the
implementation of direct subsidies on production. Tariffs on imports of the
respective goods might be restricted by trade agreements.
It should be noted, however, that the infant industry argument is not without
controversy. It always involves the danger of generating dependency on subsi‐
dies instead of internationally competitive industries. It is also doubtable
whether the government is able to quantify the learning externality correctly
or to know in advance which industries will be exhibiting large value added or
dynamics in the future.
The infant industry argument appears valid mostly for developing countries. It
does not seem evident for nations which are already industrialising and pro‐
ducing stainless steel, such as South Africa, India, or China. A reason explaining
export restrictions by these countries can be derived from economies of ag‐
glomeration (Amiti, 2005).
The basic idea of this argument is as follows. If firms decide where to produce,
they face two incentives which might be opposing. The first one is to set up
their production in a country where they encounter low prices for their factors
of production. This force drags labour‐intensive sectors into countries with low
wages and resource‐intensive sectors into resource rich nations. The second
force stems from costs of trade. The closer a company locates its production
to its consumers or to the suppliers of its intermediates, the less trade costs it
incurs. That force makes firms and sectors agglomerate. The economics of
agglomeration exhibit an externality. Firms do not account for the productivity
spillovers they provide to other firms and do not include them in location deci‐
sions. It might be the case that the force of agglomeration dragging produc‐
tion together dominates the incentive to specialise according to factor costs.
This depends on a variety of determinates, in particular on trade costs.
Subsidising stainless steel production can be interpreted as an attempt to
overcome path dependencies in agglomeration structures. The government in
a country perceives the agglomerative structure of the industry as a result of
comparative advantages in the past. If it also perceives that these structures
Why Do Countries Restrict Exports?
55
are preserved merely by agglomerative advantages, while the industry has
comparative advantages in its own country today, export restrictions can be
an instrument to break up these structures and make firms relocate.
This reasoning is, however, subject to similar critique as the infant industry
argument. Does a country really know that it possesses a comparative ad‐
vantage in a sector? And do the implicit subsidies create industries dependent
on protection? Do the gains from attracting a sector overcompensate the
costs of subsidising it?
5.2.3 Environmental Problems
Mining and processing metals causes a wide range of environmental damages,
from water and air pollution, land use and destruction of ecosystems, to
greenhouse gas emissions (Dudka & Adriano, 1997). Environmental protection
is sometimes cited explicitly to justify export barriers, for example in China and
South Africa (Fliess & Mård, 2012). The severity of damages crucially depends
on the regulations mining companies face and on the government’s ability to
enforce these regulations.
Externalities from environmental damages of mining do justify government
intervention. So do the greenhouse gases emitted when transporting raw ma‐
terials. In the former case, regulations on the mining sector appear as the first
best policy instrument. In the latter one, a carbon tax or an emission trading
system would be a preferable instrument.
Export restrictions are a second‐best instrument again. They decrease the
supply of raw materials domestically (and plausibly also worldwide, at least in
the short run) and they reduce trade. The environmental effects are, however,
caused by the extraction or by the transport, not by trade itself. Applying in‐
struments targeting the sources of environmental damages directly is the first‐
best instrument and would be less distorting.
There might be situations where regulating mining activities is not efficient or
not possible. This can be the case if the costs of monitoring regulations at the
mine site are prohibitively high. Or if local policy makers and regulatory bodies
have an incentive to disregard the regulation because they benefit from the
mining activities. If exports can be monitored well, restrictions on them can
serve as a second‐best instrument. This is (or was) potentially the case for rare
Strategic Trade Policy and Critical Raw Materials in Stainless Steel Production
56
earths’ mining in China, for example (Tse, 2011). The welfare gains must, how‐
ever, still be greater than the welfare losses from distorting national and in‐
ternational markets.
The environmental argument does not apply well to steel scrap. Using scrap
metal rather than virgin metals decreases the energy intensity and avoids en‐
vironmental damages associated with mining.6
A trade‐off arises if both the environmental and the development argument
apply. While the production of the raw material is decreased by export re‐
strictions in the short run, downstream industry is sheltered from foreign
competition and grows over time. In this case, domestic demand for the raw
material will grow as well and might eventually be bigger than without the
export restriction.
5.2.4 Conservation of Exhaustible Resources
Another reason often cited for export restrictions is the conservation of ex‐
haustible natural resources. It has a different character than environmental
protection. The environmental argument is about the externalities from ex‐
tracting raw materials. The conservation of resources argument is about when
to extract them.
It is reasonable to assume that a firm owning a metal deposit will take into
account that its deposit has a limited size and can only be extracted once. The
interest rate the company faces is of major importance for how quick the ex‐
traction takes place. The higher the interest rate, the more important are to‐
day’s revenues for a company and the faster it will extract its resources. If the
government faces a lower social discount rate and wants to slow down pro‐
duction, it can use export restrictions as an instrument to achieve this goal.
6 Damages for human health and the environment due to recycling activities are probably most relevant for e‐wastes. Discarded electric and electronic appliances are recycled in developing countries using improper processes such as burning plastic parts to gain access to valuable metals. This problem is much less important in case of stainless steel, where the metal is easily accessible and not contaminated with hazardous substances in many applications.
Why Do Countries Restrict Exports?
57
Additional problems arise when the property rights for the deposit are not
defined clearly. This happens if a company is confronted with the risk of being
expropriated or in case of illegal mining. Firms have an incentive to extract the
resource suboptimally fast.
Export restrictions work, again, as a second‐best instrument. The government
wants to decrease today’s extraction and should therefore regulate extraction
accordingly. Additionally, it is not evident that profits generated from extrac‐
tion today are less favourable for future generations than leaving the resource
in the ground for them. It is crucial what happens to these profits.
5.3 Problems Arising in National Policy Making
5.3.1 Incentives for Beggar‐thy‐Neighbour Policies
The justifications for export restrictions listed so far were based on technical
externalities. Some economic subjects do not bear the full social costs or enjoy
the full benefits of their behaviour. Therefore, they do not behave in an opti‐
mal manner. The beggar‐thy‐neighbour policies have a different background.
They arise if national policy makers focus on the welfare of their own citizens
and have instruments whose costs they can impose on other countries.
A first type of beggar‐thy‐neighbour policy could already be observed in chap‐
ter 4 in the discussion about export restrictions’ effects. Governments can use
export barriers in order to increase world market prices and thereby their
terms‐of‐trade. The implied costs are partly shifted to other countries. This is
what Latina et al. (2011) call the terms‐of‐trade externality.
A similar effect concerns locational decisions of manufacturing industries. A
government can use trade policy to incentivise the growth of downstream
industries. This can take different forms, including introducing import tariffs
for manufacturing products or subsidies by export restrictions on their inputs.
In both cases, profits of domestic firms are increased and profits of the foreign
ones are reduced, implying firms entering at home and leaving the market
abroad. In terms of Latina et al. (2011), a production relocation externality
arises.
Further incentives for beggar‐thy‐neighbour policies arise if the mining sector
is under foreign ownership. The exhaustibility of natural resources induces
Strategic Trade Policy and Critical Raw Materials in Stainless Steel Production
58
rents. If the mining firms foreign, these rents might be transferred abroad. In
this case export restrictions shift parts of the rents to the government budget
and to the domestic steel sector. The transfer of wealth is thereby prevented.
5.3.2 (Unilateral) Caveats
Even without taking potential countermeasures by other countries into ac‐
count, beggar‐thy‐neighbour type of policies exhibit both theoretical and em‐
pirical problems. Take the terms‐of‐trade externality as an example.
Increasing domestic terms‐of‐trade using export restrictions works the follow‐
ing way. There are a large number of small firms in an industry. None of these
firms holds market power. The industry as a whole, however, has some margin
to influence world market prices. If the country introduces export taxes, it
substitutes for the lack of market power by its domestic firms. The optimal
tariff in that case eventually mimics the behaviour of one supplier with market
power (Helpman & Krugman, 1989). The rule of thumb is that the tax should
be set as the inverse of the absolute price elasticity of demand.
Assuming for an atomistic industry structure appears not very realistic in min‐
ing or steel sectors. Firms are often large enough to enjoy market power and
market power changes the rationale of optimum tariffs. Companies internalise
some degree of the industry’s market power. Therefore, the more concentrat‐
ed an industry is, the smaller is the optimal tariff (Helpman & Krugman, 1989).
Rodrik (1989) reviews this result taking into account asymmetric firm size. He
shows that tariffs should actually differ by size of the exporting firm. Since
larger firms have more market power, their exports should be taxed at a lower
rate than those of smaller firms. The consideration gets even more complicat‐
ed when taking into account other aspects like endogenous firm (De Santis,
2000) or sellers’ market power (Oladi & Gilbert, 2012). Picking the optimal
tariff is obviously a challenge from the theoretical perspective.
Empirical problems add up to the theoretical ones. Firstly, governments need
to understand the structure of both resources and steel sectors well enough to
choose the right model. Then there is the problem of estimating the demand
elasticity correctly. For example, Warr (2001) lists estimates for the demand
for rice exports from Thailand in a range from ‐4 to ‐1.07. If perfect competi‐
Why Do Countries Restrict Exports?
59
tion is assumed for both on the supply and demand side, the implied optimal
tariffs ranges between 25% and 93.5%.
5.3.3 Prisoners’ Dilemmas and Multilateral Agreements
Countries face the possibility to increase their citizens’ welfare on others’ ex‐
penses by manipulating terms‐of‐trade or by relocating industries using trade
restrictions. These incentives exist for all countries, turning it into a strategic
problem. If all countries introduce trade barriers, the restrictions will offset
each other. Then, nobody is able to gain relative to other nations, but overall
trade is at inefficiently low levels. This is a typical prisoners’ dilemma situation.
The General Agreement on Tariffs and Trade (GATT) and later the World Trade
Organization (WTO) were created to overcome the strategic problem of these
beggar‐thy‐neighbour policies. There are two main characteristics making
them so successful (Bagwell & Staiger, 1999; Ossa, 2011). The principle of rec‐
iprocity and the most favoured nation principle.
Reciprocity means that reductions in trade restrictions are designed to leave
relative trade flows unchanged when renegotiating trade barriers. This avoids
possibilities for countries to exploit each other in trade negotiations. The most
favoured nation principle codifies non‐discrimination between trade partners.
It means that the lowest tariff a country has with one trade partner needs to
be applied to all other trade partners as well. This avoids distortions imposed
on third‐party countries.
The mechanisms of GATT and WTO have worked well in the case of import
tariffs. But as seen before, export restrictions are only dealt with insufficiently.
The current framework leaves ambiguities about the rules. Countries can feel
free to explore the loopholes. It appears that there is a margin allowing coun‐
tries with market power in resources markets to implement beggar‐thy‐
neighbour policies.
Strategic Trade Policy and Critical Raw Materials in Stainless Steel Production
60
5.4 Political Economy of Export Restrictions
5.4.1 Idea of and Conditions for Successful Lobbying
The beggar‐thy‐neighbour type of policies is not only possible between, but
also within countries. Groups of people or industries can use partisan policy
and lobbying to increase their welfare on the expenses of others.
Policy makers do not only benefit from maximising the welfare of their people,
but they can also gain from specifically turn towards particular groups which
return the favour by what Grossman and Helpman (1994) term “contribu‐
tions”. Which form these contributions take is of minor importance for the
discussion. One can imagine everything from support of electoral campaigns
to bribery. The objective of a policy maker can then be interpreted as the
weighted sum of the overall welfare and these contributions.
There are some characteristics of countries and industries making it more
probable to find successful lobbying activities. One of those is industry concen‐
tration. It is more likely to see lobbying in industries which are concentrated.
In a sector with many small firms, a firm investing into influencing policy in
favour of its sector will only benefit to a negligible degree from its efforts. The
other firms can free‐ride. The more concentrated an industry is, the more each
firm internalises the benefits of its lobbying activities. That increases incen‐
tives for lobbying.
Large industries should see more protection than small ones. They represent a
larger share of the population and thereby voters and should find it more easy
to lobby for measures in their favour.
When the government weighs the welfare of its citizens and contributions by
lobbying groups, the weightings become important for how much incentive
exists for lobbying. One can argue that democratic governments, for which the
welfare of their population is more directly important than for dictatorships,
will put higher weight on the overall welfare. This is empirically confirmed by
Mitra et al. (2002) in the case of Turkey.
A last aspect is competition between lobbying groups. Grossman and Helpman
(1994) show that, in the extreme case in which every industry is represented
by a lobbying group, these activities offset each other leading to free trade.
Why Do Countries Restrict Exports?
61
Mining and stainless steel production are both capital‐intensive sectors. Re‐
strictions on nickel, chrome, molybdenum, or scrap exports benefit stainless
steel producers. They have an incentive to lobby in favour of such measures.
Mining companies will plausibly have lobbying power themselves, counteract‐
ing steelmakers. Scrap sectors, however, do often consist of a large number of
small firm and exhibit less possibilities to lobby in their favour. Export barriers
on scrap metals should therefore be encountered more often than on virgin
metals.
5.4.2 Choice of Instruments
Export restrictions are, in many cases, only a second‐best instrument. Also for
a lobby group, a direct subsidy appears to be the preferable way to appropri‐
ate wealth at first glance. Nonetheless, export restrictions could be preferable
instruments for lobby groups. Firstly, transfers through export restrictions are
rather intransparent and leave room for rent sharing between government
officials and lobby groups. Secondly, export restrictions can be justified using
patriotic arguments. “Our country suffers from the environmental damages of
extraction, therefore we should consume the metals ourselves” or “We should
not sell our national wealth in resources” can be communicated to the public
more easily than a direct subsidy.
Not only the existence or the tightness of export restrictions might be subject
to lobbying activities, but also the choice of instruments. As seen before, bind‐
ing quantitative export restrictions create rents. These rents do not necessarily
accrue to the government. Particularly in countries with weak institutions, it is
plausible that these rents form another channel to transfer welfare towards
specific groups. We therefore hypothesise that countries with weak institu‐
tions are more likely to introduce quantitative export restrictions than taxes
and particularly more intransparent mechanisms to allocate these quotas.
5.5 Intermediate Conclusions
5.5.1 Three Country Prototypes
In this section, we outlined arguments speaking in favour of export re‐
strictions. These reasons can be grouped into three types of arguments. The
first type is externalities that even a benevolent worldwide planner would
Strategic Trade Policy and Critical Raw Materials in Stainless Steel Production
62
have to deal with. Countries need some source of government revenue, they
might be stuck in a low development level because of learning externalities or
they suffer from environmental consequences of mining. It becomes clear that
export restrictions are, in all cases, second‐best instruments which should only
be chosen if better policy measures are unavailable. This is plausibly only the
case in countries with weak institutions.
A second group of arguments stems from national policy making. Govern‐
ments might be able to use instruments which increase their people’s welfare
while imposing parts of their instruments’ costs on other countries. The rules
of the WTO, which limit the possibilities for import restrictions, do not work as
well for export tariffs and quotas. Arguments for strategic trade policy apply
mostly to countries exhibiting market power. Determining an optimal tariff
level is both theoretically and empirically challenging, however.
A third group of reasons explaining export restrictions is lobbying activities. It
might be the case that export barriers are perceived as the line of least re‐
sistance for groups seeking transfers favouring themselves. Successful lobby‐
ing is most probable where a large and concentrated steel sector encounters
an unconcentrated resources or scrap collection sector and weak institutions.
This discussion shows that incentives for countries to restrict exports of inputs
into stainless steel production depend on several factors. They include the
industrial structure of the steel industry, the institutional quality of a country,
or the state of development. We condense this reasoning into three country
prototypes which represent groups of nations sharing similar characteristics.
These prototypes are useful when interpreting the empirical results in the
following chapters.
5.5.2 The Developed Country
The ‘developed country’ is, as the name suggests, a nation exhibiting high lev‐
els of GDP per capita. Most nations in this group do not exhibit market power
in virgin metal markets. Many developed countries possess large stocks of
scrap metal potentially giving them some market power on scrap markets. The
developed country’s economy is highly diversified. That reduces its dependen‐
cy on basic industrial sectors and on tariffs as a source of revenues. Institu‐
tions are strong in the developed country. The government is able to counter‐
Why Do Countries Restrict Exports?
63
act environmental damages due to mining and resources use well. Good insti‐
tutional quality also limits the possibilities for special interest policies. We ex‐
pect the developed countries to typically abstain from using export restrictions
in order to continue reaping the benefits of free trade.
5.5.3 The Resource‐rich, Industrialising Country
The ‘resource‐rich, industrialising country’ exhibits a medium level of income
and GDP per capita. It does have power in one or more raw material markets,
but less in scrap markets. It has limited comparative advantage in downstream
industries and services sectors, but export restrictions on primary goods are
perceived as an instrument to generate those. The resource‐rich, industrialis‐
ing country does not need export taxes as a major source of government rev‐
enue. Environmental regulation exists, but is less strict and less strongly en‐
forced than in developed countries. The combination of market power and
agglomeration problems yields strong incentives for beggar‐thy‐neighbour
policies. Resource‐rich industrialising countries are expected to have an ele‐
vated propensity to exploit their market power, both in order to increase
world market price of their exports and to support growth in downstream
sectors.
5.5.4 The Developing Country
Per capita income and GDP are low in the developing country. It does hold
market power neither in resource markets nor in scrap markets. Export tax
revenue contributes a non‐negligible part to the government budget. Both
environmental and learning‐by‐doing externalities are present, while good
instruments to internalise them are unavailable. The lack of market power
limits incentives for restricting exports. Developing countries might still use
export barriers. In these cases, they are caused by a combination of weak in‐
stitutions and successful special interest policies at the domestic level.
Strategic Trade Policy and Critical Raw Materials in Stainless Steel Production
64
6 Export Restrictions on Inputs in Stainless Steel
Production
This chapter investigates export restrictions for the most important raw mate‐
rials used in stainless steel production empirically: nickel (Ni), chromium (Cr),
molybdenum (Mo), and stainless steel scrap. These four inputs together ac‐
count for a share of 98.2% of the monetary value of raw materials used in
stainless steel production (Posch, 2011).
Our basic source of data is the OECD’s inventory of restrictions on exports of
raw materials (Fliess & Mård, 2012). The data is updated to include infor‐
mation for 2011 to 2013. Further export barriers are added to the data. It
should be noted that we do not claim to present a complete dataset of export
restrictions for 2007 to 2012. A large number of export restrictions are not
readily available. To our knowledge, this database is still the most comprehen‐
sive overview over export restrictions applied on the four most important raw
materials used in stainless steel production.
6.1 Nickel
6.1.1 Current Export Restrictions
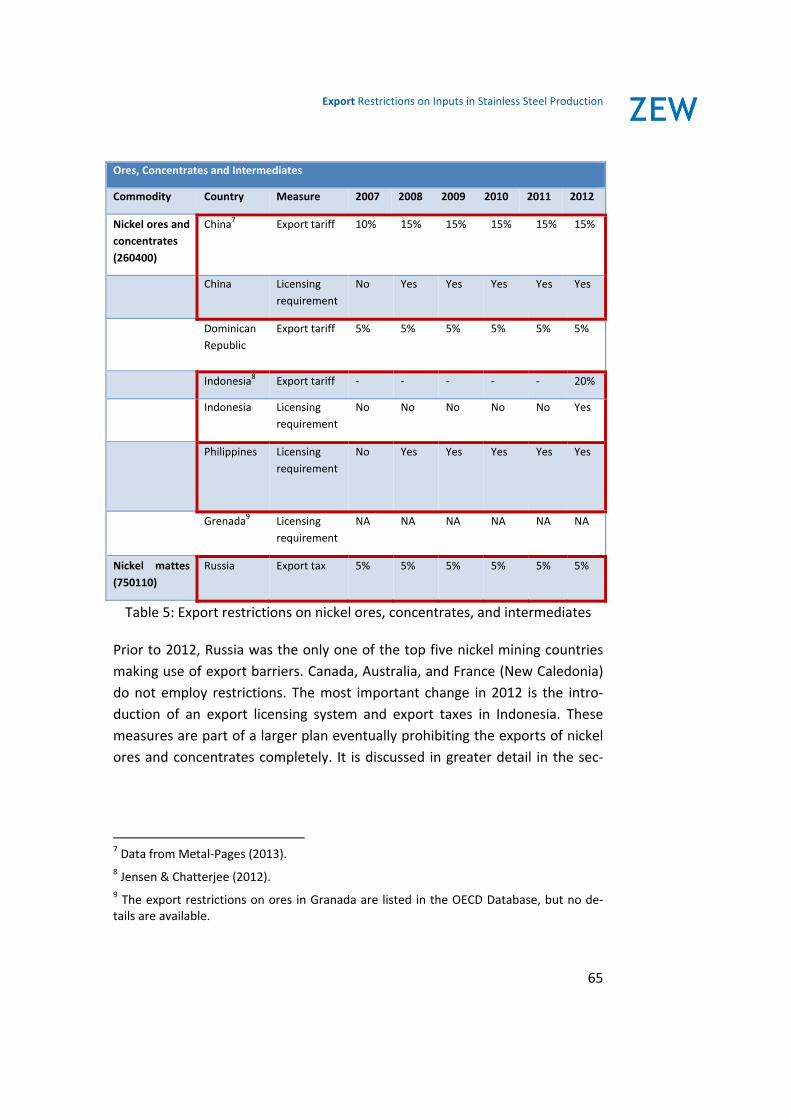
Table 5 displays export restrictions on nickel ores, concentrates, and interme‐
diates from 2007 to 2012. The first column lists the specific good and its corre‐
sponding Harmonized System (HS) code. The second column shows the coun‐
try applying the measure, the third one which type of measure is used. Export
barriers imposed by countries which are among the top five producers are
highlighted with a red frame. The other tables displaying export restrictions
have the same formats.
Export Restrictions on Inputs in Stainless Steel Production
65
Ores, Concentrates and Intermediates
Commodity Country Measure 2007 2008 2009 2010 2011 2012
Nickel ores and
concentrates
(260400)
China7 Export tariff 10% 15% 15% 15% 15% 15%
China Licensing
requirement
No Yes Yes Yes Yes Yes
Dominican
Republic
Export tariff
5% 5% 5% 5% 5% 5%
Indonesia8 Export tariff ‐ ‐ ‐ ‐ ‐ 20%
Indonesia Licensing
requirement
No No No No No Yes
Philippines Licensing
requirement
No Yes Yes Yes Yes Yes
Grenada9 Licensing
requirement
NA NA NA NA NA NA
Nickel mattes
(750110)
Russia Export tax 5% 5% 5% 5% 5% 5%
Table 5: Export restrictions on nickel ores, concentrates, and intermediates
Prior to 2012, Russia was the only one of the top five nickel mining countries
making use of export barriers. Canada, Australia, and France (New Caledonia)
do not employ restrictions. The most important change in 2012 is the intro‐
duction of an export licensing system and export taxes in Indonesia. These
measures are part of a larger plan eventually prohibiting the exports of nickel
ores and concentrates completely. It is discussed in greater detail in the sec‐
7 Data from Metal‐Pages (2013). 8 Jensen & Chatterjee (2012). 9 The export restrictions on ores in Granada are listed in the OECD Database, but no de‐tails are available.
Strategic Trade Policy and Critical Raw Materials in Stainless Steel Production
66
tion on future developments. China also restricts its exports of nickel ores, but
its production is comparatively small.
Class I Nickel
Commodity Country Measure 2007 2008 2009 2010 2011 2012
Nickel, not
alloyed
(750210)
China Licensing
require‐
ment
Yes Yes Yes Yes Yes Yes
Russia Export tax 5% 5% ‐ 5% 10% 2.117,8
/
1245.5
/
1447.6
USD/t
Nickel powders
and flakes
(750400)
Viet Nam Export tax 5% 5% 5% 5% 5% 5%
Table 6: Export restrictions on Class I Nickel
Class II Nickel
Commodity Country Measure 2007 2008 2009 2010 2011 2012
Ferronickel
(720260)
China Export tax 10% 20% 20% 20% 20% 20%
China Licensing
requirement
No No No Yes No No
Argentina Export tax 5% 5% 5% 5% 5% 5%
Nickel oxide
sinters and
other …
(750120)
China Licensing
requirement
Yes Yes Yes Yes Yes Yes
Russia Export tax 5% 5% 5% 5% 5% 5%
Table 7: Export restrictions on Class II Nickel
Table 6 and Table 7 display export restrictions on class I and class II primary
nickel. Argentina does apply taxes on the exports of a large set of raw materi‐
Export Restrictions on Inputs in Stainless Steel Production
67
als and will therefore appear in the tables for other metals as well. It does,
however, not play a major role in any of the markets analysed in this study.
While China does not produce a large amount of nickel ores, it is important in
producing ferronickel (and NPI) and plausibly exhibits market power in the
market for this input in stainless steel production. China introduces the meas‐
ure at the level where it starts possessing market power.
Russia does not tax exports of ores and concentrates except for mattes, but
class I and class II nickel products. While most export tariffs remained constant
over time, the taxes on non‐alloyed nickel were changed several times be‐
tween 2007 and 2012 (see Table 8). The export tax started at a rate of 5% in
2007, but was abolished in January 2009, allegedly to curb losses of the Rus‐
sian nickel industry, in particular Norilsk Nickel (Burns, 2009). An export tax of
5% was reintroduced in December that year and raised to 10% one year later.
In April 2011, a new system of taxing nickel exports was introduced
(Government of the Russian Federation, 2011a). Export duties are levied per
ton. The tax rate is bound to the LME price and revised regularly. Under this
new system, taxes were changed in December 2011, March 2012, and June
2012. Currently Norilsk again seeks a tax exemption, which the company justi‐
fies by weak metal markets. It is, according to media reports, unlikely that the
Russian Government will follow their arguments (Devitt & Prentice, 2013).
Strategic Trade Policy and Critical Raw Materials in Stainless Steel Production
68
In force since Tax rate Source
January 2007 5% Government of the Russian Federation (2006)
January 2009 0% Government of the Russian Federation (2009a)
December 2009 5% Government of the Russian Federation (2009b)
December 2010 10% Government of the Russian Federation (2010)
December 2011 2.117,8 USD/t
(≈ 12%)10
Government of the Russian Federation (2011b)
March 2012 1245.5 USD/t
(≈ 7%)11
Government of the Russian Federation (2012a)
June 2012 1447.6 USD/t
(≈ 9%)12
Government of the Russian Federation (2012b)
Table 8: Russian export taxes on non‐alloyed nickel from 2007 to 2012
6.1.2 Outlook
The most important events concern Indonesia. On May 6th 2012, the world’s
biggest producer of nickel ores introduced a new regulation which excludes all
mining firms from exporting their ores unless they submit plans to construct
smelting and processing facilities. Additionally, a 20% export tax is levied on
ore exports. 14 minerals, including nickel ores, are part of that regulation. The
export of minerals is announced to be banned completely in 2014 (Jensen &
Chatterjee, 2012). The prohibition may be delayed to 2015 or 2016, depending
on the progress in construction of smelters. The lower bound of purity is cited
to be a 70% nickel matte (International Nickel Study Group, 2012). The regula‐
tion was motivated by the aim to move up the value chain and not only export
ores and intermediate products, but also pure metals. It will particularly affect
the Chinese NPI Production, which relies heavily on Indonesian ore imports.
Also Japan, which imports large shares of its Nickel ores from Indonesia, will
be directly affected by the export barriers.
10 Compared to the LME price in December 2011 11 Compared to the LME price in March 2012 12 Compared to the LME price in June 2012
Export Restrictions on Inputs in Stainless Steel Production
69
6.2 Chromium
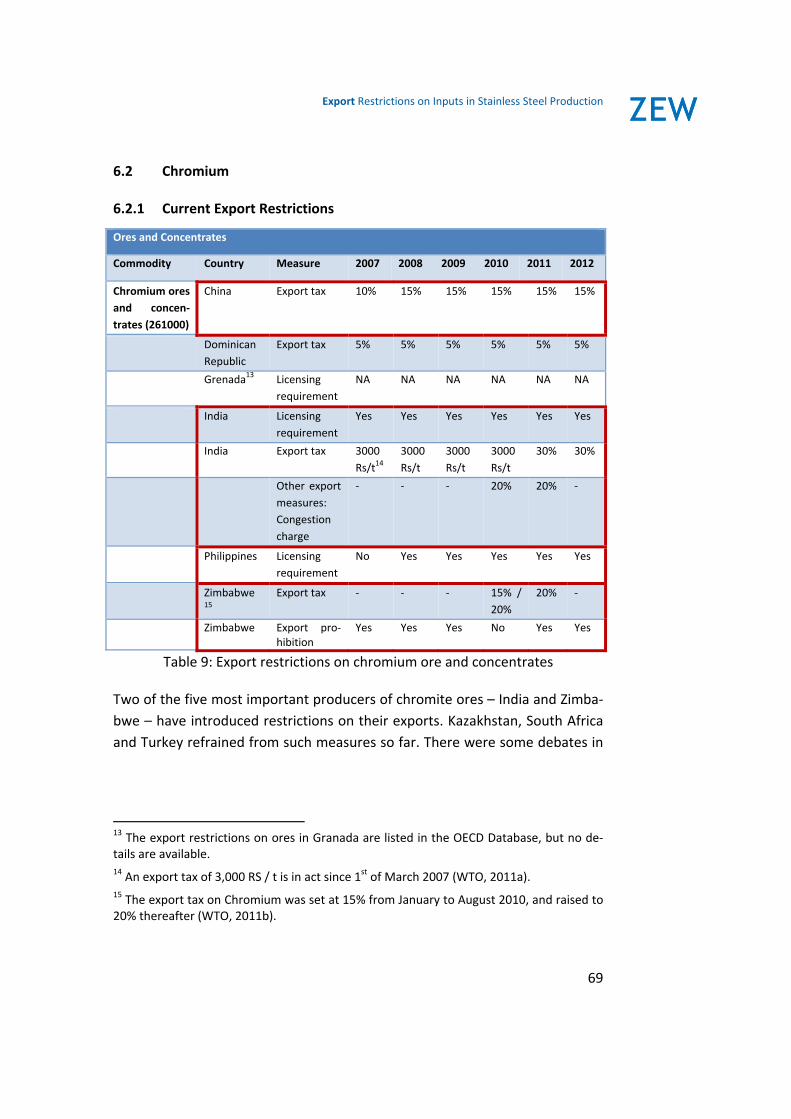
6.2.1 Current Export Restrictions
Ores and Concentrates
Commodity Country Measure 2007 2008 2009 2010 2011 2012
Chromium ores
and concen‐
trates (261000)
China Export tax 10% 15% 15% 15% 15% 15%
Dominican
Republic
Export tax 5% 5% 5% 5% 5% 5%
Grenada13 Licensing
requirement
NA NA NA NA NA NA
India Licensing
requirement
Yes Yes Yes Yes Yes Yes
India Export tax 3000
Rs/t14
3000
Rs/t
3000
Rs/t
3000
Rs/t
30% 30%
Other export
measures:
Congestion
charge
‐ ‐ ‐ 20% 20% ‐
Philippines Licensing
requirement
No Yes Yes Yes Yes Yes
Zimbabwe 15
Export tax ‐ ‐ ‐ 15% /
20%
20% ‐
Zimbabwe Export pro‐hibition
Yes Yes Yes No Yes Yes
Table 9: Export restrictions on chromium ore and concentrates
Two of the five most important producers of chromite ores – India and Zimba‐
bwe – have introduced restrictions on their exports. Kazakhstan, South Africa
and Turkey refrained from such measures so far. There were some debates in
13 The export restrictions on ores in Granada are listed in the OECD Database, but no de‐tails are available. 14 An export tax of 3,000 RS / t is in act since 1st of March 2007 (WTO, 2011a). 15 The export tax on Chromium was set at 15% from January to August 2010, and raised to 20% thereafter (WTO, 2011b).
Strategic Trade Policy and Critical Raw Materials in Stainless Steel Production
70
Kazakhstan about extending the export taxes on oil onto minerals in the past
(Foster, 2010).
India implemented export taxes on chromium ores and concentrates in 2007
at a level of Rs 2,000 per ton (Korinek & Kim, 2010) and raised them to a level
of Rs 3,000 per ton in March 2007 (WTO, 2011a). In 2011, the taxation was
changed to an ad valorem tariff of 30% (Central Board of Excise and Customs,
2011). The effects of the export tariffs can be seen in the decline of chromite
exports to China described above, but starting already in 2007. Korinek and
Kim (2010) report that the introduction of export restrictions resulted in a shift
from foreign to domestic demand, rather than in a decline of Indian chromium
production.
Zimbabwe also restricts exports of chromium ores. While there was a ban on
exports of unprocessed ores in place since 1996, it did not seem to have a ma‐
jor effect. In 2010, an export tax of 15% was introduced and in the same year
raised to 20%. In April 2011, exports were prohibited again (WTO, 2011b). This
ban is rumoured to be abolished in 2013 (Zinyuke, 2013).
Ferrochrome
Commodity Country Measure 2007 2008 2009 2010 2011 2012
Ferrochromi‐
um (720241,
720249,
720250)
Argentina Export tax 5% 5% 5% 5% 5% 5%
China16 Export tax 10% 20% 20% 20% 20% 20%
China Licensing
requirement
Yes Yes Yes Yes Yes Yes
Table 10: Export restrictions on ferrochrome
16 Data for current tax rates from (Metal‐Pages, 2013).
Export Restrictions on Inputs in Stainless Steel Production
71
Chromium Metal
Commodity Country Measure 2007 2008 2009 2010 2011 2012
Chromium
Unwrought;
powders
(811221)
China Licensing
requirement
Yes Yes Yes Yes Yes Yes
South
Africa
Licensing
requirement
No Yes Yes Yes Yes Yes
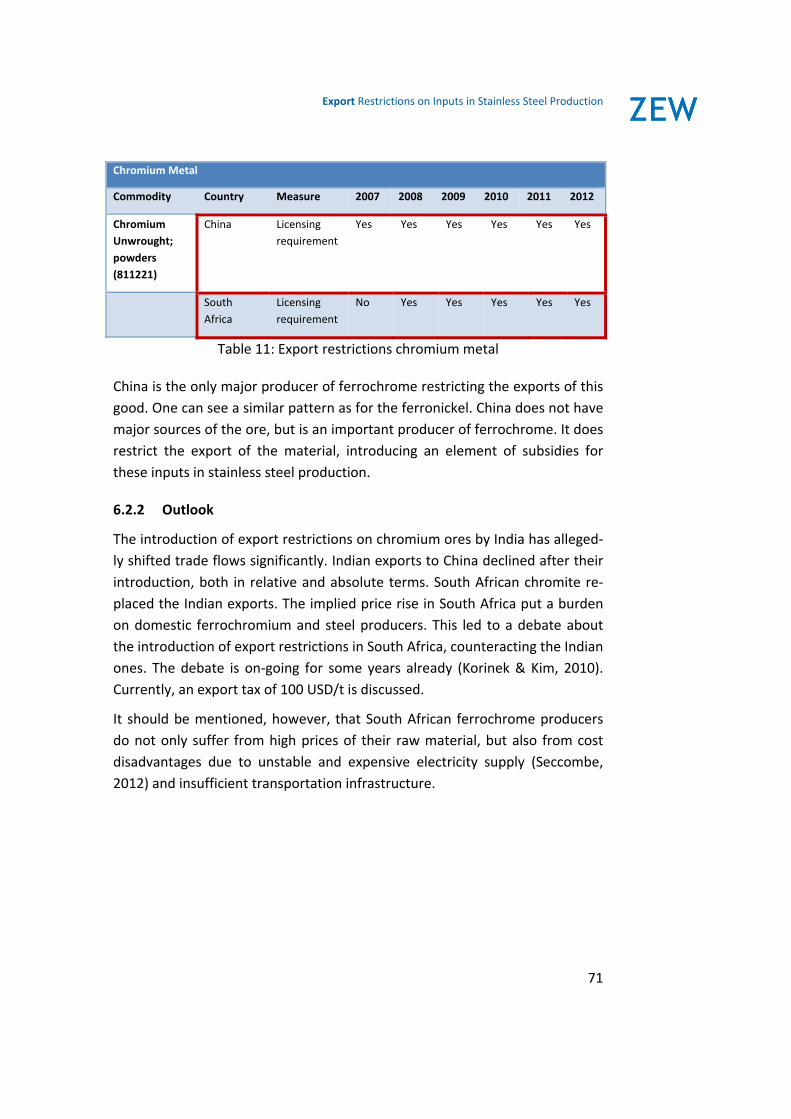
Table 11: Export restrictions chromium metal
China is the only major producer of ferrochrome restricting the exports of this
good. One can see a similar pattern as for the ferronickel. China does not have
major sources of the ore, but is an important producer of ferrochrome. It does
restrict the export of the material, introducing an element of subsidies for
these inputs in stainless steel production.
6.2.2 Outlook
The introduction of export restrictions on chromium ores by India has alleged‐
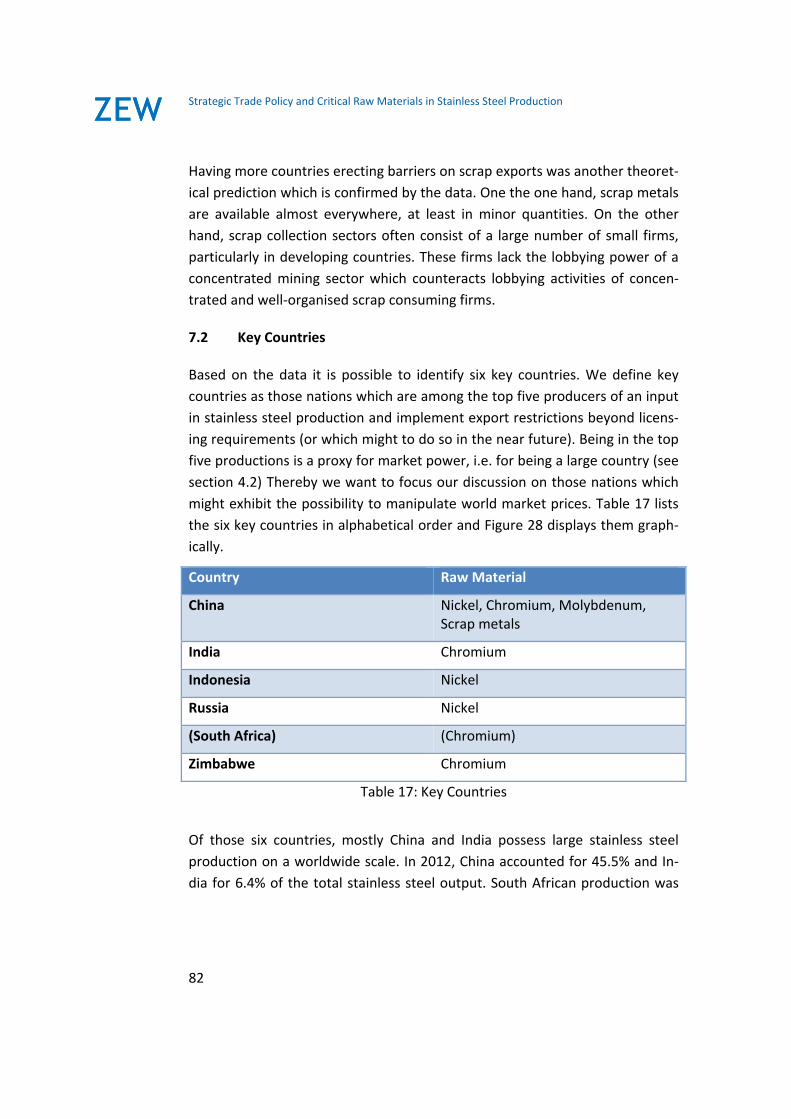
ly shifted trade flows significantly. Indian exports to China declined after their
introduction, both in relative and absolute terms. South African chromite re‐
placed the Indian exports. The implied price rise in South Africa put a burden
on domestic ferrochromium and steel producers. This led to a debate about
the introduction of export restrictions in South Africa, counteracting the Indian
ones. The debate is on‐going for some years already (Korinek & Kim, 2010).
Currently, an export tax of 100 USD/t is discussed.
It should be mentioned, however, that South African ferrochrome producers
do not only suffer from high prices of their raw material, but also from cost
disadvantages due to unstable and expensive electricity supply (Seccombe,
2012) and insufficient transportation infrastructure.
Strategic Trade Policy and Critical Raw Materials in Stainless Steel Production
72
6.3 Molybdenum
6.3.1 Current Export Restrictions
Ores and Concentrates
Commodity Country Measure 2007 2008 2009 2010 2011 2012
Molybdenum
ores and con‐
centrates
(261310,
261390)
China17 Export tax 10% 15% 15% 15% 15% 15%
China Licensing
requirement
Yes Yes Yes Yes Yes Yes
China18 Export quota ‐ 33.9
kt
33.9
kt
33.9
kt
33.9
kt
33.2
kt
Dominican
Republic
Export tax 5% 5% 5% 5% 5% 5%
Grenada19 Licensing
requirement
NA NA NA NA NA NA
Philippines Licensing
requirement
No Yes Yes Yes Yes Yes
Russia20 Export tax 6.5% 6.5% 6.5% 6.5% 6.5% 6.5%
Table 12: Export restrictions on molybdenum ores and concentrates
17 Data for 2007 from Korinek and Kim (Korinek & Kim, 2010). 18 Shared quota for ores and concentrates as well as Ferromolybdenum with a total amount of about 33,900 tons (Fliess & Mård, 2012). 19 The export restrictions on ores in Granada are listed in the OECD Database, but no de‐tails are available. 20 Only for non‐roasted ores and concentrates (Fliess & Mård, 2012).
Export Restrictions on Inputs in Stainless Steel Production
73
Ferromolybdenum
Commodity Country Measure 2007 2008 2009 2010 2011 2012
Ferro‐
molybdenum
(720270)
Argentina Export tax 5% 5% 5% 5% 5% 5%
China21 Export tax 10% 20% 20% 20% 20% 20%
China Licensing
requirement
Yes Yes Yes Yes Yes Yes
China22 Export quota ‐ 33.9
kt
33.9
kt
33.9
kt
33.9
kt
33.2
kt
Table 13: Export restrictions on ferromolybdenum
Molybdenum Metal
Commodity Country Measure 2007 2008 2009 2010 2011 2012
Export restrictions on molybdenum are mostly a Chinese phenomenon (see
Table 12, Table 13, and Table 14). There are export taxes on molybdenum ore
in Russia, but the Russian output does only account for 1.6% of worldwide
production (U.S. Geological Survey, 2013c). Argentina has export taxes on fer‐
21 Data for current tax rates from (Metal‐Pages, 2013) 22 Shared quota for ores and concentrates as well as ferromolybdenum (Fliess & Mård, 2012). 23 Data for current tax rates from (Metal‐Pages, 2013). 24 Shared quota for molybdenum powders, unwrought molybdenum and molybdenum scrap (Fliess & Mård, 2012).
Strategic Trade Policy and Critical Raw Materials in Stainless Steel Production
74
romolybdenum, but is not a major producer of that good either. The other
countries supplying a large share of world markets, such as the US, Chile, and
Peru, do not employ export restriction on it.
Chinese export restrictions on molybdenum were implemented in 2007 and
tightened over time (Korinek & Kim, 2010). They mainly consist of two ele‐
ments: an export tax and an export quota system. The taxes differ between
molybdenum products and vary over time. Two export quotas are in place.
One covers ores, concentrates, and ferromolybdenum and the other one pure
metals and scrap of molybdenum. Export licenses are allocated by the Ministry
of Commerce (MOFCOM), which further limits the exports and allows for
some discretion when deciding which firms are allowed to export (Price et al.,
2008).
6.3.2 Outlook
The comprehensive export restrictions on molybdenum employed China have
led to countermeasures by importing countries. In March 2012, the EU, the
US, and Japan jointly requested consultations about Chinese export re‐
strictions at the WTO. Since the consultations did not lead to an agreement, a
panel was established to resolve the conflict. The dispute not only concerns
molybdenum, but also tungsten and the rare earth elements. Future export
restrictions by China could be heavily influenced by the WTO’s decision on this
case.
Export Restrictions on Inputs in Stainless Steel Production
25 The export ban mentioned in the OECD Inventory of Restrictions on Exports of Raw Materials ended in 2011. In 2012, an export ban was (re‐)introduced (Ministerio de Industria, 2012). 26 East African Community (2010). 27 Chinese export tax in 2007 from American Scrap Coalition (2008). 28 In 2008, Iran implemented an export tax on scrap (Fars News Agency, 2008). According to OECD (2010), it was increased to 50% by 2010. In 2010, the tax was raised again to 70% (Steel Orbis, 2010).
Strategic Trade Policy and Critical Raw Materials in Stainless Steel Production
76
Stainless Steel Scrap (720421)
India29 Export tax NA 15% 15% 15% 20% 20%
Indonesia Licensing requirement Yes Yes Yes Yes Yes Yes
Malaysia Licensing requirement No Yes Yes Yes Yes Yes
Morocco31 Licensing requirement No No Yes Yes Yes Yes
Nigeria Export prohibition NA NA Yes Yes Yes Yes
Pakistan Export tax 25% 25% 25% 25% 25% 25%
Paraguay Licensing requirement No Yes Yes Yes Yes Yes
Russia32 Export tax 15% 15% 15% 15% 15% 12.5%
Rwanda Export prohibition No No No Yes Yes Yes
South Africa Licensing requirement No Yes Yes Yes Yes Yes
Sri Lanka Export tax 10% 10% 10% 10% 10% 10%
Sri Lanka Licensing requirement No No Yes Yes Yes Yes
Tanzania Export prohibition No No No Yes Yes Yes
Uganda Export prohibition No No No Yes Yes Yes
29 Central Board of Excise and Customs (2011). 30 According to WTO (2012a). It is unclear, when the measure was implemented. 31 The licensing system covers a larger number of scrap metals, including steel scrap (Ministere du Commerce Exterieur, 2009). 32 Russia reduced its export tax on ferrous scrap after accession to the WTO in 2012 (WTO, 2011d).
Export Restrictions on Inputs in Stainless Steel Production
Zimbabwe36 Export prohibition NA NA NA Yes Yes Yes
Viet Nam37 Export tax 45% 40% 37% 33% 29% 22%
Table 15: Export restrictions on stainless steel scrap
Table 15 lists export barriers on stainless steel scrap. It is striking how many
export restrictions are implemented on scrap metal. More than 30 countries
make use of instruments limiting exports of stainless steel scrap. Most of
these countries are lower‐middle‐income economies (13 of 34) or upper‐
middle‐income economies (10 of 34) according to the World Bank’s classifica‐
tion. Seven of the countries implementing export restrictions are low‐income
economies. Four are high‐income countries (Kuwait, Russia, the United Arab
Emirates, and Uruguay). The low‐income economies are particularly strict, six
of the seven ban stainless steel exports completely. Figure 27 highlights all
countries which are part of our database of nations restricting exports of stain‐
less steel scrap.
33 According to the report of the accession to the WTO, where decreasing export taxes on scrap were agreed upon (WTO, 2008). Note that stainless steel scrap (HS code 720421) is listed two twice with different export taxes. 34 Ukraine does not levy export taxes on chromium and molybdenum scrap (WTO, 2008). 35 WTO (2012b). 36 WTO (2011b). 37 According to the WTO Accession Protocol (WTO, 2006).
Strategic Trade Policy and Critical Raw Materials in Stainless Steel Production
78
Figure 27: Export restrictions on stainless steel scrap38
Export restrictions on stainless steel scrap are often part of more general ex‐
port barriers for scrap metals. Some countries implement additional barriers
on the exports of nickel, chromium or molybdenum scrap. Table 16 displays
(further) export restrictions applied on scrap of nickel, chrome and molyb‐
denum. Argentina has a higher export tax on this type of scrap metals, and so
has Sri Lanka. Russia has a higher export tax on nickel, but a lower one for
chromium and molybdenum scrap. China particularly restricts exports of mo‐
lybdenum scrap.
38 The authors thank Katja Mehlan for preparing this figure.
Export Restrictions on Inputs in Stainless Steel Production
79
Specific Regulations on Scrap of Nickel, Chromium, and Molybdenum
Commodity Country Measure 2007 2008 2009 2010 2011 2012
Nickel waste
and scrap
(750300)
Argentina Export tax 40% 40% 40% 40% 40% 40%
China Export tax ‐ 10% 10% 10% 10% 10%
Mauritius39 Licensing
requirement
No No Yes Yes Yes Yes
Russia Export tax 30% 30% 30% 30% 30% 30%
Sri Lanka Export tax 25% 25% 25% 25% 25% 25%
Chromium
Waste and
scrap (811222)
Argentina Export Tax 40% 40% 40% 40% 40% 40%
Mauritius Licensing
requirement
No No Yes Yes Yes Yes
Russia Export tax 6.5% 6.5% 6.5% 6.5% 6.5% 6.5%
Sri Lanka Export tax 25% 25% 25% 25% 25% 25%
Molybdenum
Waste and
scrap (810297)
Argentina Export tax 40% 40% 40% 40% 40% 40%
China Export tax 15% 15% 15% 15% 15% 15%
China Licensing
requirement
Yes Yes Yes Yes Yes Yes
China40 Export quota ‐ 4,340 t
2,300 t
3,830 t
3,830 t
3,750 t
Mauritius Licensing
requirement
No No Yes Yes Yes Yes
Russia Export tax 6.5% 6.5% 6.5% 6.5% 6.5% 6.5%
Sri Lanka Export tax 25% 25% 25% 25% 25% 25%
Table 16: Export restrictions on nickel, chromium, and molybdenum scrap
39 The Consumer Protection (Scrap Metal) Regulations 2007 list the metals affected in detail. Interestingly, stainless steel scrap (HS code 720421) is not among them (Ministry of Industry, 2007). 40 Shared quota for molybdenum powders, unwrought molybdenum and molybdenum scrap (Fliess & Mård, 2012).
Strategic Trade Policy and Critical Raw Materials in Stainless Steel Production
80
6.4.2 Outlook
It appears as if the already large number of export restrictions on scrap metals
will increase even further in the near future. An example where the new regu‐
lation is already in effect is Ghana. In 2013, the African country introduced a
new law prohibiting the export of ferrous scrap (Ministry of Trade & Industry,
2013). From 2002 on, a temporary export ban on ferrous scrap was in place. In
2008, a more flexible licensing system was introduced (GNA, 2013). This sys‐
tem is now abolished in favour of an export prohibition again.
The introduction of an export tax on scrap exports is currently discussed in
Brazil. The debate mainly takes place between the steel industry and the scrap
collectors, a sector consisting of many small scale firms in Brazil (Parra‐Bernal,
2012).
A complex system for restricting exports of metal scrap was discussed in South
Africa. It is set up as a price preference system. Before firms can receive a li‐
cense to export, they are obligated to offer the scrap to domestic buyers at a
price 20% below the relevant reference prices. Only if no domestic customer is
willing to buy the scrap within 15 working days, the firm is allowed to export.
The measure is explicitly aiming to “counter de‐industrialisation”, “improve
the competitiveness of downstream industries”, and to “create decent jobs”.
This measure will apply not only to steel scrap (including stainless scrap) but
also to nickel, molybdenum, aluminium, and copper, among others
(International Trade Administration Commission of South Africa, 2013a,
2013b, 2013c). The export preference system was announced to come into
force in September 2013 (Markram, 2013a) and legally challenged shortly the
announcement by the South African Metal Recyclers Association (Markram,
2013b).
Background for European Policy Decisions
81
7 Background for European Policy Decisions
7.1 Intermediate Results from Theory and Empirics
The analysis of export restrictions enacted on the four most important inputs
in stainless steel production shows that each of the materials has its own ‘sto‐
ry’. In the case of nickel, it is the question how Indonesian restrictions on ore
exports will affect future nickel markets and nickel pig iron production in par‐
ticular. For chromium, it will be important if South Africa eventually introduces
export restrictions on its ore exports. The WTO currently plays the most im‐
portant role for molybdenum deciding if China has to abolish or to relax its
export barriers. In the case of scrap, it seems as the world is getting closer to a
classical prisoner’s dilemma situation with an already large and further in‐
creasing number of restrictions in place.
Beyond the specific stories, the data in chapter 6 confirms the theory present‐
ed in chapter 5.
Nations best described by the developed country prototype do not implement
export restrictions. The only high‐income countries appearing in the data are
Kuwait and the United Arab Emirates. Nations such as the USA, Japan, or the
EU member states do not restrict exports of inputs in stainless steel produc‐
tion.
Exports of nickel, chromium, and molybdenum are almost exclusively in force
in resource‐rich, industrialising countries.41 The picture is distinctively different
for scrap metals. While a lot of industrialising countries hinder scrap exports,
we also find export restrictions in many developing nations. Altogether, the
largest number of export barriers is found for scrap metals.
It should be noted that not all nations matching the resource‐rich, industrialis‐
ing country prototype make use of export restrictions. Chile and Peru are ex‐
amples for nations within this group choosing not to restrict exports.
41 Both Grenada and the Dominican Republic restrict ore exports but do not possess nota‐ble production of the metals in the scope of this study.
Strategic Trade Policy and Critical Raw Materials in Stainless Steel Production
82
Having more countries erecting barriers on scrap exports was another theoret‐
ical prediction which is confirmed by the data. One the one hand, scrap metals
are available almost everywhere, at least in minor quantities. On the other
hand, scrap collection sectors often consist of a large number of small firms,
particularly in developing countries. These firms lack the lobbying power of a
concentrated mining sector which counteracts lobbying activities of concen‐
trated and well‐organised scrap consuming firms.
7.2 Key Countries
Based on the data it is possible to identify six key countries. We define key
countries as those nations which are among the top five producers of an input
in stainless steel production and implement export restrictions beyond licens‐
ing requirements (or which might to do so in the near future). Being in the top
five productions is a proxy for market power, i.e. for being a large country (see
section 4.2) Thereby we want to focus our discussion on those nations which
might exhibit the possibility to manipulate world market prices. Table 17 lists
the six key countries in alphabetical order and Figure 28 displays them graph‐
ically.
Country Raw Material
China Nickel, Chromium, Molybdenum, Scrap metals
India Chromium
Indonesia Nickel
Russia Nickel
(South Africa) (Chromium)
Zimbabwe Chromium
Table 17: Key Countries
Of those six countries, mostly China and India possess large stainless steel
production on a worldwide scale. In 2012, China accounted for 45.5% and In‐
dia for 6.4% of the total stainless steel output. South African production was
Background for European Policy Decisions
83
1.42% and the Russian 0.32% of the worldwide production (International
Stainless Steel Forum, 2013).
Figure 28: Key countries42
China is the most important one of the key countries. It possesses the largest
stainless steel production worldwide and restricts exports of all major inputs,
at least at some point in the value chain. It should be noted, however, that
China itself is dependent on imports of nickel and chromium ores.
India is plausibly the second most important key country. It is among them
mostly because of its export restrictions on chromium ores, though export
taxes on scrap metals are in force as well.
Indonesia is a key country because of the already implemented export taxes
and the announced export bans on nickel ores. These measures affect mostly
the trade within Asia, in particular between Indonesia and China.
Export taxes on nickel are the reason why Russia is listed as a key country. The
Russian government agreed to abolish export taxes on nickel and molyb‐
42 The authors thank Katja Mehlan for preparing this figure.
Strategic Trade Policy and Critical Raw Materials in Stainless Steel Production
84
denum within four years after the accession of the country to the WTO (WTO,
2011c). Therefore, Russia is expected to be in this group temporarily.
South Africa is the only key country falling into this category because of poten‐
tial export restrictions. The South African government discusses export duties
on chromium ores. If implemented, these trade restrictions might have strong
effects on chromium markets.
Zimbabwe is the only developing nation among the key countries. It is still a
top five producer of chromium ores, but its production has stagnated in abso‐
lute terms and its importance declined in relative terms over the last decade.
7.3 Indication for the Effectiveness of Export Restrictions
A number of export restrictions restrain international sales of all four inputs in
stainless steel production investigated in this study. This does not automatical‐
ly imply that the restrictions have an influence on world markets for those
inputs.
Conducting in‐depth research on the causal effects of export restrictions on
the markets for nickel, chrome, molybdenum, or stainless scrap is beyond the
scope of this study. We only display and discuss some data which must only be
interpreted as an indication for the effectiveness of export restrictions. Before
conducting in‐depth quantitative research on export barriers in these markets,
all results must be interpreted as indicative and with greatest care.
A first indication of the effectiveness of export restrictions can be found in the
markets for class I nickel. Figure 29 shows the prices of nickel at the LME and
in China. It can be seen that prices outside China are somewhat higher than
inside. On average, they are 2.6% above LME prices. The evidence matches the
fact that the People’s Republic applies licensing requirements on class I nickel
(see Table 6), which are a comparatively soft barrier to exports.
Background for European Policy Decisions
85
Figure 29: Class I nickel prices at the LME and in China Source: SMM
0
5,000
10,000
15,000
20,000
25,000
30,000
Jan 09
Apr 09
Jul 09
Okt 09
Jan 10
Apr 10
Jul 10
Okt 10
Jan 11
Apr 11
Jul 11
Okt 11
Jan 12
Apr 12
Jul 12
Okt 12
Jan 13
Apr 13
Jul 13
US$
per t
LME China (Jinchuan)
Strategic Trade Policy and Critical Raw Materials in Stainless Steel Production
86
Figure 30: Ferrochrome prices in the EU and China in 1000 US$ per t Source: asianmetal.com
Figure 30 displays the prices of ferrochrome in the European Union and China
in 1000 US$ per ton. Chinese prices are lower over the whole period displayed
here. The differences are particularly large during the price spike of 2007 and
2008. In absolute terms, a ton of ferrochrome costs about 1,000 US$ more in
the EU than in China. This can only be partly explained by transport costs. In
2007, for example, the OECD’s database on maritime transport costs shows
costs of 35 US$ per ton of dirty bulk goods shipped from China to Europe.43
The data displayed in Figure 30 might be interpreted as an indication that Chi‐
nese export restrictions drive a wedge between domestic prices and foreign
prices. The price difference could, however, also be influenced by other fac‐
tors. These include trade restrictions of other countries (e.g. chromite ore ex‐
43 Note that transport costs were particularly high in 2007. They ranged between 22 US$ per ton in 2004 and 14 US$ in 2006. Unfortunately, the OECD's database does not contain more recent data.
0
1
2
3
4
5
6
7
01.02.2007
01.06.2007
01.10.2007
01.02.2008
01.06.2008
01.10.2008
01.02.2009
01.06.2009
01.10.2009
01.02.2010
01.06.2010
01.10.2010
01.02.2011
01.06.2011
01.10.2011
01.02.2012
01.06.2012
01.10.2012
01.02.2013
01.06.2013
US$
per t
EU
China
Background for European Policy Decisions
87
ports from India), European import tariffs (see section 8.1.2), or trade costs
other than transportation costs. Only an in‐depth quantitative assessment can
reveal causal effects.
Figure 31: Prices of nickel ore and ferronickel (4‐6%) in China rel. to April 2007 Source: asianmetal.com, own calculations
Figure 31 shows the prices of nickel ore and low quality ferronickel, i.e. nickel
pig iron, in China. Numbers are normalised to April 2007, the first month for
which data is available. Prices are strongly correlated. They fall until early 2009
and remain mostly flat afterwards. In May 2012, the Indonesian government
imposed its export tax on nickel ores. No significant movement of prices is
visible following this event. Again, this cannot be interpreted as a proof of
ineffectiveness of this measure because it is not clear how prices would have
evolved without the tax in act. It could, for example, also be the case that
buyers and sellers on the market adapted to the new regime before the meas‐
ure came into force.
0
0,2
0,4
0,6
0,8
1
1,2
01.04.2007
01.07.2007
01.10.2007
01.01.2008
01.04.2008
01.07.2008
01.10.2008
01.01.2009
01.04.2009
01.07.2009
01.10.2009
01.01.2010
01.04.2010
01.07.2010
01.10.2010
01.01.2011
01.04.2011
01.07.2011
01.10.2011
01.01.2012
01.04.2012
01.07.2012
01.10.2012
01.01.2013
01.04.2013
Nickel Ore Ferronickel (4‐6%)
Strategic Trade Policy and Critical Raw Materials in Stainless Steel Production
88
Figure 32: Share of stainless scrap exports subject to export restrictions Source: UN Comtrade, own calculations
Figure 32 shall give an idea about the importance of export restrictions in
stainless scrap markets. It shows which share of gross stainless scrap exports
in 2011 came from countries applying export restrictions. Intra‐EU trade is
excluded from the calculations. Only 13% of all stainless scrap originates from
nations restricting their exports.
Again, this graph needs to be interpreted with care. It shows an equilibrium
where the export barriers are already in place and it is not obvious how trade
flows would look like under free trade. This depends crucially on how elastic
trade flows react on changes of trade costs. Without further analysis, the ef‐
fects of export restrictions cannot be determined reliably.
7.4 The EU’s Role in the Markets for Stainless Steel and its Inputs
The EU accounts for a notable share of worldwide stainless steel production.
In 2012, 7.5 million tons of stainless steel were produced in the EU, which cor‐
responds to 21.1% of worldwide output.
Europe does not possess notable market power for virgin materials used in
stainless steel production. The EU accounts for less than 5% of worldwide
87%
13%
Scrap exports not subjectto export restrictions
Scrap exports subject toexport restrictions
Background for European Policy Decisions
89
nickel and chromium ore production as well as ferrochrome output. These
numbers are slightly higher for primary nickel (International Chromium
Development Association, 2012; International Nickel Study Group, 2013).
There is no notable molybdenum or ferromolybdenum production in the EU
(U.S. Geological Survey, 2012).
In the case of stainless scrap, the EU is a major player. 38.7% of the scrap
available worldwide comes from the European Union. Up until 2012, the EU
was usually a net importer of stainless scrap. Whether or not Europe will be‐
come a net exporter of stainless scrap in the future has important policy impli‐
cations. As long as the EU remains a net importer, it is exposed to foreign ex‐
port barriers of this input. Without the restrictions, Europe might import even
more stainless scrap at lower prices. However, it remains unclear how strong
these effects are quantitatively.
It should be noted that Europe is already actively pursuing strategies for raw
material issues. A key document is the EU Commission’s communication pub‐
lished in 2001 (EU Commission, 2011a, 2011b), outlining the European ap‐
proach. It rests on three pillars: “1) Fair and sustainable supply of raw materi‐
als from international markets. 2) Fostering sustainable supply within the EU.
3) Boosting resource efficiency and promote recycling.” (EU Commission,
2008). In 2010, the German Federal Government published a raw materials
strategy exhibiting similarities with its European counterpart (BMWi, 2011a).
Many of the policy options outlined in the following chapter are considered in
these strategies.
Strategic Trade Policy and Critical Raw Materials in Stainless Steel Production
90
8 Policy Options for the EU
8.1 Policies Reducing Impacts of Export Restrictions in Europe
8.1.1 Increasing Transparency
Export restrictions do not only increase the costs of international trade
directly, but also imply higher transaction costs. Firms involved in international
trade have to inform themselves about regulations in act. In case of export
restrictions, data is scarce and scattered. There is a number of reports and
scientific papers listing regulations for specific sectors or in specific countries
(e.g. Korinek & Kim, 2010b; Price et al., 2008; Price & Nance, 2010; WTO,
2011a). No database provides regularly updated information about export
restrictions, however.
European policy can contribute to increasing transparency and lower trade
costs by setting up such a database. It could also foster quantitative research
on the effects of export restrictions. The work could be allocated to an
international organisation such as the WTO. Costs for constructing and
maintaining such a database appear limited. We therefore support such a
measure.
8.1.2 Abolishing Import Tariffs
An aspect rarely taken into consideration in the debate about trade
restrictions on raw materials and import dependency of European industries is
tariffs on raw material imports. Both the EU and the USA do indeed levy
import duties on chromium and molybdenum. Table 18 lists the import taxes
on different forms of these metals in the EU and the US.
Note that the tariffs in Table 18 are general ones. Some countries face lower
tariffs due to bilateral trade agreements or due to lower tariffs on imports
from developing countries. In the European case, mainly imports from China,
the US, and, from 2014 on, Russia are affected by tariffs.44
44 Russia will no longer be part of the EU’s Generalised Scheme of Preferences from 2014 on.
Policy Options for the EU
91
Commodity HS Code Import Duty EU (Third country)
Import Duty US
(General)
Chromium Ferrochromium 720241 4.0% 1.9%
72024910 7.0% 1.9%
72024950 7.0% 3.1%
720250 2.7% 10.0%
Chromium Unwrought; powders
81122110 0.0% 3.0%
81122190 3.0% 3.0%
Molybdenum Molybdenum ores and concentrates
261310 0.0% 12.8¢/kg on molybdenum content + 1.8%
261390 0.0% 17.8¢/kg on molybdenum
content
Ferromolybdenum 720270 2.7% 4.5%
Molybdenum Metal: Powders
810210 4.0% 9.1¢/kg on molybdenum content + 1.2%
Molybdenum Metal: Unwrought
810294 3.0% 13.9¢/kg on molybdenum content + 1.9%
Table 18: Import tariffs on chromium and molybdenum in the EU and the US Source: Taric database, US Harmonized Tariff Schedule
The import tariffs work mirror‐image to export taxes. They increase domestic
prices for chrome and molybdenum, which benefits the domestic supply at the
expenses of the stainless steel sector. Since the EU is an important consumer
of these metals, some part of the burden is imposed on the rest of the world.
Domestic and international marktes are distorted by the import restrictions.
Welfare effects are detemined analogously to the export restrictions. If
Europe exhibits power on chrome and molybdenum markets, it can
manipulate the terms‐of‐trade in its own favor and might also be able to
relocate firms producing ferrochrome or ferromolybdenum into the EU. Both
production of ferrochrome and ferromolybdenum is limited in Europe,
Strategic Trade Policy and Critical Raw Materials in Stainless Steel Production
92
however. Other normative reasons to restrict imports, like environmental or
infant industry arguments, do not seem to be of major importance.
Import tariffs can be used as a mechanism to extract resource rents which
otherwise accrue in the supplying countries. It is, however, unclear how
important these rents are quantitatively. Tariffs might also be used as
bargaining chips in future trade negotiations.
It is not clear from qualitative reasoning whether import tariffs on chrome and
molybdenum are welfare enhancing for the EU. Therefore, we recommend to
analyse them quantiatively and decide on their continuation or abolishment
based on that research.
8.2 Policies Reducing Incentives for Export Restrictions Indirectly
8.2.1 Increasing Resource Efficiency and Recycling Rates
Measures increasing resource efficiency and recycling rates are among the
most important goals in both the European and German resources strategies
(BMWi, 2011a; EU Commission, 2011b). Instruments to achieve these aims
include taxes and subsidies, public research or subsidies on private R&D. We
will not review them in detail, but outline why they generate incentives to
lower foreign export restrictions.
Figure 33 displays the market for an input in stainless steel production. Lets
use nickel as an example. In this case, we examine the market from the
perspecitve of an importing region like the EU. The international market
where it imports from is shown on the left side of Figure 33, whereas the
domestic market is on the right side.
Dd0 on the right is the domestic demand before policy intervention, Sd is
domestic supply. SRes on the left is the residual supply, the amount of nickel
supplied by world markets for every world market price. DW0 denotes
Europe’s import demand for nickel. The intersection of SRes and the country’s
import demand DW0 is the equilibrium before policy intervention. The country
imports an amout of nickel im0 from the world market.
Note that the demand curve is steep. The demand does not react very
elastically on price changes, at least in the short run. This matches metals
markets well. Take copper as an example. Agostini (2006) presents estimates
Policy Options for the EU
93
of the demand price elasticity for copper. The numbers range from ‐0.19 to ‐
0.47. They are consistently below ‐1. This means, a 1 % increase in copper
prices leads a less than 1 % decrease in copper demand. It is very likely that
nickel, chromium, or molybdenum demand behaves similarly.
Assume now that Europe introduces a new technology which makes the use of
nickel more efficient. It reduces the demand for the metal. We can assume
that it will be used more intensively if prices are high, so the new demand
curve Dd1 also turns left. That implies a flatter (more elastic) demand for
imports, DW1.
Recall how incentives to introduce export restrictions depend on the elasticity
of demand for imports (see e.g. section 4.5). An elastic (flat) demand curve
means that exporting nations impose the costs of their trade barriers on
importers and domestic suppliers will bear them. Making import demand in
Europe more flexible makes export restrictions in the key countries more
costly. This is how increased recycling rates and resource efficency indirectly
reduce export barriers.
Dd0SdSRes
pp
qimim0
p0
qD0im1
Dw1
Dd1
Dw0
p1
qD1qS0qS1
Figure 33: Effects of a Resource Efficiency Policy on Incentives for Export
restrictions
Raw materials are costly inputs into production. Private firms have an
incentive to use them efficiently. The higher the prices for virgin metals, the
larger the incentive not to waste them and to recycle. It is not immedately
clear why government intervention is justified to increase resource efficiency
and recycling rates. Environmental reasons provide an argument for that.
Strategic Trade Policy and Critical Raw Materials in Stainless Steel Production
94
Measures aiming at resource efficiency and more recycling reduce the
necessity to mine and process virgin ores and thereby lower enviromental
burdens, including emissions of greenhouse gases (Fraunhofer UMSICHT,
2010; Johnson et al., 2008). Economic justification for intervention is
predominantly from market failures due to environmental damages.
Implications on trade policies can be seen as a side effect.
Instruments raising resource efficiency and recycling rates can be subject to a
rebound effect. Take again the example of a technology reducing nickel inputs
in Europe. Saving nickel also saves costs. European industries then can sell
their products at lower prices, inducing more demand for those goods.
Demand for nickel increases again, because more is produced. The overall
nickel demand falls less than the gain in efficiency.
In case of stainless steel, recycling rates are already high today. Between 66%
and 70% of stainless steel scrap was reused in the production of stainless steel
in the early 2000s, according to Reck et al. (2010). Low hanging fruits are
picked already. It is also important to remember that stainless scrap is subject
to trade restrictions as well.
R&D is of particular importance among the instruments used to increase
resource efficiency and recycling rates. Innovation and research is a key
element in both the European and the German raw material strategies. The EU
commission states thate there is the “need for innovation along the entire
value chain, including extraction, sustainable processing, eco‐design, recycling,
new materials, substitution, resource efficiency and land use planning” (EU
Commission, 2011a). The establishment and of an European Innovation
Partnership (EIP) on raw materials and the foundation of the Helmholtz
Institute Freiberg for Resource Technology in Germany exemplify policy
actions.
We recommend considering public investments in R&D and other measures
aimed at increasing resource efficiency. Potential obstacals to higher recycling
rates should carefully be examined as well. They gain their economic
justification mainly from their effects on more sustainable resource use.
Despite being less effective in the short‐run, they both lower incentives for
introducing export restrictions in the long run by increasing the demand elas‐
ticity for inputs.
Policy Options for the EU
95
8.2.2 Fostering Mining in Europe
Another regularly discussed approach to counteract foreign export restrictions
on raw materials is increasing mining activities in Europe. When announcing
its new European Innovation Partnership on raw materials, the EU Commis‐
sion stated that it wants to promote mining to “reduce European industry’s
dependence on non‐EU virgin raw materials” (EU Commission, 2013).
Whether mining can contribute to counteracting foreign export restrictions on
raw materials is first and foremost a business question. If low cost deposits
exist and prices are high enough to make their exploitation profitable, firms
will be willing to invest in mining projects.
Policy can influence investment decisions by streamlining licensing processes
or by providing information about deposits in Europe. It could also relax envi‐
ronmental regulations. But these regulations reflect the voters’ preferences
for environmental quality which makes it implausible that regulations will
change considerably. It should also be taken into consideration that building‐
up mining capacities is a time‐consuming task. Increased mining will not be
effective in the short run.
Providing knowledge about raw material deposits in Europe can be justified by
the public good nature of such information. Reducing bureaucratic barriers to
investment makes the mining sectors more efficient. Other than that, Europe‐
an policy has only limited influence and no obvious justification for further
intervention into the mining sector. There are no obvious market failures justi‐
fying such actions. Private firms are likely to be better judges of the commer‐
cial viability of resuming mining activities in the EU or its member states.
8.3 Enforcing WTO Rules
As outlined in section 3.2, the WTO rules on export restrictions are weak or, as
Karapinar (2012) calls it, “an area of ‘under‐regulation’”. Nonetheless, in some
cases WTO regulations might help counteracting export restrictions.
A number of countries committed themselves to confine or to abolish export
restrictions when joining the World Trade Organization. These countries in‐
clude Viet Nam (WTO, 2006), Ukraine (WTO, 2008), and two of the key coun‐
tries: Russia (WTO, 2011c) and China (WTO, 2001b).
Strategic Trade Policy and Critical Raw Materials in Stainless Steel Production
96
Russia agreed on abolishing export taxes on both nickel and molybdenum four
years after its accession. It is still free to levy taxes on export of several scrap
metals, including stainless scrap.
China agreed to abolish all export taxes other than those listed in annex 6 of
its accession protocol. This list includes most notably ferrochrome, unwrought
nickel, and stainless steel scrap. Molybdenum, for example, is not part of it.
European policy can make use of the WTO regulation and enforce contracts
already in act to counteract export restrictions which violate these agree‐
ments. The ‘China ‐ Measures Related to the Exportation of Rare Earths, Tung‐
sten and Molybdenum’ case which was started jointly by the EU, the US, and
Japan is an example of this approach. Such commitments offer important ref‐
erence points for international negotiations.
8.4 Retaliatory Tariffs
Europe can react on export restrictions confrontatively using countervailing
tariffs. The EU could rely on import taxes on stainless steel or export
restrictions imposed on European exports.
Levying import tarrifs on stainless steel to retaliate against foreign export
restrictions would be problematic from judicial point of view. In its decisions
on the “US – Measures Treating Export Restrictions as Subsidies” case, the
WTO decided that export restrictions on raw materials cannot be treated as
subsidies for downstream sectors and do not justify countervailing tariffs
(Karapinar, 2012; WTO, 2001a). Given this precedent, it appears realistic that
import tariffs on stainless steel are inconsistent with WTO regulation as well.
The EU could also impose export restrictions itself. The European Union does
not possess notable supply of nickel, chromium, or molybdenum. Therefore,
export restrictions would plausibly be implemented on scrap metals. Antonioli
(2012) reports that European steelmakers are indeed calling for export
restrictions on scrap metals.
Even though the EU exports large quantities of stainless steel scrap, it has
been a net importer of this good in the past. As long as Europe remains a net
importer, export restrictions will not be effective. Further discussion is based
Policy Options for the EU
97
on the assumption that the EU will become a net exporter of stainless steel
scrap in the future.
European export tariffs affect scrap markets as described in chapter 3. If the
EU has market power on stainless scrap, it can enjoy gains from increased
terms‐of‐trade. Sectors demanding scrap will enjoy lower prices, which could
offset higher prices of virgin materials in Europe, while scrap collecting firms
suffer from lower prices. How this would effect welfare in Europe is not clear
from a qualitative assessment. Some problems of export tariffs on scrap
metals need to be mentioned.
If the export tariffs are used to retaliate against trade restrictions already in
place, policy makers should take into consideration that they will also burden
third‐party nations. China – the most important of the key countries ‐ will
plausibly be effected only to a limited degree. The availability of nickel pig iron
as a cheap source of nickel reduces the importance of scrap metal inputs (see
section 2.2 and 2.5). Countries without domestic stainless steel production,
and thus no demand for stainless scrap, will not be affected as well.
If Europe implements export taxes, less scrap will be shipped out of Europe. If
the European steelmakers’ elasticity of substitution between virgin materials
and scrap is not large enough such that this addional supply will be used
within the Union, recycling rates fall. This can eventually lead to a higher use
of virgin materials, increased environmental damages from mining and higher
greenhouse gas emissions.
Retaliatory tariffs are politically dangerous. If the EU implemented export
restrictions on scrap metal, it would be the first group of industrialised
countries to do so. This can encourage other ‐ industrialised and industrialising
‐ nations to follow the European example.
If retaliation is directed against important trading partners, it comes with a risk
of triggering a harmful trade war. This holds true both for import tariffs on
stainless steel and export tariffs on stainless scrap. The current conflict about
European import tariffs on Chinese solar panels or the struggle about
American duties on steel in 2002 and 2003 show how quickly affected parties
can react by introducing further retaliatory measures.
Strategic Trade Policy and Critical Raw Materials in Stainless Steel Production
98
Conducting a quantitative analysis of retailiatory tariffs is beyond the scope of
this study. The qualitative discussion points out a number of reasons why such
measure are politically dangerous and, in particular in case of the export
tariffs, also likely to be ineffective. Therefore we do not recommend
retaliatory measures.
8.5 International Agreements on Raw Materials Exports
8.5.1 Negotiating Bilaterally
The EU can rely on bilateral contracts to ensure access to raw materials. An
example for those bilateral agreements are the ‘raw material partnerships’
Germany initiated with Mongolia (BMWi, 2011b) and Kazakhstan (BMWi,
2012). The agreements enable the German industry access to raw materials
“without discrimination and under transparent and fair conditions” (BMWi,
2011b). In return, Germany commits itself to give guarantees on investment
and to support training of workers and technology transfer.
Only a small number of nations possess market power for raw materials used
in stainless steel production. Only five of those make use of export restrictions
currently. This limits the number of nations to negotiate with and reduces the
costs and complexities of negotiating bilaterally. Agreements can be tailored
to match both sides’ needs. Therefore, bilateral negotiations with exporters of
raw materials are a comparatively quick and low‐cost approach to abolish
export barriers and the implied distortions for Europe.
The German raw material partnerships show how contracts can be tailored.
Both Mongolia and Kazakhstan are in a state of development where they
benefit from a transfer of technology and knowledge, while Germany enjoys
access to raw materials. Both contracts have a long‐term perspective. They
aim specifically at building‐up mining infrastructure and not only at preventing
the implementation of export restrictions. It is questionable, however, if this
approach can be adopted wholesale to larger and more industrialised
countries such as China or India.
Most developing countries do not possess market power in metals or scrap
metal markets. Some do still restrict scrap exports. Bilateral agreements about
export barriers with those nations do not promise large welfare gains for
Policy Options for the EU
99
Europe. Therefore, incentives to negotiate are rather small. Developing
countries will likely be neglected if Europe chooses a strategy of bilateral
negotiations to deal with foreign export restrictions. They might uphold their
restrictions which are, as outlined in chapter 5, plausibly the result of welfare‐
decreasing special interest policies.
If Europe abolishes export barriers with some if its suppliers of raw materials
bilaterally, they still might be in act towards other nations. Third countries will
suffer from distortions in international trade. This can be a side‐effect of the
bilateral approach. In particular developing countries lacking the negotiating
power of the EU, the US, or Japan will probably be unable to reduce them via
bilateral agreements.
8.5.2 Negotiating Multilaterally
The WTO and GATT are the most notable examples of multilateral trade
agreements. They have proved to be very effective reducing import
restrictions in the last decades.
Using multilateral agreements, for example within the WTO, avoids burdens
for third parties while still reducing or abolishing export restrictions. A further
advantage of trade agreements is that they can be used by governments to
committ themselves to free trade vis‐à‐vis domestic special interest groups
(see Bagwell & Staiger, 2010 for an overview). This should be particularly
beneficial for those nations which would be neglected in a bilateral approach.
Aiming for a more comprehensive multilateral trade agreement including
export restrictions can also help integrating key countries for which it might
prove to be challanging to negotiate bilaterally.
Negotiating between a large number of nations – the WTO has 159 members
currently – involves higher transaction costs and will be much more time‐
consuming. Additionally, many developed countries do not use export
restrictions which they could reduce in multilateral negotiations. They have to
offer other benefits for their trading partners. Therefore, multilateral
contracts on export restriction will realistically come into effect only in the
long run.
Strategic Trade Policy and Critical Raw Materials in Stainless Steel Production
100
8.6 Intermediate Conclusions
In this chapter we discussed a number of policy options and carefully gave
recommendations regarding their advantageousness. Some of these options
stem from the discussion in economic literature. Others reflect current politi‐
cal discussions.
Table 19 displays the policy options analysed in this report. We do recommend
setting up a database for export restrictions, utilising existing WTO regulation
on export restrictions, and aiming at international agreements on export bar‐
riers, preferably multilateral ones. Further research is needed to decide
whether abolishing import duties on chrome and molybdenum is welfare en‐
hancing.
Measures increasing resource efficiency and recycling rates should be consid‐
ered. Both are policy goals themselves with a large number of potential
measures to achieve them. Evaluating their costs and benefits in detail is be‐
yond the scope of this study. We recommend undertaking further studies as‐
sessing them.
Whether or not mining in Europe will increase in the future is rather a busi‐
ness and less a policy question. We do not recommend using retaliatory
measures.
Policy Options for the EU
101
Approach Measure Recommendation Comment
Reducing impacts Increasing transparen‐cy
Yes
Abolishing import tariffs
Consider Quantitative re‐search needed
Indirect approach Increasing resource efficiency
Consider Environmental aspects important
Increasing recycling rates
Consider Environmental aspects important
Fostering mining in Europe
No explicit mining policy
Private sector decision
Enforcing WTO rules
Enforcing WTO rules Yes
Retaliatory tariffs Import barriers on stainless steel
No High probability of being counter‐productive
Export barriers on stainless scrap
No Meaningless if EU remains net im‐porter
International Agreements
Negotiating bilaterally Yes Short‐ to medium run measure
Negotiating multilat‐erally
Yes Long‐run measure
Table 19: Overview over policy options
Strategic Trade Policy and Critical Raw Materials in Stainless Steel Production
102
9 Conclusions
Stainless steel is one of the most inportant materials used in modern
industrial, construction, and household applications. This is reflected by
growth rates of production of more than 5.5% on average in the last decades.
Europe is one of the most important regions worldwide in stainless steel
production. 21.1% of stainless steel output worldwide is produced in the EU.
The only nation making more stainless steel is China accounting for 45.5% of
the worldwide production. The EU is, however, almost fully dependent on
imports of nickel, chromium and molybdenum. With large amounts of
products made from stainless steel in use in Europe, the EU is comparatively
well supplied with scrap metals. The EU was, however, a net importer of
stainless scrap at least until 2012.
This study pursued three main targets. Firstly, we want to provide a reasona‐
bly comprehensive survey of the reasons why nations restrict their exports of
raw materials. Secondly, the study aims to compile and to present a thorough,
country‐by‐country overview over measures impeding exports of the four key
raw materials used to produce stainless steel. Thirdly, given the European po‐
sition in markets for stainless steel and its inputs, we want to analyse policy
options available to the EU and to give some careful recommendations which
of those appear favourable and which not.
Based on our analysis of modern literature on international trade, we distin‐
guished three main groups of nations regarding their propensity to erect ex‐
port barriers. The first group is 'developed countries' with diversified econo‐
mies. Even if they exhibit market power on inputs in stainless steel production,
they refrain from exploiting it and rather rely on free trade policy. The second
group is 'resource‐rich, industrialising countries'. These nations have power in
international markets for one or more raw materials, but tend to lack compar‐
ative advantage in downstream industry or services sectors. These nations
have an elevated propensity to use export restrictions exploiting their market
power. This behavior is plausibly explained by the attempt to raise interna‐
tional prices for their exports and to support growth of downstream indus‐
tries. The last group of nations is 'developing countries'. Theory points out that
these nations might implement export barriers even in the absence of market
Conclusions
103
power. Their existence can be explained by a combination of weak institutions
and successful special interest policies. If a concentrated and well‐organised
sector employing scrap metals encounters a scrap sector dominated by small
firms lacking lobbying power, stainless steel scrap is likely to attract export
restrictions.
The empirical investigations yields the, to our knowledge, most comprehen‐
sive database of export restrictions currently applied on the most important
raw materials used in stainless steel production: nickel, chrome, molybdenum,
and stainless scrap. It covers export tariffs, quotas, prohibitions, and licensing
requirements in force between 2007 and 2012, plus some measures currently
discussed or recently announced. It includes information about policies used
by the most important producers of nickel, chromium, and molybdenum. Ex‐
port barriers of more than 30 nations could be compiled for stainless steel
scrap. While the intransparent nature of export restrictions in many countries
prevents us from claiming to have a complete dataset, it is possible to derive
some patterns and compare them with the theoretical predictions.
As proposed by the theory, we find that a small number of key countries ac‐
count for most export barriers in force for nickel, chrome, and molybdenum.
The most important key country is China. It is a major producer of all four raw
materials and erected export barriers for all of them. India and Zimbabwe are
key countries for the case of chrome. Export tariffs on chromium ores are dis‐
cussed in South Africa. They would turn the African nation into a key country
for chrome. Additional players are Russia and Indonesia, both for nickel. After
Russia committed to abolishing its export barriers on nickel after joining the
WTO in 2012, its presence in this group is expected to be temporary. In line
with the theory, stainless steel scrap export restrictions are in force in a large
number of nations, including many without any notable market power.
The European Union faces the growing number of export barriers from the
position of an important producer of stainless steel without major supplies of
nickel, chrome, and molybdenum. The EU has imported more stainless scrap
than it exported for many years, but it might become a net exporter in the
future. This position gives rise to a number of policy options. Some of these
options are already part of European raw material policies. Others are part of
Strategic Trade Policy and Critical Raw Materials in Stainless Steel Production
104
the current political discussion and additional options are likely to attract at‐
tention soon.
As a first step, the EU should set up a comprehensive database containing reg‐
ularly updated information about currently enacted and upcoming export re‐
strictions. This increases transparency and lowers transaction costs of raw
material importers. It should also consider abolishing the European import
restrictions on chrome and molybdenum.
A second step for European policy makers should be considering whether pub‐
lic investments in research and development aimed at raising resource effi‐
ciency are adequate. Similarly, obstacles to increasing recycling rates should
be carefully examined. Both goals can economically be justified because they
contribute to a more sustainable resource use in Europe, but have side effects
on trade policy as well. While less effective in the short‐run, they increase the
demand elasticity for raw material imports and thereby lower incentives to
introduce export restrictions in the long run.
A policy option available in the short run is using the possibilities the WTO
offers to enforce compliance with international agreements. WTO regulations
on export restrictions are generally weak. However, a number of nations, in‐
cluding China, committed to lowering or abolishing export barriers when join‐
ing the WTO. These commitments offer important reference points for bilat‐
eral and multilateral negotiations.
We do not recommend retaliatory tariffs as a policy option. Due to the trade
flows of imports and exports of the raw materials subject to this study, such
measures are likely to hit, if any, predominantly third countries which do not
implement export barriers themselves. Towards most of the key countries
they are plausibly ineffective. They additionally come with the danger of trig‐
gering harmful trade wars.
In the long run, the best option for the EU seems to be striving towards a mul‐
tilateral agreement covering export restrictions or towards including those in
the WTO regulation (Lamy, 2011). An international agreement on export re‐
striction can help abolishing welfare reducing trade barriers without shifting
burdens on third countries. Bilateral agreements can serve as a transitional
solution.
Conclusions
105
The study unveiled further research needs, particularly on the empirical side.
While we compiled an extensive database of export restrictions, analysing
their effects quantitatively was beyond the scope of this study. An in‐depth
quantiative assessment is necessary to decide whether an export restriction is
welfare‐enhancing or not in the individual case. Therefore, future research
should cover the effects of specific export barriers on raw materials markets
both ex‐post or ex‐ante. Not least, the effects of export restrictions on
European stainless steel production should be investigated quantitatively.
Strategic Trade Policy and Critical Raw Materials in Stainless Steel Production
106
10 References
Agostini, C. A. (2006). Estimating Market Power in the US Copper Industry. Review of Industrial Organization, 28(1), 17–39. Retrieved from http://www.springerlink.com/index/10.1007/s11151‐006‐0006‐8
American Scrap Coalition. (2008). Coalition Releases List of Foreign Scrap Trade Barriers (July 2008). Retrieved May 17, 2013, from http://www.americanscrapcoalition.com/news/story.asp?articleid=25
Amiti, M. (2005). Location of vertically linked industries: agglomeration versus comparative advantage. European Economic Review, 49(4), 809–832. Retrieved from http://www.sciencedirect.com/science/article/pii/S0014292103001089
Antonioli, S. (2012, June 1). CORRECTED‐Steelmakers lobby EU Commission for scrap export ban. reuters.com. Retrieved from http://www.reuters.com/article/2012/06/01/steel‐export‐ban‐idUSL5E8H11N920120601
Bagwell, K., & Staiger, R. W. (1999). An Economic Theory of GATT. American Economic Review, 89(1), 215–248.
BMWi. (2011a). Rohstoffstrategie der Bundesregierung. Sicherung einer nachhaltigen Rohstoffversorgung Deutschlands mit nicht‐energetischen mineralischen Rohstoffen.
BMWi. (2011b). Abkommen zwischen der Regierung der Bundesrepublik Deutschland und der Regierung der Mongolei über Zusammenarbeit im Rohstoff‐, Industrie‐ und Technologiebereich.
BMWi. (2012). Abkommen zwischen der Regierung der Bundesrepublik Deutschland und der Regierung der Republik Kasachstan über Partnerschaft im Rohstoff‐, Industrie‐ und Technologiebereich.
Burns, S. (2009, August 24). Russia to Re‐impose Export Taxes on Nickel as State Revenues Slump. Metal Miner. Retrieved from http://agmetalminer.com/2009/08/24/russia‐to‐re‐impose‐export‐taxes‐on‐nickel‐as‐state‐revenues‐slump/
Burns, S. (2011, October 26). The Role of Nickel Pig Iron in Refined Nickel Demand and Stainless Production Costs. Metal Miner. Retrieved from
Cartman, R. (2012). Nickel pig iron – A long term solution? In 3rd Euronickel Conference. Helsinki.
Central Board of Excise and Customs. (2011). Second Schedule ‐ Export Tariff (India).
Clow, S. (1992). The International Nickel Trade. Cambridge: Woodhead Publishing.
De Santis, R. A. (2000). Optimal Export Taxes, Welfare, Industry Concentration, and Firm Size: A General Equilibrium Analysis. Review of International Economics, 8(2), 319–335.
Devitt, P., & Prentice, A. (2013, January 28). UPDATE 1‐Norilsk petitions Kremlin for $500 mln tax break. reuters.com. Retrieved from http://www.reuters.com/article/2013/01/28/norilsk‐tax‐idUKL5N0AX55A20130128
Dudka, S., & Adriano, D. C. (1997). Environmental Impacts of Metal Ore Mining and Processing: A Review. Journal of Environmental Quality, 26(3), 590–602.
East African Community. (2010). Legal Notice No. EAC/16/2010.
EU Commission. (2008). The Raw Materials Initiative ‐ Meeting our Critical Needs for Growth and Jobs in Europe.
EU Commission. (2011a). Tackling the Challenges in Commodity Markets and on Raw Materials. COM(2011) 25 final.
EU Commission. (2011b). A resource‐efficient Europe – Flagship initiative under the Europe 2020 Strategy. COM(2011) 21.
EU Commission. (2013). Reducing the EU’s dependency on raw materials: European Innovation Partnership launched.
Fars News Agency. (2008, October 3). Iran to Impose 30% Export Tax on Scrap. farsnews.com. Retrieved from http://english.farsnews.com/newstext.php?nn=8707120634
Finkbeiner, M. (2012). Schlüsselrohstoffe Nickel, Chrom und Eisen: Beschränkte Verfügbarkeit trotz ausreichender Reserven? Retrieved from http://www.efirst.de/kunden/oryx/de/120919/medienpraesentation‐oryx2012‐de.pdf
Strategic Trade Policy and Critical Raw Materials in Stainless Steel Production
108
Fliess, B., & Mård, T. (2012). Taking Stock of Measures Restricting the Export of Raw Materials: Analysis of OECD Inventory Data. OECD Trade Policy Working Paper No. 140.
Foster, H. (2010, August 5). Mining companies oppose planned Kazakh minerals export tax. Universal Newswire. Retrieved from http://www.universalnewswires.com/centralasia/viewstory.aspx?id=1335
Fraunhofer UMSICHT. (2010). CO2 ‐ Reduktion durch intelligentes Recycling von Edelstahlschrott. Retrieved from http://www.efirst.de/kunden/oryx/de/Medien‐Praesentation_d.pdf
GNA. (2013, February 5). Ministry reminds public of ban on ferrous scrap metal export. Modern Ghana. Retrieved from http://www.modernghana.com/news/443591/1/ministry‐reminds‐public‐of‐ban‐on‐ferrous‐scrap‐me.html
Government of the Russian Federation. (2006). Resolution of the Government of the Russian Federation No. 795 (2006).
Government of the Russian Federation. (2009a). Resolution of the Government of the Russian Federation No. 25 (2009).
Government of the Russian Federation. (2009b). Resolution of the Government of the Russian Federation No. 1017 (2009).
Government of the Russian Federation. (2010). Resolution of the Government of the Russian Federation No. 892 (2010).
Government of the Russian Federation. (2011a). Resolution of the Government of the Russian Federation No. 312 (2011).
Government of the Russian Federation. (2011b). Resolution of the Government of the Russian Federation No. 875 (2011).
Government of the Russian Federation. (2012a). Resolution of the Government of the Russian Federation No. 74 (2012).
Government of the Russian Federation. (2012b). Resolution of the Government of the Russian Federation No. 431 (2012).
Grossman, G. M., & Helpman, E. (1994). Protection for Sale. American Economic Review, 84(4), 833–850.
Helpman, E., & Krugman, P. (1989). Trade Policy and Market Structure (p. 205). Cambridge: MIT Press.
References
109
International Chromium Development Association. (2011). Chrome and the ICDA.
International Chromium Development Association. (2012). Statistical Bulletin 2012. Retrieved from http://www.icdacr.com/market‐intelligence/statistical‐bulletin/2012.pdf
International Nickel Study Group. (2012). Nickel Ore Shipment to China.
International Nickel Study Group. (2013). World Nickel Statistics. Monthly Bulletin April 2013.
International Stainless Steel Forum. (2013). Stainless Steel in Figures 2013.
International Trade Administration Commission of South Africa. (2013a). Draft Policy Directive on the Exportation of Ferrous and non‐Ferrous Waste and Scrap Metal.
International Trade Administration Commission of South Africa. (2013b). Draft Export Control Guidelines on the Exportation of Ferrous and non‐Ferrous Metal Waste and Scrap.
International Trade Administration Commission of South Africa. (2013c). Notice 385 of 2013.
International Trade Centre. (2012). Russia’s Accession to the WTO: Major Committments, Possible Implications.
Jensen, F., & Chatterjee, N. (2012, May 3). UPDATE 2‐Indonesia to impose tax, curbs on raw metal exports. reuters.com. Retrieved from http://www.reuters.com/article/2012/05/03/indonesia‐mining‐tax‐idUSL4E8G35TZ20120503
Johnson, J., Reck, B. K., Wang, T., & Graedel, T. E. (2008). The energy benefit of stainless steel recycling. Energy Policy, 36(1), 181–192. Retrieved from http://www.sciencedirect.com/science/article/pii/S0301421507003655
Karapinar, B. (2012). Defining the Legal Boundaries of Export Restrictions: A Case Law Analysis. Journal of International Economic Law, 15(2), 443–479.
Kim, J. (2010). Recent Trends in Export Restrictions. OECD Trade Policy Working Paper No. 101.
Korinek, J., & Kim, J. (2010). Export Restrictions on Strategic Raw Materials and Their Impact on Trade and Global Supply. (OECD, Ed.)The
Strategic Trade Policy and Critical Raw Materials in Stainless Steel Production
110
Economic Impact of Export Restrictions on Raw Materials. OECD Publishing.
Lamy, P. (2011). The Man‐Made Causes of Price Volatility. Speech at the Global Commodities Forum, United Nations Conference on Trade and Development, 31 January — 1 February 2011. Retrieved from http://www.wto.org/english/news_e/sppl_e/sppl184_e.htm
Latina, J., Piermartini, R., & Ruta, M. (2011). Natural Resources and Non‐Cooperative Trade Policy. International Economics and Economic Policy, 8(2), 177–196.
Lennon, J. (2013). The Nickel Outlook. Oversupply Near Term but Medium Term Challenges Remain. Retrieved from http://www.insg.org/presents/Mr_Lennon_Oct12.pdf
Liu, H.‐W., & Maughan, J. (2012). China’s Rare Earths Export Quotas: Out of the China‐Raw Materials Gate, But Past the WTO's Finish Line? Journal of International Economic Law, 15(4), 971–1005.
Markram, B. (2013a, August 2). SA scrap export directive to come into force on September 16. Metal Bulletin. Retrieved from http://www.metalbulletin.com/Article/3239066/SA‐scrap‐export‐directive‐to‐come‐into‐force‐on‐September‐16.html
Markram, B. (2013b, August 28). S Africa’s metal recyclers commence legal proceedings against new scrap policy. Metal Bulletin. Retrieved from http://www.metalbulletin.com/Article/3248213/S‐Africas‐metal‐recyclers‐commence‐legal‐proceedings‐against‐new‐scrap‐policy.html
Martin, W., & Anderson, K. (2011). Export Restrictions and Price Insulation During Commodity Price Booms. American Journal of Agricultural Economics, 94(2), 422–427.
Melitz, M. J. (2005). When and how should infant industries be protected? Journal of International Economics, 66(1), 177–196.
Metal‐Pages. (2013). Chinese Export Tariffs. Retrieved May 17, 2013, from http://www.metal‐pages.com/resources/chinese‐export‐tariffs/
Mildner, S.‐A., & Lauster, G. (2011). Settling Trade Disputes over Natural Resources: Limitations of International Trade Law to Tackle Export Restrictions. Goettingen Journal of International Law, 3(1), 251–281.
Ministere du Commerce Exterieur. (2009). Avis aux Operateurs du Commerce Exterieur N°05/09.
References
111
Ministerio de Industria. (2012). Decreto 1513/2012. Suspéndese la exportación para consumo de determinadas mercaderías.
Ministry of Industry. (2007). Consumer Protection (Scrap Metal) Regulations 2007.
Ministry of Trade & Industry. (2013). Ferrous Scrap Metals (Prohibition of Export) Regulations, 2013.
Mitra, D., Thomakos, D. D., & Ulubasoglu, M. A. (2002). “Protection for Sale” in a Developing Country: Democracy vs. Dictatorship. Review of Economics and Statistics, 84(3), 497–508.
OECD. (2010). Steelmaking raw materials: Market and Policy Developments. DSTI/SU/SC(2012)1.
Oladi, R., & Gilbert, J. (2012). Buyer and Seller Concentration in Global Commodity Markets. Review of Development Economics, 16(2), 359–367.
Ossa, R. (2011). A “New Trade” Theory of GATT/WTO Negotiations. Journal of Political Economy, 119(1), 122–152.
Pariser, H. H., & Pariser, G. C. (2012). What’s New, Stainless Scrap? Presentation at the INSG 22nd Session, Industry Advisory Panel. Retrieved from http://www.insg.org/presents/Mr_Pariser_Apr12.pdf
Parra‐Bernal, G. (2012, November 6). UPDATE 1‐Brazil scrap producers, mills clash over potential export tax. reuters.com. Retrieved from http://www.reuters.com/article/2012/11/07/steel‐brazil‐scrap‐idUSL1E8M6BOL20121107
Piermartini, R. (2004). The Role of Export Taxes in the Field of Primary Commodities. World Trade Organization Discussion Paper No. 4.
Posch, P. N. (2011). The nickel market ‐ playing field of speculators or driven by fundamentals? Retrieved from http://www.efirst.de/kunden/oryx/de/nickel/485_02_003_Studie‐Oryx2011Deutsch_110914.pdf
Price, A. H., Brightbill, T. C., Weld, C. B., Capito, C. L., & Morgan, R. E. (2008). Raw Deal: How Governmental Trade Barriers and Subsidies Are Distorting Global Trade in Raw Materials.
Price, A. H., & Nance, D. S. (2010). Export Barriers and the Steel Industry. In The Economic Impact of Export Restrictions on Raw Materials (pp. 79–101). OECD Publishing.
Strategic Trade Policy and Critical Raw Materials in Stainless Steel Production
112
Reck, B. K., Chambon, M., Hashimoto, S., & Graedel, T. E. (2010). Global Stainless Steel Cycle Exemplifies China’s Rise to Metal Dominance. Environmental Science & Technology, 44(10), 3940–3946.
Rodrik, D. (1989). Optimal trade taxes for a large country with non‐atomistic firms. Journal of International Economics, 26(1–2), 157–167. Retrieved from http://www.sciencedirect.com/science/article/pii/0022199689900433
Seccombe, A. (2012, June 15). Chrome ore “China” tariff threat to SA platinum. Business Day. Retrieved from http://www.bdlive.co.za/articles/2012/06/15/chrome‐ore‐china‐tariff‐threat‐to‐sa‐platinum;jsessionid=06B047B82A80A2D483A7E805456B984C.present2.bdfm
Steel Orbis. (2010). Iran set to increase export duty on scrap to 70 percent. steelorbis.com. Retrieved May 18, 2013, from http://www.steelorbis.com/steel‐news/latest‐news/iran‐set‐to‐increase‐export‐duty‐on‐scrap‐to‐70‐percent‐541921.htm
Stürmer, M. (2008). The International Raw Materials Boom. A Challenge for Multilateral Trade Policy. International Politics and Society, 2, 126–139.
Stürmer, M., & von Hagen, J. (2012). Der Einfluss des Wirtschaftswachstums aufstrebender Industrienationen auf die Märkte mineralischer Rohstoffe. DERA Rohstoffinformationen 11.
U.S. Geological Survey. (2012). 2010 Minerals Yearbook. Ferroalloys (Advance Release).
U.S. Geological Survey. (2013a). Mineral Commodity Summaries 2013 ‐ Nickel.
U.S. Geological Survey. (2013b). Mineral Commodity Summaries 2013 ‐ Chromium.
U.S. Geological Survey. (2013c). Mineral Commodity Summaries 2013 ‐ Molybdenum.
Warr, P. G. (2001). Welfare Effects of an Export Tax: Thailand’s Rice Premium. American Journal of Agricultural Economics, 83(4), 903–920.
References
113
Widmer, M. (2009). Nickel Pig Iron in China. Retrieved from http://www.insg.org/presents/Mr_Widmer_Oct09.pdf
WTO. (2001a). Panel Report. US ‐ Measures Treating Export Restrictions as Subsidies.
WTO. (2001b). Protocol on the Accession of the People’s Republic of China to the World Trade Organization.
WTO. (2006). Report of the Working Party on the Accession of Viet Nam.
WTO. (2008). Report of the Working Party on the Accession of Ukraine to the World Trade Organization.
WTO. (2010). World Trade Report 2010. Trade in Natural Resources. WTO Publications.
WTO. (2011a). World Trade Report ‐ India 2011.
WTO. (2011b). World Trade Report ‐ Zimbabwe 2011.
WTO. (2011c). Report of the Working Party on the Accession of the Russian Federation to the World Trade Organization. Addendum. Part I ‐ Schedule of Concessions and Commitments on Goods.
WTO. (2011d). Report of the Working Party on the Accession of the Russian Federation to the World Trade Organization.
WTO. (2012a). World Trade Report ‐ Kuwait 2012.
WTO. (2012b). World Trade Report ‐ Uruguay 2012.
Xiarchos, I. M., & Fletcher, J. J. (2009). Price and Volatility Transmission between Primary and Scrap Metal Markets. Resources, Conservation and Recycling, 53(12), 664–673.
Zinyuke, R. (2013, March 13). Chrome Export Ban to Go. The Herald. Retrieved from http://www.herald.co.zw/index.php?option=com_content&view=article&id=70301:chrome‐export‐ban‐to‐go&catid=41:business&Itemid=133#.UZYVeUrI9h8