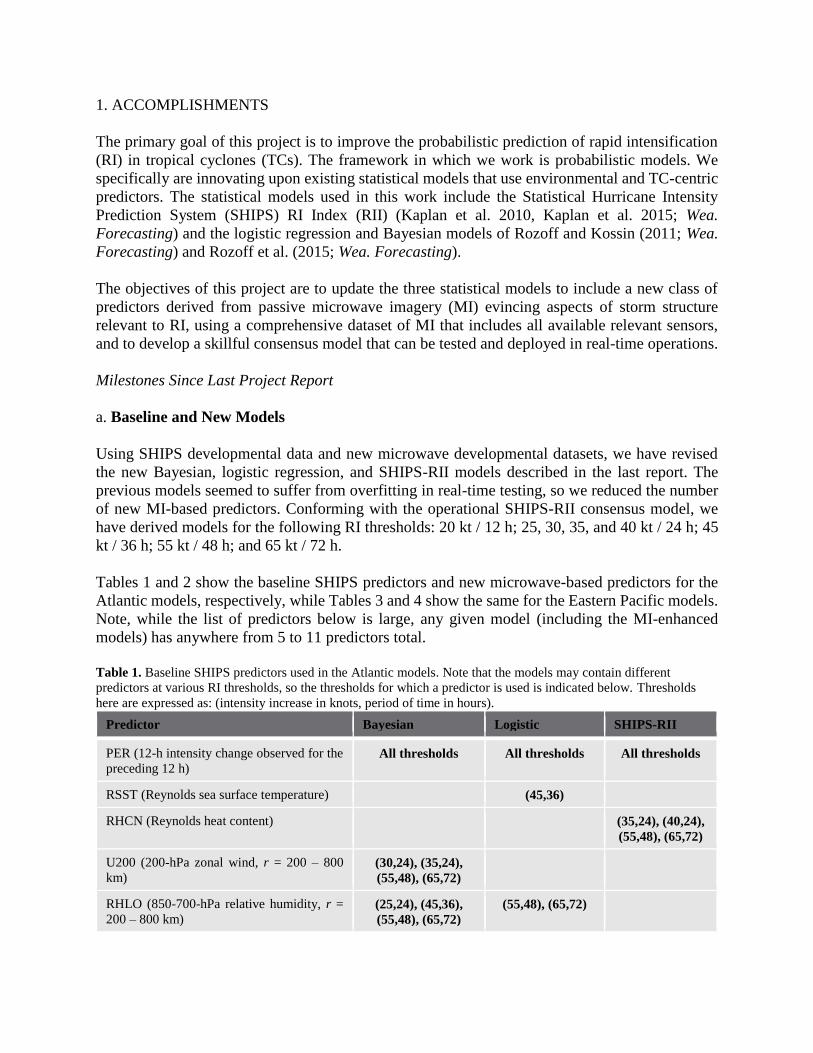
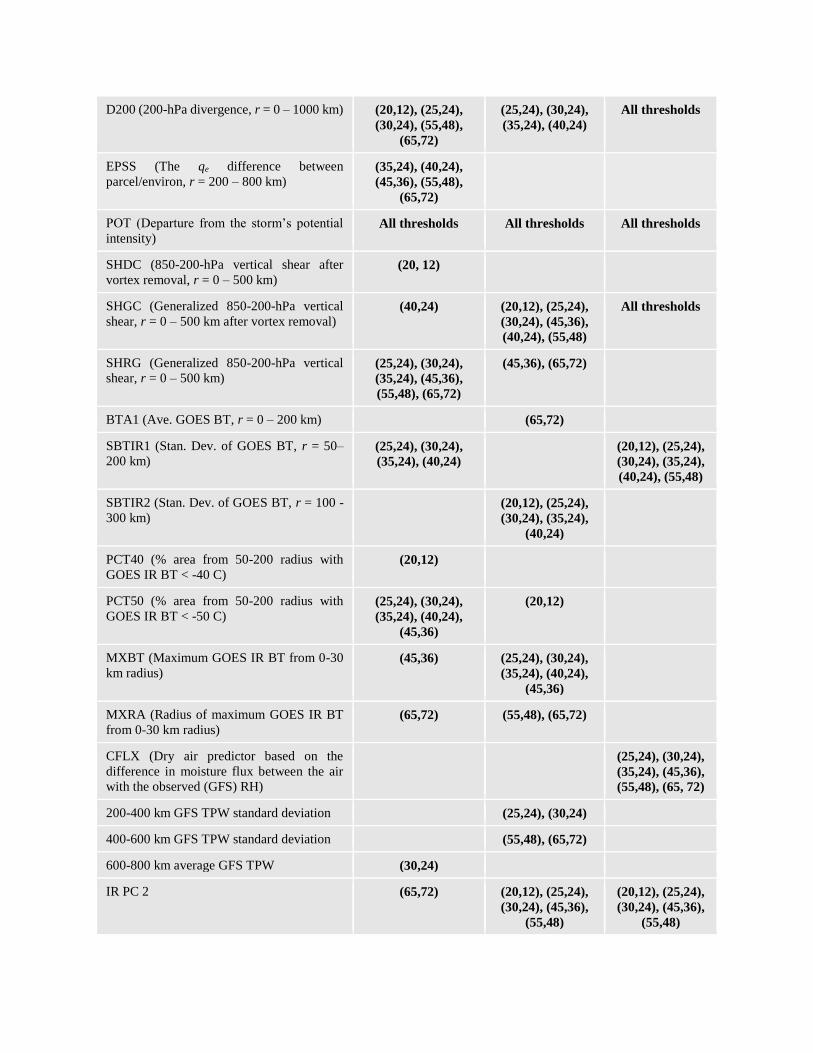
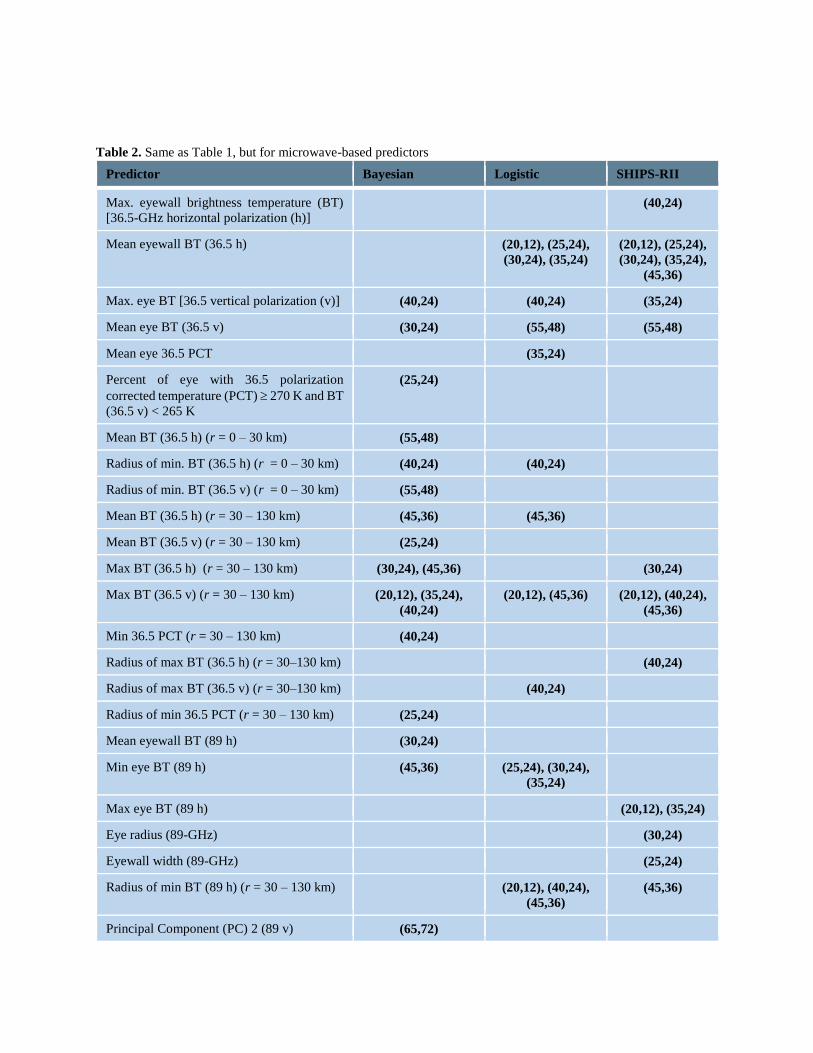
PROJECT REPORT
NOAA/OAR Joint Hurricane Testbed
Federal Grant Number: NA15OAR4590205
Probabilistic Prediction of Tropical Cyclone Rapid Intensification Using Satellite Passive
Microwave Imagery
Principal Investigators
Christopher S. Velden1, [email protected]
Christopher M. Rozoff2, [email protected]
Submission Date: 30 September 2017
1Cooperative Institute for Satellite Meteorological Studies (CIMSS)
University of Wisconsin-Madison
1225 West Dayton Street
Madison, WI 53706
2National Security Applications Program
Research Applications Laboratory
National Center for Atmospheric Research
P.O. Box 3000
Boulder, CO 80307-3000
Project/Grant Period: 1 March 2017 – 31 August 2017
Report Term or Frequency: Semi-Annual
Final Annual Report? No
1. ACCOMPLISHMENTS
The primary goal of this project is to improve the probabilistic prediction of rapid intensification
(RI) in tropical cyclones (TCs). The framework in which we work is probabilistic models. We
specifically are innovating upon existing statistical models that use environmental and TC-centric
predictors. The statistical models used in this work include the Statistical Hurricane Intensity
Prediction System (SHIPS) RI Index (RII) (Kaplan et al. 2010, Kaplan et al. 2015; Wea.
Forecasting) and the logistic regression and Bayesian models of Rozoff and Kossin (2011; Wea.
Forecasting) and Rozoff et al. (2015; Wea. Forecasting).
The objectives of this project are to update the three statistical models to include a new class of
predictors derived from passive microwave imagery (MI) evincing aspects of storm structure
relevant to RI, using a comprehensive dataset of MI that includes all available relevant sensors,
and to develop a skillful consensus model that can be tested and deployed in real-time operations.
Milestones Since Last Project Report
a. Baseline and New Models
Using SHIPS developmental data and new microwave developmental datasets, we have revised
the new Bayesian, logistic regression, and SHIPS-RII models described in the last report. The
previous models seemed to suffer from overfitting in real-time testing, so we reduced the number
of new MI-based predictors. Conforming with the operational SHIPS-RII consensus model, we
have derived models for the following RI thresholds: 20 kt / 12 h; 25, 30, 35, and 40 kt / 24 h; 45
kt / 36 h; 55 kt / 48 h; and 65 kt / 72 h.
Tables 1 and 2 show the baseline SHIPS predictors and new microwave-based predictors for the
Atlantic models, respectively, while Tables 3 and 4 show the same for the Eastern Pacific models.
Note, while the list of predictors below is large, any given model (including the MI-enhanced
models) has anywhere from 5 to 11 predictors total.
Table 1. Baseline SHIPS predictors used in the Atlantic models. Note that the models may contain different
predictors at various RI thresholds, so the thresholds for which a predictor is used is indicated below. Thresholds
here are expressed as: (intensity increase in knots, period of time in hours).
Predictor Bayesian Logistic SHIPS-RII
PER (12-h intensity change observed for the
preceding 12 h) All thresholds All thresholds All thresholds
RSST (Reynolds sea surface temperature)
(45,36)
RHCN (Reynolds heat content)
(35,24), (40,24),
(55,48), (65,72)
U200 (200-hPa zonal wind, r = 200 – 800
km) (30,24), (35,24),
(55,48), (65,72)
RHLO (850-700-hPa relative humidity, r =
200 – 800 km) (25,24), (45,36),
(55,48), (65,72)
(55,48), (65,72)
D200 (200-hPa divergence, r = 0 – 1000 km) (20,12), (25,24),
(30,24), (55,48),
(65,72)
(25,24), (30,24),
(35,24), (40,24)
All thresholds
EPSS (The qe difference between
parcel/environ, r = 200 – 800 km) (35,24), (40,24),
(45,36), (55,48),
(65,72)
POT (Departure from the storm’s potential
intensity) All thresholds All thresholds All thresholds
SHDC (850-200-hPa vertical shear after
vortex removal, r = 0 – 500 km) (20, 12)
SHGC (Generalized 850-200-hPa vertical
shear, r = 0 – 500 km after vortex removal) (40,24) (20,12), (25,24),
(30,24), (45,36),
(40,24), (55,48)
All thresholds
SHRG (Generalized 850-200-hPa vertical
shear, r = 0 – 500 km) (25,24), (30,24),
(35,24), (45,36),
(55,48), (65,72)
(45,36), (65,72)
BTA1 (Ave. GOES BT, r = 0 – 200 km) (65,72)
SBTIR1 (Stan. Dev. of GOES BT, r = 50–
200 km) (25,24), (30,24),
(35,24), (40,24)
(20,12), (25,24),
(30,24), (35,24),
(40,24), (55,48)
SBTIR2 (Stan. Dev. of GOES BT, r = 100 -
300 km)
(20,12), (25,24),
(30,24), (35,24),
(40,24)
PCT40 (% area from 50-200 radius with
GOES IR BT < -40 C) (20,12)
PCT50 (% area from 50-200 radius with
GOES IR BT < -50 C) (25,24), (30,24),
(35,24), (40,24),
(45,36)
(20,12)
MXBT (Maximum GOES IR BT from 0-30
km radius) (45,36) (25,24), (30,24),
(35,24), (40,24),
(45,36)
MXRA (Radius of maximum GOES IR BT
from 0-30 km radius) (65,72) (55,48), (65,72)
CFLX (Dry air predictor based on the
difference in moisture flux between the air
with the observed (GFS) RH)
(25,24), (30,24),
(35,24), (45,36),
(55,48), (65, 72)
200-400 km GFS TPW standard deviation (25,24), (30,24)
400-600 km GFS TPW standard deviation (55,48), (65,72)
600-800 km average GFS TPW (30,24)
IR PC 2 (65,72) (20,12), (25,24),
(30,24), (45,36),
(55,48)
(20,12), (25,24),
(30,24), (45,36),
(55,48)
Table 2. Same as Table 1, but for microwave-based predictors
Predictor Bayesian Logistic SHIPS-RII
Max. eyewall brightness temperature (BT)
[36.5-GHz horizontal polarization (h)]
(40,24)
Mean eyewall BT (36.5 h) (20,12), (25,24),
(30,24), (35,24)
(20,12), (25,24),
(30,24), (35,24),
(45,36)
Max. eye BT [36.5 vertical polarization (v)] (40,24) (40,24) (35,24)
Mean eye BT (36.5 v) (30,24) (55,48) (55,48)
Mean eye 36.5 PCT (35,24)
Percent of eye with 36.5 polarization
corrected temperature (PCT) 270 K and BT
(36.5 v) < 265 K
(25,24)
Mean BT (36.5 h) (r = 0 – 30 km) (55,48)
Radius of min. BT (36.5 h) (r = 0 – 30 km) (40,24) (40,24)
Radius of min. BT (36.5 v) (r = 0 – 30 km) (55,48)
Mean BT (36.5 h) (r = 30 – 130 km) (45,36) (45,36)
Mean BT (36.5 v) (r = 30 – 130 km) (25,24)
Max BT (36.5 h) (r = 30 – 130 km) (30,24), (45,36) (30,24)
Max BT (36.5 v) (r = 30 – 130 km) (20,12), (35,24),
(40,24)
(20,12), (45,36) (20,12), (40,24),
(45,36)
Min 36.5 PCT (r = 30 – 130 km) (40,24)
Radius of max BT (36.5 h) (r = 30–130 km)
(40,24)
Radius of max BT (36.5 v) (r = 30–130 km) (40,24)
Radius of min 36.5 PCT (r = 30 – 130 km) (25,24)
Mean eyewall BT (89 h) (30,24)
Min eye BT (89 h) (45,36) (25,24), (30,24),
(35,24)
Max eye BT (89 h)
(20,12), (35,24)
Eye radius (89-GHz)
(30,24)
Eyewall width (89-GHz)
(25,24)
Radius of min BT (89 h) (r = 30 – 130 km)
(20,12), (40,24),
(45,36)
(45,36)
Principal Component (PC) 2 (89 v) (65,72)
Table 3. Same as Table 1, but for the Eastern Pacific.
Predictor Bayesian Logistic SHIPS-RII
PER (12-h intensity change observed for the
preceding 12 h) All thresholds All thresholds All thresholds
RHCN (Reynolds heat content) All thresholds
(20,12)
U200 (200-hPa zonal wind, r = 200 – 800
km) (25,24), (30,24)
EPSS (The pos qe difference between
parcel/environment, r = 200 – 800 km) (25,24), (30,24),
(35,24), (40,24),
(45,36), (55,48)
ENSS (The neg qe difference between
parcel/environment, r = 200 – 800 km)
(25,24), (65,72)
RHLO (850-700-hPa relative humidity, r =
200 – 800 km)
(20,12), (35,24),
(40,24), (45,36),
(55,48), (65,72)
RHMD (700-500-hPa relative humidity, r =
200 – 800 km) (30,24)
RHHI (500-250-hPa relative humidity, r =
200 – 800 km) (55,48), (65,72)
D200 (200-hPa divergence, r = 0 – 1000 km) (20,12), (65,72) (25,24), (30,24),
(35,24), (40,24),
(45,36), (55,48)
All thresholds
POT (Departure from the storm’s potential
intensity) All thresholds All thresholds All thresholds
VMAX (Current maximum wind speed) (25,24)
SHDC (850-200-hPa vertical shear after
vortex removal, r = 0 – 500 km) All thresholds All thresholds (55,48), (65,72)
SHGC (Generalized 850-200-hPa vertical
shear, r = 0 – 500 km after vortex removal) (20,12), (25,24),
(30,24), (35,24),
(40,24), (45,36)
SBTIR1 (Stan. Dev. of GOES BT, r = 50–
200 km)
(20,12), (25,24),
(30,24), (35,24),
(40,24)
SBTIR2 (Stan. Dev. of GOES BT, r = 100 -
300 km) (25,24), (30,24),
(35,24), (40,24),
(45,36)
(20,12), (25,24),
(30,24), (35,24),
(40,24), (45,36)
(45,36)
PCT10 (% area from 50-200 radius with
GOES IR BT < -10 C)
(55,48), (65,72) (65,72)
PCT40 (% area from 50-200 radius with
GOES IR BT < -40 C) (20,12)
PCT50 (% area from 50-200 radius with
GOES IR BT < -50 C) (20,12)
PCT60 (% area from 50-200 radius with
GOES IR BT < -60 C) (25,24), (30,24),
(35,24), (40,24)
(20,12)
MXBT (Maximum GOES IR BT from 0-30
km radius)
(25,24), (30,24),
(35,24), (40,24)
CFLX (Dry air predictor based on the
difference in moisture flux between the air
with the observed (GFS) RH)
(20,12), (30,24),
(35,24), (40,24),
(45,36), (55,48)
Table 4. Same as Table 2 but for the Eastern Pacific
Predictor Bayesian Logistic SHIPS-RII
Mean eyewall BT (36.5 h) (25,24) (20,12), (25,24),
(30,24), (35,24),
(45, 36)
(20,12), (25,24),
(30,24), (35,24),
(40,24), (45,36)
Mean eyewall BT (36.5 v) (40,24)
Min eye 36.5 PCT (20,12)
Max eye 36.5 PCT (40,24) (25,24), (35,24),
(40,24)
Mean eye BT (36.5 v) (30,24), (35,24)
Percent of eye with BT (36.5 v) < 265 K (45,36) (30,24), (35,24)
Max BT (36.5 v) (r = 30 – 130 km) (40,24), (45,36)
Mean BT (36.5 h) (r = 30 – 130 km) (55,48)
Mean eyewall BT (89 h) (40,24)
Min eye BT (89 h) (20,12), (25,24) (25,24), (30,24)
(35,24), (45,36)
(45,36)
Radius of min BT (89 v) (r = 0 – 30 km) (20,12), (55,48)
Radius of min BT (89 h) (r = 30 – 130 km) (30,24), (35,24),
(40,24)
(20,12)
Mean BT (89 h) (r = 100 – 300 km) (55,48) (55,48)
PC 2 (89 h) (25,24) (25,24), (30,24),
(35,24), (45,36)
The Brier skill score improvements to the consensus of the RI models by including microwave-
based predictors are shown in Fig. 1. The Brier skill score with respect to a climatological baseline
is used to evaluate the model skill. The models with and without microwave-based predictors are
evaluated for the exact same forecasts over the period 1998-2016 in both the Atlantic and Eastern
Pacific using leave-one-year-out cross validation. In both basins, and for all models, skill is
substantially improved by the inclusion of the microwave-based predictors listed in Tables 2 and
4, although the relative improvements become small or zero at the 65 kt / 72-h RI threshold due to
the lack of MI-based predictors. We note that all consensus member models also experience
enhanced skill by including MI-based predictors except at the 65 kt / 72-h threshold, where the
improvements are small or zero due to few or no MI-based predictors used. The consensus
produces the highest skill, consistent with the results of the non-microwave-based models in
Kaplan et al. (2015; Wea. Forecasting).
(a) Atlantic Consensus Models (b) Eastern Pacific Consensus Models
Figure 1. The Brier skill scores of the consensus RI model with (blue) and without (red)
microwave-based predictors for the (a) Atlantic and (b) Eastern Pacific using leave-one-year-out
cross-validation for the years 1998-2016.
b. Real-time testing of models during 2017 Atlantic and Eastern Pacific hurricane seasons
An experimental website was developed to demonstrate and allow a quick assessment of the
probabilities of RI with the updated models and the inclusion of satellite microwave data in real-
time. The site can be found at http://tropic.ssec.wisc.edu/real-time/mw-ri-prob/. Four different
microwave sensors are being used in this real-time demonstration:
1) Special Sensor Microwave Imager (SSM/I) from the Defense Meteorological Satellite
Program (DMSP) F15 satellite
2) Special Sensor Microwave Imager/Sounder (SSMI/S) from the DMSP F16, F17, and F18
satellites
3) Advanced Microwave Scanning Radiometer 2 (AMSR2)
4) Global Precipitation Measurement (GPM) Microwave Imager (GMI)
An example of the real-time website from 2240 UTC 24 August 2017 during Hurricane Harvey is
illustrated in Fig. 2. The probabilities of RI with microwave predictors are displayed in the left
table, and the concurrent operational RI model probabilities are displayed in the right table. Both
probabilities are shaded based on percentages. Past probabilities can be viewed in the chart below
the left table. Boxes are shaded based on consensus RI probabilities using microwave data. White
boxes indicate probabilities were not available due to the lack of MW data in that analysis cycle,
which has an occurrence rate of about 39% in the Atlantic Basin. In addition, no RI probabilities
are calculated using microwave data if the TC center is too close to land.
Past RI probability tables for a particular storm can also be viewed by clicking on the “History”
link or the TC name in the right column. An example of the RI probabilities history for TC Katia
(2017) is shown in Fig. 3. The intensity of the TC and the maximum potential intensity (MPI) are
listed. (In the SHIPS-RII model, the model probabilities are set to zero if the RI thresholds exceeds
the MPI.) Between 0600 UTC 6 September 0600 UTC 7 September 2017, Katia rapidly intensified
by 35 kts, and 30kts between 1200 UTC 6 September and 1200 UTC 7 September. In both of these
cases, higher RI probabilities were predicted with the microwave-enhanced models.
Figure 2. Example of the real-time TC RI prediction site designed to demonstrate the upgraded
RI models using microwave data.
Figure 3. Example of RI probabilities from Atlantic TC Katia (2017).
Status of Project Tasks / Milestones
The following table summarizes the tasks originally proposed with some updated dates due to a
NCE, and the status of these tasks.
Task Proposed Activity Status
1 Update developmental dataset to include MI of Atlantic and Eastern
Pacific TCs from all available sensors (1998-2016). [September 2015 –
January 2017]
Completed
(with
updates
ongoing)
2 Examine and test for significance of new MI-based predictors. [September
2015 – January 2016]
Completed
3 Update logistic regression model to incorporate improved MI predictors
and evaluate on retrospective and real-time cases. [January – March 2016]
Completed
4 Enhance the Bayesian and linear discriminant analysis-based SHIPS-RII
models with up-to-date MI dataset. [January – March 2016]
Completed
5 Evaluation of updated SHIPS-RII and Bayesian models on retrospective
dataset. [March – May 2016]
Completed
6 Convert code from Matlab (development framework) to Fortran and C so
that code is portable to NCEP operations. [April 2016 – December 2017]
In Progress
7 In-house real-time testing of models in the Atlantic and Eastern Pacific
and continue reforecasts of previous seasons in simulated operational
conditions with archived real-time data. [June – November 2016]
Completed
8 Evaluation of models and model updates. [January – December 2017] In Progress
9 Prepare final NCEP-ready code and documentation for running and
maintaining models at the conclusion of the project. [February –
December 2017]
In Progress
10 Operational demo real-time test. [June – November 2017] In Progress
What opportunities for training and professional development has the project provided?
This project will provide training for forecasters for the use of MI-based probabilistic RI models
in operations.
How were the results disseminated to communities of interest?
We are providing the real-time results on a shared webpage with our points of contact at NHC.
Prior results have been presented at conferences and a publication will be produced at the project’s
completion. We will provide a real-time-capable version of our algorithm code to NHC at the end
of the project.
What do you plan to do during the next reporting period to accomplish the goals and
objectives?
We plan to finish the work on developing a real-time Fortran/C-based algorithm that can operate
successfully on NOAA computers.
2. PRODUCTS
Presentations in this reporting period
Rozoff, C. M., and C. S. Velden, 2017: JHT Project 4: Probabilistic prediction of tropical cyclone
rapid intensification using satellite passive microwave imagery. Presentation at the 2017 Tropical
Cyclone Operations and Research Forum, Miami, FL, 16 March 2016. [Available online at:
http://www.ofcm.gov/meetings/TCORF/ihc17/Session_09/9-4-rozoff_jht_web.pdf]
Publications
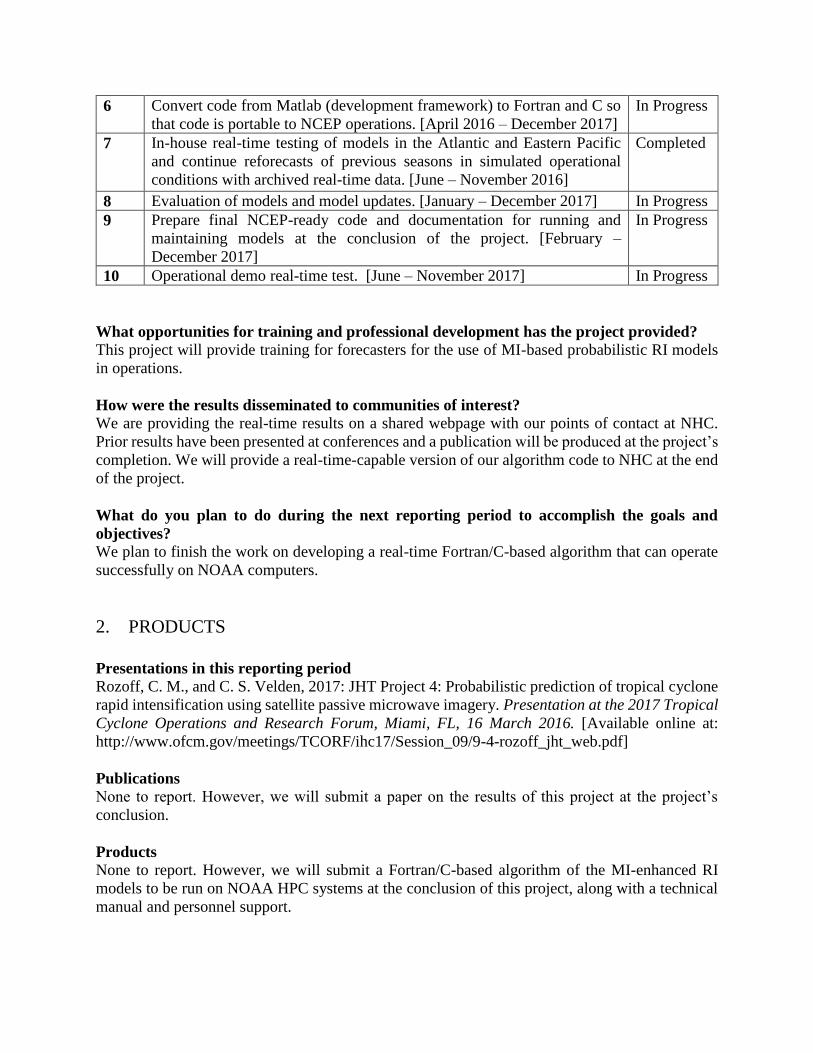
None to report. However, we will submit a paper on the results of this project at the project’s
conclusion.
Products
None to report. However, we will submit a Fortran/C-based algorithm of the MI-enhanced RI
models to be run on NOAA HPC systems at the conclusion of this project, along with a technical
manual and personnel support.
3. PARTICIPANTS & OTHER COLLABORATING ORGANIZATIONS
What individuals have worked on this project?
Christopher Velden (PI), Christopher Rozoff (Co-PI), Sarah Griffin (CIMSS/UW-Madison
research assistant)
Has there been a change in the PD/PI(s) or senior/key personnel since the last reporting
period?
Velden is now the listed institutional PI for UW-CIMSS, as Rozoff is now at NCAR
What other organizations have been involved as partners? Have other collaborators or
contacts been involved?
Forecasters and Program Officials (e.g., Shirley Murillo and Christopher Landsea) at the National
Hurricane Center/Joint Hurricane Testbed have been briefed on the project progress.
4. IMPACT
What was the impact on the development of the principal discipline(s) of the project?
We anticipate that this project will improve one of the NHC’s most reliable forecast tools for
predicting RI in TCs, thereby helping NHC improve intensity prediction of TCs. While this project
is highly practical, the results of this project may also contribute to increased scientific
understanding of intensification processes in TCs.
What was the impact on other disciplines?
While the impact may be minimal, other disciplines often use the types of statistical models we
have used in this project, and therefore researchers may find our project methodology useful.
What was the impact on the development of human resources?
None to report.
What was the impact on teaching and educational experiences?
None to report.
What was the impact on physical, institutional, and information resources that form
infrastructure?
None to report.
What was the impact on technology transfer?
None to report.
What was the impact on society beyond science and technology?
Improved TC intensity prediction, especially RI, will be extremely valuable to society, particularly
emergency management planning.
What percentage of the award’s budget was spent in a foreign country(ies)?
0%.
5. CHANGES/PROBLEMS
The project fell behind schedule (particularly in completing conversion of code from Matlab to
more portable Fortran/UNIX based scripting) as the original PI changed institutions.
6. SPECIAL REPORTING REQUIREMENTS
We report here on the project’s Readiness Level as part of the Joint Hurricane Testbed.
Transition to operations activities The statistical modeling framework is being developed to run in real-time and also in Fortran/C-
based code (as opposed to the Matlab developmental framework) so that it will be readily able to
run in an operational environment, including the WCOSS high performance computing system.
Summary of testbed-related collaborations, activities, and outcomes We are working with points of contact (POC) Christopher Landsea, John Beven, Daniel Brown,
and Dave Roberts at the NHC for real-time analysis and testing during the 2017 hurricane season.
Has the project been approved for testbed testing yet?
The 2017 real-time testing is being performed on CIMSS computing platforms.
What was transitioned to NOAA?
Nothing at this time.
7. BUDGETARY INFORMATION
The project is on budget. A NCE was granted to extend the project through December, 2017.
8. PROJECT OUTCOMES
What are the outcomes of the award?
We have developed a multi-model consensus of probabilistic models that predict the likelihood or
rapid intensification in tropical cyclones. In particular, we have updated these models to use new
predictors from satellite passive microwave imagery. This consensus model improves forecast skill
over its constituent models and over the same models not employing microwave data.
Are performance measures defined in the proposal being achieved and to what extent?
Besides the delay in demonstrating a real-time product, performance measures are being otherwise
achieved.
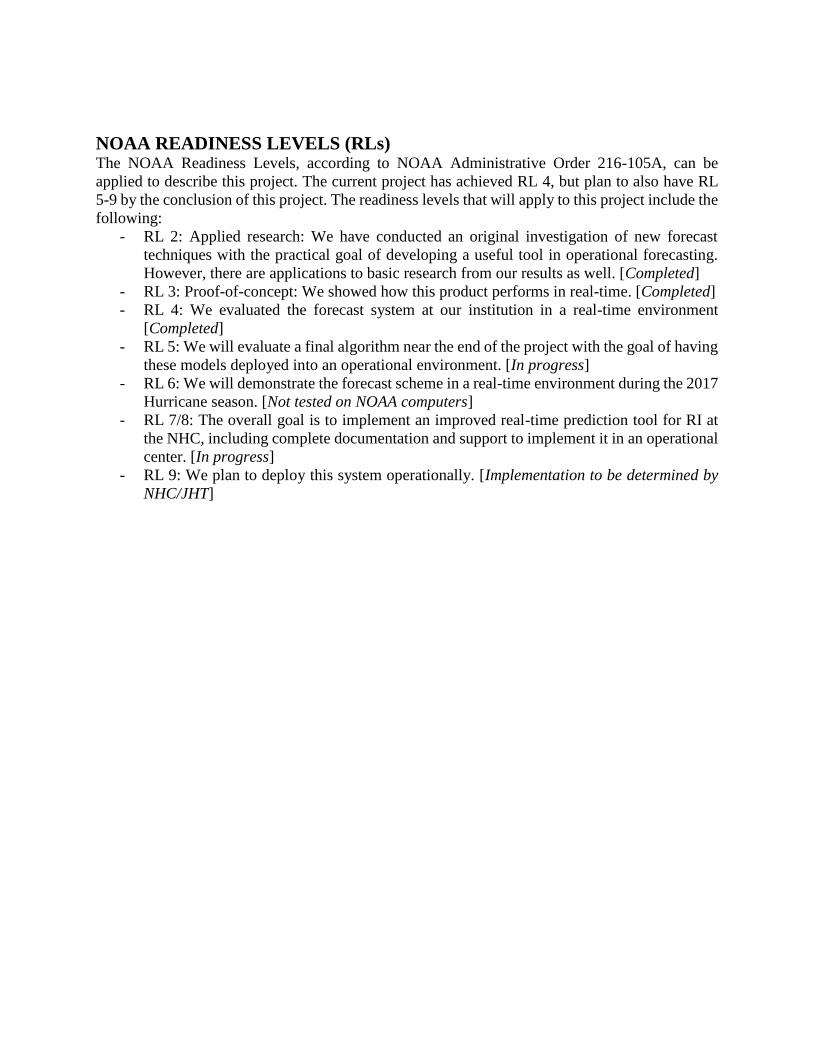
NOAA READINESS LEVELS (RLs) The NOAA Readiness Levels, according to NOAA Administrative Order 216-105A, can be
applied to describe this project. The current project has achieved RL 4, but plan to also have RL
5-9 by the conclusion of this project. The readiness levels that will apply to this project include the
following:
- RL 2: Applied research: We have conducted an original investigation of new forecast
techniques with the practical goal of developing a useful tool in operational forecasting.
However, there are applications to basic research from our results as well. [Completed]
- RL 3: Proof-of-concept: We showed how this product performs in real-time. [Completed]
- RL 4: We evaluated the forecast system at our institution in a real-time environment
[Completed]
- RL 5: We will evaluate a final algorithm near the end of the project with the goal of having
these models deployed into an operational environment. [In progress]
- RL 6: We will demonstrate the forecast scheme in a real-time environment during the 2017
Hurricane season. [Not tested on NOAA computers]
- RL 7/8: The overall goal is to implement an improved real-time prediction tool for RI at
the NHC, including complete documentation and support to implement it in an operational
center. [In progress]
- RL 9: We plan to deploy this system operationally. [Implementation to be determined by
NHC/JHT]