August 2015 Project Report No. 559 Reducing the risks associated with autumn wheeling of combinable crops to mitigate runoff and diffuse pollution: a field and catchment scale evaluation Martyn Silgram 1 , Bob Jackson 1 , Blair McKenzie 2 , John Quinton 3 , Di Williams 1 , David Harris 1 , David Lee 1 , Philip Wright 4 , Peter Shanahan 3 and Yusheng Zhang 1 1 ADAS UK Ltd., Pendeford Business Park, Wobaston Road, Wolverhampton WV9 5AP, UK 2 The James Hutton Institute, Invergowrie, Dundee DD2 5DA, UK 3 Lancaster Environment Centre, Lancaster University, Lancaster LA1 4YQ, UK 4 The Spinney, 32A Garfits Lane, Boston, Lincolnshire PE21 7EX, UK This is the final report of a 60 month project (RD-2007-3386) which started in March 2009. The work was funded by Sustainable Arable LINK, Defra, Scottish government and a contract for £120,000 from AHDB Cereals & Oilseeds. While the Agriculture and Horticulture Development Board seeks to ensure that the information contained within this document is accurate at the time of printing, no warranty is given in respect thereof and, to the maximum extent permitted by law, the Agriculture and Horticulture Development Board accepts no liability for loss, damage or injury howsoever caused (including that caused by negligence) or suffered directly or indirectly in relation to information and opinions contained in or omitted from this document. Reference herein to trade names and proprietary products without stating that they are protected does not imply that they may be regarded as unprotected and thus free for general use. No endorsement of named products is intended, nor is any criticism implied of other alternative, but unnamed, products. AHDB Cereals & Oilseeds is a division of the Agriculture and Horticulture Development Board (AHDB).
Transcript
August 2015
Project Report No. 559
Reducing the risks associated with autumn wheeling of
combinable crops to mitigate runoff and diffuse pollution:
a field and catchment scale evaluation
Martyn Silgram1, Bob Jackson1, Blair McKenzie2, John Quinton3, Di Williams1,
David Harris1, David Lee1, Philip Wright4, Peter Shanahan3 and Yusheng Zhang1
1 ADAS UK Ltd., Pendeford Business Park, Wobaston Road, Wolverhampton WV9 5AP, UK
2 The James Hutton Institute, Invergowrie, Dundee DD2 5DA, UK
3 Lancaster Environment Centre, Lancaster University, Lancaster LA1 4YQ, UK
4 The Spinney, 32A Garfits Lane, Boston, Lincolnshire PE21 7EX, UK
This is the final report of a 60 month project (RD-2007-3386) which started in March 2009. The work was funded by Sustainable Arable LINK, Defra, Scottish government and a contract for £120,000 from AHDB Cereals & Oilseeds.
While the Agriculture and Horticulture Development Board seeks to ensure that the information contained within this document is
accurate at the time of printing, no warranty is given in respect thereof and, to the maximum extent permitted by law, the Agriculture and
Horticulture Development Board accepts no liability for loss, damage or injury howsoever caused (including that caused by negligence)
or suffered directly or indirectly in relation to information and opinions contained in or omitted from this document.
Reference herein to trade names and proprietary products without stating that they are protected does not imply that they may be
regarded as unprotected and thus free for general use. No endorsement of named products is intended, nor is any criticism implied of
other alternative, but unnamed, products.
AHDB Cereals & Oilseeds is a division of the Agriculture and Horticulture Development Board (AHDB).
impacts (affecting porosity, drainage etc.), and the loss in runoff of fertile topsoil which is rich in
organic matter, fertiliser and surface-applied plant protection products.
Such impacts can also pose an environmental risk associated with the protection of water bodies,
given estimates that agriculture contributes around 25% of the total P load and around 70% of the
sediment load entering surface freshwater systems in England (Collins et al., 2009a,b; Natural
England, 2011; Environment Agency, 2012). Sediment eroding from fields can smother sensitive
8
river beds, hindering the ability of fish to spawn on river gravels (e.g. Armstrong et al., 2003); while
agronomically-insignificant loads of P (c.1kg/ha) can pose ecological problems, promoting
eutrophic status in receiving waters, stimulating toxic algal blooms and reducing dissolved oxygen
concentrations, even with riverine P levels as low as 0.1mg/l.
In response to these agricultural and environmental risks, this project aimed to develop and
evaluate the relative merits of cost-effective, practical solutions for managing autumn spraying of
winter cereals to protect farmers’ valuable and limited soil resources, promote sustainable land
management practices, help farmers achieve cross-compliance objectives (GAEC 5) and support
environmental protection objectives.
9
2.2. Project Objectives
The overall objectives of this project were:
1. To design, prototype and evaluate the efficacy of practical and novel engineering solutions for
reducing the risk of soil compaction, surface runoff and associated diffuse pollution from
tramline wheelings used for autumn spraying in combinable crops across a range of UK soil
types and slopes.
2. To use this, and other, research evidence (i) to develop, test, and refine novel modelling
approaches to estimate the effectiveness of different mitigation techniques over a wide range
of sites and environmental conditions, and (ii) to upscale mitigation results to estimate impacts
of the targeted introduction of such measures at sub-catchment scale.
3. To evaluate the cost-effectiveness of integrating the use of different mitigation tools into
commercial farm operations.
4. To provide robust evidence, advice and recommendations concerning alternative management
methods for tramlines in autumn cereals, both to inform government agri-environmental policy
needs, and to support sustainable, cost-effective best practices compatible with profitable
arable farming.
2.3. Project Approach
Project Objective (1) was achieved by developing and testing several novel yet practical methods
for managing tramlines in autumn cereals. The use of both conventional and novel soil physical
methods, new equipment attachments and low impact tyres were included in this evaluation. The
development and selection of these tramline mitigation methods are outlined in Section 3.1. The
effect of different tramline management methods on soil physical parameters (e.g. soil compaction,
trafficability for autumn spraying), and their efficacy in reducing surface runoff and associated
losses of sediment and P, were evaluated across a range of soil types and climatic conditions in
replicated, statistically-robust hillslope trials (rather than less representative and scaleable small
plot studies). The effect of tramline management on crop yield was also investigated. The
methodologies for the experimental trial activities are described in Chapters 3.2–3.6 inclusive, and
results are reported in Chapter 4.1 (Impacts on soil properties) and Chapter 4.2 (Impacts on
surface runoff, sediment and P loss).
Project Objective (2) used hillslope-scale rainfall-runoff data from previous Defra-funded projects
including PE0111 and PE0206, to incorporate the use of tramlines in cereals in the field-scale
ADAS Pollutant Transfer (APT) model developed in Defra project WQ0128 (Collins et al., 2012).
Results from the experimental hillslope trials outlined under Objective (1) were then used to identify
model parameters and develop novel model functions to characterise the effectiveness of these
10
alternative tramline mitigation methods across a range of soils and climatic conditions at whole-
field scale. These impacts were then up-scaled to infer the potential impacts of implementing the
alternative tramline management methods across larger areas, considering three sub-catchments
in the West Midlands as case study examples. The project’s modelling outcomes are presented in
Chapter 4.3.
Project Objective (3) used results from the hillslope trials from Objective (1) which quantified the
efficacy of tramline mitigation methods, coupled with estimates of field-scale and catchment-scale
efficacy of these methods based on modelling results from Objective (2), to derive cost-
effectiveness assessments for each tramline mitigation method. These assessments considered
implications for different operational sprayer configurations (e.g. tractor mounted versus self-
propelled sprayers). Broader issues associated with the alternative tramline management methods
evaluated under Objective (1) were also considered, such as their carbon footprints (e.g. fuel use),
adoption incentives, catchment-scale outcomes and policy impacts. The economic and practical
assessment of alternative tramline management methods are reported in Chapter 4.4.
Objective (4) used the approach outlined above to integrate experimental and modelling results,
and thereby demonstrate the efficacy and limitations of different practical approaches for tramline
management at field and sub-catchment scale. Project outputs have provided targeted evidence to
inform agri-environmental policy needs (e.g. Defra’s Countryside Stewardship scheme), together
with robust guidance to the farming industry on the most practical and cost-effective options for
incorporating tramline management methods into best practice to support future commercial
farming operations. A discussion of project outputs and recommendations to the industry are
presented in Chapter 5, and a large number of Knowledge Transfer activities associated with this
project are documented in chronological order in Appendix 1.
11
3. Materials and methods
3.1. Site and treatment selection
3.1.1. Site selection
Sites were selected to evaluate tramline management methods on light, medium and heavy
textured soils with long, linear slopes with slope angles of 4–9 degrees under cereal rotations.
Long slopes are at inherently greater risk of runoff, due to the larger volumes of runoff which can
potentially be transmitted downslope without a gravitational hindrance or physical barrier. Slope
angle was chosen to encompass the majority of slopes on which cereals are grown and where
surface runoff would be both a potential risk and have the potential to be mitigated by practical
management solutions. The characteristics of the field sites are shown in Table 1. The original
intention was for these field sites to be monitored in Year 1 (winter 2009-10), Year 2 (winter 2010-
11) and Year 3 (winter 2011-12).
Table 1. Field sites for experimental evaluation of tramline management methods. Ordnance Survey Grid References (OS GR) are shown. Site Location Soil type Mean Slope Angle (°) Altitude (m) OS GR
Novel rotary harrow unit (on hydraulic toolbar attached to back of sprayer)
Novel surface profiler roller-tine roller unit
The vehicle and tyre configuration were identical to that used in the first year of the study. The
rotary harrow unit was used on the conventional tyre configuration (so as to separate out any
harrow effect from any VF tyre effect). The surface profiler roller-tine unit required a separate pass
operation after the autumn spray had taken place: this separate pass was done with the unit
attached to the rear of the tractor (with conventional tyre pressures).
Year 3 (winter 2011/12)
In the third year of the trial, a randomised design with four replicates of four treatments were
imposed at the three English sites and the Scottish site, exploring the effect of tyre and harrow
treatments separately and in combination:
Conventional control tyre (CT)
Conventional control tyre (CT) + rotary harrow
Optimally-inflated VF low ground pressure tyre
Optimally-inflated VF low ground pressure tyre + rotary harrow
Year 4 (winter 2012/13) – repeat of year 1 due to third party error
A third party error facilitated a repeat of the treatments imposed in Year 1 of the study in an
additional Year 4. The Scottish site was unaffected by this issue (as monitoring began there in
Year 2), and treatments compared drilled tramlines with both VF and conventional CT tyres (similar
to Year 1 at the English sites), but also included an assessment of the rotary harrow as this had
not previously been assessed in Scotland.
Across all sites and years, tramlines were imposed using a Massey Ferguson 7480 tractor
weighing 6729 kg (AGCO Ltd., Kenilworth) or similar, towing a full Guardian 3500 litre spray-tanker
15
(Chafer Machinery Ltd., Lincolnshire), unloaded weight 3950 kg (Figure 2). The tyres used were
Michelin Agribib and Xeobib agricultural tyres (Michelin Tyre PLC, Stoke-on-Trent). Tyre pressures
were set by the Michelin engineer on the day based on knowledge of the tractor, sprayer, axle
weight distribution and sprayer loading (water volume): typical tyre inflation pressures are shown in
Figure 2, together with their configuration on the vehicles under conventional and Very Flexible
(VF) tyre treatments. The rotary harrow unit was designed by Wright Resolutions Ltd. in
conjunction with Simba UK Ltd. (now Great Plains Ltd.), and the surface profiler roller-tine unit was
designed by independent engineer Charles Creyke.
Figure 2. Plan view of conventional ground pressure (left) and Very Flexible (VF) low ground-pressure (right) vehicle configurations for a Massey Ferguson 7480 tractor (upper vehicle) pulling a trailed Chafer Guardian sprayer (lower vehicle). Tyre inflation pressures are shown in kPa.
A summary of the various treatments investigated in different sites and years is shown in Table 2.
Results from this hillslope-scale evaluation of the alternative tramline mitigation treatments are
presented in Chapter 4.2.
16
Table 2. Summary of tramline mitigation treatments investigated in different sites and years. An “X” denotes treatments were studied. Black rows denote a site was not used in that year.
Year Site
Not
drilled
Drilled
tramline
Rotary
harrowRoller
Not
drilled
Drilled
tramline
Rotary
harrow
2009/10 Hattons X X X X
Gatley X X X X
Loddington X X X X
Balruddery
2010/11 Hattons X X X X
Gatley X X X XLoddington X X X X
Balruddery X X X X
2011/12 Hattons X X X X
Gatley X X X X
Loddington X X X X
Balruddery X X X X
2012/13 Hattons X X X X
Gatley
Loddington
Balruddery X X X X
Conventional tyres VF tyres
17
3.2. Experimental and equipment design
3.2.1. Rotary harrow design
The principle of the rotary harrow evolved as a system to disrupt compacted tramlines, loosening
the surface soil, increasing surface roughness and promoting infiltration of ponded and runoff
water. In addition to promoting localised infiltration of water ponding in tramline wheelings, the
resulting pattern created by the harrows creates a chevron pattern of shallow indentations (Figure
3) which encourages water away from the centre of the tramline towards the uncompacted cropped
areas either side.
The specific design of the rotating harrow was developed to allow for high speed (10 to 16kph)
operation with low soil movement, low draft requirement, and without adversely affecting traction
(in case a further spray event should be required). Consequently, unlike conventional tines, the
rotary harrow’s operation was compatible with a sprayer in terms of its low power requirement and
soil disturbance at speed. Harrow pressure and cutting angle could be varied to suit soil conditions
and minimise soil throw.
Figure 3. Rotary harrow design plan showing attachment to rear of sprayer unit (left), and underside view showing sub-frame and hydraulic control system (right) The harrow units were designed during the project and comprised three main parts (Figure 3):
Harrows – the rotary harrow assemblies themselves. These were clamped to a sub-frame or
frames which were part of the sprayer, and the design of which was specific to each sprayer
model. The harrows were (wherever possible) a generic design of simple, replaceable tines on
a rotor axle held by bearings onto a small carrier frame. This carrier was bolted to the sprayer
18
sub-frame, and the rotors could thus be aligned to wheel track width, or removed as required
when not needed.
Sub-Frame – made specifically to suit the sprayer. Could be a single part (as above) or units
fitted to wheel motors of a self-propelled sprayer.
Hydraulic control – comprised a cylinder for raise/lower, a pressure setting valve, and an
accumulator and isolators to set and maintain ground engaging pressure. A pre-set pressure
was set in the down side of the circuit (via pressure setting valve), and this was then locked in.
An accumulator provided cushioning and contouring to the harrows, maintaining the pre-set
pressure. Raising to clear the ground surface when turning or when not required was effected
by pressuring the sub-frame up, the accumulator holding excess oil generated and the harrows
could be isolated in this up position when not required. They return to the pre-set operating
position and pressure when the isolator was opened and the oil was allowed back to the tractor
or sprayer hydraulics when spraying commenced.
Operational notes
The operating pressure of the harrows comprising the final designed unit (Figure 4) could be
adjusted for different field conditions. If ground conditions required it, more or less pressure could
simply be set as needed. The harrow circuit itself was pressured to raise clear of work, allowing it
to be isolated in this position if needed when the harrows were not required. Returning the circuit to
float or lower allowed the harrows to engage the ground and follow contours at the pre-set
pressure as needed via the accumulator.
Figure 4. Final rotary harrow design, with four harrows per arm, with one arm set to disrupt each tramline wheeling.
In terms of maintenance:
Bearings – these are pre-sealed for life and require no maintenance
Rotor Tines – provided these are kept tight, maintenance is limited to replacement or reversal
when worn.
19
Overall – the device comprised a simple set of units which could be pre-set and operated when
needed, or left clear of work. Removal of the rotors was a quick 15 minute operation for two
people. Removal of the sub-frame (for example when spraying established tall crops) depends
on the fittings, but was usually a two persons operation taking between 30 minutes and two
hours depending on the machine – typically done only once per season.
The unit was designed to function not only on cereals, but also on row crops (and has been
successfully tested in a separate Defra-funded project WQ0127 led by ADAS called MOPS2
(Silgram et al., 2015). This versatility and multi-functionality renders the purchase of such a unit
much more cost-effective, as it can have multiple applications to reduce near-surface soil
compaction and runoff risk on different land uses across a whole farming system.
3.2.2. Experimental site layout
At each site in each year, experimental treatments aimed at mitigating soil compaction, surface
runoff and erosion were imposed using a statistically robust randomised block design, typically
encompassing four replicates of four treatments. Randomised plots, typically 100–300m long and
3m wide spanning adjacent pairs of tramline wheelings were studied on these loamy sand, sandy
loam, silty clay loam and clay soils over four years. In this way, the sampled area in each “plot”
was, in reality, more akin to a true hillslope “segment”, typically measuring 300–900m2. This was a
deliberate attempt to avoid the (valid) edge effects and lack-of-representativeness criticisms which
can be levelled at small plot-scale field experiments where plots are often less than 100m2 in size
(for example, Kay et al., 2005; Withers et al., 2006) and fail to consider the cumulative effect of
saturation building up within a hillslope. Runoff generated upslope may not be able to infiltrate into
soil further downhill because that soil lower down will often be wetter, the effect of which can be to
exacerbate how much runoff reaches the base of the slope.
However, this novel hillslope-scale experimental design, which was intended to promote more
robust measurements less prone to the usual constraints inherent in small plot studies, created the
difficulty that very large volumes of runoff could be generated, even from these relatively modest
hillslope segments. For example, a rainfall event of 5mm/h lasting for two hours may generate
2mm of surface runoff. This equates to (2mm x 600m2=) 1200L of runoff water which must be
sampled. The largest practically sized fibreglass storage tanks which could be used at these field
sites had a capacity of only 500L each, and therefore a method was required to take a flow-
proportional sample of the runoff as it arrived in the tramline wheeling at the base of the hillslope. A
novel piece of equipment – a sample splitter – was required to achieve this aim.
20
3.2.3. Sample splitter design
ADAS had developed a prototype means for taking representative sub-samples of runoff using a
flow-proportional sample splitter (Deasy et al., 2009) in a previous Defra-funded project PE0206,
Mitigation of Phosphorus and Sediment (MOPS). This was based on the tipping bucket concept
commonly used in rain gauges, but in MOPS this equipment was only developed to collect runoff
subsamples from relatively small plot areas. The MOPS design concept therefore required
significant upscaling and redesign in order to sample the much larger volumes of sediment-laden
runoff (not clear rainwater) and much higher rates of runoff flowing from the larger catchment areas
proposed in this project of up to 900m2.
This objective was constrained by the electronics, which used a specialised reed switch to register
each individual tip (and its timing) with a connected datalogger. Reed switches can only record
completed electrical circuits (i.e. tips) up to a finite temporal frequency, which therefore imposes
inherent limits on the number of tips per minute which can be recorded, and hence on the
maximum flow rate (in litres per minute) which can be measured. It was essential this inherent
electronic constraint did not limit the recording of the runoff flow rates which were anticipated in this
study, which was one reason why the volume per tip had to be increased.
To illustrate the potential range of runoff flow rates which would be required in this study, Table 3
shows the relationship between the size of the monitoring area in each hillslope segment
(“catchment area”), the rainfall intensity, the proportion of rainfall lost as surface runoff (typically 5–
10%) based on losses from conventional undrilled tramlines monitored in earlier ADAS work
(Silgram, 2005, 2006), and the flow rate of runoff reaching the tipping bucket sample splitter units
at the base of the slope.
Rainfall events in excess of 5mm/hr would normally be classed as intense in lowland UK situations,
but could occur for short periods of time such as during a thunderstorm. The calculations
underpinning Table 3 were therefore critical to the design criteria for the upscaled tipping bucket
sample splitters, as they defined the range of tipping bucket flow rates which were required to
capture runoff from rainfall events with differing intensities.
21
Table 3. Relationship between runoff rate reaching the monitoring equipment at base of slope, hillslope monitoring area, rainfall intensity, and proportions of rainfall lost as surface runoff.
Based on Table 3, it was clear the tipping bucket sample splitters were needed to operate routinely
over a range of runoff flow rates up to at least 30l/min, and potentially at higher rates over short
intense periods such as thunderstorms. The original MOPS design for sample splitters was
therefore modified to satisfy this project’s operational criteria that the resulting units were able:
To monitor runoff flow from moderate slopes ≥4o whilst allowing a 2o angle to maintain water
flow (and avoid backing up) in pipes transferring collected runoff into sample storage tanks
To have straightforward, low-cost manufacturing cost, compact design (especially height), and
installation method for mounting immediately above 500L sample storage tanks
To separate and store a flow-proportional sample containing representative concentrations of
sediment and potential pollutants
To increase the capacity of units to around 1L per tip, to sample higher intensity runoff events
To increase speed per tip to enable the operating range to be extended to record runoff arriving
at the sampler at up to at least 30 l/min (Table 3)
To remain functional and relatively maintenance-free while left unattended in relatively remote
locations for extended time periods. This required improvement to the lid strength, entry flow
direction and speed, with manufacturing material chosen to resist physical damage in normal
working conditions (i.e. unit must be robust and durable over a four year project lifecycle)
To provide an overflow outlet in case the fibreglass runoff tanks became full, in spite of this
subsampling strategy
To reduce the likelihood of surface trash (i.e. soil clods, crop residues, stones) clogging or
blocking the flow inlet in order to maintain accurate flow measurement and representative
sampling whilst handling sediment-laden run-off
To provide a practical, rapid means to modify the proportion of total surface runoff collected in
storage tanks (with the remainder diverted to waste), depending on the prevailing soil, ground
To improve the precision with which the central pivot line was drilled, to ensure the unit was
balanced and produced near-equal volumes per tip from both left hand and right hand sides of
the tipping bucket (tested and verified through intensive calibration – see below)
The penultimate criterion listed above was solved by using four compartments located on one side
of the splitter box, with each compartment having a drainage hole in the base which could be left
open, or blocked. This allowed the proportion of the total runoff which was sampled to be manually
varied between 12.5% and 50% of the total runoff volume, depending how many of the four
compartments were left open to drain into the storage tank below. This decision was subjectively
determined on an event basis, depending on the antecedent weather conditions, visual extent of
topsoil saturation, and local three-day weather forecast.
The final design criterion listed above, requiring both sides of the tipping bucket to have a similar
volume per tip, was verified by calibrating left and right hand sides of the tippers separately. This
was essentially a Quality Control (QC) exercise to avoid introducing unnecessary errors into
subsequent field measurements. Plain water was used for the calibration as it was not possible to
incorporate sediment continuously at a stable concentration, although it was recognised that the
slightly higher specific gravity with a mixture of water and sediment, simulating field situations
(+0.6% at maximum expected sediment concentrations of 10,000 mg/l, assuming dry sediment at
2.5 g/cc), might increase the tipping rate marginally.
Analysis revealed a general trend toward slightly greater errors between replicate measurements
at higher flow rates, but an acceptable level of error (coefficient of variation <10%, where cv is
defined as standard deviation/mean *100) was consistently achieved with the final prototype
equipment. Figure 5 illustrates an analysis of field kit prior to installation, with mean tipping bucket
capacities for this batch of 16 units destined for an individual field site ranging from 1.03–1.28 l/tip
with a 95% confidence interval of ±0.11%. The availability of such individual calibration coefficients
for each unit negated the need to introduce additional errors by using a single default value for
volume per tip.
23
Figure 5. Calibration of a batch of 16 sample splitters for a single site, showing variations in litres per tip (which were taken into account via individual splitter conversion equations). Upper and lower 95% confidence intervals are shown.
Unplasticised polyvinyl chloride (UPVC) was the material chosen for construction because it is
strong and durable and can be easily machined to fine tolerances. Alternative materials such as
aluminium or stainless steel were discounted on cost grounds. Welding using specialised heat
equipment provides strong bonded joints capable of withstanding the force of impact of the tipping
bucket. The axle under the tipping bucket was initially mounted in plastic bearings inside the box,
but excess friction caused by sediment ingress led to the axle being routed through the sides of the
box into sealed bearings on the outside on later models.
Following the development and testing of five different prototypes for the splitter unit during the
initial year of the project, a final sample splitter unit and an example calibration curve are shown in
Figure 6. This calibration curve shows the operating range over which a robust calibration curve
used to convert tips/min (recorded by the datalogger) to runoff flow (in litres/min) renders the unit
capable of successfully subsampling runoff at flow rates of up to 40 l/min. The actual volume of
runoff collected in the storage tanks was then reduced by a factor of 12.5–50.0% depending on
how many stoppers were opened at the base of the sample splitter unit, with the remainder
diverted to waste.
0.8
0.9
1.0
1.1
1.2
1.3
1.4
1 2 3 4 5 6 7 8 9 10 11 12 13 14 15 16
litre
s/tip
(m
ean
of
5 flo
w r
ates
)
Splitter number
Upper 95% cl
Lower 95% cl
24
Figure 6. Novel flow-proportional sample splitter for runoff, showing plan design view (top left and top right), and side view (bottom left). The plan views show the internal compartments used to modify the proportion of flow collected. The bottom right image shows a calibration curve to convert tipping frequency to volume flow rate, with quadratic equation and ‘goodness of fit’ statistic.
3.3. Field installation
After treatments were imposed in each of the 4 replicates of the 4 treatments i.e. across a total of
16 hillslope segments, equipment was installed to collect surface runoff from each individual
segment. Runoff water was collected using 3m lengths of domestic metal or plastic guttering
installed across individual pairs of tramline wheelings, dug into the soil at an angle of 120o to the
long plot edge in order to increase downward slope angle and minimise the risk of sediment build
up in the guttering. A flange on the leading edge against the plot, was bent down to 45o to facilitate
backfill compaction, thus minimising the possibility of water undercutting the gutter. The runoff was
then transmitted downslope using drainpipes (supported by wooden trestles), into the sample
splitters where a chosen proportion of the runoff was allowed to enter the 500L runoff storage
tanks below whilst the remainder was diverted to waste.
Typically, 6m lengths of 110mm drainpipe were used, and positioned to ensure an adequate
minimum downslope angle (≥2°) relative to the sloping soil surface. The pipe length needed to
obtain the required vertical drop to maintain runoff flow was calculated as:
Axle bearing
Flow divider
To waste
Reed
Inlet with venturi
To waste
To sample
Tipping bucket
25
)sin(
cos
pf
fHL
where L is drainpipe length, H is installation height, θp is the downslope angle on pipe, and θf is the
slope of the field’s soil surface.
Based on practical experience in the previous MOPS project, wherever possible runoff storage
tanks were sited on top of the soil surface. This increased material cost on pipework and trestles
but decreased labour costs for installation. This method was preferable because the alternative of
burying tanks in holes increased the risk of them floating as the holes filled with water: this would
cause sampling apparatus to fail, and could occur at the base of slopes if subsoil saturation
developed (due to prolonged wet weather causing wetness to build up from depth, and/or by
subsoil compaction leading to a perched water table developing at plough pan depth).
An example of the resulting experimental installation is shown in Figure 7 below.
Figure 7. Rills in tramline wheelings at silty clay loam site following autumn spraying (top left); gutter collecting runoff from tramline wheeling during rainfall event at loamy sand site (top right); monitoring equipment in situ on two adjacent plots with orange pipework, white sample splitters, black runoff collection tanks with red lids, and blue wastepipes (bottom left); and aerial view of 16 plot experiment monitoring tramline treatments (bottom right).
26
3.4. Runoff sampling strategy
Stokes’s law – originally identified over 150 years ago – dictates that particle size is a key factor
controlling settlement times, with larger sand-sized particles (>2mm) in runoff settling out almost
immediately while clay sized fractions (<2μm) in runoff will stay in suspension for much longer.
Consequently it was important that tanks were thoroughly stirred prior to sub-samples of runoff
being taken for analysis for sediment and P contents (see later). For this same reason it was also
very important to avoid the tanks from over-topping as this would create a decanting effect which
would artificially increase the sediment concentration in the sample and hence distort results.
This was one reason for connecting dataloggers to the tipping bucket units, so that in the
unfortunate event that tanks did over-top then at least data would be recorded to relate rainfall to
runoff timing and volume, even if sediment and chemical data may be unreliable due to the
decanting effect. However, to minimise the risk of over-topping occurring at all, a rule-set was
developed as a guide to sampling frequency which prompted a field visit if local rainfall exceeded
4mm/hour in intensity, or reached a total of 30mm in any single 24 hour period.
When an event was identified, based on these sampling criteria, the depth of the total runoff
accumulated in each tank was measured and converted to a volume using a tank depth calibration
(as a QC check on total runoff volume). Care was then taken to ensure complete suspension of
soil particles by agitating the tank contents using a hand-held pump output hose directed at the
bottom of the tank, prior to taking a representative subsample for laboratory analysis. Each tank
was then emptied using an engine-driven pump to prime the equipment ready for the next event.
When totalled over entire individual monitoring events, the total of runoff volumes recorded every
15 minutes by the dataloggers connected to the tipping bucket sample splitters should equate to
those back-calculated from volumes derived from depth measurements taken in the 500L runoff
storage tanks (after the number of open stoppers had been taken into account). This proved to be
a useful QC check, as obvious outliers due to equipment or installation failures could be easily
identified, while more moderate variability due to minor errors (e.g. tipping buckets not being quite
level) could be assessed as background or residual error within analysis of variance.
A comparison of corresponding values from the two methods is shown in Figure 8 for 35
measurements across two contrasting soil textures, one sandy and one a heavier clay loam. This
confirms the validity of this approach, highlighting consistent performance across the two soil
27
types, and illustrating the typical precision possible using such equipment. The strong linear
relationship also serves to validate the derived calibration coefficients.
Figure 8. Relationship between total event-based runoff volume from dataloggers and that back-calculated from depths measured in runoff storage tanks (n=35 events across two sites)
Runoff was collected from individual rainfall events over the winter period. Experimental equipment
took around a week to install and prime following cereal drilling. The effect of over-winter rainfall
events were typically monitored between early November and the end of January in most sites and
years. The exact monitoring periods varied from site to site and year to year, as they were wholly
depended on prevailing weather conditions, soil conditions (which had to be amenable to autumn
spraying in the first place) and cereal drilling dates identified by the host farmers based on the
schedule for their own farming operations. Rainfall “events” which were sampled for analysis were
regarded as periods of time lasting between 1–3 days which generated runoff (in reality, this could
comprise one intense rainfall event, or several low-intensity drizzly events, as either could produce
saturated topsoils and hence surface runoff). Meteorological data, including rainfall (usually hourly
or sub-hourly resolution) was collected from an automated weather station (AWS) installed nearby,
and used to compare with runoff data.
The final experimental design and runoff sampling methodology therefore collected runoff samples
at different sites in different years using 16 sets of gutters, pipes, flow-proportional samplers and
runoff storage tanks per site (Figure 7), with runoff volumes timed and recorded using dataloggers
and with the samples analysed for suspended sediment (<0.45µm), total dissolved phosphorus
(TDP) and total phosphorus (TP) contents based on standard laboratory methods (MAFF, 1986).
Flow from sample depth = 1.02 * flow from loggersR² = 0.96
0
500
1000
1500
2000
2500
3000
3500
0 500 1000 1500 2000 2500 3000 3500
Flo
w c
alcu
late
d fo
rm s
ampl
e de
pths
lit
res
Flow calculated from data loggers litres
28
3.5. Runoff data analysis
Tipping bucket calibrations (described earlier) were applied to runoff data, taking account of the
number of stoppers left open in the sample splitter units, and results were matched to incident
rainfall data to permit calculations of the percentage of rainfall lost as runoff in each individual
event. Laboratory analysis of sediment and P concentrations from runoff samples taken from
individual storage tanks were matched to runoff volumes from each event to calculate event-based
loads of sediment and P which had been lost to the base-of-slope in surface runoff.
Results for runoff and loads were expressed per unit area (e.g. mm or kg/ha) rather than on a per
plot basis, in order to assist with upscaling. Exploratory data analysis was undertaken for
monitored or derived variables on each sampling occasion and also on the cumulative totals
aggregated across the over-winter sampling period using ANOVA in the statistical software
Genstat (VSN International, 2011). The variables analysed included runoff volume as well as the
mass, concentration and loads of suspended sediment, dissolved P and total P contained in
surface runoff. In the few instances where data were skewed, log-transformed data were not used
instead as they did not improve the distribution about the mean. Other variables, such as
wheelslip, fuel use, and soil physics data associated with soil compaction were analysed where
possible using pairwise t-tests, also using Genstat.
3.6. Soil monitoring strategy
3.6.1. Underlying principles
Surface runoff occurs when precipitation rate exceed the infiltration capacity of the soil and soils
become locally saturated. This may be the result of wetting up from beneath (for example, due to a
perched water table building up above a plough pan at 25–30cm depth), or due to rainfall landing
at the soil surface faster than it can infiltrate into the soil surface. In both cases, surface runoff is
promoted by soils becoming compacted either at depth (e.g. due to a plough pan) or in the near-
surface area (e.g. due to heavy machinery traffic). Compaction reduces infiltration into soils, and
hydraulic conductivity within soils. As the volume of air is reduced, this restricts the volume of water
which soils can hold against gravity (i.e. field capacity), the total volume of air-filled pore space (i.e.
porosity), and the proportion of the largest pores which are responsible for transmitting the majority
of drainage water. Loading the soil with vehicle traffic reduces soil porosity and causes soil
compaction which is exacerbated by the weight of vehicles (load); the length of time over which
compaction takes place (duration); the number of traffic events; the extent of shearing that
accompanies the uniaxial load; and the soil conditions at the time of loading (as wetter soils are
structurally weaker and hence more prone to compaction).
29
Measuring surface runoff in this project therefore assesses the effect of the autumn spray event,
which in turn depends on local rainfall conditions in the weeks after spraying. Consequently, if
post-spraying conditions are dry, then monitoring results may show little runoff and fail to
discriminate the effect of tramline mitigation treatments. For this reason, and to help understand
the reason behind any experimental treatment effects on surface runoff, this project also
characterised soil conditions associated with different tramline mitigation methods.
3.6.2. Soil physics measurements: overview
In addition to measuring the impact of tramline mitigation treatment on surface runoff, soil physical
measurements were taken. These measurements varied between sites and years as the project
developed, but typically included:
1) Topsoil bulk density
2) Hydraulic conductivity
3) Wheelslip and fuel use (from tractor cab)
4) Non-destructive methods for characterising soil compaction
The first variable above was assessed using standard methods with bulk density tins. Saturated
hydraulic conductivity was measured in soil cores (see later Electrical Resistivity section for
sampling details) by immersing them in de-ionised water for one week, and the constant head
method described by Bohne (2005) used to determine the saturated hydraulic conductivity (Ks). In
addition, the use of x-ray computer tomography (CT) scanning was investigated to characterise
differences in soil structure and air-filled pore space under contrasting tramline treatments which
may have different soil compaction (see later).
Problematically, both of the first two measurements listed were invasive and/or destructive, and
risk modifying the soil structure and therefore affecting the very variables being measured.
Consequently, this project also considered an additional category of method: alternative
contemporary and novel non-invasive methods for assessing soil compaction (and, by inference,
surface roughness). A detailed literature review of non-invasive methods for assessing soil
compaction was undertaken in this project: findings from this review are reported in Shanahan
(2013) and so are not repeated here.
Following that review, the most promising methods identified for characterising soil surface
roughness (micro-topography) included:
pin meter
electrical resistivity (ER)
30
high resolution photogrammetry
The pin meter and high resolution photogrammetry techniques involved constructing a Digital
Terrain Model (DTM) of tramline wheeling areas under different experimental treatments, and, like
the ER method, were non-destructive. These three methods are considered below. Much of the
information and results related to measurements of electrical resistivity and high resolution
photogrammetry have been reported in Shanahan (2013).
3.6.3. Pin meter method
The pin meter method has been used successfully by researchers including Jester and Klik (2005)
and Botta et al. (2008). This method has the advantage of being non-destructive, but it is relatively
time-consuming and, as noted by Withers et al. (2006), it may not be capable of recording very
shallow wheelings if the spatial resolution is limited.
A bespoke version of this equipment was designed and constructed by ADAS (Figure 9). It
comprised a series of 100 lightweight vertical pins with felt ends, each sited 1cm apart and
suspended in an aluminium frame. The frame was sited across a tramline wheeling in an
experimental treatment area, and the pins were gently lowered onto the soil surface. The height of
each pin was then recorded using an attached digital camera attached to the frame and configured
at a fixed location, field of view and focal length. The resulting set of pin profile depth data were
used to construct a cross-sectional (two-dimensional) slice across the soil surface encompassing a
tramline wheeling. By repeating this process every few centimetres upslope and downslope, it was
possible to create three-dimensional profiles of the soil surface, at a resolution of around ±0.5cm,
which was used to compare the effect of different tramline mitigation treatments.
Figure 9. ADAS staff taking soil surface roughness measurements using the bespoke pin meter unit. The horizontal bar at the top of the unit was attached to a digital camera (out of shot), which recorded the height of individual pins across the tramline.
31
Data characterising the tramline wheeling area which could be derived using this method included:
mean depression depth (potentially useful for defining parameters in runoff models)
total depression area
total depression volume
The first type of derived data is defined as the distance along the soil surface, and is compared to
the distance perpendicular to the soil surface. The ratio of these two values provides a
dimensionless index which characterises the tortuosity of the soil surface. The last three types of
derived data are potentially useful for defining parameters in runoff models.
3.6.4. Electrical resistivity
Geophysical techniques provide an opportunity to investigate the soil subsurface without
disturbance (Allred et al., 2008). This study used electrical resistivity (ER) geophysics to
investigate the potential for reduced compaction along tramlines of Low Ground Pressure (LGP)
determines soil electrical resistivity (the inverse of electrical conductivity) for a 2D space below the
soil surface. ER therefore measures the resistance imparted to current flow through the soil, and is
a geophysical aspect which can be applied to studies of compacted soils. The method uses metal
spikes inserted into the soil, with an electrical current applied to the spikes utilising the principle
that soil water and air space have different electrical conductivity properties compared to solid
mineral soil, and so spatial variations in the volume proportion of these constituents act like the
dielectric in a capacitor. The resulting pattern of return data, derived by inversion modelling, can
reveal zones of the soil where there is reduced electrical resistivity (i.e. increased electrical
conductivity) which may be associated with reduced porosity and increased soil compaction, such
as locations beneath tramline wheelings. However, spatial variations in stoniness, mineralogy
and/or organic matter content can confound such inferences concerning patterns in subsurface soil
compaction.
Details concerning the method as reviewed for this project are contained in Shanahan (2013), so
only a brief summary based on those findings is included here. Corwin and Lesch (2005) reviewed
the use of the ER method in field surveying to further develop precision cultivation, highlighting the
complexity of determining apparent electrical resistivity (ER) due to edaphic, anthropogenic,
biological and meteorological factors, but concluding that the method does have potential in soil
compaction studies. Binley and Kemna (2005) demonstrated the application of Wenner and dipole-
dipole surface electrical imaging configurations of surveying equipment with a square-wave DC
current. At depths between 1m and 5m, the Wenner configurations display better horizontal
32
resolution of resistivity changes over dipole-dipole whereas the dipole-dipole configuration
displayed better vertical resolution. As tramlines are relatively narrow features, a dipole-dipole
survey will best determine variances in soil resistivity under wheelings due to the compressive
effects on porosity (i.e. water content).
Besson et al. (2004) produced 2D maps of soil structure below and around compacted wheelings
when using electrical resistivity imaging. For a sandy loam in northern France the authors
conducted a Wenner survey perpendicular to the travel of a heavy (81.4kN) tractor with rear tyres
of 0.65m width and 200 kPa pressure. Their results show significant reduction in soil electrical
resistivity in the compacted wheeled soil. Besson et al. (2004) conclude that a 3D survey would
determine more detail about soil structure, especially clod distribution, as demonstrated by
Tabbagh et al. (2000) and Séger et al. (2009). Besson et al. (2004) and Séger et al. (2009) only
used a single tyre type, tyre pressure, and axle load, with only one tractor speed with no mention of
number of passes. The authors did not use the dipole-dipole technique as explored by Binley and
Kemna (2005) and Samouëlian et al. (2005) which would improve vertical resolution to soil
structural changes.
Based on this assessment of published literature, electrical conductivity was considered a suitable
method for use in this project. In this project, in autumn 2009, PVC tubes 0.15m in length and
0.065m outer diameter were used to extract cores of wheeled and non-wheeled soil of the tramline
conventional and Very Flexible (VF) treatments. The two cores for each wheeled location were
from the tyre cleats and casing depressions generated by the trailer tyres and a single non-
wheeled soil core was extracted adjacent to the wheeled cores, 0.1–0.2m beyond the wheeling
edge (Figure 10).
Figure 10. Locations of cleat, casing and no-wheel soil core extraction sites (Hattons, 2011)
33
On later inspection of the soil cores, it was found that the Loddington samples were of poor quality,
with many broken or shaken loose during extraction and transport, therefore only Gatley and
Hattons samples were analysed. The soil datum used for the cores was the soil surface in the
unwheeled areas.
The resulting soil cores were measured for electrical conductivity (EC). The cores were saturated
with increasing concentrations of sodium chloride (NaCl) solution (between 0.01 and 0.5M). The
cores were removed from the NaCl solution at each concentration and connected via electrodes
applied to the soil to an Iris Syscal Junior electrical resistivity meter (Iris Instruments, Orleans,
France). Current passing through the soil, or bulk electrical conductivity (ECbulk), is a function of the
saturating solution electrical conductivity (ECsoultion), the porosity (φ) of the cores (determined by
drying) and tortuosity or connectivity of the pores (τ). This is known as Archie’s Law (Archie, 1942):
1
Where m is the cementation index used by Archie for porous sedimentary rocks (1.8–2.0), with 1.2
used for the soils of this study.
In autumn 2010, measurements of apparent electrical resistivity (ρa) of wheeled and non-wheeled
soil was conducted using a Wenner-type mobile array: 4 electrodes, equally spaced at 30cm.
Measurements of soil ρa were made at 1m intervals along 50m lengths of the conventional and VF
tramlines.
In autumn 2011, soil ρa was measured with a mobile 48 electrode array, with 0.02m pins equally
spaced at 0.01m, a total length of 4.7m. The array was laid across the conventional and VF
tramlines at three locations in lower, mid and upper slope sections. Measurement of soil ρa was
achieved with a Syscal Pro resistivity meter (Iris Instruments, Orleans) using a skip-0 sequence of
dipole-dipole measurements. Dipole-dipole measurement was selected for the best signal to noise
ratio for the soil textures and for the best vertical spatial resolution of soil ρa (Binley and Kemna,
2005). Inversion processing then calculated true soil electrical resistivity (ρ) for a 2-D area below
the tramlines.
3.6.5. CT scanning
Sets of soil cores described in the previous Electrical Conductivity section were maintained at the
moisture content at the time of extraction, and placed inside an x-ray computer-tomography (CT)
imager (CT160Xi, X-Tek Systems Ltd., Tring). Analysis of the radiographs was conducted with the
radiographic image analysis software ImageJ (National Institutes of Health, USA). The distribution
34
of grey scale values for the individual radiographs (0=black, 255=white) were analysed. These grey
scale values were converted to values of bulk density using a technique adapted from Bresson and
Moran (1998) by scanning soil cores of a known bulk density and measuring the mean grey scale
value (e.g. 180=1.8g cm-3). Values of bulk density were determined for each of the radiographs at
5mm intervals.
3.6.6. High resolution photogrammetry
This section explores the application of photogrammetry at close-range in the study of the tramline
wheelings. The aim was to improve the accuracy of measurement of soil deformation by heavy
farm traffic at the plot scale using an appropriate non-invasive technique over conventional
techniques available to soil scientists. Photogrammetry, the technique of deriving quantitative
measurements from 2-D imagery, has been successfully used in Earth Sciences for mapping
topography over large scales (e.g. catchments) (Wolf and Dewitt, 2000), and at close range or plot
scale (Chandler, 1999; Heng et al., 2010). In this study, the principles of data acquisition was
adapted for capturing digital images of tramline wheelings across three soil types over areas of
~1 m2 at the field sites, and produce representative models of the surface at a spatial resolution
(<0.003 m).
In November 2010 and 2011 digital photographs were taken of the wheeled soil surfaces at the
three field sites using the Canon EOS 540D SLR camera (Canon Inc., New York) fitted with a
28 mm lens. Images were taken in two overlapping pairs of 60–80% overlap, and with three
replicates per wheeling location (Figure 11). The camera and lens were calibrated using
PhotoModeler (Eos Systems Inc., Vancouver).
Figure 11. Schematic of photogrammetric principles applied to recording overlapping digital images
of a tramline wheeling.
35
Figure 12. The GCP frame set around a wheeling at the Loddington site in autumn 2010.
Twenty-eight ground control points (GCPs) mounted along a 0.7m by 0.6m frame provided ground
co-ordinates for the images, for use in determining the camera orientations by the photogrammetry
software (see below). This GCP frame was laid down on the non-wheeled soil surface and framed
the tramline wheeling within (Figure 12). Two overlapping photographs of the wheeled surface and
GCP frame were taken of the wheeling treatments. The generation of digital terrain models (DTMs)
of the wheeling surfaces was achieved with the use of Erdas photogrammetry software (Leica
Photogrammetry Suite). The distribution of the full soil surface elevation data was analysed with R
statistics (R Foundation).
Each tramline wheeling was photographed at three locations along their length: 10m, 35m, and
60m up-slope from the line of runoff monitoring equipment installed by ADAS. In pairs, overlapping
by 60–80%, the digital photographs showed a single tramline wheeling, with ground-referencing
coordinates. These photographs formed the basis of photogrammetry and 3D models of tramline
wheelings. DTMs were generated with Erdas eATE imaging software. Pin meter measurements
collected by ADAS were used for comparison to the DTMs generated.
In addition to the traditional and novel soil physical methods described here, an alternative
approach to quantifying tyre impressions on soil was investigated using the Moiré technique. This
method and the associated results are reported separately in a manuscript (McKenzie et al.)
currently undergoing peer review with the journal Soil & Tillage Research.
36
4. Results
4.1. Impacts on soil properties
This section includes results from the various experimental methods use to characterise the effect
of tramline management (treatments) on soil physical properties, most notably soil compaction,
surface roughness and hydraulic behaviour.
4.1.1. Tyre imprint characterisation: Pin meter
Results from the pin meter data comprised 100 depth measurements (one from each pin, spaced
1cm apart) on a 1m transect across a tramline wheeling, and these measurements were repeated
every 2cm along the wheeling for a total of 1m, resulting in 5000 individual pin metre
measurements per treatment, captured using a digital camera. Data were too numerous for manual
processing, so images were processed using a bespoke GIS algorithm developed in the project
which analysed images and derived depths for each individual pin relative to a reference datum at
the top of the device frame. Data were divided into “cleat” and “casing” elements based on a
combination of semi-automated and visual analysis of image data. Data were corrected to
reference their datum as the uncompacted cropped soil surface using image reference points.
Resulting data derived from these pin meter measurements included:
Spatial distribution of pin elevation data
Mean depth of tyre imprint: tyre cleat (cm)
Mean depth of tyre imprint: tyre casing (cm)
Standard deviation of tyre imprint depth data (cm)
Area of tyre imprint (cm2)
Volume of tyre imprint (cm3)
The first of these data provide spatial patterns which allowed micro-topographic surfaces to be
visualised: effectively creating a Digital Terrain Model (DTM) on a miniature scale. Figure 13 (top
right) shows an example of such a surface profile image, with central browny-red areas identifying
tyre imprint with areas labelled to aid calculation of surface statistics; hatched blue areas denoting
casing area; and peripheral pale blue and white areas denoting uncompacted (higher elevation)
soil. The remaining variables listed above allowed the control conventional tyre (CT) treatment to
be compared directly against the optimal tyre (VF) treatment at each of the three sites when
treatments were imposed in autumn 2010. Resulting data are shown for mean tyre imprint depth,
tyre imprint area and tyre imprint volume for CT and VF tyres for each of the three sites in Figure
13. Total tyre imprint areas (bottom left plot) ranged from 1000–6000cm2 and therefore
represented 500–3000 individual pin measurements (i.e. one pin every 2cm2).
37
Figure 13. Pin meter data shortly after treatments imposed in autumn 2009. Charts show mean tyre imprint depth (top left with standard error bars), tyre imprint area (bottom left) and tyre imprint volume (bottom right) for cleat and casing tyre elements, showing effect of CT and VF tyre treatments. The top right hand image shows an example surface DTM derived from pin meter data.
Figure 13 (top left plot) shows deeper tyre imprint depths from cleat areas compared to casing
areas (as would be expected), but with a clear pattern for shallower imprints from VF tyre
treatments compared to CT treatments at both the Loddington and Gatley sites. Corresponding
results for the Hattons site appear similar between tyre treatments, which reflects the different soil
texture (loamy sand) which although it is friable and prone to detachment and erosion, the solid
sand particles mean it is less prone to compaction per se. The associated tyre imprint area results
(bottom left plot) reveal smaller compacted tyre imprint areas from the VF tyres compared to the
CT tyres at all three sites. The corresponding tyre imprint volume results (bottom right plot) also
show this same pattern but in a more marked fashion, with the VF tyres reducing tyre imprint
volumes by 51.7% (Loddington), 12.7% (Hattons) and 25.4% (Gatley) i.e. the greatest benefit from
the VF tyres in reducing soil compaction was found at the Loddington site. Loddington also had the
greatest potential for mitigation in this season, as it had the largest tyre imprint volume (i.e. the
greatest compaction) across all sites from the control treatment CT tyres, and this reflects the
38
higher clay content at this site which (when moist) renders this soil at relatively greater risk of soil
deformation from pressure such as farm traffic.
4.1.2. Topsoil bulk density
Measurements of bulk density were taken using both standard methods, and also independently
derived from the information from the soil cores taken for the CT scans. The standard method was
applied to topsoil only at all four sites, whereas soil cores for the novel radiographic method were
only collected from the Hattons and Gatley sites. Both sets of data are reported here.
Results using standard methods for bulk density are shown in Figure 14, derived using bulk density
tins (around 23cm deep) with known volumes which were weighed before and after sampling, and
then oven-dried before being re-weighed. Reference values for the cropped area are also shown:
these areas were vegetated, uncompacted and had not received traffic. The bulk density results
show that the optimally-inflated VF tyres resulted in notably less compaction than the conventional
CF tyre treatment (i.e. VF tyres, with bulk density values closer to the reference field values). It is
notable that this effect was consistent in tyre imprints associated with both cleat and casing
elements, and was consistent across all four sites with their contrasting loamy sand, silty clay loam
and clay soil textures. Such results support the conclusion that VF tyres prove effective across all
soil types, given suitable soil moisture conditions at the time they receive farm traffic.
Figure 14. Topsoil bulk density measured using standard methods, for cleat and casing tyre imprint areas for CT and VF tyre treatments at the three sites in autumn 2009. Field values measured in the cropped area which did not receive any spray traffic are also shown. Topsoil stone contents were 5.0% (Hattons), 10.7% (Gatley) and 12.4% (Loddington) by volume.
Whole-profile bulk density values were derived using the novel radiographic measurement for the
Gatley and Hattons cores for cleat, casing and non-wheeled soil of conventional (CT) and VF tyre
39
treatments, and are shown in Figure 15. The 0.005m depth resolution was sufficient to
demonstrate the variation in bulk density through the core depths whilst also considering the
degree of error imposed by the pixel value to bulk density value conversion. This degree of error
can always be expected due to the discrepancy between the physically measured soil properties
and the estimated values from radiographs (Baveye et al., 2010).
Figure 15. Bulk densities for cleat, casing and non-wheeled soil profile cores at Gatley (top) and Hattons (bottom) sites in autumn 2010. Treatment 1 (CT tyres; n=12, except no-wheel n=10) and Treatment 3 (VF tyres; n=12) treatments, at 5mm depth intervals. Error bars represent 2 standard deviations.
40
At Gatley, comparing CT and VF plots (Figure 15) shows, there is some evidence of greater bulk
density values in the near-surface data (i.e. cleat and casing data usually appear higher than the
reference grey no-wheel data under the CT treatment), illustrating the compaction caused by such
traffic, whereas all three data classes often appear to overlap under the VF treatment – illustrating
the reduced (and sometimes negligible) compaction observed under the VF tyres. At Hattons, data
in Figure 15 show similar behaviour to Gatley for the CT tyres, but the effect of the VF tyres is
much more pronounced, with substantially reduced bulk densities found in both cleat and casing
areas.
Although these differences in bulk density were not statistically significant (p>0.05), results for all
soils do show an increase in bulk density with depth: this is most pronounced for the cleat cores at
Gatley and in the casing cores and Hattons. However, at both sites it is clear that the surface of the
no wheel treatment (i.e. the cropped non-tramline area) was also compacted from historic traffic
events – which illustrates graphically that soil compaction can readily persist from one season to
the next unless remedial action is taken to remove it.
The results compare well to the findings of Alakukku (2003), who demonstrated that machine
induced stresses decrease with depth due to increasing soil resistance to deformation, therefore
limiting pressure distributions to the upper soil surface. The bulk density characteristics of the non-
wheeled soil are similar to the findings of Mooney and Morris (2008), where a highly porous (30%)
upper region of a cultivated soil significantly reduced with depth. It was expected that the cleats
would display clearly greater bulk densities compared to the casing bulk densities because of the
greater pressure and deformation they create, and this was observed at Hattons but not at Gatley
probably due to the latter’s stronger soil structure associated with its greater clay content combined
with the drier soil conditions at the time of spraying in this particular season. Such findings support
comments by Alakukku (2003) that the contact area under tyres is the net result of complex
association of stresses between the tyre and soil.
4.1.3. Saturated hydraulic conductivity (Ks)
The results for the measurement of Ks for the wheeled and non-wheeled soil cores from the 2009
field treatments at Gatley and Hattons are given in Table 4. As expected, Analysis of Variance
(ANOVA) showed a significant decrease in Ks from the cores taken from the wheeled treatments
compared to cores from the non-wheeled reference area at both sites. At Gatley, there was
evidence of lower Ks in cores from both cleat and casing areas of tyre imprints under the CT
treatment when compared to the VF treatment, and this difference was statistically significant
41
(p<0.05) in the casing area. At Hattons, there was no significant effect of tyre treatment on Ks in
the casing area, but rather surprisingly, Ks appeared higher under VF tyres compared to CT tyres
in the cleat area (p<0.05). However, as a soil variable, hydraulic conductivity data are notorious for
demonstrating particularly wide spatial variability in their magnitude (Chappell and Ternan, 1997),
partly due to the relatively small soil cores used, and this effect will be exacerbated when sampling
at a sub-field scale. This suggests that such data should be interpreted with caution given their
intrinsically high spatial variability.
Table 4. Mean Ks values for Gatley and Hattons wheeled and non-wheeled soil cores from CT and VF treatments. Different letters identify significant difference (p<0.05); same letters at individual sites indicate no significant difference.
Gatley Ks (mm hr-1) Hattons Ks (mm hr-1)
Treatment Core Mean Std. Dev n Mean Std. Dev n
CT tyres Cleat 40a 47 9 26a 19 9
Casing 24a 31 9 31a 25 9
No wheel 1023b 929 9 200c 133 9
VF tyres Cleat 22a 23 6 92c 52 9
Casing 0.2d 0.7 9 46a 17 9
No wheel 2576b 2411 9 143c 28 9
4.1.4. Electrical resistivity
Winter 2010–11
The winter 2010–11 apparent electrical resistivity (ρa) data for wheeled and non-wheeled soil at the
Gatley, Hattons and Loddington sites are shown in Figure 16. The Loddington soils had the lowest
ρa which was a function of the higher silt and clay content. The highest ρa values were found at the
Hattons site due to the sandy texture. It is clear from Figure 16, that at all sites with no wheel
treatments had a higher ρa at all slope positions, indicating that the method was able to determine
the presence of soil compaction. A degree of variation in ρa was revealed at the field scale, the
cause being a combination of soil moisture, bulk density, and soil textural variability, which was to
be expected from electrical geophysical surveys on cultivated loamy soil (Allred et al., 2008;
Besson et al., 2010). The effect of VF versus CT tyre treatments is less clear, since although at
Gatley and Loddington the VF treatment appeared to yield lower values than for the CT treatment,
when the VF results are compared relative to the no wheel area adjacent to the treatment the
results for the two treatments were rather similar (perhaps indicating the compaction caused by VF
tyres is negligible on such medium and heavier textured soils in drier winters).
42
Linear regression was performed on the results of ρa from the autumn 2010 surveys against
treatment and tramline distance. For the Gatley, Hattons and Loddington soil the results show a
significant decrease (p<0.001) in ρa as a result of traffic, and tramline distance had a significant
effect (p<0.001) on ρa. In summary, soil electrical resistivity significantly reduced when compacted,
and that slope over which the tramline passed also had a significant effect on electrical resistivity
as shown in the plots of ρa for the three sites. Results showed the clear effect of traffic on
uncompacted (no wheel) drilled crop area compared to wheelings receiving spray traffic, but no
effect of VF tyre versus CT tyre could be established.
Figure 16. Apparent electrical resistivity for a) Gatley (top left), b) Hattons (top right) and c) Loddington (bottom) wheeled and non-wheeled soil, November 2010. Soil ρa determined along 50 m transect with a Wenner array and RM4 resistance meter.
43
Winter 2011–12
For the autumn 2011, Figures 17–19 shows ρ data for CT and VF tramlines at Gatley, Hattons and
Loddington, respectively. The plots reveal the spatial distribution of ρ over the tramline wheeling
transects (taken as 0.7m width) and non-wheeled soil to a depth of 0.5m.
Electrical resistivity (ERT) is a measure of how much the soil resists the flow of electricity. This in
turn is a function of its mineralogy, organic matter content, and water content (as water is an
excellent conductor). As ERT is sensitive to water content, it can be useful for inferring the effects
of soil compaction, which compresses soil and reduces the relative volume available for air and
water compared to the volume of solid mass. The Gatley soil’s electrical resistivity (ERT) data
reveal zones of higher ρ relative to the deeper soil at the soil surface which would be the result of
drier, more aggregated soil conditions. Increasing resistivity is apparent between the wheelings of
the Gatley soil. Below the surface a zone of lower ρ is apparent the first 0.3m of the soil, tallying
with the depth of the ploughed horizon. In comparison, soil at depths below 0.3m show higher ρ
which would result from higher pore tortuosity in the denser subsoil, changes in mineralogy, and
cooler temperatures increasing resistivity.
The Hattons soil ERT data (Figure 18) show a higher degree of variability in ρ. Higher values of ρ
are still evident at the surface, though more discontinuous than at Gatley. Lower values of ρ are
found through the ploughed topsoil (Ap soil horizon layer) with a rather abrupt change to higher
values below 0.3m. The patchiness of the results may be a result of the sandy soil at Hattons
providing a poorer electrical conductor to the electrodes compared to the other sites. The signal to
noise ratio was, therefore, lower at the Hattons site.
At Loddington soil ERT data (Figure 19) show high variation in values across the transects.
However, the higher values of ρ observed at the other two sites in not present. Instead, the Ap
horizon has generally lower ρ than the soil below.
In summary, the ERT data in winter 2010–11 was successful in revealing spatial variations in soil
electrical conductivity as a result of farm traffic. The findings support those of Besson et al. (2004)
who reported that wheeled soil retained more rainfall due to reduced drainage and evaporation.
What is apparent is the reduced impact the VF treatment has on ρ at depth, which indicates
relatively better soil drainage and aeration under this treatment compared to the CT treatment.
Time-lapse observations of soil EC during rainfall events and subsequent soil drying would provide
further evidence to corroborate this explanation. Extensive electromagnetic-induction (EMI)
techniques would also allow for further investigation of tramline soil EC at the hillslope and field
scale.
44
CT
VF
Figure 17. Computed electrical resistivity for Gatley under CT (top) and VF (bottom) tyre treatments. Plots a), b) and c) are replicates from 9, 22 and 77m upslope of the runoff collection gutter in the CT treatment; and 5, 56 and 77m upslope of the runoff collection gutter in the VF treatment. Plots describe the electrical resistivity in log10 scale, with true values on the scale bar. The extent of tramline wheelings (0.7m wide) are shown by black arrows and dashed lines.
45
CT
VF
Figure 18. Computed electrical resistivity for Hattons under CT (top) and VF (bottom) tyre treatments. Plots a), b) and c) are replicates from 27, 57 and 77m upslope of the runoff collection gutter in the CT treatment; and 5, 66 and 69m upslope of the runoff collection gutter in the VF treatment. Plots show electrical resistivity in log10 scale, with true values on the scale bar. The extent of tramline wheelings (0.7m wide) are shown by black arrows and dashed lines.
46
CT
VF
Figure 19. Computed electrical resistivity for Loddington CT (top) and VF (bottom) tyre treatments. Plots a), b) and c) are replicates taken from 15 and 37m upslope of the runoff collection gutter in the CT treatment; and 5, 40 and 70m upslope of the runoff collection gutter in the VF treatment. Plots show electrical resistivity in log10 scale, with true values on the scale bar. The extent of tramline wheelings (0.7m wide) are shown by black arrows and dashed lines.
4.1.5. Photogrammetry, derived DTMs & surface roughness indices
The Digital Terrain Models (DTMs) generated from the photographs taken in autumn 2010
provided an accurate representation of the wheelings created by the traffic treatments. Figure 20
shows an example of a DTM for the Hattons CT wheelings, the direction of the chevron marks
indicating the direction down slope. The tyre casings caused less change in soil elevation as
shown by the lighter shades. The spatial resolution of the DTMs had mean accuracy of 0.003m
47
and demonstrates the ability of photogrammetry as a tool for capturing detailed topographic
information relating to soil surfaces in the field. The results compare well to the study of Chandler
(1999) who used photogrammetry at close-range to measure surface roughness change of
cultivated soil as a result of simulated rainfall erosion, and to Jester and Klik (2005) who found that
photogrammetry provides quick data capture for measuring soil surface micro-morphology.
Figure 20. Example DTM developed for the Hattons CT wheeling in 2010 using Erdas eATE. The cleat impressions are darkest, representing approximately 0.06m depth from the soil surface. The field of view is 0.8m.
Data from the DTMs acquired in 2010 provided accurate measurements of soil surface roughness.
A Roughness Index (Jester and Klik, 2005) was calculated for each wheeling DTM by:
3
2 1
The range of Roughness Index (RI) values for the three replicate DTMs at each site is presented in
Table 5. These results reveal that for the Gatley and Loddington DTM area data, VF tyre wheelings
had significantly (p<0.05) higher surface roughness than conventional tyre treatment wheelings.
The DTM area data for Hattons show a significantly rougher surface area (p<0.001) for the
conventional tyre treatment wheelings compared to the VF tyre treatment wheelings.
Visual field observations confirmed that increased RI values for Gatley and Loddington VF tyre
treatment wheelings were due to an increased prevalence of surface aggregates that were
destroyed under the greater compaction resulting from conventional tyre treatment traffic (i.e. by
the passing of the narrower, higher pressured Agribib tyre). The relatively high clay content of the
soils at the Gatley and Loddington sites allow for stable aggregates to form. The high sand content
at the Hattons soil means it does not tend to form stable soil aggregates, and the soil surface
rapidly settles and slumps after deformation from traffic – as a result the treatments did not
contribute to the RI values observed with photogrammetry. The increased surface area of soil
48
under conventional tyre treatments at Hattons therefore indicates increased compaction as a result
of the narrow Agribib tyres fitted to the trailer unit on the conventional tyre treatment.
Table 5. Roughness Indices for Gatley, Hattons and Loddington tramline areas, autumn 2010.
Site Conventional (CT) tyres treatment Correctly-inflated VF tyre treatment
Hattons 0.57–0.90 0.41–0.51
Gatley 0.40–0.47 0.46–0.54
Loddington 0.55–0.79 0.71–s0.97
4.1.6. Wheelslip and Fuel use
Measurements of wheelslip and fuel use were taken from the display on the tractor cab when
treatments were being imposed at the four sites. Typically around 30 readings of wheelslip were
taken while traversing tramlines in the experimental hillslope segment areas when treatments were
imposed in the autumn. Readings were separated for analysis based on slope location derived
from a cross-section analysis of each hillslope conducted using a detailed GPS survey (Figure 21).
Figure 21. Illustration of the relatively planar slope form at the four experimental sites, based on detailed GPS survey. Bottom (B), middle (M) and top (T) of each hillslope segment are identified.
The results of the measurements at the four sites are shown in Figure 22. Wheelslip
measurements typically lay within the manufacturer’s recommended range of 4–12% (Michelin,
pers. comm.) which was consistent with more generic published assessments (Grisso et al., 2006;
Wulfsohn et al., 2009). The experiment’s design allowed the effect of drilling tramlines to be
analysed separately from the effect of tyre treatment. There was no significant effect of whether
49
tramlines were undrilled or drilled on wheelslip from sprayer traffic with either CT or VF tyres, and
so for conciseness, those results are not presented here. In marked contrast, Figure 22 shows that
the VF tyre treatment had significantly lower wheelslip at all hillslope positions at Hattons (p<0.01),
Gatley (p<0.001) and Balruddery (p<0.001), although results were reversed at the clay-rich
Loddington site (p<0.001). However, treatment differences were typically relatively small (<3%).
Figure 22. Summary wheelslip measurement results for CT and VF tyres taken as treatments were imposed. Readings are separated into top, middle and bottom third of the hillslope segment at each site. Statistics are discussed in the text.
Although sites were selected to have as planar a slope form as possible, results provide some
evidence of a positional effect within slopes, with data shown separately for the bottom, middle and
top sections of the hillslope segments (Figure 23). Wheelslip increased as the sprayer moved
upslope at Hattons. At Loddington, the slope angle was similar for both bottom and middle sections
of slope with a noticeable plateau at the top of slope. At Gatley, surface topography indicated the
land had been contour ploughed in the past, leaving an uneven but fairly planar slope angle. As a
result, wheelslip measurements did not show the same pattern between segments of the slope at
this site. In contrast, the Balruddery site was notably steeper in the bottom third of the slope
(Figure 21), and this resulted in wheelslip consistently and significantly (p<0.001) increasing as the
sprayer moved progressively upslope.
However, in spite of the statistically significant effect of tyre treatment, differences were small in
absolute terms (typically varying by <3%) and consistently lay within manufacturer’s recommended
ranges. Fuel use (measured in litres per 100m in the experimental hillslope area) was not
significantly different between the two tyre treatments at all of the four sites. Such measurements
may differ from manufacturer’s estimates and from whole-field values, because (for consistency
50
with treatment imposition) they were measured travelling upslope only on consolidated tramlines
and ignored turning at the end of a sprayer run.
4.1.7. Implications for Crop Yield
This project focused on the management of the uncropped part of cereal fields i.e. the area left
undrilled and used to provide access for field management operations, including spraying, along
tramline wheelings. Consequently, it was not expected that there would be any impact on crop
yield in the main cropped part of the field area.
The only possible effect which was considered was associated with the VF tyres, given their lower
pressure and different sidewall structure compared to conventional control tyres. The much lower
recommended operational pressure for VF tyres is typically half of that used for conventional tyres
i.e. 16-26 psi (100–179 kPa) for CT tyres compared to 6-10 psi (41–69 kPa) for VF tyres in this
project; see Figure 2). This lower pressure used in VF tyres is associated with a wider tyre imprint
and a characteristically larger area of tyre being in contact with the soil. For example, the control
tyre had a width of around 30cm, whereas the optimally-inflated VF tyre had a width of 36cm.
It was postulated that, in theory, traffic with wider tyres used to conduct autumn spraying could
compact the recently-drilled crop rows immediately adjacent to the tramline wheeling. Although this
was very early in the season, and agronomic experience indicates that the crop would recover, it
was necessary to demonstrate that there was no long-term impact of VF tyres on resulting crop
yield. Consequently, on each of the four experimental treatments in Year 1 (winter 2009/10),
measurements were taken of the number of ears, grains per ear, dry grain weight, dry thousand
grain weight (TGW), and green grains in the harvested crop in 2010. These measurements were
taken in six different locations: the centre of the tramline (C), and then in five crop rows (positions
P1 to P5) moving perpendicular to (and out of) the wheeling, progressively into the uncompacted
crop area.
Results from the Hattons site (Figure 23) show a modest compensatory effect in increasing dry
grain weight and the number of cereal ears at locations immediately adjacent to the tramline areas
in both CT and VF tyre treatments. This phenomenon occurs due to the greater incidence of solar
radiation in locations immediately adjacent to tramline wheelings. Most importantly, the results
(Figure 23) confirm the expectation that there was no effect of tyre treatment on any of the cereal
harvest variables which were assessed in the areas spanning the tramline wheeling. Similar data
were found at the other three sites, and so for brevity are not reported here.
51
Figure 23. Harvest statistics, Hattons 2010. Number of ears, dry grain weight, grains per ear and dry thousand grain weight (TGW) in Control and VF tyre treatments at the centre of the tramline (C) and at locations moving perpendicular out into the uncompacted cropped area (P1–P5).
4.2. Impacts on surface runoff, sediment and P loss
This section reports results from experiments monitoring surface runoff and associated losses of
suspended sediment and P from tramline areas on hillslope segments at three sites. Treatments
evaluated at different sites and in different years were summarised in Table 2 in Chapter 3.1.3.
Results are expressed both as mm of runoff (to compare directly to mm of rainfall), and also as
litres of runoff, to illustrate the very large volumes associated with relatively narrow (3m wide)
widths of slope traversing tramline wheelings which have received sprayer traffic. Sediment and P
results are reported both as concentrations, and also as volume-weighted loads which take
account of the different amounts of runoff associated with the losses. These loads are reported as
kg/ha and specifically relate to the monitored hillslope segment areas (i.e. 3m wide x hillslope
length): these loads therefore do not represent losses averaged over the entire field area (as most
of the field will not have tramlines). However, such results can be readily upscaled to whole-field
given (i) reference data showing very little loss from the cropped areas without tramlines – which
do not receive traffic (e.g. Silgram, 2005; Silgram et al., 2010), and (ii) when assumptions
concerning the number of tramlines per field and hillslope length are taken into account. Such
equivalent up-scaled whole-field losses are considered later during field and catchment scale
modelling activities (Chapter 4.3). In the graphs in Section 4.2.1, care should be taken to note the
52
different scales used for different sites and different years, which illustrate losses from control
treatment areas, the efficacy of tramline mitigation treatments, and the mediating effect of site (soil
texture, slope) and weather (experimental year).
4.2.1. Year 1 (winter 2009/10)
In Year 1, treatments included a control treatment with conventional tyres (CT) in tramlines, the
optimal (VF) tyres in tramlines, and the effect of drilling tramlines which then received traffic with
either CT or VF tyres. Over-winter results for surface runoff and sediment measurements are
shown in Figures 24–26, and a commentary with statistical results for each site is included below.
Data from P analyses are not reported due to the laboratory issue identified in Chapter 3.1.1.
Reported losses from all three sites were relatively low in this first experimental monitoring period.
Hattons
There was 125mm of rainfall during the monitored events, and runoff as a percentage of incident
tyres; drilled tramline) and 2.0% (VF tyres; tramline). There was a significant effect of tyre
treatment (i.e. CT tyres compared to VF tyres) on runoff (p<0.01), sediment concentrations
(p=0.05) and sediment loads (p<0.01). In contrast, there was no significant effect (p>0.05) of
drilling tramlines on any variable.
53
Figure 24. Hattons, winter 2009-10. Over-winter total surface runoff (l and mm), mean sediment concentration and total loads for different treatments. Standard errors are shown.
0
100
200
300
400
500
600
700
800
900
CT tyres -tramline
CT tyres -Drilled
tramline
VF tyres -tramline
VF tyres -Drilled
tramline
Runoff (litres)
0
0.2
0.4
0.6
0.8
1
1.2
1.4
CT tyres -tramline
CT tyres -Drilled
tramline
VF tyres -tramline
VF tyres -Drilled
tramline
Runoff (mm)
0
500
1000
1500
2000
2500
3000
3500
CT tyres -tramline
CT tyres -Drilled
tramline
VF tyres -tramline
VF tyres -Drilled
tramline
Sediment concentration (mg/l)
0
5
10
15
20
25
30
35
40
CT tyres -tramline
CT tyres -Drilled
tramline
VF tyres -tramline
VF tyres -Drilled
tramline
Sediment load (kg/ha)
54
Figure 25. Gatley, winter 2009-10. Over-winter total surface runoff (l and mm), mean sediment concentration and total loads for different treatments. Standard errors are shown.
0
50
100
150
200
250
300
350
CT tyre -tramline
CT tyre -Drilled
tramline
VF tyre -tramline
VF tyre -Drilled
tramline
Runoff (litres)
0.00
0.05
0.10
0.15
0.20
0.25
0.30
0.35
0.40
CT tyre -tramline
CT tyre -Drilled
tramline
VF tyre -tramline
VF tyre -Drilled
tramline
Runoff (mm)
0
2000
4000
6000
8000
10000
12000
CT tyre -tramline
CT tyre -Drilled
tramline
VF tyre -tramline
VF tyre -Drilled
tramline
Sediment concentration (mg/l)
0
2
4
6
8
10
CT tyre -tramline
CT tyre -Drilled
tramline
VF tyre -tramline
VF tyre -Drilled
tramline
Sediment load (kg/ha)
55
Figure 26. Loddington, winter 2009-10. Over-winter total surface runoff (l and mm), mean sediment concentration and total loads for different treatments. Standard errors are shown.
0
500
1000
1500
2000
2500
CT tyres -tramline
CT tyres -Drilled
tramline
VF tyres -tramline
VF tyres -Drilled
tramline
Runoff (litres)
0
1
2
3
4
5
6
7
8
CT tyres -tramline
CT tyres -Drilled
tramline
VF tyres -tramline
VF tyres -Drilled
tramline
Runoff (mm)
0
50
100
150
200
250
300
350
CT tyres -tramline
CT tyres -Drilled
tramline
VF tyres -tramline
VF tyres -Drilled
tramline
Sediment concentration (mg/l)
0
2
4
6
8
10
12
14
16
CT tyres -tramline
CT tyres -Drilled
tramline
VF tyres -tramline
VF tyres -Drilled
tramline
Sediment load (kg/ha)
56
4.2.2. Year 2 (Winter 2010/11)
The Year 1 results demonstrated the importance of tramline wheelings as transmission pathways
for surface runoff, sediment and P loss; and dismissed the idea of drilling tramlines as a potential
tramline mitigation option. Year 2 studies explored the potential value of alternative mitigation
option ideas for managing cereal tramlines, including the use of VF tyres (which had showed
promising results in Year 1), as well as novel rotary harrow and surface profiler solutions. Over-
winter results for surface runoff, sediment and P measurements at all four sites are shown in
Figures 27–30, and a commentary with statistical results for each site is included below. Recorded
losses from experimental treatments in this second winter were low at Hattons and Loddington
sites, but were notably much higher at Balruddery and at the more steeply sloping Gatley site.
Hattons
There was 123mm of rainfall during the monitored events, with the greatest runoff, and
concentrations and loads of sediment from the control tyre treatment. Runoff (and consequently
sediment and P losses) were very small compared to those observed at the Gatley site in this
season, and runoff only represented <1% of incident precipitation on all four treatments. All three
concentrations of sediment (p<0.01), TDP (p<0.001) and TP (p=0.001). Consequently, these
tramline management methods also had a significant effect in reducing loads of sediment (p<0.05),
TDP (p<0.01) and TP (p<0.01) lost to the base of the hillslope. The three mitigation methods
reduced over-winter runoff and mean sediment, TDP and TP concentrations by 64–92%, 58–85%,
30–58%, and 44–83%, respectively, compared to the control CT tyre treatment. The comparable
effect of mitigation treatment on loads were reductions of 85–99%, 77–97% and 82–99% for
sediment, TDP and TP, respectively.
58
Figure 27. Hattons winter 2010–11. Over-winter total surface runoff (l and mm), mean sediment concentration and total load, and mean total phosphorus (TP) concentration and total load for different treatments. Standard errors are shown.
0
50
100
150
200
250
300
350
CT tyre VF tyre Harrow Profiler
Runoff (litres)
0.00
0.10
0.20
0.30
0.40
0.50
0.60
CT tyre VF tyre Harrow Profiler
Runoff (mm)
0
20
40
60
80
100
120
CT tyre VF tyre Harrow Profiler
Sediment concentration (mg/l)
0.0
0.1
0.2
0.3
0.4
0.5
CT tyre VF tyre Harrow Profiler
Sediment load (kg/ha)
0.0
0.2
0.4
0.6
0.8
1.0
1.2
CT tyre VF tyre Harrow Profiler
TP concentration (mg/l)
0.000
0.001
0.002
0.003
CT tyre VF tyre Harrow Profiler
TP load (kg/ha)
59
Figure 28. Gatley, winter 2010–11. Over-winter total surface runoff (l and mm), mean sediment concentration and total load, and mean total phosphorus (TP) concentration and total load for different treatments. Standard errors are shown.
0
500
1000
1500
2000
2500
3000
CT tyre VF tyre Harrow Profiler
Runoff (litres)
0123456789
10
CT tyre VF tyre Harrow Profiler
Runoff (mm)
0
2000
4000
6000
8000
10000
12000
CT tyre VF tyre Harrow Profiler
Sediment concentration (mg/l)
0
100
200
300
400
500
600
700
800
CT tyre VF tyre Harrow Profiler
Sediment load (kg/ha)
0123456789
10
CT tyre VF tyre Harrow Profiler
TP concentration (mg/l)
0.0
0.1
0.2
0.3
0.4
0.5
0.6
0.7
0.8
CT tyre VF tyre Harrow Profiler
TP load (kg/ha)
60
Figure 29. Loddington, winter 2010–11. Over-winter total surface runoff (l and mm), mean sediment concentration and total load, and mean total phosphorus (TP) concentration and total load for different treatments. Standard errors are shown. Note scale: sediment and P values were much lower than corresponding Hattons and Gatley data from this winter.
0
100
200
300
400
500
600
CT tyre VF tyre Harrow Profiler
Runoff (litres)
0.0
0.4
0.8
1.2
1.6
2.0
CT tyre VF tyre Harrow Profiler
Runoff (mm)
0
50
100
150
200
250
CT tyre VF tyre Harrow Profiler
Sediment concentration (mg/l)
0.0
0.5
1.0
1.5
2.0
2.5
3.0
3.5
CT tyre VF tyre Harrow Profiler
Sediment load (kg/ha)
0.0
0.2
0.4
0.6
0.8
1.0
1.2
CT tyre VF tyre Harrow Profiler
TP concentration (mg/l)
0.000
0.004
0.008
0.012
0.016
0.020
CT tyre VF tyre Harrow Profiler
TP load (kg/ha)
61
Figure 30. Balruddery, winter 2010–11. Over-winter total surface runoff (l and mm), mean sediment concentration and total load, and mean total phosphorus (TP) concentration and total load for different treatments. Standard errors are shown.
0
2000
4000
6000
8000
CT tyre VF tyre Harrow Profiler
Runoff (litres)
0
4
8
12
16
20
24
CT tyre VF tyre Harrow Profiler
Runoff (mm)
0
2000
4000
6000
8000
CT tyre VF tyre Harrow Profiler
Sediment concentration (mg/l)
0
200
400
600
800
1000
1200
1400
CT tyre VF tyre Harrow Profiler
Sediment load (kg/ha)
0
2
4
6
8
10
12
14
CT tyre VF tyre Harrow Profiler
TP concentration (mg/l)
0.0
0.5
1.0
1.5
2.0
2.5
CT tyre VF tyre Harrow Profiler
TP load (kg/ha)
62
4.2.3. Year 3 (Winter 2011/12)
Year 3 studies incorporated the most promising elements from the tramline mitigation treatments
explored in the earlier years of this project. Treatments therefore focused on gathering further
evidence of the potential mitigation benefits from use of the VF tyres and the rotary harrow unit as
part of the autumn spray operation. These two elements were studied separately, and in
combination to see if there was any additive effect from using both methods simultaneously. Over-
winter results for surface runoff, sediment and P measurements are shown for all four sites in
Figures 31–34, and a commentary with statistical results for each site is included below. Across all
the experimental sites, recorded losses of runoff, sediment and P down tramlines were notably
much higher in this third winter when compared to those reported from the previous two winters.
Hattons
It was a wet winter in 2011–12 with a total of 156mm rainfall recorded during the monitoring period.
This resulted in large volumes of runoff, with over 8000 litres recorded in each of the control CT
treatment areas (each measuring 3m by 100m). There was a highly statistically significant effect of
the use of the VF tyre (p<0.001) and the use of the harrow (p<0.001) in reducing surface runoff.
The percentage of rainfall lost as runoff was 11.5% from the control CT tyre treatment, but this was
substantially reduced under the CF tyre + harrow treatment (0.4%), the VF tyre treatment (7.0%),
and the VF tyre + harrow treatment (0.2%).
Sediment losses in runoff were very high, with mean concentrations of over 7000 mg/l and total
over-winter losses of 1200 kg/ha from the control CT tyre treatment areas. Both the VF tyre and
the rotary harrow proved very effective as mitigation methods. The VF tyre had a highly
significantly and consistent impact in reducing loads of sediment (p<0.001), TDP (p=0.001) and TP
(p<0.001). The harrow treatment had a highly significant and consistent impact in reducing
sediment concentrations (p<0.001) and loads (p<0.001); TDP concentrations (p<0.001) and loads
(p<0.001); and TP concentrations (p<0.001) and loads (p<0.001).
The harrow treatment was responsible for the most notable reduction in losses of both sediment
and P losses, when compared to the VF tyre treatment. The combination of both VF tyre and
harrow mitigation treatments resulted in the largest reduction in both sediment and P loss,
demonstrating that there was a beneficial additive effect of using both mitigation methods together.
Total over-winter loads of sediment and TP from lost down tramline wheelings at this site were very
high, equivalent to 1226kg/ha sediment and 2.93kg/ha of total P from the control CT tyre treatment
area.
63
Gatley
This season was rather wet at Gatley, with 97mm of runoff across 11 rainfall events during the
monitoring period from 23 November 2011 until 30 January 2012. Several of these events occurred
within a few days of each other in mid-November (i.e. 35mm of rainfall fell in the 12–15th November
period alone). This meant that the ground remained at or close to saturation for much of the time,
and consequently the percentage of rainfall lost as runoff was relatively high at 21.0% for the
control treatment CT tyres. However, the mitigation treatments proved effective in substantially
reducing these relative losses (p<0.05), with losses of only 9.5% for the CT tyre + harrow, 11.8%
for the VF tyre, and 10.0% for the VF tyre + harrow treatments, respectively. However, measured
volumes of runoff were very high, with an average of over 6000 litres of runoff recorded from each
of the replicate control treatment areas (each 3m wide by 300m long), which demonstrates that the
mitigation methods appeared capable of reducing runoff even under relatively extreme rainfall
conditions.
There were significantly higher concentrations of sediment (p<0.05) and TP (p<0.01) (but not TDP)
in runoff from the two treatments which included the harrow, but this was not reflected in overall
loads of sediment or TP reaching the base of the hillslope. Total over-winter loads of sediment and
TP lost down tramline wheelings at this site were very high, equivalent to 989kg/ha sediment and
1.23kg/ha of total P from the control CT tyre treatment area.
Lodddington
Only two events in winter 2011/12 had usable data from this site, due to runoff tanks over-topping
during two other events. Total rainfall across the two reported events was 43mm, with 3.8% of
rainfall lost as runoff from the control CT tyre treatment area. The tramline mitigation treatments
proved effective in significantly reducing (p<0.05) this loss to only 0.4% of rainfall (CT tyre +
Harrow), 2.9% of rainfall (VF tyre) and 0.4% of rainfall (VF tyre + Harrow).
As noted at the Hattons site during this same winter (2011/12), the harrow treatment alone
accounted for the largest reduction in runoff (p<0.01), sediment and P loss, rather than the tyre
treatment, although there appeared to be an additive benefit of applying both treatments together.
Consequently, the harrow tramline mitigation treatment had a highly significant effect in reducing
concentrations of sediment (p<0.001), TDP (p<0.05) and TP (p<0.001) in runoff; and in reducing
runoff loads of sediment (p<0.01), TDP (p<0.01) and TP (p<0.01). The VF tyre tramline mitigation
treatment reduced concentrations of sediment (p<0.05) and TP (p<0.07) in runoff; and reduced
loads of sediment and TP (although these effects were not statistically noteworthy).
64
Total over-winter losses of sediment and P were much lower from this sites than those reported for
the other two sites this winter because only two events are reported, but the pattern of loss and the
impact of the tramline mitigation treatments were broadly consistent across all four sites.
Balruddery
There was 92mm of rainfall over two events at the Balruddery site in winter 2011–12. This rain fell
over a period of 41h with a peak intensity of 2mm/h and resulted in a peak runoff rate of 14.5l/min.
Runoff lost as a proportion of this rainfall was 15.7% from the control CT tyre treatment, but only
0.7% from the CT tyre + Harrow treatment, 10.5% from the VF tyre treatment, and 0.15% from the
VF tyre + Harrow treatment areas, respectively.
All three tramline treatments had a beneficial mitigating effect. The harrow significantly reduced
runoff (p<0001), concentrations of sediment (p<0.001), TDP (p<0.001) and TP (p<0.001).
Consequently, mitigation methods had a significant effect in reducing loads of sediment (p<0.001),
TDP (p<0.001) and TP (p<0.001) reaching the base of the hillslope.
The VF tyre treatment also reduced runoff, and concentrations of sediment, TDP and TP, and
consequently reduced loads of sediment, TDP and TP reaching the base of the hillslope, but these
effects were not statistically significant. Results show that by far the greatest benefit in terms of the
mitigation of losses of runoff, sediment and P losses was gained from the use of the rotary harrow,
although there was some small additional additive benefit of using this in conjunction with the VF
tyres. This conclusion is consistent with the comparable results presented from both Hattons and
Loddington from this winter, but not with data from the much wetter and steeper Gatley site.
65
Figure 31. Hattons, winter 2011–12. Over-winter total surface runoff (l and mm), mean sediment concentration and total load, and mean total phosphorus (TP) concentration and total load for different treatments. Standard errors are shown.
0
2000
4000
6000
8000
CT tyre CT tyre +Harrow
VF tyre VF tyre +Harrow
Runoff (litres)
0
2
4
6
8
10
12
14
CT tyre CT tyre +Harrow
VF tyre VF tyre +Harrow
Runoff (mm)
0
2000
4000
6000
8000
CT tyre CT tyre +Harrow
VF tyre VF tyre +Harrow
Sediment concentration (mg/l)
0
200
400
600
800
1000
1200
CT tyre CT tyre +Harrow
VF tyre VF tyre +Harrow
Sediment load (kg/ha)
0
4
8
12
16
20
CT tyre CT tyre +Harrow
VF tyre VF tyre +Harrow
TP concentration (mg/l)
0.0
0.5
1.0
1.5
2.0
2.5
3.0
3.5
CT tyre CT tyre +Harrow
VF tyre VF tyre +Harrow
TP load (kg/ha)
66
Figure 32. Gatley, winter 2011–12. Over-winter total surface runoff (l and mm), mean sediment concentration and total load, and mean total phosphorus (TP) concentration and total load for different treatments. Standard errors are shown.
0
4000
8000
12000
16000
20000
CT tyre CT tyre +Harrow
VF tyre VF tyre +Harrow
Runoff (litres)
0
5
10
15
20
25
CT tyre CT tyre +Harrow
VF tyre VF tyre +Harrow
Runoff (mm)
0
2000
4000
6000
8000
CT tyre CT tyre +Harrow
VF tyre VF tyre +Harrow
Sediment concentration (mg/l)
0
200
400
600
800
1000
1200
CT tyre CT tyre +Harrow
VF tyre VF tyre +Harrow
Sediment load (kg/ha)
0.0
2.0
4.0
6.0
8.0
10.0
12.0
CT tyre CT tyre +Harrow
VF tyre VF tyre +Harrow
TP concentration (mg/l)
0.0
0.2
0.4
0.6
0.8
1.0
1.2
1.4
1.6
CT tyre CT tyre +Harrow
VF tyre VF tyre +Harrow
TP load (kg/ha)
67
Figure 33. Loddington, winter 2011–12 (only 2 events). Over-winter total surface runoff (l and mm), mean sediment concentration and total load, and mean total phosphorus (TP) concentration and total load for different treatments. Standard errors are shown.
0
100
200
300
400
500
CT tyre CT tyre +Harrow
VF tyre VF tyre +Harrow
Runoff (litres)
0.0
0.5
1.0
1.5
2.0
2.5
CT tyre CT tyre +Harrow
VF tyre VF tyre +Harrow
Runoff (mm)
0
200
400
600
800
1000
1200
1400
1600
1800
2000
CT tyre CT tyre +Harrow
VF tyre VF tyre +Harrow
Sediment concentration (mg/l)
0
5
10
15
20
25
30
35
40
CT tyre CT tyre +Harrow
VF tyre VF tyre +Harrow
Sediment load (kg/ha)
0.0
0.4
0.8
1.2
1.6
2.0
CT tyre CT tyre +Harrow
VF tyre VF tyre +Harrow
TP concentration (mg/l)
0.00
0.01
0.02
0.03
0.04
0.05
CT tyre CT tyre +Harrow
VF tyre VF tyre +Harrow
TP load (kg/ha)
68
Figure 34. Balrudddery, winter 2011–12. Over-winter total surface runoff (l and mm), mean sediment concentration and total load, and mean total phosphorus (TP) concentration and total load for different treatments. Standard errors are shown.
0
1000
2000
3000
4000
5000
6000
CT tyre CT tyre +Harrow
VF tyre VF tyre +Harrow
Runoff (litres)
0
4
8
12
16
20
CT tyre CT tyre +Harrow
VF tyre VF tyre +Harrow
Runoff (mm)
0
200
400
600
800
1000
1200
CT tyre CT tyre +Harrow
VF tyre VF tyre +Harrow
Sediment concentration (mg/l)
0
200
400
600
800
1000
1200
CT tyre CT tyre +Harrow
VF tyre VF tyre +Harrow
Sediment load (kg/ha)
0.0
0.5
1.0
1.5
2.0
2.5
3.0
3.5
CT tyre CT tyre +Harrow
VF tyre VF tyre +Harrow
TP concentration (mg/l)
0.0
0.5
1.0
1.5
2.0
2.5
3.0
CT tyre CT tyre +Harrow
VF tyre VF tyre +Harrow
TP load (kg/ha)
69
4.2.4. Year 4 (Winter 2012/13)
Year 4 monitoring involved a repeat of the Year 1 treatments. However, unfortunately the Gatley
site was not available for this year of the study. In addition, the weather at the Loddington site was
so wet throughout the entire autumn period that this heavy clay soil remained saturated throughout
November, and the farm manager decided that this field (together with half of the rest of the cereal
crop area) was unsuitable for crop spraying throughout this period (it was sprayed in the spring
instead). Indeed only half of the farm area due for drilling in autumn 2012 was actually drilled on
this clay site, due to this persistent wet weather, and the crop failed in half of the area which was
drilled, requiring re-drilling in spring.
Consequently, only results for the Hattons and Balruddery sites are presented here. Over-winter
results for surface runoff, sediment and P measurements are shown in Figures 35–36, and a
commentary is included below.
Hattons
Crop drilling was possible at this site given its much lighter, better-drained soil texture compared to
the other two sites in England. Nonetheless, it was a particularly and abnormally wet winter with
313mm rainfall, and, as a result, the Hattons field remained close to, or at, saturation throughout
much of the monitoring period. This resulted in the runoff tanks over-topping during many events,
rendering the chemistry data unusable due to a decanting effect. A perched water table also
occurred periodically above the plough pan which also limited the collection of useable field data.
Consequently, results are presented for events 1 and 2 only (out of a total of 17 events), as these
were the only events for which complete runoff and chemistry data were all available for all four
replicates of all four treatments. Over events 1 and 2, a total of 32.4mm rainfall fell over 30.7h.
During those storms, rainfall intensity peaked at 8mm/h, and surface runoff peaked at 34.5 l/min in
tanks collecting runoff from the monitored 3m wide x 200m long tramlines. Runoff represented
31.4% of incident rainfall from the control CT treatment and 28.2% from the CT tyre + Drilled
tramline treatment, but was reduced to only 16.3% and 19.1% of rainfall from the VF tyre and VF
tyre + Drilled tramline treatments respectively.
There was evidence of a treatment effect with the VF tyre treatment tending to reduce surface
runoff (p=0.07) and sediment loads (p=0.05), as well as a pattern for reduced loads of TDP and TP
(although these results were not statistically noteworthy). In contrast, there was no effect of the
drilled tramline treatment on surface runoff, although there did appear to be an effect in reducing
70
concentrations of sediment (p=0.06) and TP (p<0.05), but due to the lack of any effect on runoff
volumes there was no effect of drilling tramlines on loads of sediment, TDP or TP lost in runoff.
This demonstrates that controlling the volumes of surface runoff lost from fields is the most
important objective, as this is the vector responsible for transporting sediment and P to edge of
field (and ultimately losses to water courses). Only tramline management methods which reduce
soil compaction and/or reduce runoff and encourage surface infiltration will therefore be effective
management tools for this purpose.
Although chemistry data for other events were not available, the logger data for surface runoff
meant it was possible to calculate total over-winter runoff for all treatment replicates over the entire
very wet period spanning 17 events from 19 November 2012 to 14 February 2013 inclusive. Total
over-winter runoff during this period was 85.4mm (CT tyre treatment), 97.9mm (CT tyre + Drilled
tramline), 60.7mm (VF tyre) and 67.4mm (VF tyre + Drilled tramline). Expressed as a percentage
of the 313mm of rainfall which fell during the whole winter period, runoff losses were therefore
27.3% for the control CT tyre treatment, 31.3% for the CT tyre + Drilled tramline treatment, but only
19.4% for the VF tyre treatment and 21.6% for the VF tyre + Drilled tramline treatment.
Such results highlight the very high volumes of runoff which can occur over a full three month
winter period from relatively narrow (3m wide) areas spanning a single pair of tramline wheelings.
Total over-winter hillslope losses at Hattons were measured as 51225 litres (CF tyre), 58718 litres
(CF tyre + Drilled tramline), 36448 litres (VF tyre) and 40467 litres (VF tyre + drilled tramline). Such
very large volumes of runoff, which are channelled into very narrow, compacted, concave-shaped
and unvegetated area on a hillslope, will clearly have considerable erosive potential and the ability
to transport large loads of sediment and P (and other surface-applied plant protection pollutants) to
the base of the hillslope and into any adjacent water course.
When totalled over the entire winter period, this pattern of runoff loss between treatments appears
broadly comparable to that shown in Figure 35 for events 1+2 alone, with less surface runoff
measured where the VF tyre treatment was used rather than the control CT tyre treatment, but with
no significant effect of drilling tramlines on surface runoff. These results from winter 2012–13,
although relatively limited, do nonetheless corroborate the earlier findings from Year 1 (winter
2009–10) of this study. The fact that, unlike the VF tyre treatment, the use of drilled tramlines did
not consistently reduce runoff losses in either of these two project years means that this cannot be
considered a practical method for mitigating erosion risk and associated losses in commercial
cereal crops on shallow or moderate slopes.
71
Balruddery
In winter 2012–13, treatments at Balruddery were different from the Hattons site, and compared
the control CT tyre against the CT tyre with a drilled tramline, the VF tyre with a drilled tramline,
and the CT tyre with the rotary harrow. Combined results from events 2, 3, 5 and 9 are reported
here, as results from other events were confounded by tanks over-topping, frozen soils, or a
localised perched water table causing runoff tanks to become dislodged.
There was 40mm rainfall over these events, which resulted in a peak runoff rate of 18 l/min
associated with the replicate 3m wide x 100m hillslope segments which traversed a pair of tramline
wheelings. Mean runoff expressed as a percentage of rainfall was 23.8% under the control CT tyre
treatment and 19.3% under the CT tyre + drilled tramline treatment, but only 6.8% under the VF
tyre + drilled tramline treatment, and 3.5% under the CF tyre + harrow treatment. Runoff volumes
were therefore substantial – with nearly 3000 litres lost from the control CT tyre treatment.
Runoff results indicate that the VF tyre treatment had a statistically significant effect (p<0.05) in
reducing surface runoff, concentrations of sediment and TP, and loads of sediment, TDP and TP.
The combination of VF tyres + drilled tramlines substantially reduced (p<0.05) surface runoff and
associated concentrations and loads of sediment and TP, whereas the drilled tramlines alone had
a much more marginal effect. This evidence suggests that the vast majority of any benefit in
reducing these losses was associated with using the VF tyres during spraying rather than drilling
the tramlines beforehand. It was the rotary harrow alone (i.e. using conventional tyres) which
proved the most effective of all three mitigation treatments, having a highly significant impact
(p<0.05) in reducing runoff and loads of sediment, TDP and TP.
These results from winter 2012–13 corroborate the findings from Year 1 (winter 2009–10) of the
study regarding the absence of any significant benefit from drilling tramlines and the results from
earlier years demonstrating the benefit of both the VF tyre and rotary harrow mitigation treatments,
in reducing runoff, sediment and P losses from compacted tramline areas.
72
Figure 35. Hattons, winter 2012–13. Event 1+2 results. Over-winter total surface runoff (l and mm), mean sediment concentration and total load, and mean total phosphorus (TP) concentration and total load for different treatments. Standard errors are shown.
0
2000
4000
6000
8000
CT tyre CT tyre +Drilled
tramline
VF tyre VF tyre +Drilled
tramline
Runoff (litres)
0
2
4
6
8
10
12
14
CT tyre CT tyre +Drilled
tramline
VF tyre VF tyre +Drilled
tramline
Runoff (mm)
0
1000
2000
3000
4000
CT tyre CT tyre +Drilled
tramline
VF tyre VF tyre +Drilled
tramline
Sediment concentration (mg/l)
0
100
200
300
400
500
600
CT tyre CT tyre +Drilled
tramline
VF tyre VF tyre +Drilled
tramline
Sediment load (kg/ha)
0
5
10
15
20
25
30
CT tyre CT tyre +Drilled
tramline
VF tyre VF tyre +Drilled
tramline
TP concentration (mg/l)
0.0
0.5
1.0
1.5
2.0
2.5
3.0
3.5
4.0
CT tyre CT tyre +Drilled
tramline
VF tyre VF tyre +Drilled
tramline
TP load (kg/ha)
73
Figure 36. Balruddery, winter 2012–13. Over-winter total surface runoff (l and mm), mean sediment concentration and total load, and mean total phosphorus (TP) concentration and total load for different treatments. Standard errors are shown.
0
1000
2000
3000
4000
CT tyre CT tyre +Drilled
tramline
VF tyre +Drilled
tramline
CT tyre +Harrow
Runoff (litres)
0
4
8
12
CT tyre CT tyre +Drilled
tramline
VF tyre +Drilled
tramline
CT tyre +Harrow
Runoff (mm)
0
500
1000
1500
2000
2500
3000
CT tyre CT tyre +Drilled
tramline
VF tyre +Drilled
tramline
CT tyre +Harrow
Sediment concentration (mg/l)
0
50
100
150
200
250
CT tyre CT tyre +Drilled
tramline
VF tyre +Drilled
tramline
CT tyre +Harrow
Sediment load (kg/ha)
0
2
4
6
8
10
CT tyre CT tyre +Drilled
tramline
VF tyre +Drilled
tramline
CT tyre +Harrow
TP concentration (mg/l)
0.0
0.3
0.6
0.9
CT tyre CT tyre +Drilled
tramline
VF tyre +Drilled
tramline
CT tyre +Harrow
TP load (kg/ha)
74
4.3. Field and Catchment Modelling
4.3.1. Approach
Experimental results, although focused on relatively large hillslope-scale segments, were
nonetheless limited to a small number of field sites with their particular slope angles, soil types and
locations. In order to generalise results in terms of their impact on surface water quality, it was
necessary to apply field and catchment scale models. Such models have been specifically
developed for assessing the impact of land management options at a variety of scales, with
functions and parameters derived from field experimental data. Within the UK, ADAS in particular
has been at the forefront of the development and application of such models for policy support for
central and regional government, government agencies, and private sector organisations such as
water companies, driven by EU legislation including the Water Framework Directive, Nitrates
Directive and Habitats Directive. A particular body of ADAS work has focused on developing,
testing and applying models to assess the impacts of land management on water quality to inform
Defra’s implementation, evaluation and reporting associated with agri-environment schemes and
the location and rules implemented in Nitrate Vulnerable Zones (e.g. Lord et al., 2007; Hodgkinson
et al., 2013).
The Phosphorus and Sediment Yield Characterisation in Catchments (PSYCHIC) decision support
tool was developed to enable catchment stakeholders to target options to mitigate suspended
sediment and phosphorus loss within catchments (Collins et al., 2007; Davison et al., 2008;
Stromqvist et al., 2008; Collins and Anthony, 2008; Collins et al., 2009a,b). It has since been
incorporated into the updated ADAS Pollutant Transfer (APT) pressure modelling tool which was
successfully applied in Defra project WQ0128 (Collins et al., 2012), to assess the potential impacts
of delaying tramline establishment at national scale. More recently, its estimation of sediment, total
phosphorus, and nitrate loadings have been used to evaluate the agricultural contribution for a
cross-sector screening work in Defra project WQ0223 (as detailed in Zhang et al., 2014). As a
result, APT was considered to be the natural successor of PSYCHIC and selected as the pressure
modelling tool for use in this project.
Compared with the PSYCHIC model, APT operates at a daily time step and has a common
hydrology module for all pollutants being simulated. It can be run at either field or catchment scale.
One significant change of the modelling approach is the adoption of Soil Conservation Service
(SCS) curve number approach (USDA-SCS, 1972) for the estimation of surface runoff (Q):
25425400
CN
S
SIR
IRQ
a
a
2
75
where R is rainfall amount, Ia is initial abstraction accounting for vegetation interception, surface
depression and similar, S is the water storage capacity in soil and CN is a soil type and
hydrological condition specific curve number. Similar approaches have already been implemented
in other existing water quality models, such as Generalised Watershed Loading Function (GWLF)
(Haith et al., 1987), Agricultural Non-Point Source Pollution model (AGNPS) (Young et al. 1989)
and Soil and Water Assessment Tool (SWAT) model (Neitsch et al., 2011). While tramline
presence and their disruption will have impacts on both Ia and S, the most significant change will be
to the latter.
The Soil Conservation Service (SCS) runoff curve-number (CN) approach was chosen for the
representation of tramlines and their mitigation in pressure modelling. The SCS CN approach is an
empirical model that describes runoff as a function of total rainfall and a potential maximum
storage parameter. The approach predicts total storm response runoff, which may include surface
and sub-surface flow paths. The storage parameter reflects infiltration and ponding capacity. This
approach has obvious advantages including fewer parameters for calibration, flexibility of using
observed daily weather data and the ability to produce more temporally comparable flow and
pollutant estimates for comparison with monitored results which are generally daily or event-based.
The limitation of the daily timestep approach is that it does not represent the influence of changes
in rain intensity at the sub-daily temporal scale, for example rain events that would be shown in 15
minute rainfall monitoring.
In this project, experimental assessments of the effect of different tramline management methods
on surface runoff, sediment and P loss were up-scaled to infer the potential impacts at (i) whole-
field and (ii) sub-catchment scale. This involved:
Calibrating the updated APT pressure model to represent the effect of tramlines at hillslope-
segment scale (based on experimental monitoring data)
Developing novel functions to represent the impacts of the different tramline mitigation methods
at hillslope-segment scale (based on experimental monitoring data)
Up-scaling impacts of different tramline management methods to whole-field scale
Up-scaling impacts of different tramline management methods to sub-catchment scale for three
exemplar catchments.
4.3.2. Representation of tramlines in APT modelling framework
Tramlines are represented as an explicit source area in the APT modelling framework. They are
parameterised in the model framework using the following properties:
Tramline presence (true / false)
76
Tramline spacing
Establishment date
Tramline length
Adjustment to water storage capacity (S) relative to the cropped area of the field
Adjustment to soil cohesion modifier (m) relative to the cropped area of the field
To derive representative parameter values for different soil types being considered, monitored
runoff and pollutant data from control plots (i.e. those without mitigation measures) were used to
calibrate the water storage capacity and soil cohesion parameters in the tramline area relative to
the cropped area during the monitored periods. This is an adjustment to the default APT
parameters used previously, and allows the model to replicate better the pollutant losses and
measured impacts observed in field experiments.
Site-specific data were used from the monitored sites, including continuous daily rainfall, field and
date). Using separate water storage capacity settings and water balances, daily surface runoff from
both the tramline and cropped area were defined, and then combined, to calculate an overall flow
depth for the monitored area. The water storage capacity in the tramline area (relative to the
cropped areas) was optimised to match the total flow depths calculated from multiple control plots.
As an example, comparison of simulated and measured runoff for two reference sites (Figure 37)
shows that simulated daily flow depths were significantly correlated to measured daily runoff flow
depths. Across all calibration sites, the associated correlation coefficient varied from 0.794 to 0.823
and was notably stronger under conditions with relatively high runoff. A summary of calibration
across multiple sites and multiple years suggests that the water storage capacity (S) in the tramline
area relative to the cropped area for different soil types varies from 0.60 to 0.89 for clay soils and
from 0.09 to 0.27 for sandy soils.
Figure 37. Calibrated modelled daily surface runoff plotted against measured daily surface runoff from tramlines in control plots at two field sites.
77
4.3.3. Representation of tramline management options in APT modelling framework
The implementation of the experimental mitigation measures, including optimally-inflated Very
Flexible (VF) tyres on spraying equipment used in the autumn, attaching a self-propelled rotary
harrow device to the rear of the sprayer in the autumn, and the Creyke surface profiler/roller unit,
were expected to alter the hydrological response and pollutant loadings from tramline areas. To
quantify treatment effects on runoff generation and pollutant delivery in the APT modelling
framework, the same calibration procedures were undertaken to estimate the water storage
capacity (S) in tramline areas relative to cropped areas with and without mitigation using the
assembled datasets from treatment plots where different mitigation options were systematically
trialled. The calibrated values for different soil types and mitigation options are shown in Table 6.
Table 6. Impact of mitigation treatment on water storage capacity in tramline wheelings, expressed relative to that in the cropped area Soil type Optimally inflated VF Tyre Rotary Harrow Roller*
Medium/Heavy 0.73 0.91 0.79
Light 0.78 0.88
* limited data available for roller mitigation measure
As there were limited experimental data available, no satisfactory calibration were achieved on the
use of the roller. Therefore, its effects were not implemented in the APT modelling framework and
their impacts at catchment scale were not assessed.
Considering the inevitably short temporal scale and limited weather conditions associated with the
monitoring periods, attempts were made to assess the broader potential impacts of tramline
mitigation in reducing surface runoff amounts under future climate change scenarios. Assuming the
“medium” emissions level scenario in the UKCP09 climate change projections (Murphy et al.
2009), a distribution of daily weather predictions for 2050 at the monitored sites were generated
and used as inputs into the APT model.
Model outputs including the use of the rotary harrow suggest that this mitigation method will reduce
the annual total runoff during the over-winter monitoring period by at least 20% in future 2050
scenario weather conditions at the Hattons site. The climate inputs are a distribution of simulated
years, the effects in the wet years (wettest 10 years) and dry years (driest 10 years) are shown in
Table 7. Results suggest that tramline mitigation will be more effective in relatively drier years,
compared with very wet years. This may appear counterintuitive, but is likely to be because any
mitigation option has a limit on the conditions under which it can operate effectively, and so it is
78
possible that the potential beneficial effects of the rotary harrow unit could be overwhelmed by
extremely persistent wet weather conditions. Nonetheless, under more typical conditions, the
overall mitigation impact of the rotary harrow is impressive and, considering the lower and upper
quartile predictions, results in an overall reduction in surface runoff to edge of field of 15–56% over
the winter period when compared to the control tramline scenario (Table 7).
Table 7. Impact of rotary harrow on total runoff from the whole field area in 2050 using UKCP09 “medium” scenario projection*. Q1 and Q3 refer to lower and upper quartile values, respectively.
Scenario Statistics % Reduction Dry years Median 36 Q1 18 Q3 56 Wet years Median 21 Q1 15 Q3 27
* based on using the rotary harrow unit when autumn spraying compared to control situation with conventional tramlines receiving sprayer traffic at the Hattons site.
To assess the impacts of tramline mitigation on the sediment delivery from the monitored sites,
measured sediment concentrations associated with different mitigation options were analysed.
Sediment concentrations from mitigation plots were compared with corresponding control plots to
estimate the relative change in sediment concentrations measured in runoff. A summary of results
is shown in Table 8 exploring the impact of both the VF tyres and rotary harrow mitigation
measures. A bold font indicates that limited data were used to derive the values.
Table 8. Modelled impact of tramline mitigation measures on sediment concentrations
% of catchment area 35.4 26.2 28.1 1 Standard (1961–1990) Average Annual Rainfall 2 Standard Percentage Runoff (reflecting the importance of flashy surface loss pathways compared to slower subsurface drainage pathways as contributors to river flow hydrographs) 3 Base Flow Index (a hydrological index reflecting the importance of base-flow as a proportion of overall river flow hydrographs) 4 River length divided by the catchment area, which characterises the density of the surface water drainage network. This density defines the relative proximity of fields to water bodies for water quality impacts.
To estimate baseline pollutant loadings and quantify the mitigation impacts associated with
different tramline management options, a large amount of catchment scale input data and
assumptions are required to fully parameterise the model. The following key input data layers and
assumptions were made:
84
Land use based on the ADAS 2010 land use database (derived from Agricultural Census 2010
and mapped to a 1km grid according to the methodology described by Comber et al. (2008))
Daily weather conditions based on daily weather data interpolated using the ADAS Irriguide
model (Bailey and Spackman, 1996; Silgram et al., 2007) and UK Met Office weather station
data from 1990 to 2010.
Soil properties based on National Soils Research Institute (NSRI) NatMap 1000 soils database
Tramline presence: Cereal crops were assumed to have uncropped tramline areas as standard
management practice, with tramline width, spacing and establishment dates as used in the
previous national APT model applications (Collins et al., 2012; Zhang et al., 2014).
Field and crop management practices, including fertiliser and manure application rates and
timings, sowing / ploughing / harvest dates etc. were based on those used in previous national
scale model applications (Collins et al., 2012; Zhang et al., 2014).
Although the APT model generates daily estimates of sediment, dissolved, total phosphorus and
nitrate loads, for simplicity only aggregated annual loads of sediment and total phosphorus are
presented here.
Table 13 shows that in the Rea and Corve sub-catchments, the optimally-inflated VF tyres
(“Optimal”) and rotary harrow (“Harrow”) mitigation measures led to a 7–9% reduction in surface
runoff. In contrast, in the Platt sub-catchment, with its heavier soil texture (Table 12), the impact of
these mitigation methods on surface runoff was large when expressed on a percentage basis
(Table 13). Table 14 shows the modelled average annual sediment loss from fields to adjacent
tributaries of the selected sub-catchments under the control (CT tyre), optimal (VF) tyre and harrow
tramline management scenarios, with results presented both in terms of absolute losses (in
tonnes) and expressed on a mass per unit area basis (kg/ha). The modelled estimates in Tables
13 and 14 predict notable differences in baseline loadings, with the Platt sub-catchment having a
much lower rate of sediment loss, which is likely to be due to its lower average annual rainfall,
generally shallower slopes and lower drainage density which results in less surface runoff
compared to the other two sub-catchments.
Table 13. Percentage reductions in annual surface runoff due to tramline management methods
Rea Corve Platt
Optimal VF tyre
Rotary Harrow
Optimal VF
Rotary Harrow
Optimal VF tyre
Rotary Harrow
Oct-Mar 7 8 7 9 40 43 Annual 8 9 7 9 48 52
85
Table 14. Average annual sediment loss by sub-catchment and tramline management method
Annual Average Sediment Loss (t) Annual Average Sediment Loss (kg/ha) Control CT
tyre Optimal VF
tyre Rotary Harrow
Control CT tyre
Optimal VF tyre
Rotary Harrow
Rea 1736 1464 1436 434 366 359
Corve 1978 1623 1596 335 275 271
Platt 95 60 51 42 26 22
Table 15 re-presents the data in Table 14, but expresses the impacts of mitigation measures in
reducing sediment loss in absolute terms (tonnes mitigated), on a mass per unit area basis (kg/ha
mitigated), and as an overall percentage reduction in sediment loss at sub-catchment scale. It is
noticeable that the specific (absolute) loading reduction and percentage reductions at the sub-
catchment scale were much smaller than those modelled in the field-scale scenarios. This is to be
expected because field scenarios are focused solely on cereal fields, whereas at sub-catchment
scale there are inevitably large areas of the landscape which are not suitable for such mitigation
options to be applied (e.g. due to different cropping, flat fields, other land uses such as woodland,
urban etc.). As these other areas do not benefit from the mitigation method, when averaged over
the entire sub-catchment area the overall mitigation impact appears to be much lower.
Table 15 illustrates that the estimated range of reduction in sediment loss due to the VF tyre and
rotary harrow mitigation methods were broadly similar (15–68kg/ha reduction from VF tyres; 19–
75kg/ha reduction from rotary harrow), and that these benefits equate to reductions in losses of
16–37% (VF tyre) and 17–46% (rotary harrow). The greatest absolute annual reductions of 355–
382t sediment lost from land to adjacent water courses due to tramline mitigation treatments were
modelled in the Corve sub-catchment. Such results illustrate that the efficacy of tramline
management methods at sub-catchment scale is determined by (i) site-specific baseline sediment
loadings (reflecting inherent risk of loss from a particular landscape type due to factors such as
soil, slope, and proximity to watercourses), (ii) the effectiveness of different mitigation methods,
and (iii) land use patterns (i.e. the proportion and location of fields in the landscape where the
mitigation method is applicable).
Table 15. Impact of tramline mitigation method on annual reduction in sediment loss for three sub-catchments
Figure 41. Reduction in Catchment Phosphorus Loss under Optimal VF Tyres treatment (kg/km2)
Figure 42. Reduction in Catchment Phosphorus Loss under Rotary Harrow treatment (kg/km2)
4.3.6. Spatial Targeting of Mitigation Measures
Land management practices which are locally highly-effective at a field-scale, can appear
(potentially misleadingly) to be less effective when viewed at larger sub-catchment scale as a
consequence of averaging efficacy across the entire catchment area. This effect can be acute
even when considering widely-known and highly effective mitigation measures. For example, cover
crops can be used over-winter to conserve unused soil mineral nitrogen which would otherwise be
89
lost via leaching during winter. Although evidence shows they can reduce losses from individual
fields by 50% or more, at a catchment scale their impacts can often be less than 5% purely
because the area of land on which they can be used is limited by crop rotations and soil types
(see, for example, Lord et al., 2007). Such results should not be interpreted as meaning such
mitigation methods are a waste of time – on the contrary they appear highly effective when
correctly spatially-targeted at relevant locations at a sub-catchment scale, and methods such as
those assessed in this project have a potentially important role to play contributing to integrated
management strategies at field, farm and catchment scale.
Spatial targeting of tramline mitigation at national scale would involve the selection of Environment
Agency Water Framework Directive (WFD) water bodies based on the overall ecological status of
receiving water bodies, consideration of site-specific pollutant pressures, non-agricultural
contributions and field-to-river catchment connectivity. Selection of these test catchments as
examples have, to some extent, taken these factors into consideration. Policy-level implementation
could use spatial targeting within the recently-introduced Countryside Stewardship scheme in
England as a starting point to identify potential candidate areas for the targeted mitigation activities
demonstrated in this project.
Tramline mitigation for the reduction of pollutant loading requires capital investment and could
affect the farmer’s field management practices (see Economics chapter). As demonstrated in the
previous section, although highly effective at a local field and farm scale, the mitigation methods
explored in this project have been focused on winter cereal crops only. The VF tyres and rotary
harrow unit do have broader potential applicability at a farm scale on other land uses, but those
were not assessed as part of this project. Consequently, modelled impacts reported here focus
solely on the impact on losses from areas of winter cereals within the broader sub-catchment
landscape, and will tend to under-estimate the actual environmental benefit when such techniques
are applicable to other land uses at sub-catchment scale.
Within a given catchment, there is therefore a need to select specific areas where most cost
effective benefits could be achieved. This has been analysed by examining the effects of
implementing mitigation only in the locations where the localised reduction in pollutant loss is
above threshold values. While the choice of these threshold values should be based on the
magnitude of the pollutant reduction required, a series of speculative values were used here for
demonstration purposes only. They are 10,8,6,4,2,1 tonnes per km2 for sediment and 10,8,6,4,2,1
kg per km2 for phosphorus, respectively.
90
Table 18 shows the impacts for sediment and phosphorus mitigation (O is optimal VF tyre and H is
rotary harrow treatment). Tabulated rows relate to different target areas in the three sub-
catchments: for example, targeting only the areas where a mitigation of 8t/km2 or more of sediment
loss is possible. Data show the percentage of the catchment affected, the percentage of the total
sediment or phosphorus mitigation achieved, and the actual mass of mitigation. Such modelled
scenarios demonstrate that, even by targeting only a relatively limited proportion of the total
catchment area, significant reductions in sediment and phosphorus loss from cereal tramlines to
adjacent watercourses can be achieved.
Table 18. Modelled impacts of optimal VF tyre (O) and rotary harrow (H) tramline mitigation treatments on sediment (top) and phosphorus (bottom) losses from cereal fields to water courses in the three sub-catchments. See text for details.
SEDIMENT % of Catchment Affected % of Total Sediment Mitigation Achieved
Incentives for farmers to implement certain practices are normally given in terms of an assessment
of income foregone due to market failure. The value of income foregone is based on the
assumption that whichever practice is undertaken, it will be a divergence from normal commercial
practice that is likely to result in increased costs or reduced productivity or both. Environmental
Stewardship (Countryside Stewardship in England from April 2015) is an example of a policy
operating along these lines, where farmers can pick from a range of options that provide a given
number of points based on the extent of income foregone for each option. The points go towards
their target number in order for them to claim support payments.
However, tramline management and associated pollution risk mitigation do not fit well into this
conceptual ‘profit foregone’ framework, as the area being managed is not drilled with crop, so there
is no direct profit to forego. However, there are other clear direct benefits (as shown in this study),
which include reduced soil compaction, promoting good soil structure, drainage and improved crop
rooting; retention of valuable nutrients on the field; and avoidance of fines by environmental
agencies for sediment erosion reaching roads and water courses. In addition, a further difficulty is
that any payment per length of tramline treated, or related to the proportion of the field represented
by tramlines, would vary greatly due to the difference in tramline widths (which could range from
12-36m) from farm to farm depending on the equipment used.
Furthermore, on a capital basis, although it would be relatively straightforward to demonstrate that
a machine was on a farm, it may be less easy to demonstrate it had been used in a given field at
the time of autumn spraying. Fortunately, the rotary harrow is intended to be fitted to a sprayer at
the beginning of the season and to be left attached for use when required, and as it does not
require a separate field operation it would be entirely possible for the purchase and use of this
equipment to be considered within a capital cost basis.
101
In the case of tramline disruption, this practice is likely to retain nutrients and sediment on the field
that would otherwise be lost in erosion and runoff. The overall costs of implementing such methods
would comprise:
Capital cost of tyres
Capital cost of tramline disruption technique
Changes to fuel costs
Changes to repair costs
Changes to working time
These changes may lead to additional costs or financial savings (negative costs), for example in
the direct costs of tyres over a period of time, or indirect costs such as savings in fertiliser costs
due to reduced nutrient losses. If manufacturers’ results are correct across a wide range of soil
types and conditions, then savings in tyre costs, fuel use and sub-soiling may be significant.
Hence in the case of tramline disruption techniques, the outcome may be a change to land
management costs rather than income foregone. This may manifest itself over a number of years
in the case of the capital cost of tramline disruption machinery and tyres rather than, for example, a
reduction in fertiliser costs in any given year. The incentive to adopt these practices therefore
appears to be largely a market incentive, although to achieve the benefits of tramline disruption
requires the commitment of capital investment which will be spread over a number of years.
The magnitude of the benefits provided will also depend on the individual season, as follows:
Costs will be the same over a range of seasons regardless of rainfall
The benefit (i.e. reduction in nutrient and sediment losses) will be greater in autumns with moist
soil conditions – very dry autumns would not have notable runoff risk, whereas very wet
autumns would mean soils conditions may be unsuitable to allow autumn spraying.
The collateral benefits suggested by Michelin and Bridgestone (pers. comm. Barry Coleman) –
reduced fuel use, tyre costs and reduced sub-soiling costs – will be seen across the whole farm
each year and will be greater in wet years.
The lack of a specific direct annual short-term benefit for a specific medium-term cost may prove to
be a barrier to adoption for some farmers. Therefore, there may be a case for supporting the
purchase of the equipment to encourage uptake in area of high risk of soil erosion in order to
encourage a wider uptake without support as the benefits of tramline disruption become more
widely appreciated. The next consideration would be settling on a rate of support, which would
need to be high enough to encourage a farmer to buy the machine and/or VF tyres, but not so high
102
that value for public money was deemed to be poor. This may be particularly appropriate in areas
of high risk crops on high risk soils (e.g. potatoes on sloping fields with light sandy and silty soils).
Ensuring that farmers actually use the machine once purchased may be another barrier. In policy
terms, a pragmatic approach would be to see such environmentally friendly activities as a
marketing opportunity for the food industry, perhaps as part of a farm assurance scheme.
4.4.4. Catchment scale outcomes
This activity up-scales the public benefits of tramline disruption to a sub-catchment level, based on
the Platt, Rea and Corve sub-catchments considered in the modelling work (Chapter 4.3).
The cost/benefit of tramline disruption in each of these three catchment areas is the product of
cost-effectiveness per hectare of treatment multiplied by the size of the catchment (Table 27). For
simplicity, an average figure was used to allow for the two brands of rotary harrow and the two
hypothetical farm implementation sizes. For the tyres, the difference between the two approaches
on a capital cost basis was close to zero. Since the lifetime of each type of tyre was not tested in
this project, this was not taken into account in the figures presented in Table 27.
Table 27. Catchment-scale costs/benefits of rotary harrow and VF tyre tramline mitigation methods
Platt Rea Corve Catchment area km2 25.05 42.79 64.36 Average slope 1.3o 3.7o 4.7o Dominant Soil Type Silty loam Loamy sand Silty loam Area treated @ 20% of catchment (ha) 501 855 1,287 Rotary harrow Average cost (£/ha) 17.14 17.14 17.14 Cost of treatment per catchment (£) 8587 14668 22062 Benefit of reduction in P & sediment loss
P (£/ha) 1.28 1.80 1.28 Sediment (£/ha) 5.80 22.91 19.85 Total benefit (£/ha) 7.09 24.71 21.14 Net benefit (£/catchment) 4209 22128 12420
VF tyres Saving (£/ha) 0.03 0.03 0.03 Saving of treatment per catchment (£) 626 1,070 1,609 Benefit of reduction in P & sediment loss
P (£/ha) 1.28 1.54 1.28 Sediment (£/ha) 4.58 20.77 18.33 Total benefit (£/ha) 5.87 22.31 19.61 Net benefit (£/catchment) 2955 19121 25284
103
Total benefits in pollutant reduction per hectare were similar from the use of both the harrow and
VF tyres, although the costs of the treatments were very different from a mean of £17.14/ha for the
harrow to a saving of £0.03/ha for the tyres. This small saving is, however, a somewhat artificial
figure, since whilst it is assumed here that the harrow will only be used on 20% of the catchment
area, the tyres are unlikely to be changed between operations and will be used over the whole
farm. However, to make ‘fair’ comparison, the savings have been applied to only the 20% likely to
benefit from the harrow. Note the £0.25/h saving for the VF tyres is per hour, and the rate used
above is per hectare assuming an average work rate of 12ha/h.
4.4.5. Policy impacts
This section explores the potential policy impacts of incorporating tramline disruption into existing
policy instruments, such as Defra’s new Countryside Stewardship scheme. The above sections
highlight three major issues for policy formulation:
(i) Policy is normally based on income foregone and in this instance there is no evidence that
farm incomes would be reduced by using tramline disruption machinery and VF tyres. It is
more likely that farmers will enhance their income, although there would be the initial capital
outlay for both tramline disruption techniques and the VF tyres.
(ii) There may be an issue with the capital nature of the investment required to carry out
tramline disruption. Farmers would need to commit a significant amount of capital to
implement tramline disruption methods. Similar support has been given through the
Catchment Sensitive Farming Capital Grant Scheme for a range of interventions aimed at
reducing diffuse pollution.
(iii) The magnitude of losses of phosphate and sediment avoided by tramline disruption is
variable subject to the soil type, slope and volume and intensity of rainfall, and is therefore
variable from close to zero on low risk locations up to environmentally significant figures.
These factors add up to a significant challenge as:
There is no apparent market failure to address
A proportion of farmers may consider the capital outlay unjustified on its own for potentially
zero or uncertain returns.
On the one hand, without a market failure, there is no justification for support whilst on the other,
farmers may be reluctant to invest with such an uncertain return. However, if this remains the case,
it does nothing to address the fact that the great majority of losses from arable land are due to
losses as runoff down tramline wheelings. However, as the rotary harrow has demonstrated it is
highly effective but requires capital investment, and (unlike the VF tyres) is specifically focused on
104
mitigating the risk of compaction and runoff, erosion and diffuse pollution from tramlines, Defra
have recently included a partial capital grant in a spatially targeted element of the Higher Tier
section of the new Countryside Stewardship (CS) scheme which launched in spring 2015. This will
provide a capital sum to support the cost of tramline disruption techniques. That decision was
directly facilitated by the outputs from this project, which were summarised in a policy document to
Natural England in 2013–14, at their request, for consideration when the details of the new CS
scheme were being formulated.
In the document ‘Estimating Damage Costs for Major English Water Pollutants’ (Defra, 2012b), the
damage from agricultural diffuse pollution is assessed in terms of the following categories:
Drinking water quality (surface and groundwater)
Improved river water quality (amenity)
Improved fishing
Freshwater and marine eutrophication
Bathing water quality
Ecosystems, natural habitat impacts – rivers and wetlands
The cost of this pollution is given in Table 28.
Table 28. Damage cost for major English water pollutants (Defra, 2012b)
£/tonne Minimum Average Maximum Std. Dev Nitrate 121.03 169.87 221.11 20.05 Phosphorus 20,657.89 25,691.14 30,479.32 2,055.77 Sediment 234.63 305.45 376.64 31.18
The values of reductions in losses of both total phosphorus and suspended sediment are shown in
Table 27 assuming applications to 20% of each of the three modelled catchments. In areas where
the losses of sediment and P are relatively high, the cost of the tramline disruption machinery is
more likely to be overcome by the benefit associated with reductions in these P and sediment
losses. Using these estimated farm-scale figures as a guide to proportions, at a catchment scale,
reductions in losses of 0.06 kg/ha of P and 32 kg/ha of sediment would be sufficient to achieve
break-even costs in the case of the rotary harrow and 0.07 kg/ha of P and 66 kg/ha of sediment for
the surface profiler-tine-roller unit.
4.4.6. Summary
In terms of additional costs associated with the tramline disruption techniques, there were capital
costs for purchasing the machines and the additional cost associated with adaptations to the
sprayer during its manufacture. The average net cost of the rotary harrow was £17/ha compared
105
with £35 for the surface profiler unit with roller and tines. These costs would be lower on larger
farms and those with larger areas of land at risk. In terms of operational costs, for carrying out the
work, there was no additional cost for the rotary harrow (since it was mounted on the sprayer and
there was no evidence of any impact on fuel use), but there was a cost of £15/ha for the surface
profiler with roller and tines (since it required an additional field operation).
With regard to tyres, there were two aspects of cost: capital costs associated with purchasing the
VF tyres, and any differences in operational costs as a result of their use. In terms of capital, the
VF tyres were significantly more expensive than conventional tyres, but this calculation does not
account for manufacturer’s data which indicates a significantly longer working life compared with
conventional tyres. On a simple substitution basis, there would be an increase in annual costs
when the capital cost is amortised of £2.40/ha on the example 200 hectare farm. However, by
taking into account the manufacturer’s reported longer life of the VF tyres, then a net saving of
£2.75/ha could be achieved. A third alternative would be if the cost was calculated per hour of use,
in which case the same data suggests an overall net saving in favour of the VF tyres of £0.25/hour.
With regard to operational costs, there were no consistent significant differences in fuel use or
rolling resistance between the control treatment and the two tramline disruption machines or tyres,
and so there were no additional costs associated with these aspects of the field operations. The
major difference between the two tramline disruption machines was therefore the additional pass
required for the tool bar with roller and tines. Any co-benefits associated with reduced fuel use or
sub-soiling operations with the VF tyres were not examined within this project.
106
5. Discussion
5.1. Experimental methods
A combination of traditional methods (e.g. topsoil bulk density, pin meter) and emerging novel
methods (e.g. photogrammetry, electrical resistivity, DTMs) were used in this project to
characterise the soil physical effects associated with alternative approaches to the sustainable
management of tramline wheelings in winter cereals. Application of non-invasive techniques to the
assessment of soil compaction within arable tramlines found that novel photogrammetric methods
were capable of sufficient resolution to generate accurate digital terrain models of the soil surface
beyond the capability of the traditional pin-meter surface profiling; while the use of novel near-
surface electrical resistivity imagery revealed soil hydrological properties altered by heavy farm
traffic which would have involved extensive and destructive conventional soil surveying (Shanahan,
2013). These assessments were supplemented by operational measurements (e.g. wheelslip, fuel
use) to provide practical information which complemented field and laboratory determinations of
soil physical properties.
In theory, laboratory-based soil bins have the potential to provide more controlled conditions (i.e.
soil particle grain and aggregate size, moisture content) which may assist in measuring the
distribution of stress under tyres and tracks (Ansorge and Godwin, 2007). However, these
comprise soil which has been removed from the field, sieved and standardised and then “re-
packed” in very small volumes (typically a few m3) at known bulk densities in an attempt to
Agency, Househam, LEAF, Michelin Group Products, Mylnefield Research Services, NFU, Scottish
government, Scottish Society for Crops Research (SSCR), Severn Trent Water Ltd., Simba Great
Plains Ltd., The Bulmer Foundation, and Wright Resolutions Ltd. The initiative from Househam in
modifying and demonstrating the rotary harrow unit’s compatibility with self-propelled sprayers is
also very much appreciated. The co-operation of the Farm Managers and operators at all four field
sites (by including the experimental treatments into field management regimes) is gratefully
acknowledged.
The invaluable guidance, advice and support provided by all the members of the project Steering
Committee, including Arthur Hill (chair), Huw Philips, Julian Hasler, Bill Basford, Charles Creyke
and Shamal Mohammed is gratefully acknowledged.
117
118
References
Alakukku, L., Weisskopf, P., Chamen, W.C.T., Tijink, F.G.J., Van der Linden, J.P., Pires, S., Sommer, C. & Spoor, G. 2003. Prevention strategies for field traffic-induced subsoil compaction: a review Part 1. Machine/soil interactions, Soil and Tillage Research 73, 145–160.
Ansorge, D. & Godwin, R. J. 2007. The effect of tyres and a rubber track at high axle loads on soil compaction, Part 1: Single axle-studies. Biosystems Engineering 98, 115-126.
Archie, G. E. 1942. The electrical resistivity log as an aid in determining some reservoir characteristics. Transactions of the American Institute of Mining, Metallurgical and Petroleum Engineers 146, 54-62.
Armstrong, A., Quinton, J.N., Francis, B. Heng, B.C.P & Sander, G.C. 2011. Controls over nutrient dynamics in overland flows on slopes representative of agricultural land in North West Europe. Geoderma 164, 2-10.
Armstrong, J.D., Kemp, P.S., Kennedy, G.J.A., Ladle, M. & Milner, N.J.. 2003. Habitat requirements of Atlantic salmon and brown trout in rivers and streams. Fisheries Research 62, 143–170.
Bailey, R.J. & Spackman, E. 1996. A model for estimating soil moisture changes as an aid to irrigation scheduling and crop water use studies. I. Operational details and description. Soil Use and Management 12, 122-128.
Baveye, P. C., Laba, M., Otten, W., Bouckaert, L., Sterpaio, P. D., Goswami, R. R., Grinev, D., Houston, A., Hu, Y., Liu, J. & Mooney, S. 2010. Observer-dependent variability of the thresholding step in the quantitative analysis of soil images and x-ray microtomography data. Geoderma 157, 51-63.
Besson, A., Cousin, I., Bourennane, H., Nicoullaud, B., Pasquier, C., Richard, G., Dorigny, A. & King, D. 2010. The spatial and temporal organization of soil water at the field scale as described by electrical resistivity measurements. European Journal of Soil Science 61, 120-132.
Besson, A., Cousin, I., Samouëlian, A., Boizard, H. and Richard, G. 2004. Structural heterogeneity of the soil tilled layer as characterized by 2D electrical resistivity surveying, Soil and Tillage Research 79, 239-249.
Binley, A. and Kemma, A. 2005. DC resistivity and induced polarization methods. In: Rubin, Y and Hubbard SS (eds), Hydrogeophysics, Water Science and Technology Library, Vol. 59, Springer, Dordrecht, 129-156.
Bohne, K. 2005. An introduction to applied soil hydrology, Reiskirchen, Catena Verlag GMBH. Bonilla, C.A., Kroll, D.G., Norman, J.M., Yoder, D.C., Molling, C.C., Miller, P.S., Panuska, J.C., Topel, J.B.,
Wakeman, P.L. and Karthikeyan, K.G. 2006. Instrumentation for Measuring Runoff, Sediment, and Chemical Losses from Agricultural Fields. Journal of Environmental Quality 35, 216-223.
Botta, G. F., Rivero, D., Tourn, M., Bellora, F., Pozzolo, O., Nardon, G., Balbuena, R., Becerra. A.T., Rosatto, H. & Stadler, S. 2008. Soil compaction produced by tractor with radial and cross-ply tyres in two tillage regimes. Soil and Tillage Research 101, 44-51.
Bresson, L. M. & Moran, C. J. 1998. High-resolution bulk density images, using calibrated x-ray radiograph of impregnated soil slices. Soil Science Society of America Journal 62, 299-305.
Bresson, L. M. & Moran, C. J. 1998. High-resolution bulk density images, using calibrated x-ray radiograph of impregnated soil slices. Soil Science Society of America Journal 62, 299-305.
Carlos A. Bonilla, David G, Kroll, John M. Norman, Daniel C. Yoder, Christine C. Molling, Paul S. Miller, John C. Panuska, Jeffrey B. Topel, Peter L. Wakeman, and K. G. Karthikeyan (2006) Instrumentation for measuring run-off, sediment, and chemical losses from agricultural fields. Journal of Environmental Quality, 35, 216-223, short communication.
Chambers, B.J., Garwood, T.W.D. & Unwin, R.J. 2000. Controlling soil water erosion and phosphorus losses from arable land in England and Wales. Journal of Environmental Quality 29, 145–150.
Chamen, T. 2011. The effects of low and controlled traffic systems on soil physical properties, yields and the profitability of cereal crops on a range of soil types. PhD thesis, Cranfield University, UK.
Chandler, J. 1999. Effective application of automated digital photogrammetry for geomorphological research. Earth Surface Processes and Landforms 24, 51-63.
Chappell, N. A., & Ternan, J. L. 1997. Ring permeametry: design, operation and error analysis. Earth Surface Processes and Landforms 22, 1197–1205.
Collins, A.L., Anthony, S.G. 2008. Assessing the likelihood of catchments across England and Wales meeting ‘good ecological status’ due to sediment contributions from agricultural sources. Environmental Science and Policy 11, 163-170.
Collins, A.L., Anthony, S.G., Hawley, J. & Turner, T. 2009a. The potential impact of projected change in farming by 2015 on the importance of the agricultural sector as a sediment source in England and Wales. Catena 79, 243–250.
Collins, A.L., Anthony, S.G., Hawley, J. & Turner, T. 2009b. Predicting potential change in agricultural sediment inputs to rivers across England and Wales by 2015. Marine and Freshwater Research 60, 626–637.
119
Collins, A.L., Anthony, S.G., Hawley, J., Turner, T. 2009a. The potential impact of projected change in farming by 2015 on the importance of the agricultural sector as a sediment source in England and Wales. Catena 79, 243-250.
Collins, A.L., Anthony, S.G., Hawley, J., Turner, T. 2009b. Predicting potential change in agricultural sediment inputs to rivers across England and Wales by 2015. Marine and Freshwater Research 60, 626-637.
Collins, A.L., Jones, J.I., Sear, D.A., Naden, P.S., Skirvin, D., Zhang, Y.S., Gooday, R., Murphy, J., Lee, D., Pattison, I., Foster, I.D.L., Williams, L.J., Arnold, A., Blackburn, J.H., Duerdoth, C.P., Hawczak, A., Pretty, J.L., Hulin, A., Marius, M.S.T., Smallman, D., Stringfellow, A., Kemp, P., Hornby, D., Hill, C.T., Naura, M. and Brassington, J. 2012. Extending the evidence base on the ecological impacts of fine sediment and developing a framework for targeting mitigation of agricultural sediment losses. Final report to Defra, Defra project WQ0128.
Collins, A.L., Stromqvist, J., Davison, P.S., Lord, E.I. 2007. Appraisal of phosphorus and sediment transfer in three pilot areas identified for the catchment sensitive farming initiative in England: application of the prototype PSYCHIC model. Soil Use and Management 23, 117–132.
Comber A, Anthony A, Proctor C. 2008. The creation of a national agricultural land use dataset: combining pycnophylactic interpolation with dasymetric mapping techniques. Transactions in GIS 12, 775-791. Computers and Electronics in Agriculture 46, 11-43.
Cuttle, S., Macleod, C., Chadwick, D., Scholefield, D., Haygarth, P., Newell-Price, P., Harris, D., Shepherd, M., Chambers, B. and Humphrey, R. 2006. An Inventory of Methods to Control Diffuse Water Pollution from Agriculture (DWPA). Defra Report, project ES0203, 115pp.
Davison, P.S., Withers, P.J.A., Lord, E.I., Betson, M.J., Stromqvist, J. 2008. PSYCHIC - a process-based model of phosphorus and sediment mobilisation and delivery within agricultural catchments. Part 1: model description and parameterisation. Journal of Hydrology 350, 290-302.
Deasy, C., Quinton, J.N., Silgram, M., Bailey, A.P., Jackson, B. and Stevens, C.J. 2010a. Contributing understanding of mitigation options for phosphorus and sediment to a review of the efficacy of contemporary agricultural stewardship measures. Agricultural Systems 103 (2), 105-109.
Deasy, C., Quinton, J.N., Silgram, M., Jackson, R., Bailey, A.P. and Stevens, C.J. 2009. Mitigation options for sediment and phosphorus losses from winter-sown arable crops. Journal of Environmental Quality 38 (5), 2121-2130.
Deasy, C., Quinton, J.N., Silgram, M., Stoate, C., Jackson, R., Stevens, C.J. and Bailey, A.P. 2010b. Mitigation Options for Phosphorus and Sediment (MOPS): Reducing Pollution in Runoff from Arable Fields. The Environmentalist 180, 12-17.
DECC, 2012. Updated short-term traded carbon values used for UK public policy appraisal. Defra, 2005. Controlling soil erosion. A manual for the assessment and management of agricultural land at
risk of water erosion in lowland England. Defra, 2012a. Guidelines for Defra / DECC's GHG Conversion Factors for Company Reporting. Annex 1. Defra, 2012b. Estimating Damage Costs for Major English Water Pollutants. Defra, 2015. The guide to cross-compliance in England. Available from http://www.gov.uk Environment Agency, 2012. Freshwater eutrophication: a nationally significant water management issue. Environment Agency briefing note, 27pp Evans, B. 2009. Pesticide runoff into English rivers – a big problem for farmers. Pesticide News 85, 12-15. Gasso, V., Sørensen, C.A.G., Oudshoom, F.W & Green, O. 2013. Controlled traffic farming: A review of the
environmental impacts. European Journal of Agronomy 48, pp66–73. Grisso, R., Perumpral, J. and Zoz, F. 2006. An empirical model for tractive performance of rubber-tracks in
agricultural soils. Journal of Terramechanics 43, 225-236. Haith D.A., Shoemaker L.L., 1987. Generalized Watershed Loading Functions for stream flow nutrients.
Water Resources Bulletin 23(3): 471–478. Hamza, M.A. & Anderson, W.K. 2005. Soil compaction in cropping systems: a review of the nature, causes
and possible solutions. Soil & Tillage Research 82, 121-145. Heathwaite, L., Haygarth, P., Matthews, R., Preedy, N., Butler, P. 2005. Evaluating colloidal phosphorus
delivery to surface waters from diffuse agricultural sources. J. Environ. Qual. 34, 287–298. Heng, B. C. P., Chandler, J. H. & Armstrong, A. 2010. Applying close range photogrammetry in soil erosion
studies. The Photogrammetric Record 25, 240-265. Hodgkinson, R., Hulin, A., Johnson, D., Silgram, M. and Collins, A. 2013. Final report for Defra project
WT0749NVZ, Investigating the effectiveness of the NVZ Action Programme measures – NIT18 Phase II. Report submitted to Defra. 75pp
Hoorman, J.J., de Moraes Sá, J.C. & Reeder, R. 2011. The biology of soil compaction. American Society of Agronomy: Crops & Soils magazine, July-August 2011, 4-10.
120
Jester, W. & Klik, A. 2005. Soil surface roughness measurement - methods, applicability, and surface representation. Catena 64, 174-192.
Jester, W. & Klik, A. 2005. Soil surface roughness measurement—methods, applicability, and surface representation. Catena 64, 174-192.
Kay, P., Blackwell, P.A. & Boxall, A.B.A. 2005. Transport of veterinary antibiotics in overland flow following the application of slurry to arable land. Chemosphere 59, 951-959.
Klöppel, H., Kördel, W. & Stein, B., 1997. Herbicide transport by surface runoff and herbicide retention in a filter strip - rainfall and runoff simulation studies. Chemosphere 35 (1/2), 129–141.
Lord, E., Shepherd, M., Silgram, M., Goodlass, G., Gooday, R., Anthony, A., Davison, P., and Hodgkinson, R. 2007. Investigating the effectiveness of NVZ Action Programme measures: development of a strategy for England. Final report for Defra project NIT18. 116pp + 11 Appendices.
MAFF, 1986. The Analysis of Agricultural Materials. HMSO, London. McKenzie, B.M., Braga, R.A., Coelho, D.E.C., Krol, M. & Horgan, G. submitted. Moiré as a low-cost, robust
Collins, M., Harris, G.R., Kendon, E.J., Betts, R.A., Brown, S.J., Howard, T. P., Humphrey, K. A., McCarthy, M. P., McDonald, R. E., Stephens, A., Wallace, C., Warren, R., Wilby, R., Wood, R. A. (2009), UK Climate Projections Science Report: Climate change projections. Met Office Hadley Centre, Exeter.
Natural England, 2011. Protecting water from agricultural runoff: an introduction. Natural England Technical Information Note TIN098. 8pp.
Neitsch, S.L., Arnold, J.G., Kiniry, J.R., and William, J.R., 2011. Soil and Water Assessment Tool: Theoretic Documentation version 2009. Texas Water Resources Institute Technical Report No. 406.
Nix, J. 2015. John Nix Farm Management Pocketbook 45th Edition, p196. Parker, P.J. & Busch, D.L., 2013. Field-scale evaluation of a multislot passive sampler. Journal of Soil and
Water Conservation 68 (2), 83-88. Quinton, J., Silgram, M., Stevens, C., Deasy, C., S and Bailey, A. 2008. Final report to Defra on project
PE0206. ‘MOPS’: Mitigation of Phosphorus and Sediment (Field testing of mitigation options). Available from http://rannd.defra.gov.uk
Quinton, J., Stevens, C., Deasy, C., Silgram, M., Jackson, B., and Bailey, A. 2007. Mitigation options for phosphorus and sediment (MOPS): tillage treatments and the use of vegetative barriers. Proceedings of the 5th International Phosphorus Transfer Workshop (IPW5), 3-7 September 2007, Silkeborg, Denmark. (Eds. G. Heckrath, G. Rubaek & B. Kronvang) pp295-298. ISBN 87-91949-20-3.
Raper, R. L. 2005. Agricultural traffic impacts on soil. Journal of Terramechanics 42, 259–280. Regan, J.T., Fenton, O., Healy, M 1 .G. 2012. A review of phosphorus and sediment release from Irish tillage
soils, the methods used to quantify losses and the current state of mitigation practice. Biology and Environment: Proceedings of the Royal Irish Academy 112B(1), 157-183.
Ridge, R. 2002. Trends in sugar cane mechanization. International Sugar Journal 104, 164–166. Samouëlian, A., Cousin I., Tabbagh, A., Bruand, A. and Richard, G. 2005. Electrical resistivity survey in soil
science: a review. Soil & Tillage Research 83, 173-193. Schjønning, P., Heckrath, G. & Christensen, B.T. 2009. Threats to soil quality in Denmark, A review of
existing knowledge in the context of the EU Soil Thematic Strategy. Faculty of Agricultural Sciences, Aarhus university, Denmark. 124pp.
Séger, M., Cousin, I., Frison, A., Boizard, H., Richard, G. 2009. Characterization of the structural heterogeneity of the soil tilled layer by using in situ 2D and 3D electrical resistivity measurements. Soil & Tillage Research 103, 387-398.
Shanahan, P. 2013. Assessment of heavy farm traffic on soil compaction using non-invasive and non-destructive techniques. PhD thesis. University of Lancaster. 320pp.
Silgram, M. 2001. Field and farm scale investigation of the mobilisation and retention of sediment and phosphorus. Final report to Defra on project NT1033. Available from http://randd.defra.gov.uk
Silgram, M. 2005. Towards understanding factors controlling transfer of phosphorus within and from agricultural fields. Final report to Defra for project PE0111. 18pp. Available from http://rannd.defra.gov.uk
Silgram, M., Hatley, D., & Gooday, R., 2007. IRRIGUIDE: a decision support tool for drainage estimation and irrigation scheduling. Proceedings of the 6th Biennial Conference of the European Federation of IT in Agriculture (EFITA) / World Congress on Computing in Agriculture (WCCA) 2007 joint conference “Environmental and rural sustainability”. Glasgow, UK, 2-5 July 2007.
Silgram, M., Jackson, B., Quinton, J., Stevens, C., and Bailey, A. 2007. Can tramline management be an effective tool for mitigating phosphorus and sediment loss? Proceedings of the 5th International Phosphorus Transfer Workshop (IPW5), 3-7 September 2007, Silkeborg, Denmark (Eds. G. Heckrath, G. Rubaek & B. Kronvang). pp287-290. ISBN 87-91949-20-3.
121
Silgram, M., Jackson, R., Quinton, J., and Stevens, C. 2006. Practical mitigation options for controlling phosphorus and sediment loss at hillslope scale. Proceedings of the British Hydrological Society 9th National Symposium, 103-107.
Silgram, M., Jackson, R.J, Bailey, A.P., Quinton, J.N, 2010. Hillslope-scale surface runoff, sediment, and nutrient losses associated with tramline wheelings. Earth Surface Processes and Landforms (Special Issue - Soil erosion in agriculture) 35 (6), 699-706.
Silgram, M., Quinton, J., Shanahan, P., Jackson, B., Bailey, A. 2015. Final report to Defra on Defra project WQ0127 “Mitigation of Phosphorus and Sediment 2 (MOPS2)”. Available from http://randd.defra.gov.uk
Tabbagh, A., Dabas, M., Hesse, A. and Panissod, C. 2000. Soil resistivity: a non-invasive tool to map soil structure horizonation. Geoderma 97, 393-404.
USDA-SCS. 1972. National Engineering Handbook, Part 630 Hydrology, Section 4, Chapter 10. Natural Resources Conservation Service, U.S. Department of Agriculture, Washington D.C..
Webb, B., Blackwell, P., Riethmuller, G. & Lemon, J. 2004. Tramline Farming Systems: Technical Manual. State of Western Australia Bulletin 4607. Department of Agriculture Western Australia. GRDC project DAW 718. ISSN 1448-0352..46pp.
Withers, P. J. A., Hodgkinson, R. A., Bates, A. & Withers, C. L. 2006. Some effects of tramlines on surface runoff, sediment and phosphorus mobilization on an erosion-prone soil. Soil Use and Management 22, 245–255.
Withers, P. J. A., Hodgkinson, R. A., Bates, A. & Withers, C.L. 2007. Soil cultivation effects on sediment and phosphorus mobilization in surface runoff from three contrasting soil types in England. Soil and Tillage Research 93, 438–451.
Wolf, P. R. & Dewitt, B. A. 2000. Elements of photogrammetry – with applications in GIS, New York, McGraw-Hill Companies Inc.
Wulfsohn, D and Way, T.R. 2009. Factors that influence tractive performance of Wheels, Tracks and Vehicles. Transactions of the ASAE. Advances in Soil Dynamics Volume 3 Chapter 2, Part VII, pp209-252.
Young, R.A., Onstad, C.A., Bosch, D.D., and Anderson, W.P., 1989. AGNPS: A nonpoint-source pollution model for evaluating agricultural watersheds. Journal of Soil and Water Conservation, Vol 44, 2: 168-173.
Zhang, Y., Collins, A., Murdoch, N., Lee, D and Naden, P. 2014. Cross sector contributions to river pollution in England and Wales: Updating waterbody scale information to support policy delivery for the Water Framework Directive. Environmental Science and Policy, 42, 16-32.
122
Appendix 1. Knowledge Exchange activities
Presentations TV interview, “Farming Sunday” SKY channel 280, Mar 10 YouTube interview, AHDB Cereals & Oilseeds workshop (2012) CSF training on diffuse pollution control, Loddington, Mar 10 Stand, talk and practical demo at Tillage Live 2011 as a required stop on the “soils knowledge trail” Agricultural Engineers Association presentation, Oct 11 High Mowthorpe Farmers’ Association presentation, Dec 11 Presentation as part of 'Developments in Crop Production' Level 3 Agricultural Business Management
degree students at Hartpury College (University of West of England), 5th Dec 10 Defra IWAM WQ0109 CSF CPD Diffuse pollution related to arable land, Loddington, Mar 10 International Phosphorus Workshop (IPW6), Seville, Sep 10 CSF training day, Telford, Aug 10 ‘Farming Futures’ event, Loddington, 11 Nov 2010, 80 participants: speaker & field tour CSF meeting –- mitigating risk of pesticides in water, Ledbury, Jan 11 Rosemaund Open Day, Summer 11 Invited speaker and practical demonstrator in two sessions at Soil & Water Management Day, Harper
Adams, Feb 12, www.harper-adams.co.uk/video/201594 Seminar to Environmental Management Group, Cranfield University, Jan 12 Boxworth Farming Association meeting, Feb 12 Series of 5 AHDB Cereals & Oilseeds industry events with farm walks & presentations (Mar 13) Talk and field walk at “Farm Water Pathway management” CSF event (Nov 13) Presentation at NIABTAG farm event (Summer 13); Demonstration / stand / poster at Cereals event (Jun 2010–14) “Repairing damaged soils of 2012” soil compaction workshop, Harper Adams (Feb 13); Presentation at Soil management workshop, Loddington (Jan 13) Cereals in Practice (Jul 13) Series of 3 AHDB Cereals & Oilseeds/SRUC winter industry events (Jan 14) Papers & press articles ‘Focus on wheelings to cut surface runoff and diffuse pollution risk’, Famers’ Guardian, 11 Dec 09, p16. ‘Seeking practical measures to cut tramline surface loss’. Crops magazine, 13 Mar 10, pp26-27. ‘Soft rubber beats autumn erosion’, Farmers’ Weekly, 19 Nov 10, p47. ‘Innovative kit can take care of pesticide runoff’, Farmers’ Weekly, 23 Sep 11, pp58-59. ‘Correct tyre choice relieves tramline pressures’, Farmers1st (www.atlasfram.co.uk), 20 June 11, p18. H2OK “Catchment news”, Voluntary Initiative newsletter, Autumn 10, p7. ADAS Environmental Digest article, Nov 10 Crop Protection Magazine – Tillage 2011 article, Oct 11 Farmers Weekly article on Harper Adams soil and water management day, Mar 12 Article – NIABTAG Landmark Bulletin Issue 12, Summer 13 Internal paper requested by Defra / NE to support review of agri-environment policy, Jul 2013 “Spiked harrow eases problem”. The Courier press article, Jul 13 McKenzie BM Silgram M, Baxter C, Lewis TD, Hawes C, Neilson R & Rowan JR 2013. Managing the
surface structure of arable soil to control erosion and maintain ecosystem services. International Workshop on “Soil Structure and its Functions in Ecosystems 8-10th September 2013 Nanjing, China.
Online only AHDB Cereals & Oilseeds website + YouTube article, Sep 11 UK-ADAPT website and email alert article (Dec 11) James Hutton website (summer 13) ADAS website (summer 13) Posters Open Farm Sunday, Jun 10 – Jun13 EGU Vienna, May 10
123
European Geosciences Union (EGU) annual meeting, Vienna, May 10 Royal Welsh Smallholders and Garden Festival, Royal Welsh showground, May 11 Three Counties Show, Malvern, Jun 11 Bulmer's Orchard and Machinery Day, Jul 11 Malvern Farming Conference, Nov 11 EUROSOIL conference, Summer 12 Tillage 2012 – Demonstration plot, two posters, and equipment display area ISTRO, Sep 12 Nordic Association of Agricultural Sciences meeting, Helsinki Mar 12


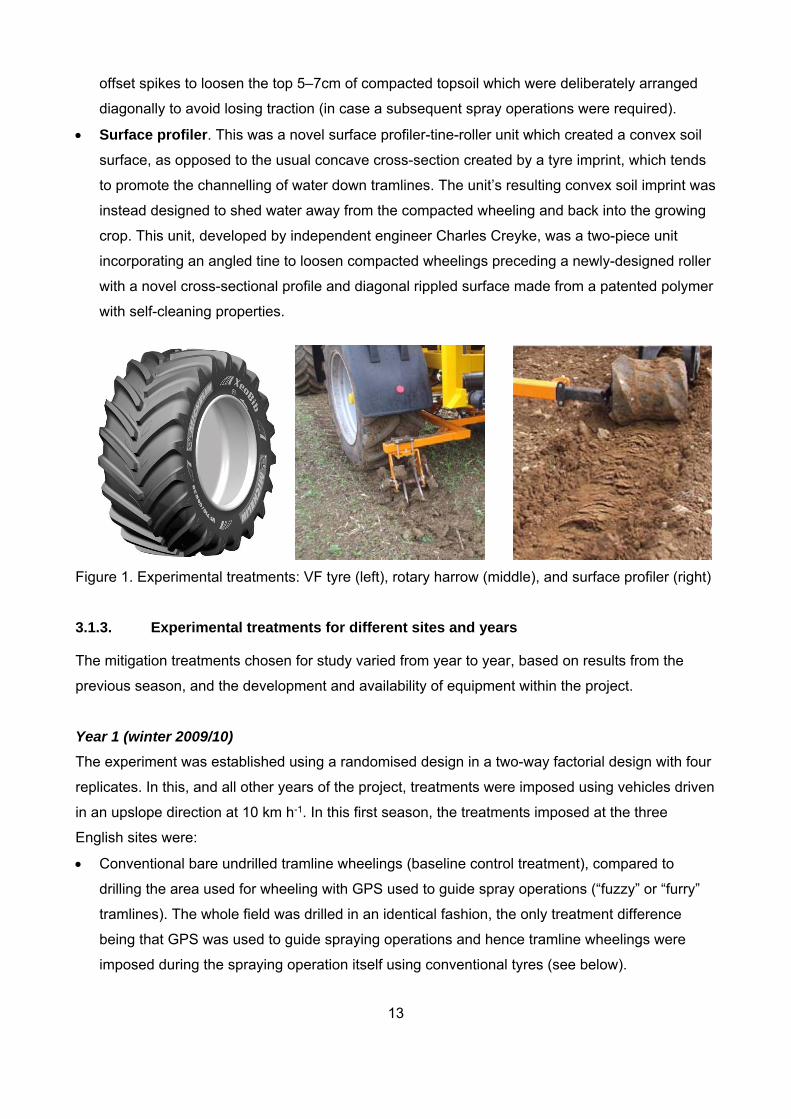


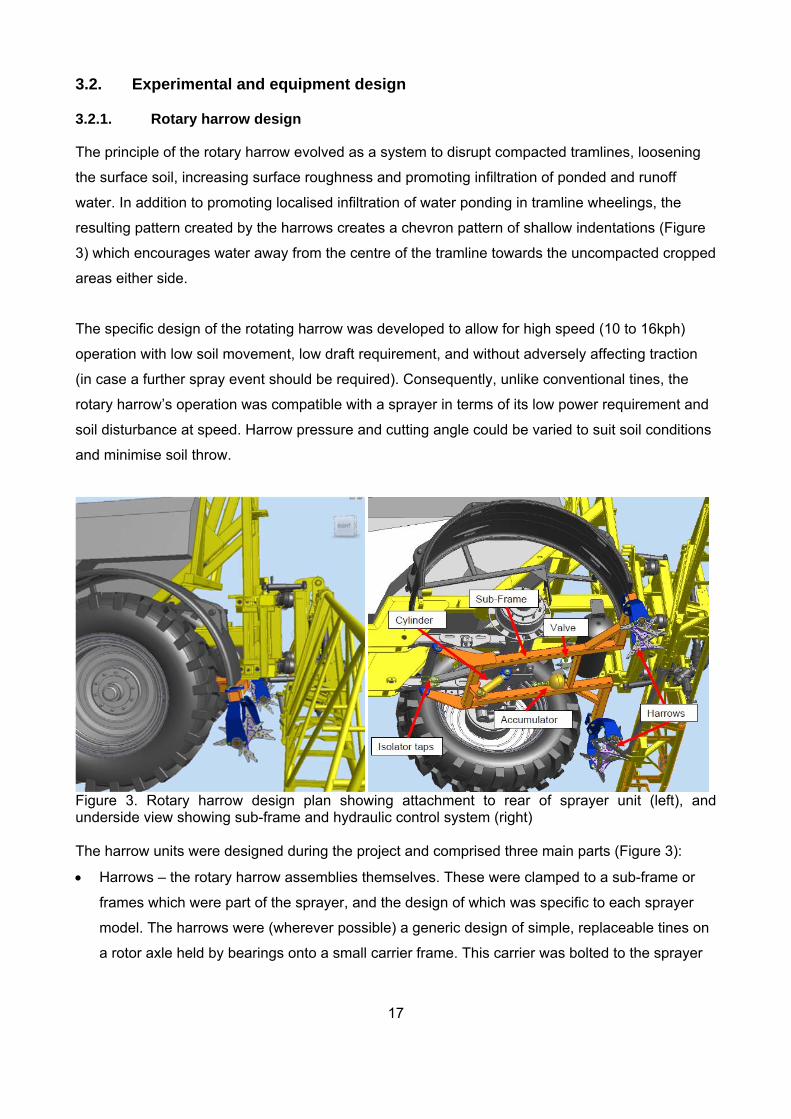


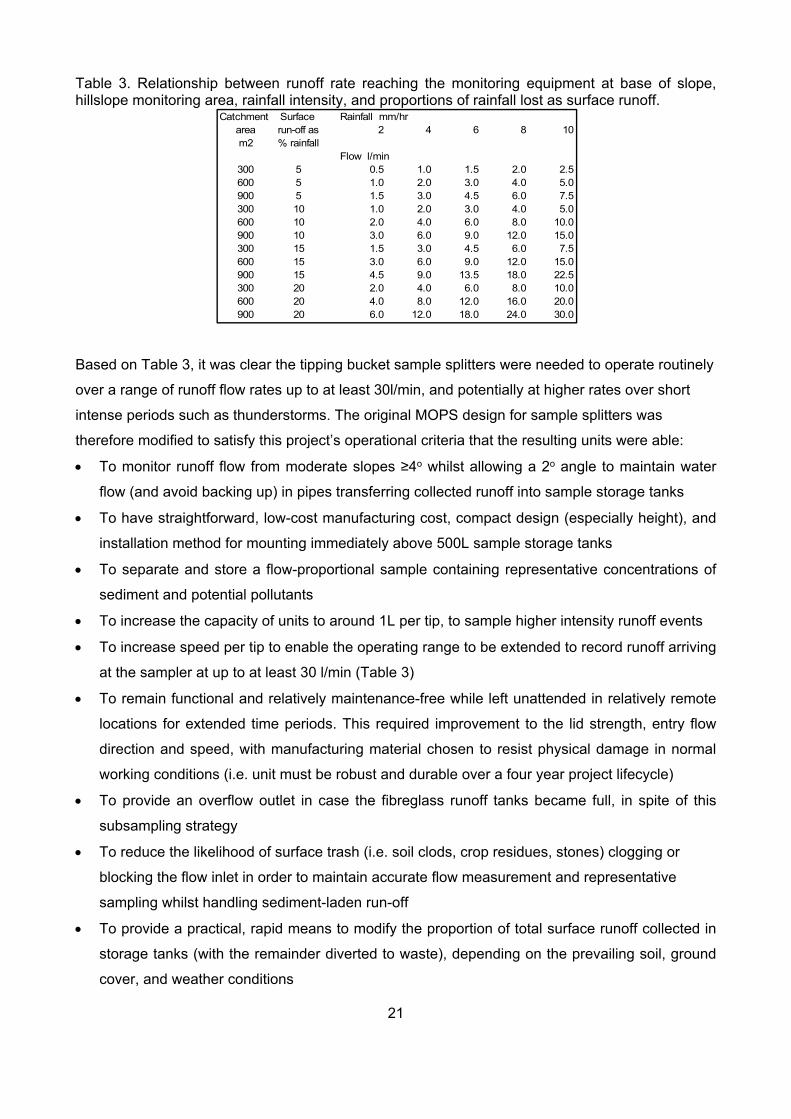
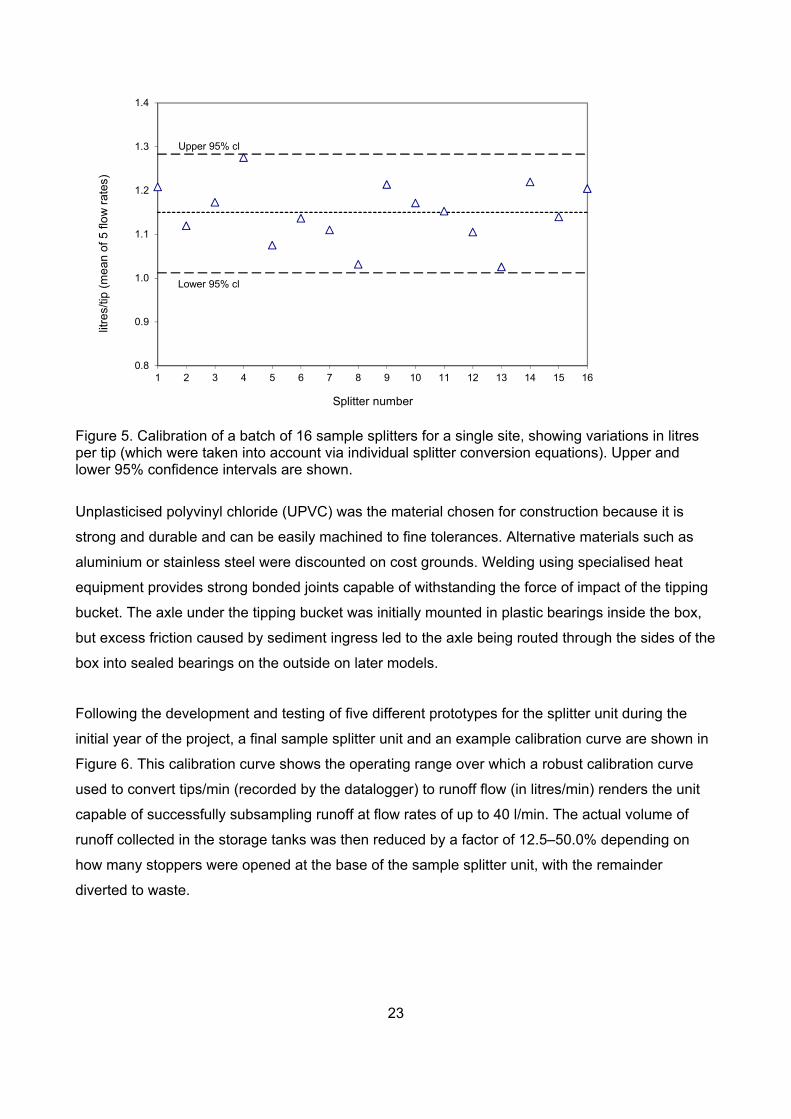
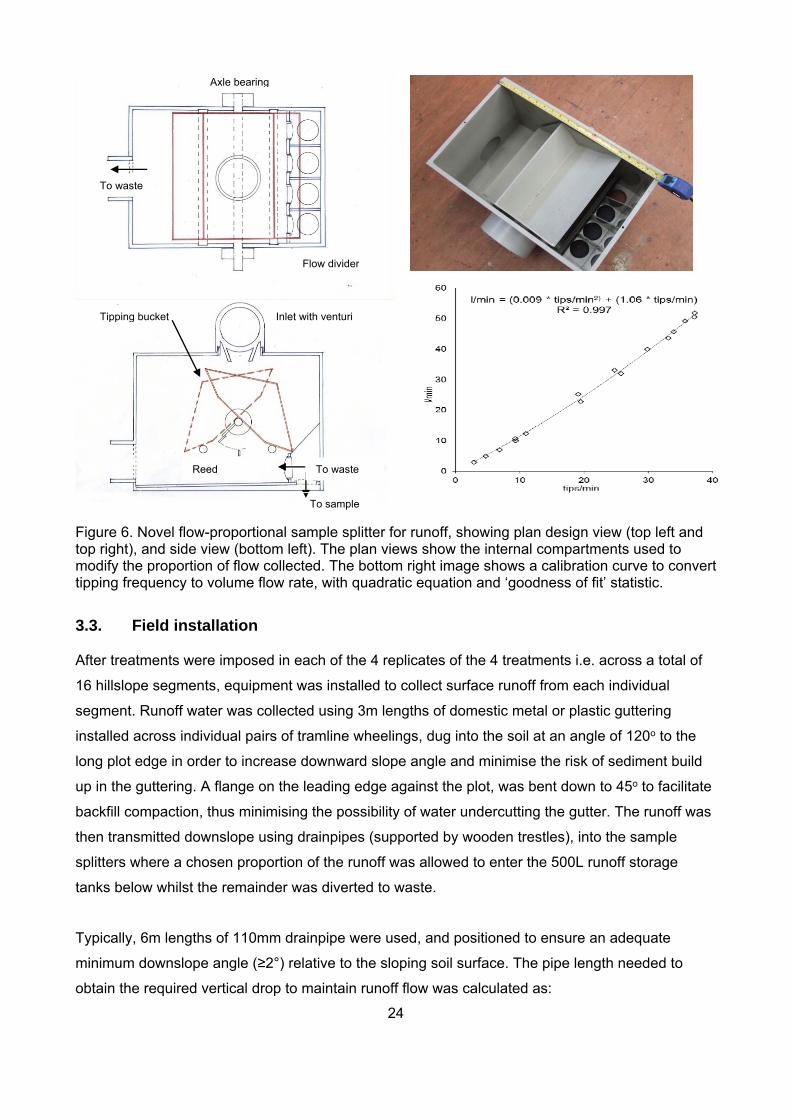
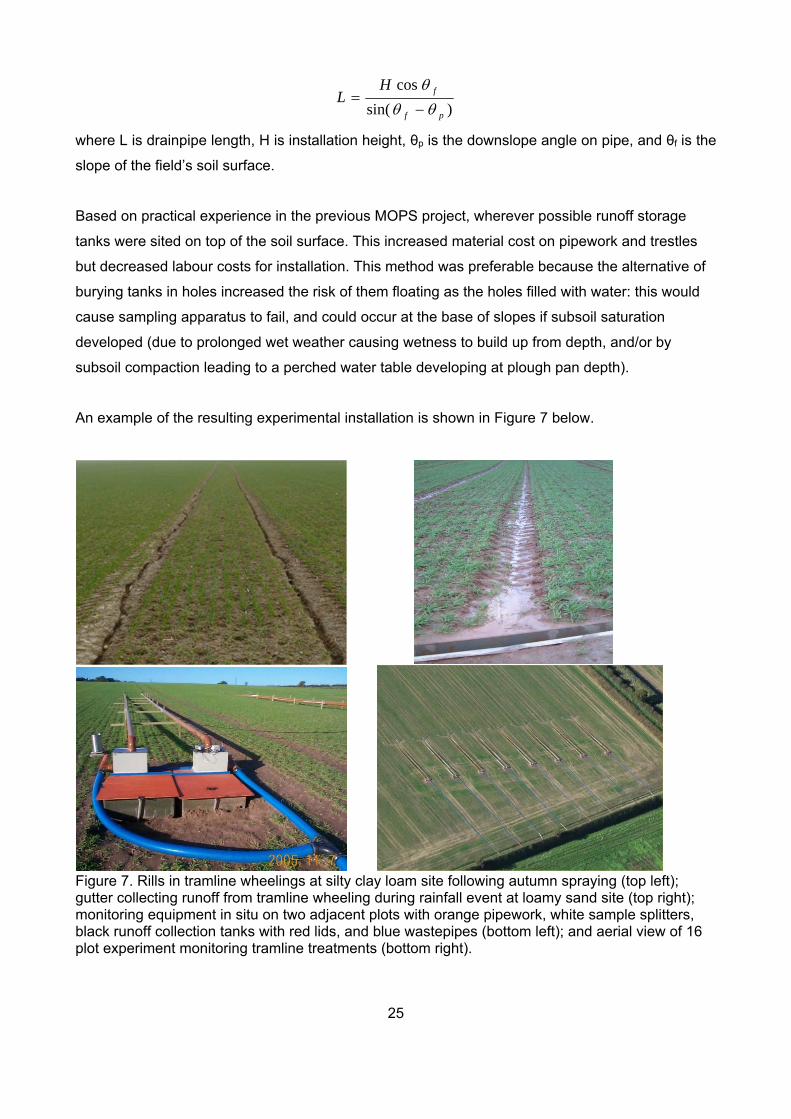


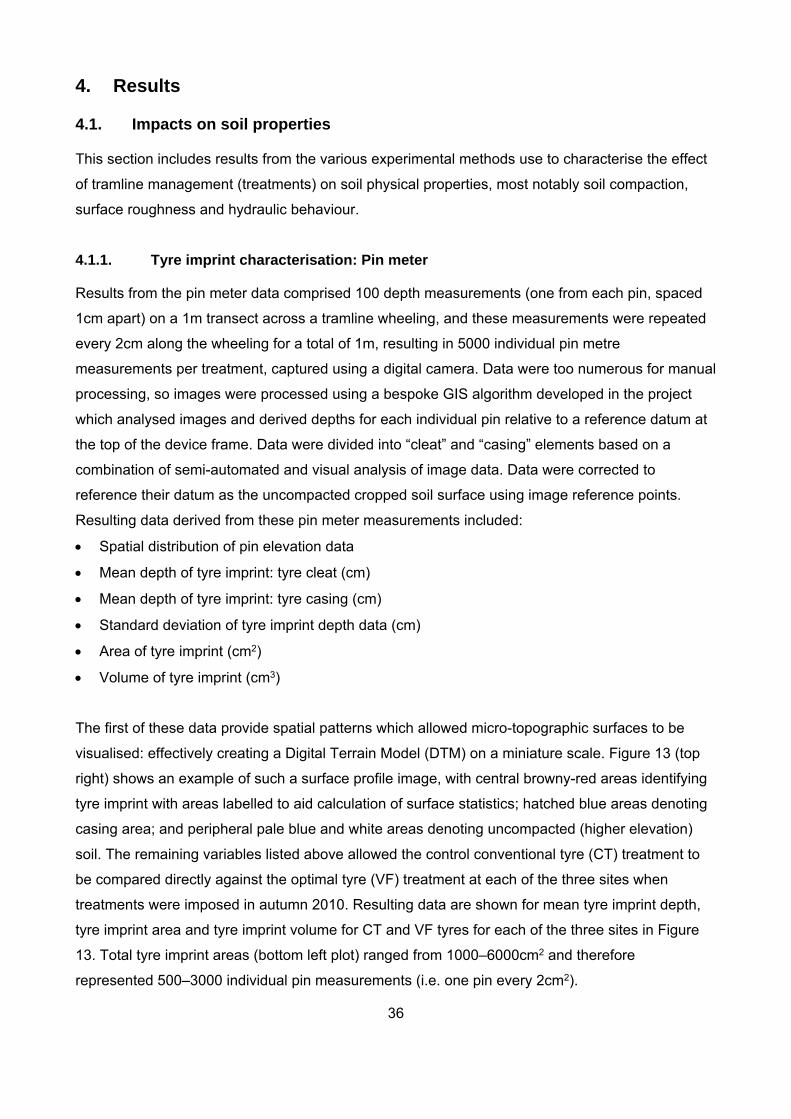

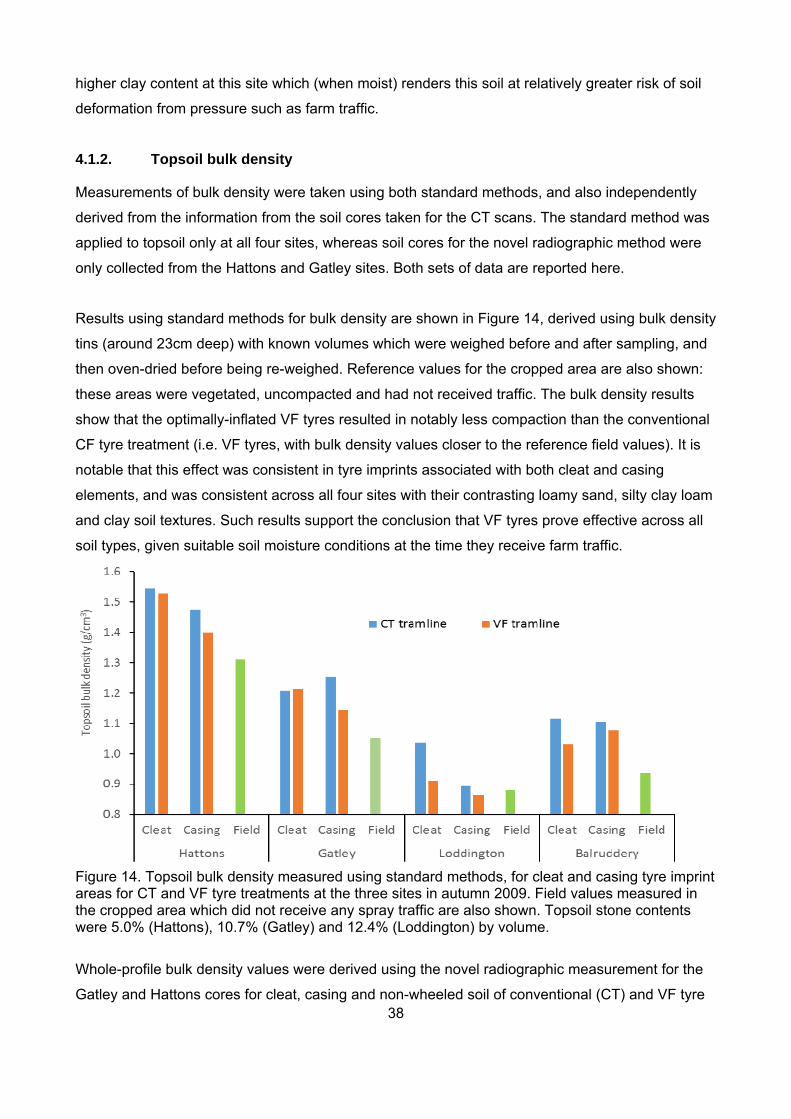
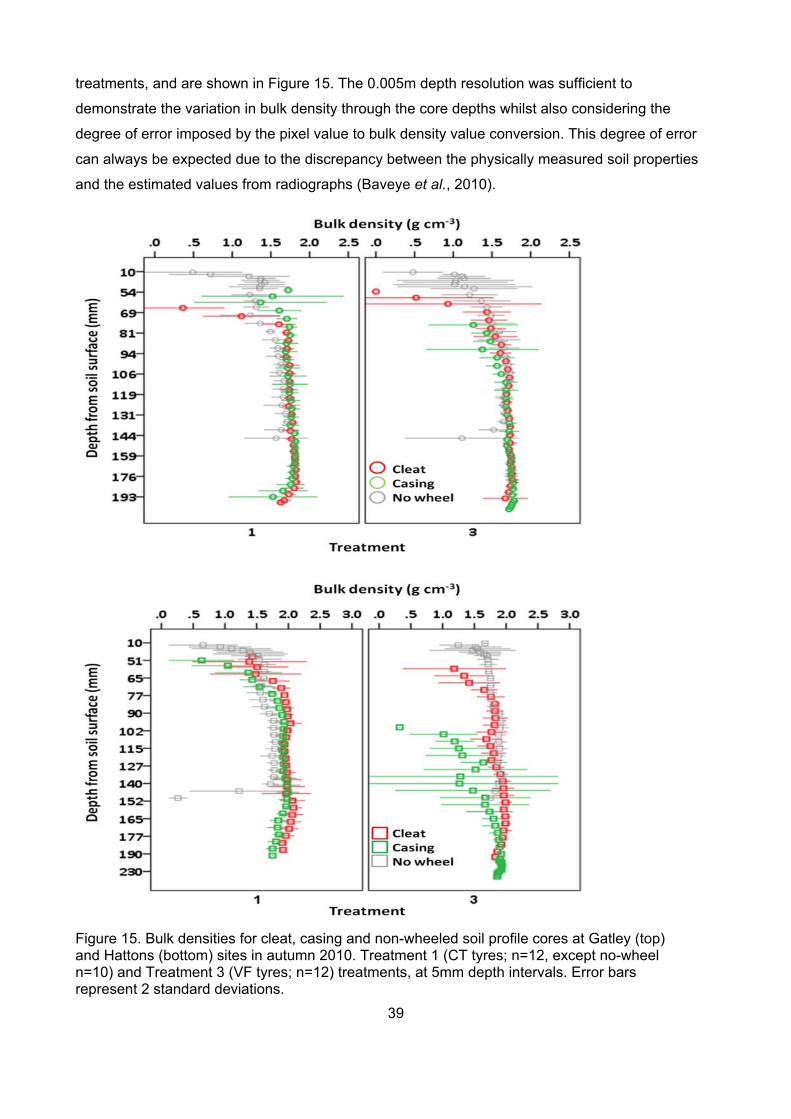


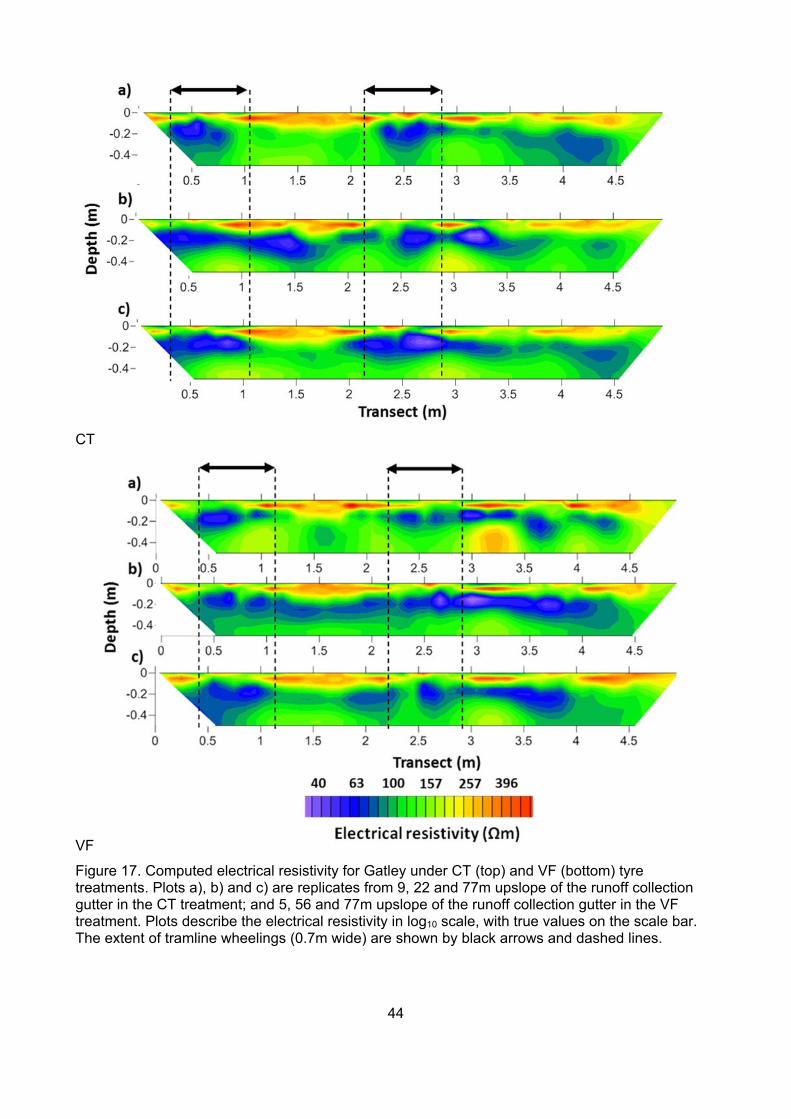
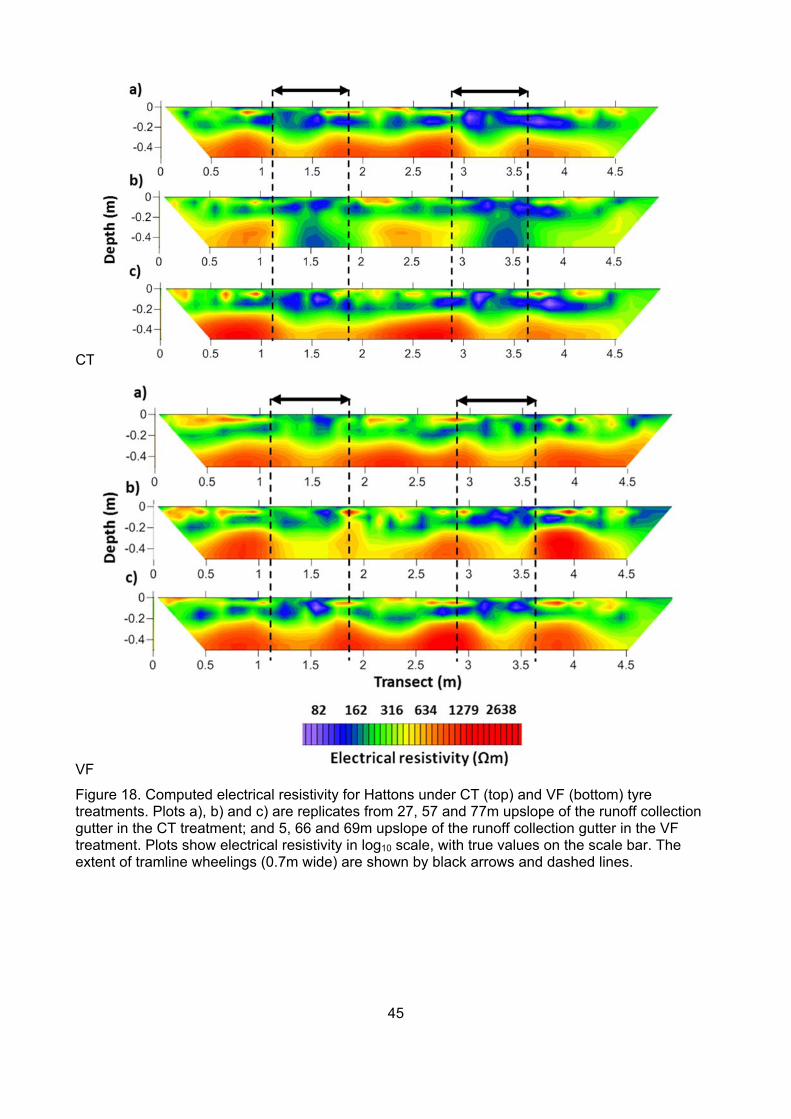
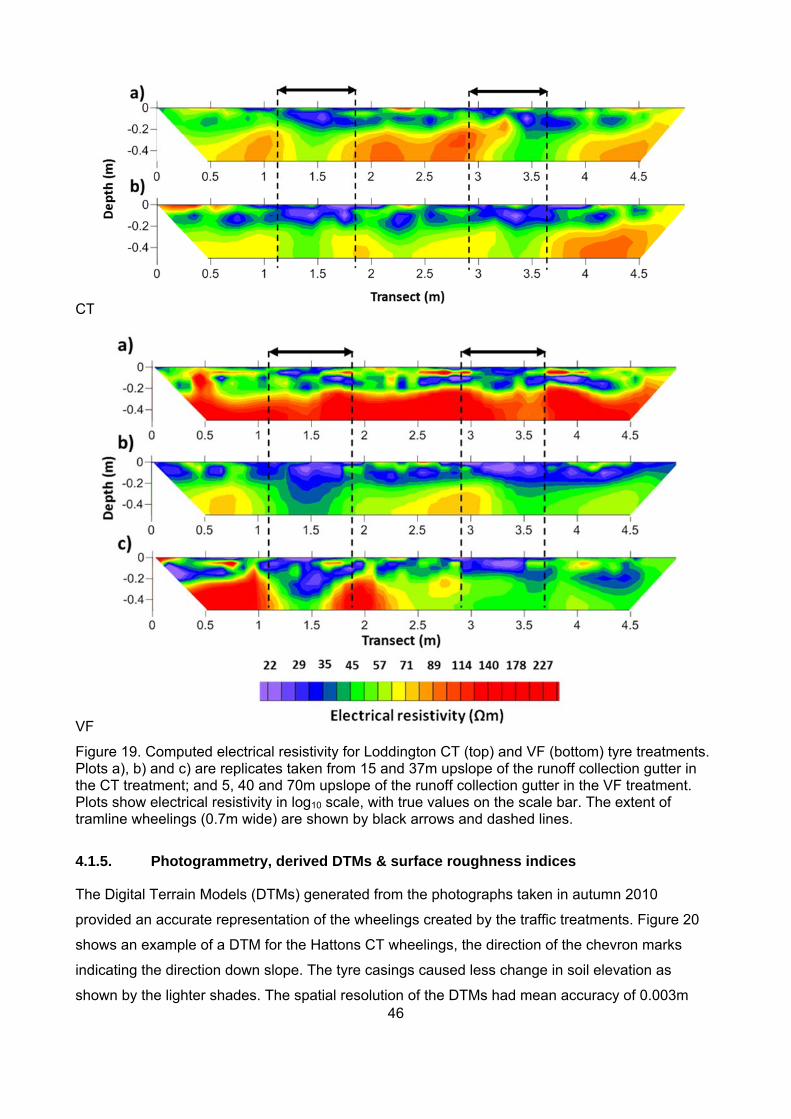

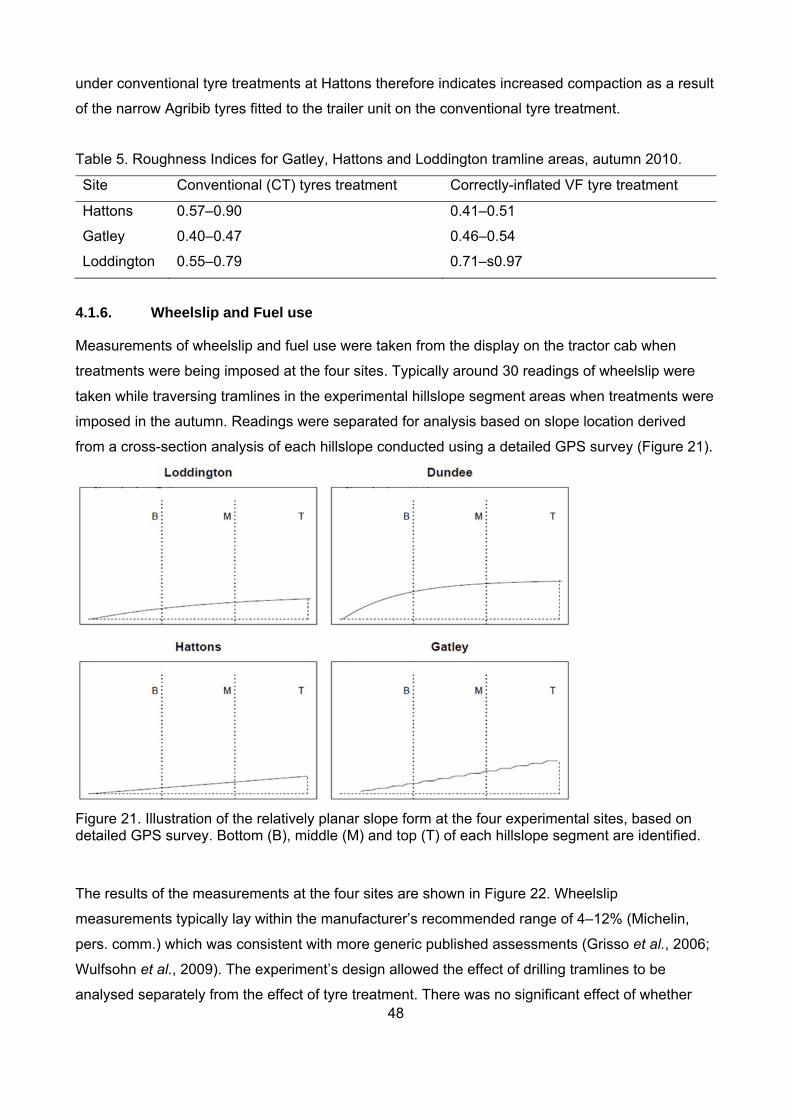
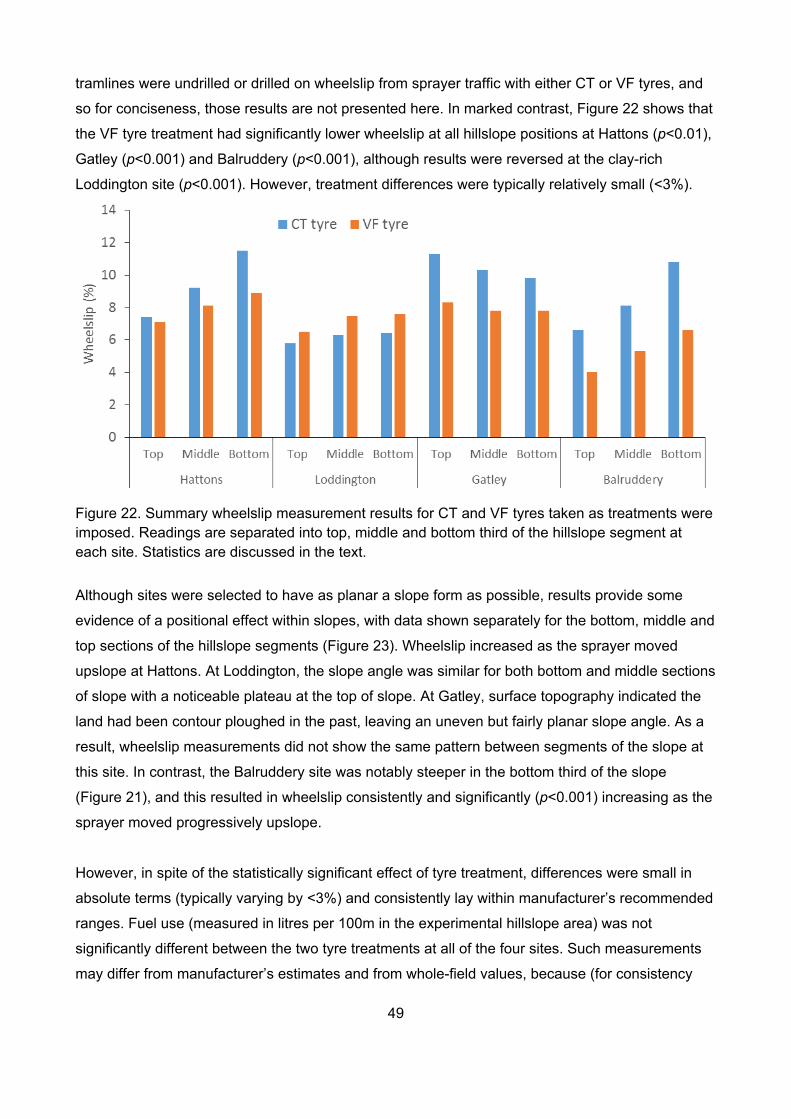
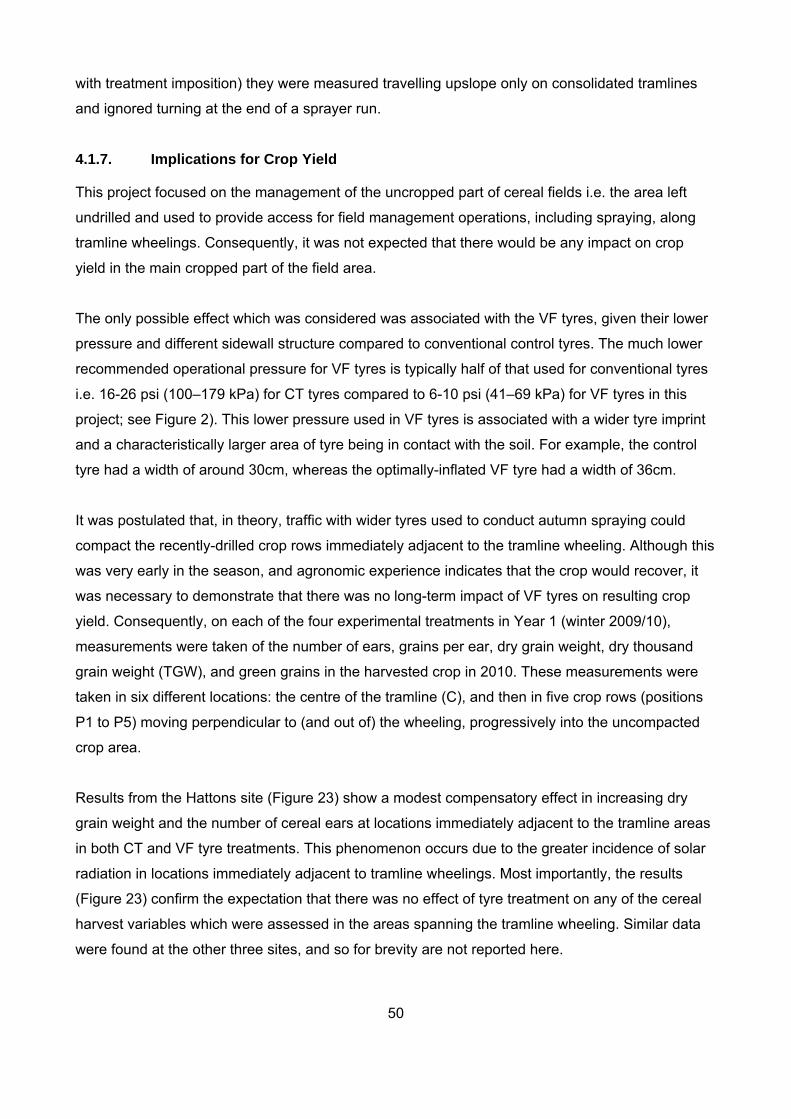
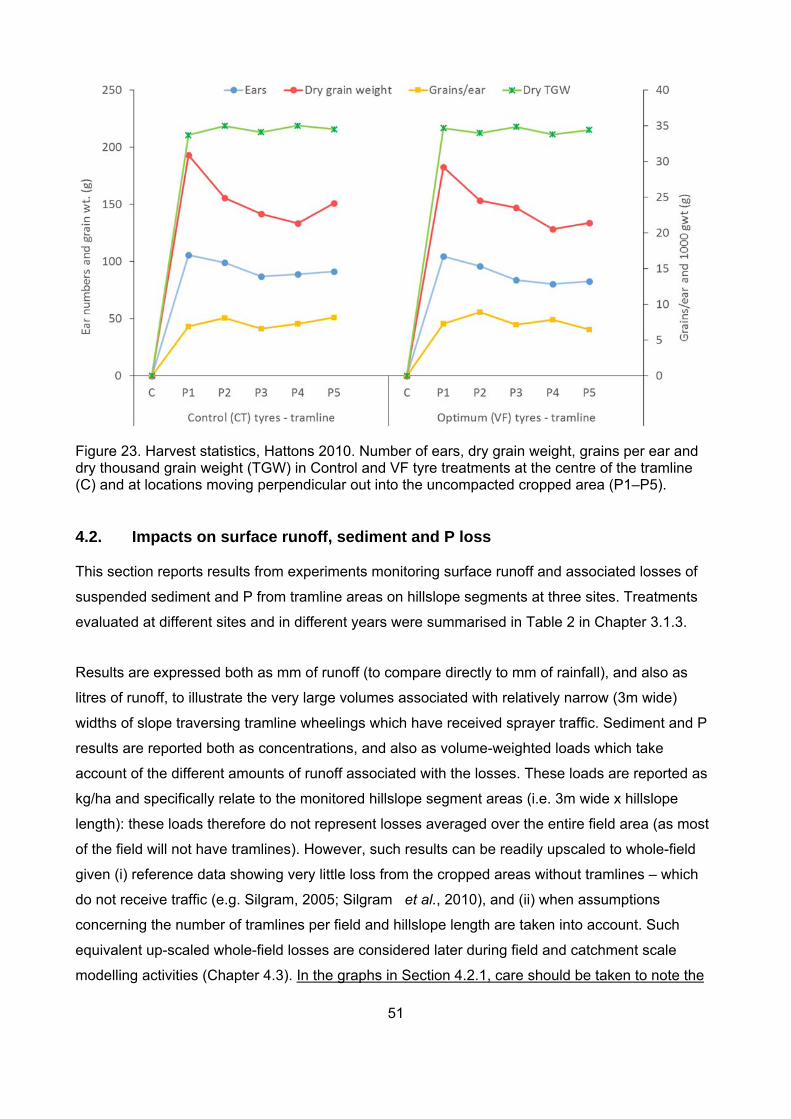


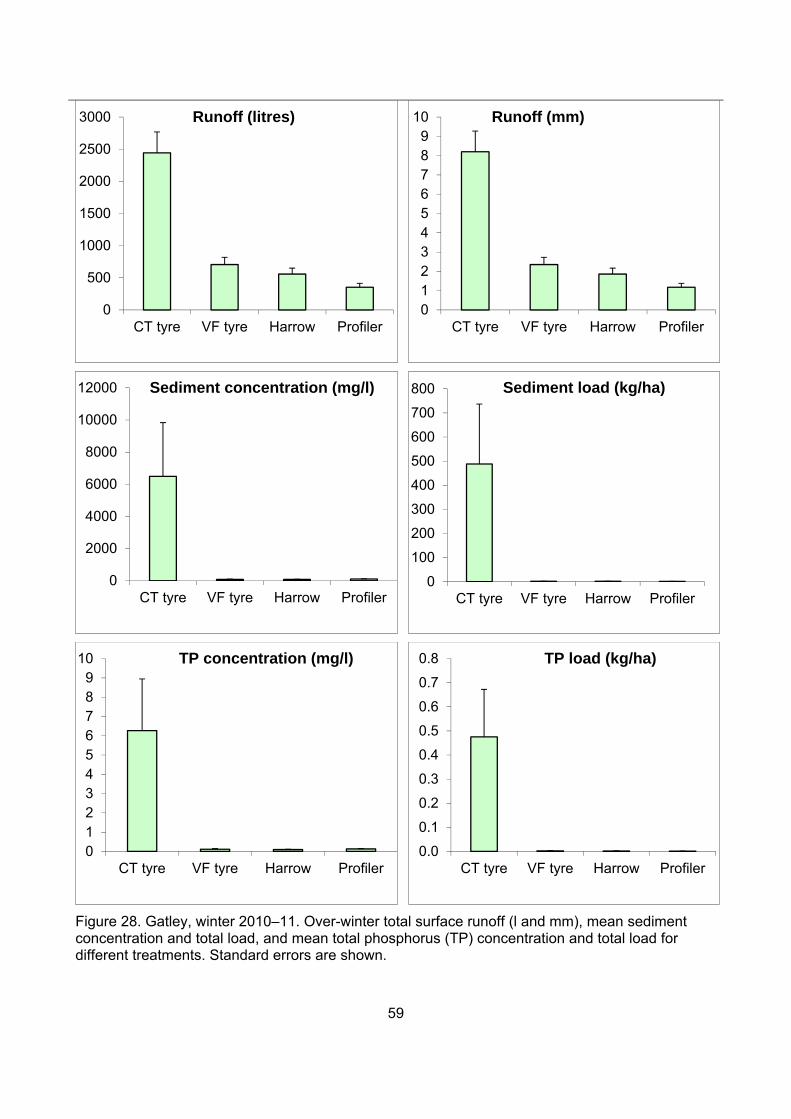

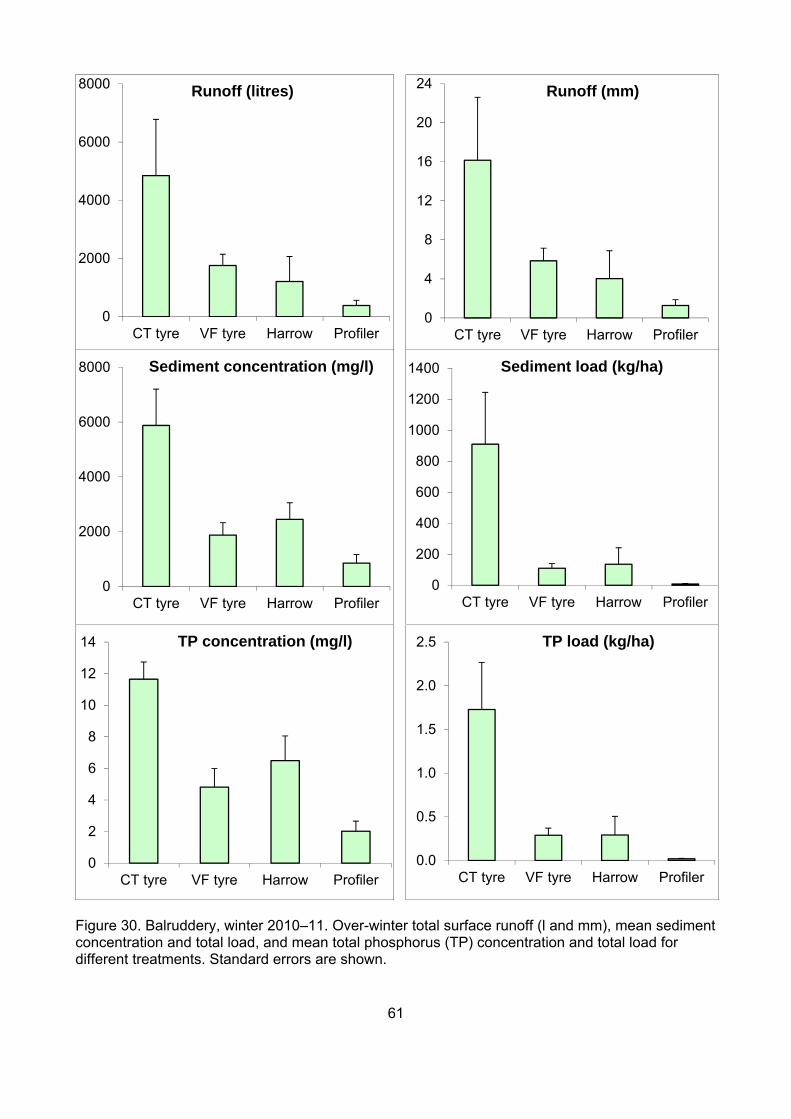
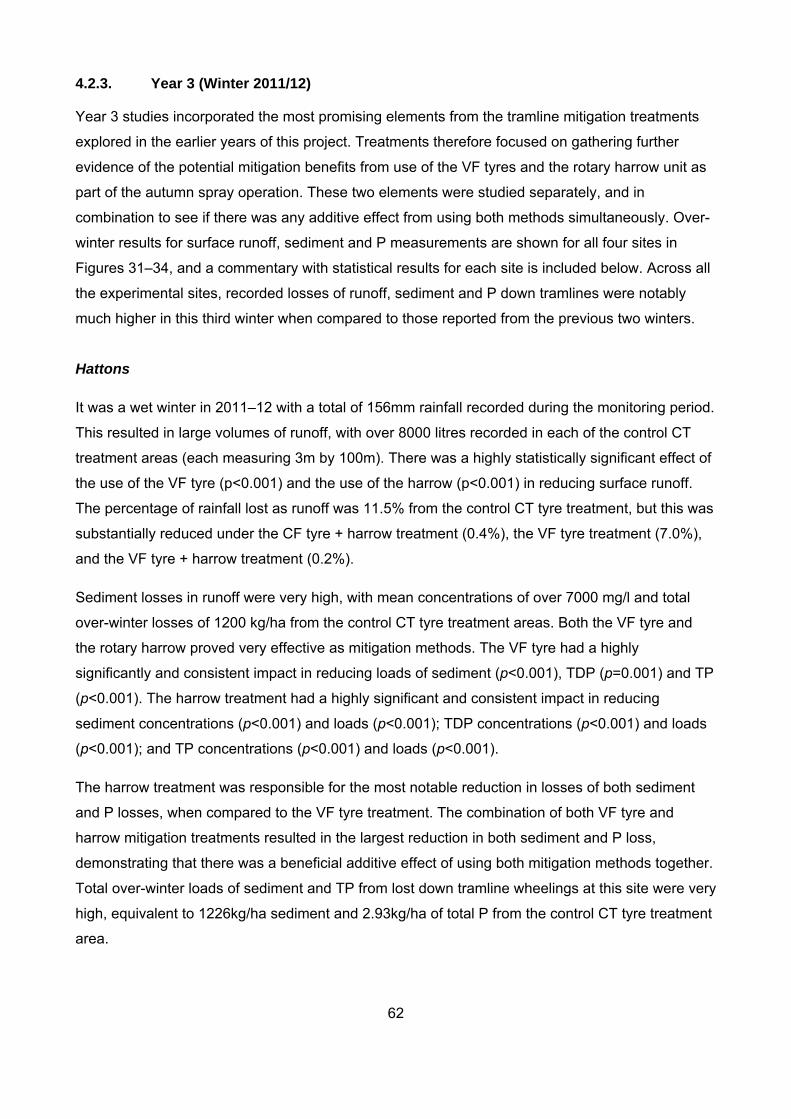


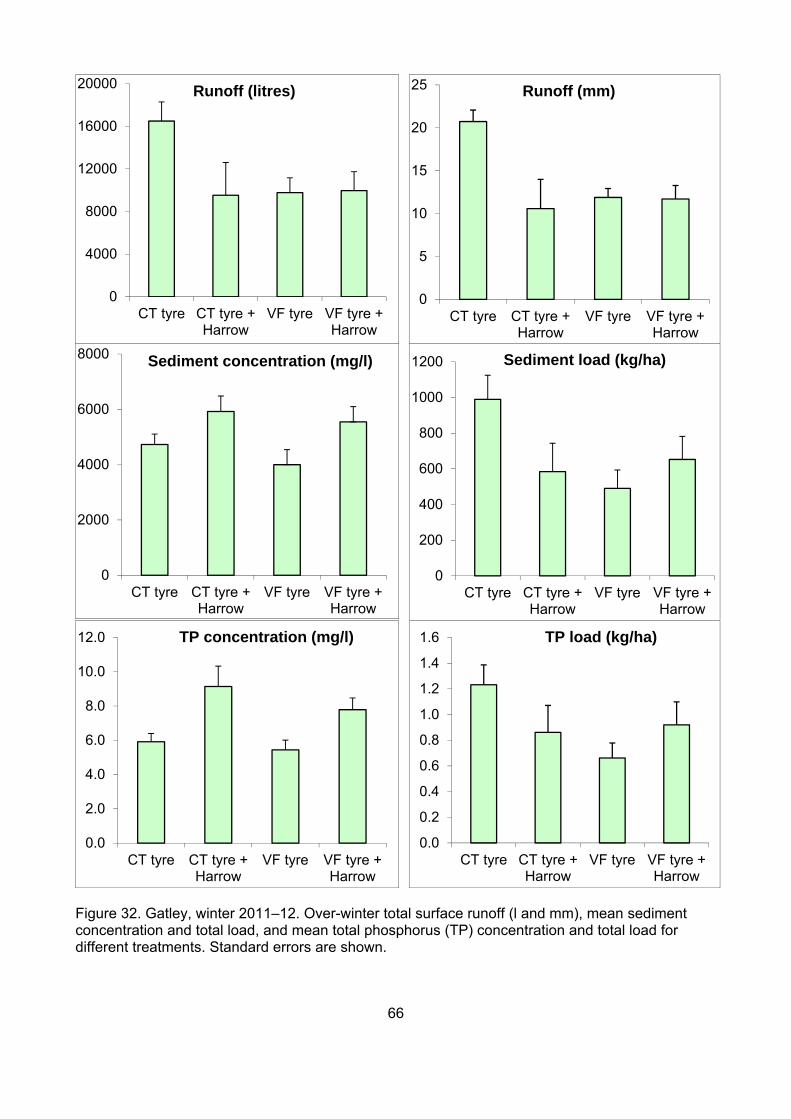


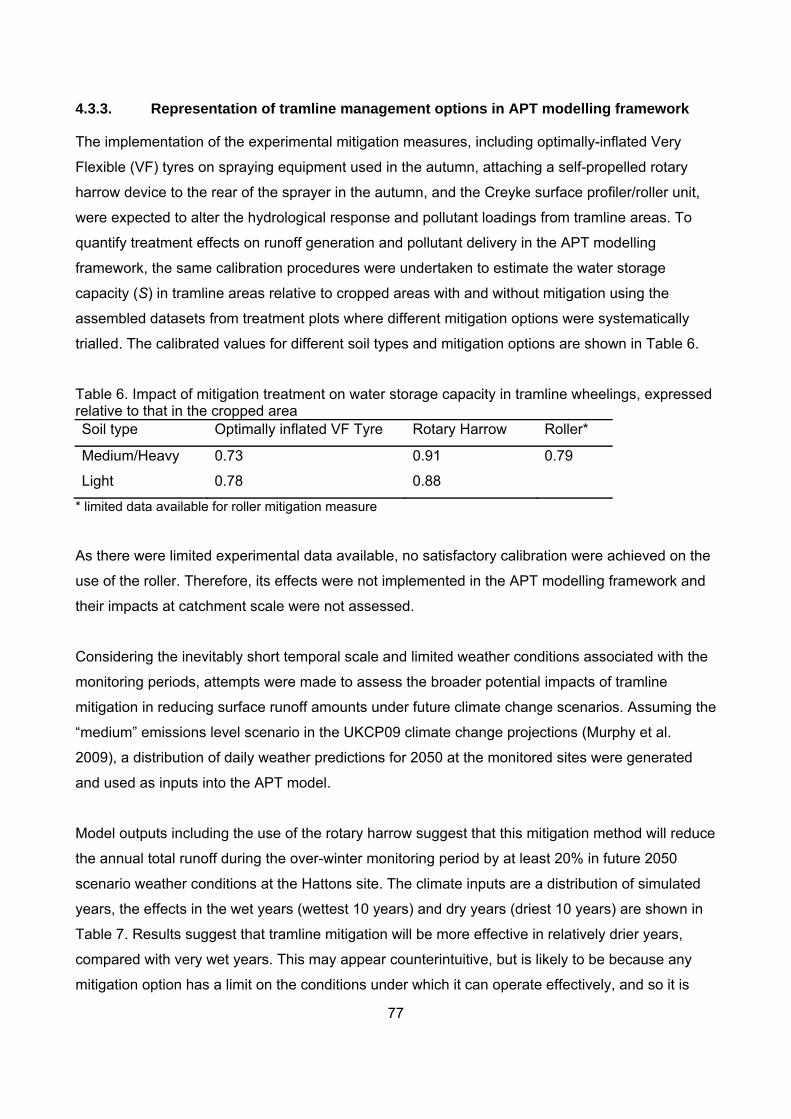

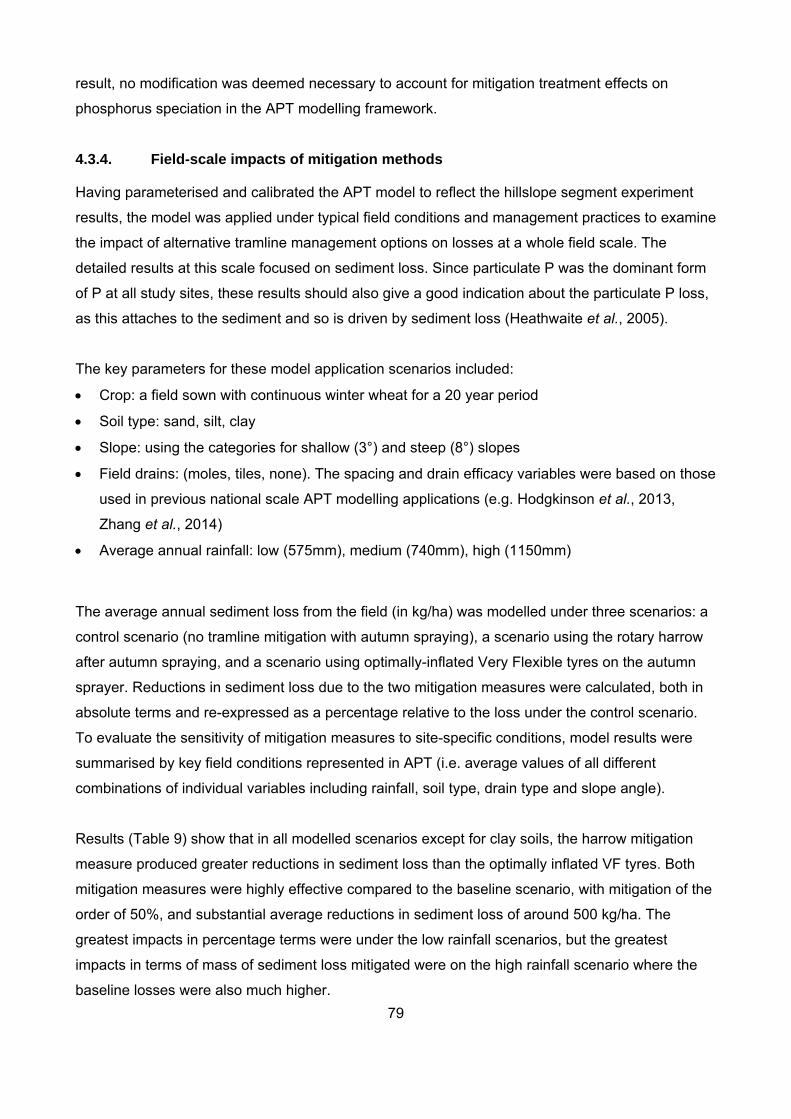

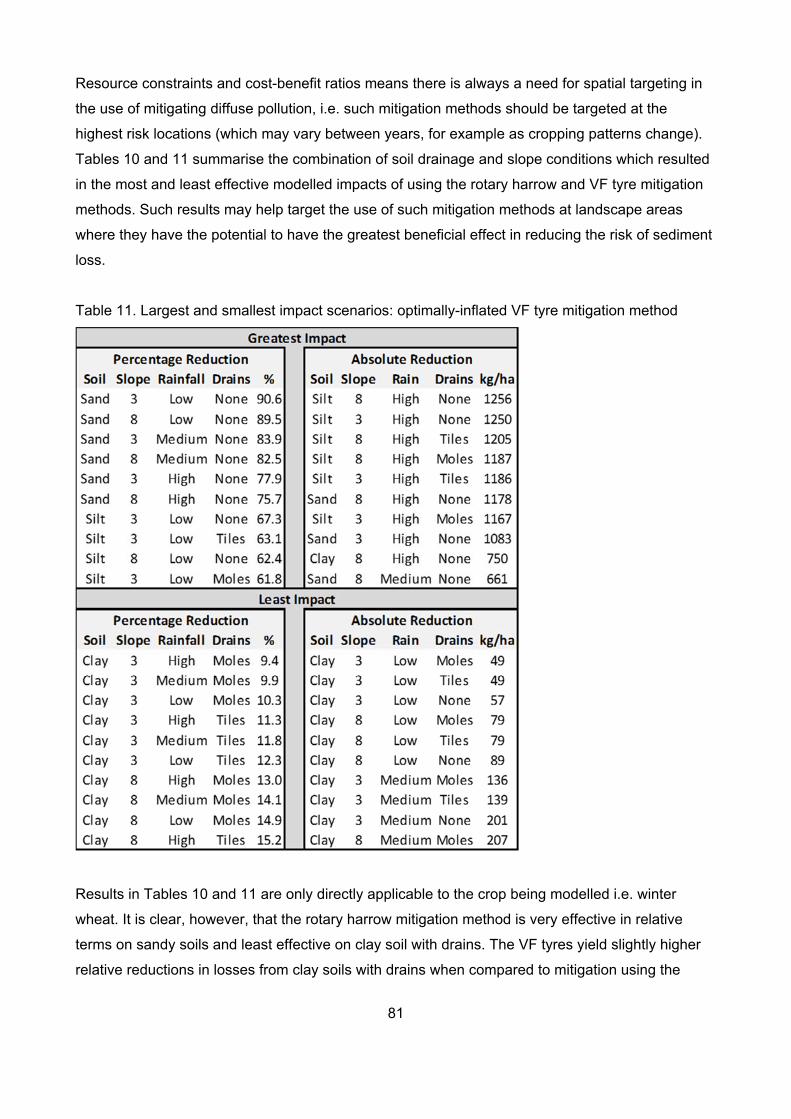
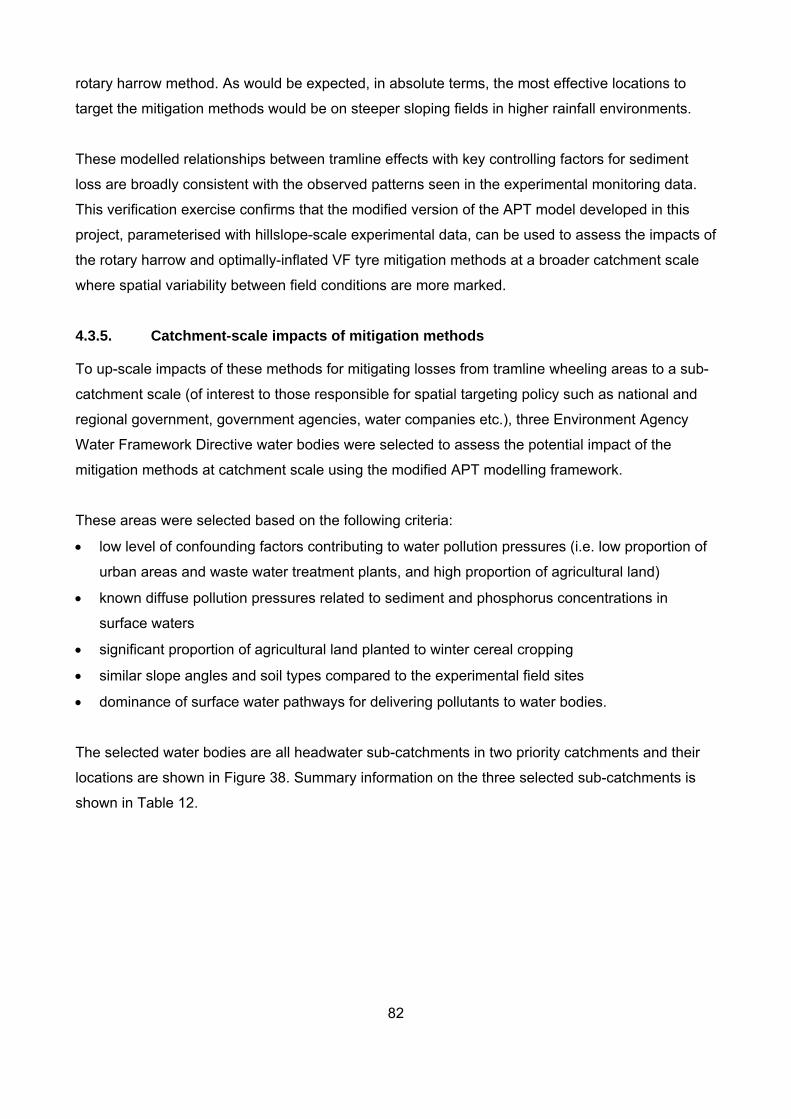


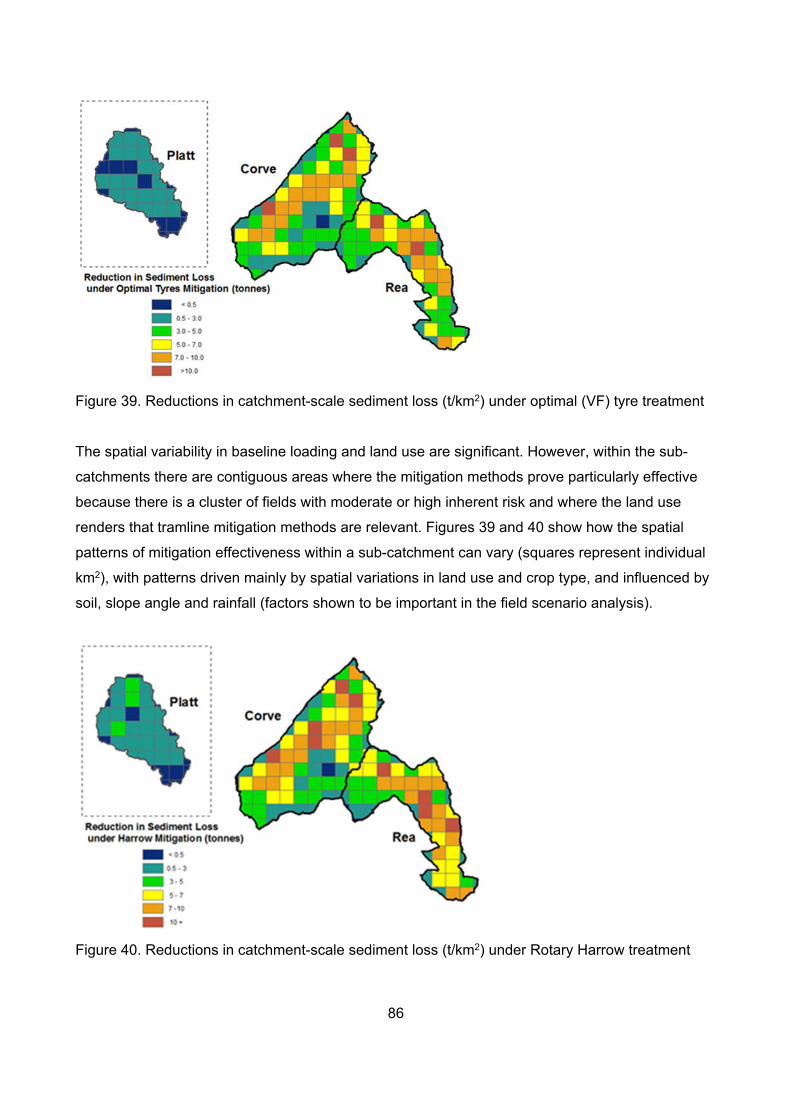
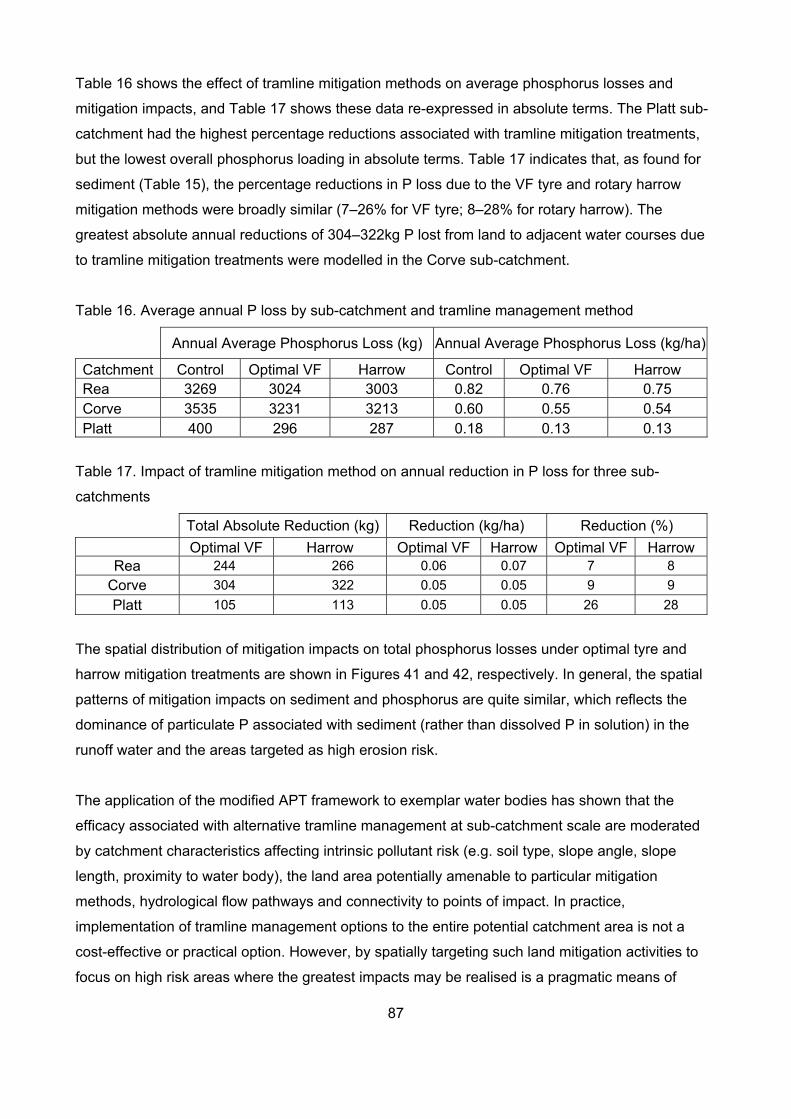
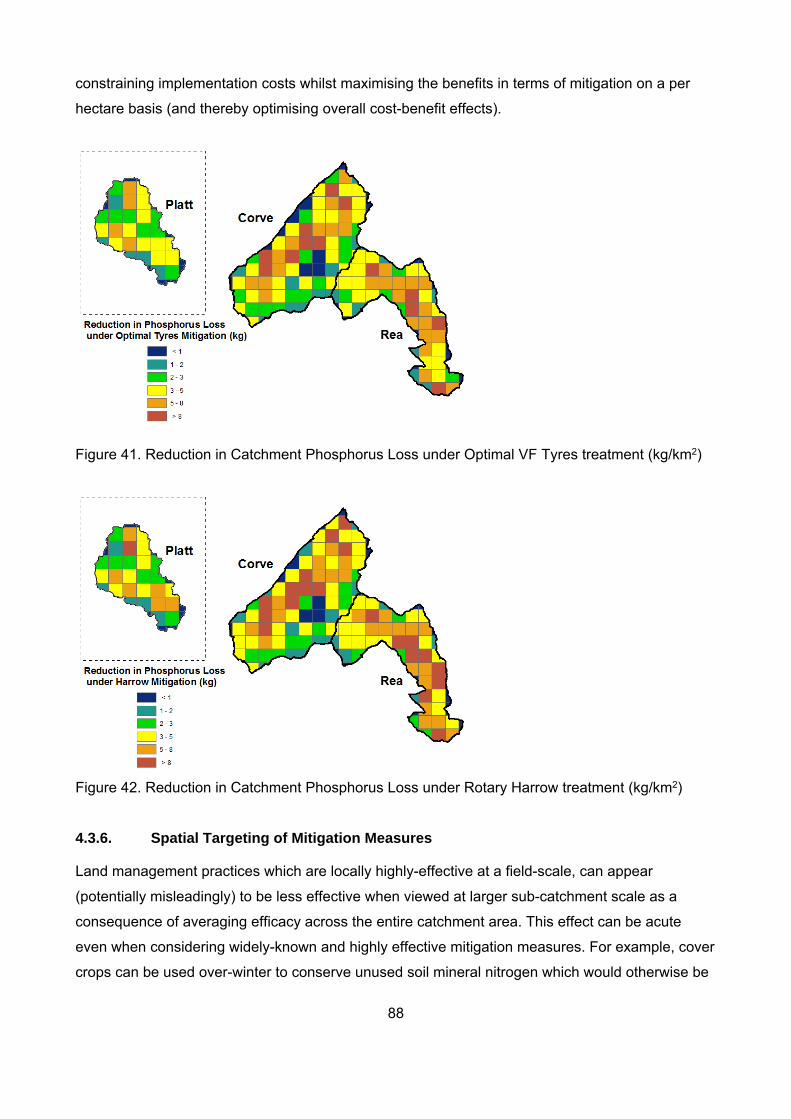

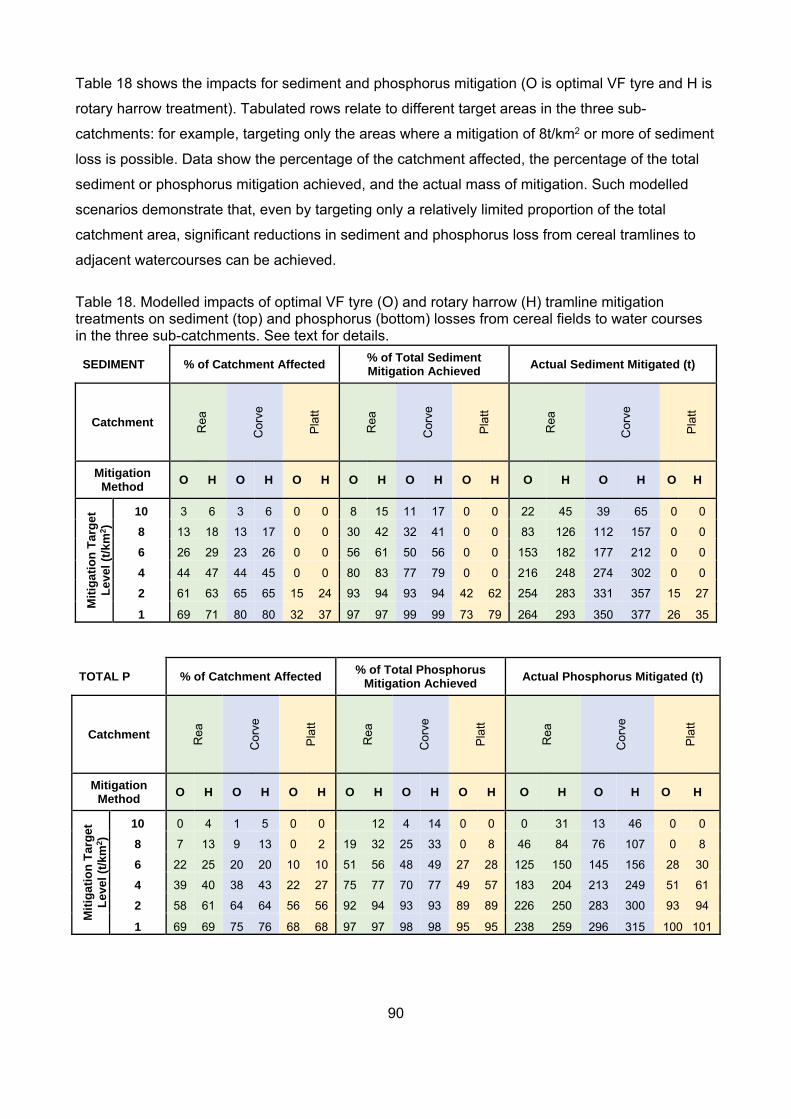

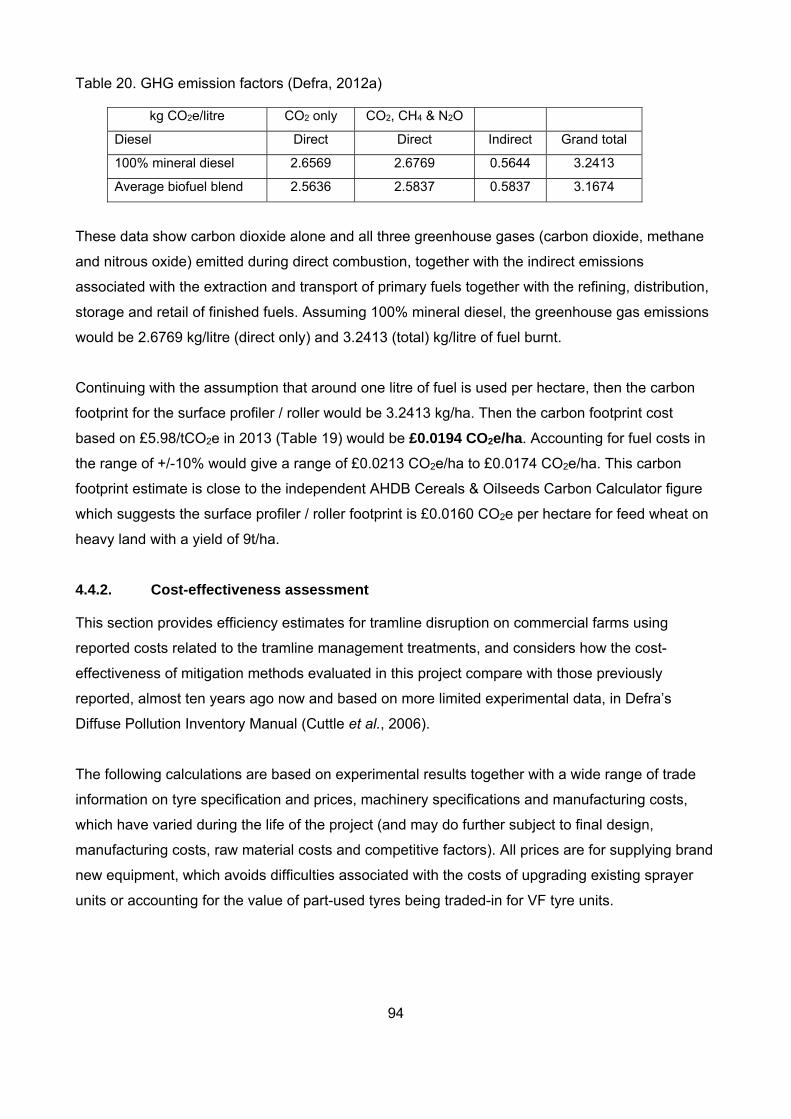
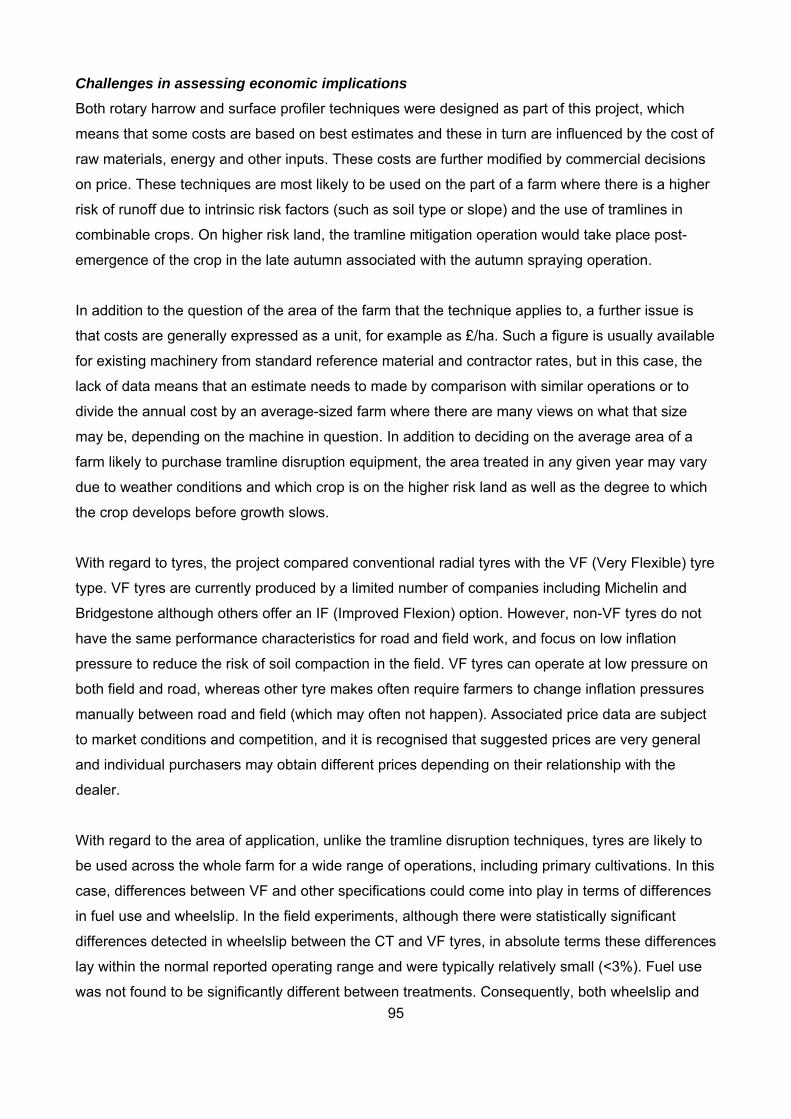

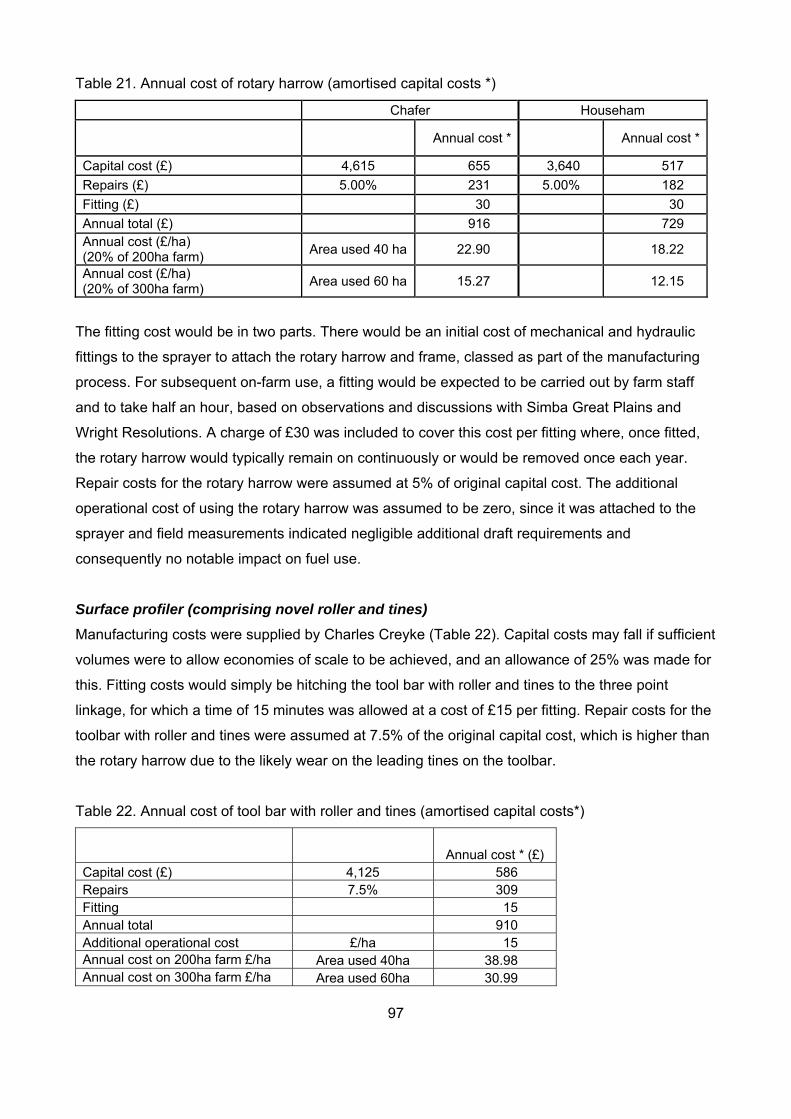


![Complimentary and personal copy for · ster (project-no. 2013–559-f-S, date of report: 08.04.2014) according to the IJSM ethical standards [14]. Written informed consent of patients](https://static.documents.pub/doc/80x56/6021c2f127f60a0e3311eeca/complimentary-and-personal-copy-for-ster-project-no-2013a559-f-s-date-of-report.jpg)


