47
Project Report On Application of Beneish Model On Selected Financial Statements
Project Report On
Application of Beneish Model On
Selected Financial Statements

Project Report
On
“Application of Beneish Model on
Selected Financial Statements”
Submitted to
Ishrat Jahan
Assistant Professor
School of Business & Economics
United International University
Submitted by
Md. Mesbahul Islam
ID No. 114 131 019
BBA in AIS
Spring -131
Date of submission: 05th June, 2018

iii
Letter of Transmittal
05th June, 2018
Ishrat Jahan
Assistant Professor
School of Business & Economics
United International University
Dear Ma’am,
It is an honor and awesome delight for me to present my project report on “Application of
Beneish Model on Selected Financial Statements”. This report was assigned to me for the
partial fulfillment of the requirement of BBA Program authorized by Accounting &
Information System (AIS), United International University.
The study I conducted enhanced my knowledge to make an executive report. This report has
given me an exceptional experience that might have immense uses in the future endeavors.
I sincerely hope that it would be able to fulfill your expectations. I value your participation and
I trust you will call upon me with any inquiries occasioned by this report.
Thanking you and looking forward to receive your cordial approval of my submission.
Yours Sincerely,
________________________
Md. Mesbahul Islam
BBA in AIS

iv
Acknowledgement
At first, I offer millions of heartfelt thanks to almighty Allah for his kindness on me in
accomplishing this report. I am also thankful to my supervisor Ms. Ishrat Jahan. The
achievement and ultimate result of this task required a considerable measure of direction and
help from my supervisor Ms. Ishrat Jahan and I am greatly advantaged to have this up and
completion of my project. All that I have done is just because of such supervision and help and
I would not forget to express gratitude toward her.
v
Abstract
The point of this study is to appraise the likelihood of fraud and earnings management for the
selected textile companies, Square Textile limited, Evince Textile Limited, Saiham Textile
Mills Limited, Alhaj Textile Mills Limited and Tosrifa Industries Limited are the five selected
textile companies which are used for my analysis. In this report I have provided the vast
knowledge of financial statement fraud and discussed the application of Beneish Model on
selected financial statement. In the context of financial statements, the Beneish model is used
to detect fraudulent behavior. My findings reveal that, Square Textile Limited, Evince Textile
Limited, Alhaj Textile Mills Limited and Tosrifa Industries Limited are the non-manipulator
companies because their M-score is less than -2.22. So, they don’t engage any manipulation
with their earnings in the financial year of 2016-2017. But the M-score of Saiham Textile Mills
Limited is more than, -2.22 which proves that the organization is probably going to be a
manipulator in the context of financial reporting year 2016-2017. Results also show that
Saiham textile Mills Limited have a problem in their accounting practices, through the
misrepresentation of Day's sales in receivables index and Depreciation Index. Next, it is
showed that the Sales Growth index and Leverage index have increased the possibilities of
manipulation. So, the using of the Beneish model may have detected fraudulent behavior,
through the year of 2016-2017 of Saiham Textile Mills Limited. I have also discussed the other
successful application of Beneish Model.
Contents
Chapter 1 ................................................................................................................................................. 9
Introduction .......................................................................................................................................... 10
Chapter 2 ............................................................................................................................................... 11
Organization Background ...................................................................................................................... 12
Square Textile Limited: ..................................................................................................................... 12
Mission .......................................................................................................................................... 12
Vision ............................................................................................................................................. 12
Evince Textile Limited ....................................................................................................................... 12
Company Overview ....................................................................................................................... 12
Mission: ......................................................................................................................................... 12
Vision: ............................................................................................................................................ 12
Saiham Textile Mills Ltd .................................................................................................................... 13
Vision: ............................................................................................................................................ 13
Mission: ......................................................................................................................................... 13
Alhaj Textile Mills Limited ................................................................................................................. 13
Company Overview ....................................................................................................................... 13
Vision ............................................................................................................................................. 13
Mission .......................................................................................................................................... 13
Tosrifa Industries ltd ......................................................................................................................... 14
Company Overview: ...................................................................................................................... 14
Mission .......................................................................................................................................... 14
Vision ............................................................................................................................................. 14
Chapter 3 ............................................................................................................................................... 15
Objective of the Report ......................................................................................................................... 16
Primary Objective ............................................................................................................................. 16
Secondary Objective ......................................................................................................................... 16
Chapter 4 ............................................................................................................................................... 17
Methodology ......................................................................................................................................... 18
Types of Data: ............................................................................................................................... 18
Secondary Data ............................................................................................................................. 18
Data Collection Procedure ............................................................................................................ 18
Data Processing ............................................................................................................................. 18
Scope of the Report ...................................................................................................................... 19
Limitation of the Report ................................................................................................................ 19
Chapter 5 ............................................................................................................................................... 20
Financial statement Fraud: ................................................................................................................... 21
Methods of Financial Statement fraud ............................................................................................. 21
Falsifying Entries: .......................................................................................................................... 23
General Red Flags for Fraud ......................................................................................................... 26
Earning Management: ................................................................................................................ 26
Beneish Model ...................................................................................................................................... 27
2. Gross Margin Index (GMI) ............................................................................................................. 27
4. Sales Growth Index (SGI) ............................................................................................................... 28
5. Depreciation Index (DEPI) ............................................................................................................. 28
7. Leverage Index (LVGI) ................................................................................................................... 29
Formula ............................................................................................................................................. 29
Interpretation ................................................................................................................................... 29
Limitation .......................................................................................................................................... 29
Chapter 6 ............................................................................................................................................... 30
Square Textile Limited ...................................................................................................................... 31
Input Variables .............................................................................................................................. 31
Calculations of M- Score ............................................................................................................... 31
Comment on M-score: ...................................................................................................................... 32
Evince Textile Limited ....................................................................................................................... 32
Input Variables .............................................................................................................................. 32
Calculations of M-score ................................................................................................................ 33
Comment on M-score: ...................................................................................................................... 33
Saiham Textile Mills Limited ............................................................................................................. 33
Input Variables .............................................................................................................................. 33
Calculations of M-Score ................................................................................................................ 34
Comment on M-score: ...................................................................................................................... 34
Alhaj Textile Mills Limited ................................................................................................................. 35
Input variables .............................................................................................................................. 35
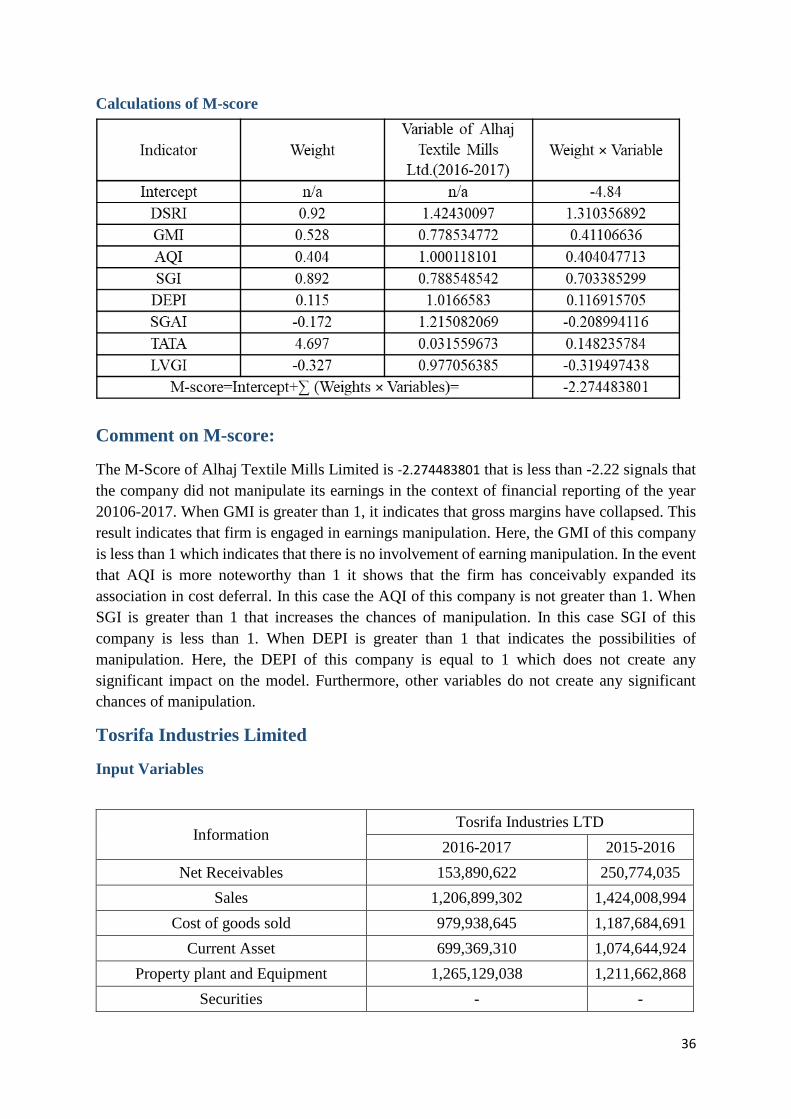
Calculations of M-score ................................................................................................................ 36
Comment on M-score: ...................................................................................................................... 36
Tosrifa Industries Limited ................................................................................................................. 36
Input Variables .............................................................................................................................. 36
Calculations of M-score ................................................................................................................ 37
Comment on M-score: ...................................................................................................................... 37
Comparability of Eight Variables with Five Selected Companies...................................................... 38
1. Days Sales in Receivables Index (DSRI) ..................................................................................... 38
3. Gross Margin Index (GMI) ......................................................................................................... 38
4. Sales Growth Index (SGI) ........................................................................................................... 40
5. Depreciation Index (DEPI) ......................................................................................................... 40
7. Total Accruals to Total Assets (TATA) ....................................................................................... 42
8. Leverage Index (LVGI) ............................................................................................................... 42
Chapter 7 ............................................................................................................................................... 44
Conclusion ............................................................................................................................................. 45
Chapter 8 ............................................................................................................................................... 46
References ........................................................................................................................................ 47

9
Chapter 1
Introduction
10
Introduction
Financial statements is a formal reporting activity of a company providing information about
its financial results and position. There are many users of company’s financial statements like:
investors, employees and group of people, customers, lenders and suppliers, governments and
their agencies and general public. Managers also use financial statements for internal decision
making process. The financial report are most valuable source of information for analysis any
company for this reason it is a publicly accessible documents in majority of countries.
The aim of the report is to apply and interpret Beneish M-Score as a fraud detection model on
financial statements of selected Textile companies.
This model can be helpful for banks, investors, creditors for entering a new business
relationship. They can find the probabilities of manipulation exist or not using this model.

11
Chapter 2
Organization Background
12
Organization Background
Square Textile Limited:
In 1997, Square entered the textile sector with its manufacturing facilities of cotton yarn.
Combining modern technology with skilled manpower under Square’s unique inspiring,
atmosphere, this new Square venture soon rose to the top of the local textile industry. Square
has more than 12 long periods of involvement in yarn spinning. The business is one of the
biggest maker of sewing and weaving yarns in Bangladesh. Now it has a standout amongst the
most refined vertically incorporated set-ups by which they are creating 90,000 kg of yarns each
day. They are perceived by their esteemed clients through quality items with conferred
administrations.
Mission
Their main goal is the shaft star of their vision for expansion of creation of value lifesaving
items and services entirely on moral and good gauges at least expenses to the general public
guaranteeing ideal advantages to the purchasers, the investors and different partners.
Vision
Their origination of business developed from the vision which considers it to be a way to the
prosperity of the speculators, partners, workers and individuals from the general public
everywhere by making new riches as products and ventures that go to fulfill the needs of every
one of them without conveying or harming the socio-natural adjust of the mother earth and the
procedure of human progress prompting quiet Co-presence of all the living creatures.
Evince Textile Limited
Company Overview
Evince Textile Limited was incorporated as a private Limited Company on June 03, 1999 under
the Companies act 1994. It was converted into a public Limited Company on June 04, 2013.
The commercial operation of the company started on May 02, 2003. The company
manufactures and sells cotton yarn dyed woven fabrics for brands and retailers. It also offers
readymade garments. The company also exports its products.
Mission:
To be the most admired company in the textile industry of Bangladesh by producing and
supplying quality products to customers of competitive prices while following ethical business
processes so that.
Vision:
To gain market leadership in the yarn dyed woven fabric manufacturing industry.
Use innovation and speed as the driving factors for progress.
To produce various types of premium yarn dyed fabrics for global retailers and brands.

13
To be a good corporate citizen
Ensure environment friendly and ethical process flow
Saiham Textile Mills Ltd
Saiham Textile Mills Limited was incorporated on March 27, 1981 as a public Limited
company. They have successfully positioned their selves as a leading integrated cotton
manufacturer, trusted by some of the largest global brands in Bangladesh and world across.
Vision:
They seek to keep up our authority position in the Textile Industry by creating the best quality
different tallies of yarns and turning into a dependable business accomplice of their purchaser and
providers.
Protect the enthusiasm of our investor through feasible development and esteem
creation
Preserve the trust of all our partner by receiving moral business rehearses
Support the general public through corporate social duty activity.
Mission:
Trust: Preserve the faith and goodwill of all our Shareholders buyers, suppliers and the society
at large.
For the Society: Contribute to the well-being of the society in general by acting as a responsible
corporate citizen
Their goal: Long term maximization of shareholders value in a society responsible manner.
Alhaj Textile Mills Limited
Company Overview
Alhaj Textile Mills Limited manufacturers and sells cotton yarns in Bangladesh. It offers
cotton, polyester spun, poly viscose blend, poly cotton blend, and viscose spun yarns. The
company also exports its products primarily to South American market, which includes Peru,
Brazil, Columbia, Chile, Ecuador, Guatemala, Argentina, and other countries. Alhaj Textile
Mills Limited was incorporated in 1961 and is headquartered in Dhaka, Bangladesh.
Vision
They are focused on turning into the head fabricating association in the material business keeping up
advertise authority in the present business and differentiating into esteem included tasks with the
question of amplifying returns for every one of the partners.
Mission
To turn into a main and dependable material industry, which comprehends the human
prerequisites and acts to adjust these necessities by creating world-class items,
keeping in see the social, monetary and ecological worries of the country.

14
To remain at the front line of mechanical prevalence by receiving, absorbing,
understanding, actualizing crisp imaginative ideas for the advancement of the
Industry, Community and the Country.
Tosrifa Industries ltd
Company Overview:
Tosrifa Industries Limited (TIL) is a 100% export oriented readymade knit garments
manufacturing Company .The Company was incorporated on August 27,2002 as a private
limited Company under the Companies Act 1994. It commenced commercial operation in
2005.
Mission
Exceed their client's desires conveying right items in opportune time with exceed
expectations quality and client benefit.
Develop their Human Resource and transform them into asset.
Take a part to the enhancement of our Society and Green Marketing
To maximize share value
Vision
They are engaged to be the most favored name to their partners – clients, representatives,
providers, investors and society.

15
Chapter 3
Objective of the Report

16
Objective of the Report
Primary Objective
To accomplish the partial requirement of BBA Program authorized by Accounting &
Information System (AIS), United International University.
Secondary Objective
To know about the financial statement fraud and fraud detections models of financial
statement.
To know about the Beneish Model and gather a clear idea of its application
To prove my theoretical knowledge in real practical field.
To estimate the probabilities of manipulation of the selected companies
17
Chapter 4
Methodology of the Study

18
Methodology
It refers to the specific procedures or techniques used to identify, select, process, and analyze
information applied to understanding the problem, thereby, allowing the reader to critically
evaluate a study’s overall validity and reliability. Here, the object of the study were financial
statements of five companies. For this study I chosen textile companies.
Types of Data: There are two types of data.
Primary Data: When the data is collected from a source of origin where the data generate then
it is known as primary data. In this study I didn’t use any primary data.
Secondary Data: When the data is collected from a secondary source like the source of
reservation storage where the data is collected by one person and used by other agency then it
is known as secondary data.
This report is based on secondary data. There is no use of primary data.
Secondary Data
Annual report of Selected Companies
Companies official website
Data Collection Procedure
I had used documents and records technique for collecting the specific data for my analysis. I
had visited the official websites of selected companies for downloading the annual report.
Target Source:
The target source of information is Official Websites of the selected companies.
Population:
The population is annual report of the selected companies.
Sample Size
Population Sample Unit Sample Size
Annual Report Financial Statements 5
Data Processing
Computer system and analysis technique (Beneish Model) were used for processing the data
and this detail analysis work is included in the report.

19
Scope of the Report
The area of my report is focused on Application of fraudulent detection model Beneish M-
Score on Selected Financial Statements. I had selected Textile companies for this analysis. The
model helps to find out the companies who are manipulating with their earnings. The data of
financial statements was used for calculating variables in the context of financial year 2016-
2017. Two years data were used for calculations.
Limitation of the Report
In the way of finishing this report I had faced a little bit of problems and limitations and those
are given bellow
Lack of opportunity to access to internal data
Only secondary data is used for preparing this report
Missing amounts hamper the variables calculations
20
Chapter 5
Financial statement Fraud

21
Financial statement Fraud:
Financial statement fraud is the deliberate misrepresentation of the information used to prepare the
financial statements in order to mislead the users of financial information and create a rosy picture
of the company’s financial position, performance, and cash flows. The frauds are generally done
for achieving financial target, sales or budget projections. The reason of this misrepresentation are
to expand share costs of freely recorded organizations or to acquire back on more positive
conditions. Another reason can be demonstrated a lower assessable pay with a specific end goal to
decrease an expense risk. The financial statement is prepared by the management so most of the
time they are involved with these fraud.
Numerous speculators and consultants rely upon quarterly or month to month comes about
produced by an organization, particularly open association. The financial statement’s information
is very important for these investors so company officers pay more attention. Sometimes they can
do anything for achieving desired result. Sometime those actions are fraudulent.
There are two objective of these fraud.
1. To make the performance look better than reality (to entice investment or to make the figures)
2. To make the performance look worse (to lower the company’s tax liability).
Investors, shareholders or financiers are the main victim of these frauds. When the fraud are
exposed the share prices fall and for this reason they lose the value of their investment. In this
situation the company is not the main offender but some people from the top management are the
main culprit.
Methods of Financial Statement fraud
Manipulation Timing:
According to the matching principle in accounting, revenue should be recorded when the
revenue is earned and expense should be recorded when the expense is occurred. There are two
different ways of controlling planning. The two strategies influence the present time frame to
look great, yet will make issues in the following time frame.
22
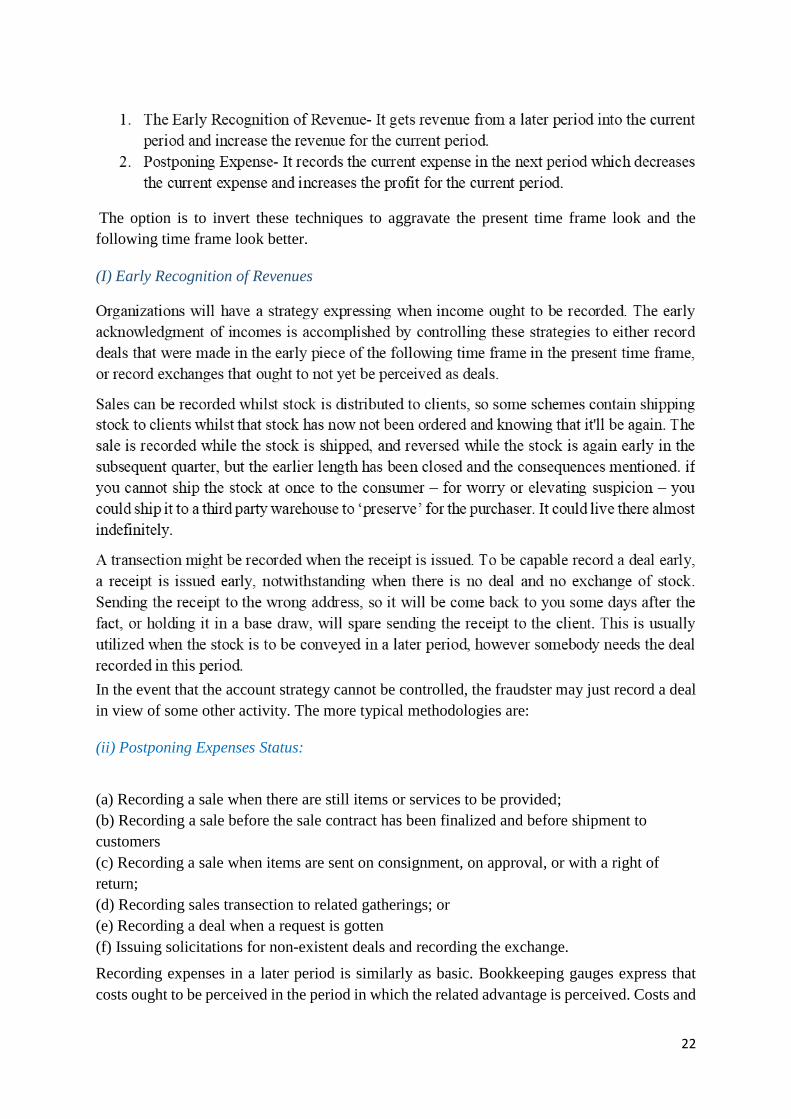
The option is to invert these techniques to aggravate the present time frame look and the
following time frame look better.
(I) Early Recognition of Revenues
In the event that the account strategy cannot be controlled, the fraudster may just record a deal
in view of some other activity. The more typical methodologies are:
(ii) Postponing Expenses Status:
Recording expenses in a later period is similarly as basic. Bookkeeping gauges express that
costs ought to be perceived in the period in which the related advantage is perceived. Costs and
(a) Recording a sale when there are still items or services to be provided;
(b) Recording a sale before the sale contract has been finalized and before shipment to
customers
(c) Recording a sale when items are sent on consignment, on approval, or with a right of
return;
(d) Recording sales transection to related gatherings; or
(e) Recording a deal when a request is gotten
(f) Issuing solicitations for non-existent deals and recording the exchange.

23
their related liabilities ought to be recorded when a legitimately restricting commitment has
been made. Most organizations will likewise have strategies about when costs ought to be
recorded and paid.
Expenses might be recorded when the cost is usually paid, wherein case the cost isn't paid until
the ensuing time frame and recorded by then. expansive charges might be shamefully promoted
and discounted over a length instead of being costs inside the forefront time frame, or promoted
costs can be composed off (deteriorated or amortized) over a broadened length than suitable.
This reduces the sum recorded as costs inside the front line time frame and puts a portion of
the cost is later periods.
These movements raise up the income every cutting-edge duration. Doing the plan backward
(postponing recording deals and recording costs early) brings down an income with an end goal
to limit an expense risk.
Falsifying Entries:
Falsifying entries are those entries that create a fake illustration of any transaction which is not
always exist.
(i)Fictitious Revenues:
These revenues may be generated 2 different way:
a) Inventing sales transactions; or
b) Classifying other income or gain as sales.
Enterprises can also go for any transactions that on paper take region to be sales however the
income don’t fulfill the substance or do not create any advantage. In the event that that trigger
is the payload of stock, one character ships stock to another and report a deal, though that the
stock transformed into not the slightest bit requested and will be bring down back. The record
receivable related with that deal might be turned around at some later stage. Recording the
return of the stock as a rate and not contrary to wage will hold the high deals arrange.

24
In the event that salary are recorded when orders are set by method for providers, imaginary
requests might be made. Stock can be dispatched on committal, anyway reserved as a deal.
Issuing imaginary solicitations for deals that never occured for can make recordable deals in
the present term. They might be switched in a future length.
Entire exchanges can be developed that supply the apparition of an exchange that makes
income. Little nonpublic associations don't have the administrative our bodies take a gander at
their measurements.
Distinctive non-income additions will likewise be recorded as deals. Venture pay, capital
increases at the offer of advantages and other onetime additions might be recorded as deals to
influence the inside business to appear to be healthy. Things like decreases and refunds from
providers and distinctive non-deals infusions of money from advances et cetera. May
likewise be recorded as wage.
(ii) Manipulating Liabilities and Expenses
Controlling or adulterating liabilities and costs is improved the situation an indistinguishable
two reasons from alternate plans:
1. To improve the organization hope to expand share costs or for speculation purposes; or
2. To minimize the duty risk. This can be done in a variety of ways.
Downplaying arrangements for unforeseen charges influences an adjusting to sheet appear to
be more beneficial. A business undertaking need to both ascertain differing arrangements (for
terrible obligations, deals returns, representative privileges, assessment et cetera.) and consider
them inside the soundness sheet; or take into account perceived arrangements with a view to
cover in excess of one accounting term.
25
(iii) Valuing assets
There are numerous methods for swelling the estimations of or making resources. The ones
said beneath are only a couple of them.
Inventory
Inventory can be the real resource claimed by a business and can be one of the simplest to
control. There are a couple of methods for doing this.
Accounts Receivable
Accounts receivable is the transaction which might be because of the enterprise, and which are
anticipated to pay. So it becomes a bendy method as the hope of charge is relevant matter. A
few corporations have loan provider which have connected with them for some periods.
Growing loan provider and income is a simple credit score income / debit borrower’s access.
Little gatherings that don't have their obligations inspected might be fit for break out with is
while scanning for back. Growing false sales will usually have a longer effect of growing
debtors.

26
General Red Flags for Fraud
Association of Certified Fraud Examiners (ACFE) says, fraud offender shown minimum one
of the criteria from these following red flags in almost 80% of all fraud cases:
Living beyond their means
Having personal financial difficulties, ongoing separation, or family issues
Being surprisingly close with a seller or client
Having "control issues" or being viewed as a "wheeler-merchant"
At a forensic level, the accompanying circumstances should raise worry as conceivable pointers
of misrepresentation:
Missing/adjusted reports
Discrepancies and unexplained things on bookkeeping compromise
Increasing income without a relating development in income
A critical uptick in the organization's execution amid the last revealing time of the
monetary year
Significant or unordinary changes in resources or liabilities
High income figures amid a period in which contenders are in a downturn
Disclosures that seem to have no sensible business reason
Loans or rewards with no legitimate clarification
Earning Management:
Earning management is any other manner of manipulating accounting data and financial
reporting done by way of the managers. Earning management is the misuse of accounting
strategies to produce financial reports that display an excessively nice view of an employer's
commercial enterprise activities and economic function. Agency’s management desires many
accounting regulations and principles for choice making. Earning management inquires benefit
of ways accounting principles are used and generates economic statements that inflate earnings,
revenue or total assets.

27
Beneish Model
In 1999, Banish Model is developed by Professor Messod Daniel Beneish. It is a statistical
model which conducts monetary proportions and eight factors to see if an organization has
controlled its profit. The information of the organization's money related explanations is
utilized for making the factors. When the variables are created they are calculated for
developing an M-Score to narrate the degree to which the earnings have been manipulated.
Beneish profiled firms that are likely to manipulate earnings (firms either charged with
manipulation by the SEC, or admitted to manipulation in the public press) and developed a
statistical model to discriminate manipulators from non-manipulators. Therefore, this model
helps to uncover companies that are likely to manipulate their reported earnings. Furthermore,
Beneish and Nichols (2009) refined this model with five and eight variables for detecting
financial statement fraud.
The Beneish M-Score is calculated using 8 financial ratios. The eight variables are:
1. DSRI - Days' sales in receivable index
2. GMI - Gross margin index
3. AQI - Asset quality index
4. SGI - Sales growth index
5. DEPI - Depreciation index
6. SGAI - Sales and general and administrative expenses index
7. LVGI - Leverage index
8. TATA - Total accruals to total assets
DSRI = (Net Receivablest / Salest) / (Net Receivablest-1 / Salest-1)
2. Gross Margin Index (GMI)
GMI is proportion of the gross edge in a year ago (t-1) to the gross margin in current year (t).
At the point when GMI is more prominent than 1, it demonstrates that gross margin have
fell.This result indicates that firm is engaged in earnings manipulation. It is calculated by,
GMI = [(Salest-1 - COGSt-1) / Salest-1] / [(Salest - COGSt) / Salest]
28
4. Sales Growth Index (SGI)
SGI is the ratio of sales in current year t to sales in last year t-1. If growth firms face tremendous
decrease in stock prices then they may have greater incentives to manipulate earnings. It is a
positive relation between SGI and the probability of earnings manipulation. It is calculated by,
SGI = Salest / Salest-1
5. Depreciation Index (DEPI)
DEPI is the proportion of the rate of devaluation in a year ago t-1 versus the comparing rate in
current year t. The deterioration rate in a present year is equivalent to devaluation/(devaluation
+ net PPE). At the point when DEPI is more noteworthy than 1 it demonstrates that the rate at
which resources are deteriorated has backed off - raising the likelihood that the firm has
controlled with the devaluation technique for expanding the pay subsequently it shows the
positive connection amongst DEPI and the likelihood of manipulation.it is computed by,
DEPI = (Depreciationt-1/ (PP&Et-1 + Depreciationt-1)) / (Depreciationt / (PP&Et +
Depreciationt))
29
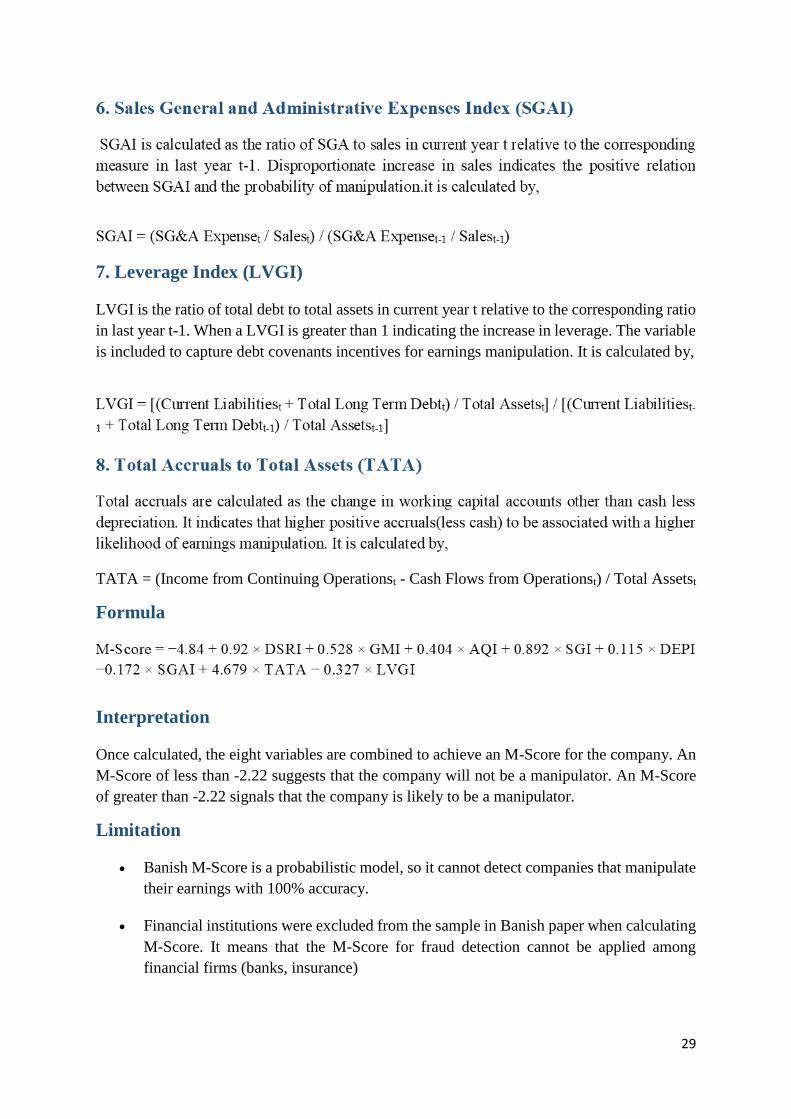
7. Leverage Index (LVGI)
LVGI is the ratio of total debt to total assets in current year t relative to the corresponding ratio
in last year t-1. When a LVGI is greater than 1 indicating the increase in leverage. The variable
is included to capture debt covenants incentives for earnings manipulation. It is calculated by,
TATA = (Income from Continuing Operationst - Cash Flows from Operationst) / Total Assetst
Formula
Interpretation
Once calculated, the eight variables are combined to achieve an M-Score for the company. An
M-Score of less than -2.22 suggests that the company will not be a manipulator. An M-Score
of greater than -2.22 signals that the company is likely to be a manipulator.
Limitation
Banish M-Score is a probabilistic model, so it cannot detect companies that manipulate
their earnings with 100% accuracy.
Financial institutions were excluded from the sample in Banish paper when calculating
M-Score. It means that the M-Score for fraud detection cannot be applied among
financial firms (banks, insurance)
30
Chapter 6
Analysis and Findings
31
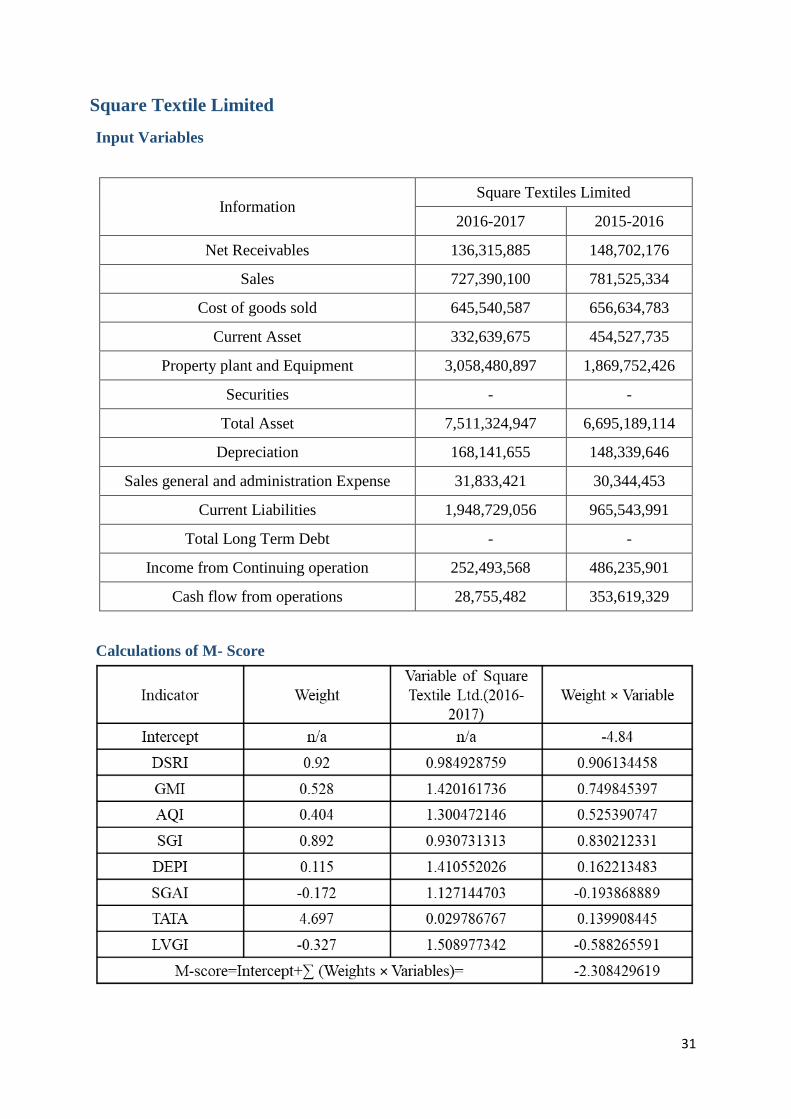
Square Textile Limited
Input Variables
Information Square Textiles Limited
2016-2017 2015-2016
Net Receivables 136,315,885 148,702,176
Sales 727,390,100 781,525,334
Cost of goods sold 645,540,587 656,634,783
Current Asset 332,639,675 454,527,735
Property plant and Equipment 3,058,480,897 1,869,752,426
Securities - -
Total Asset 7,511,324,947 6,695,189,114
Depreciation 168,141,655 148,339,646
Sales general and administration Expense 31,833,421 30,344,453
Current Liabilities 1,948,729,056 965,543,991
Total Long Term Debt - -
Income from Continuing operation 252,493,568 486,235,901
Cash flow from operations 28,755,482 353,619,329
Calculations of M- Score
32
Comment on M-score:
The value of the M-Score of Square Textile Limited is -2.308429619 in 2016-2017. According
to Beneish Model, when the value of the M- Score is greater than - 2.22 then the company is
likely to be a manipulator. A massive growth in days´ sales in receivables can be the end result
of a change in credit coverage to be able to assist income, but a “no longer proportionate”
growing in receivables for income can be a clean symptom of an "adjustment" of the earnings.
This is happened when the profit is over sated. An SGI more than 1 shows that sales are
growing over the preceding 12 months. If growth organizations face big inventory charge
losses at the first indication of a slowdown, they will have more incentives than non-increase
agencies to govern income. Though the indicators DSRI, GMI, AQI, DEPI and LVGI indicates
significant change in receivables, sales, gross margin, asset structure, deprecation and debt of
the company, the overall M-Score is less than -2.22. So the company did not manipulate its
financial statements in the context of financial reporting of the year 2016-2017.
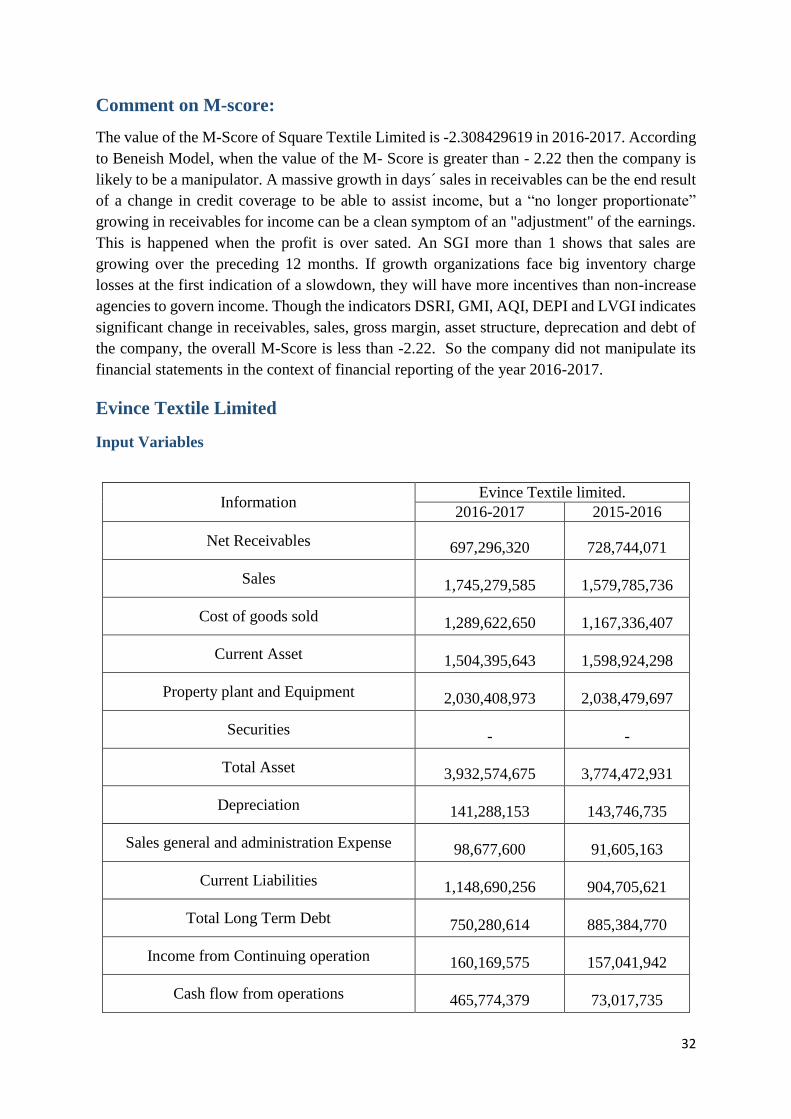
Evince Textile Limited
Input Variables
Information Evince Textile limited.
2016-2017 2015-2016
Net Receivables 697,296,320 728,744,071
Sales 1,745,279,585 1,579,785,736
Cost of goods sold 1,289,622,650 1,167,336,407
Current Asset 1,504,395,643 1,598,924,298
Property plant and Equipment 2,030,408,973 2,038,479,697
Securities - -
Total Asset 3,932,574,675 3,774,472,931
Depreciation 141,288,153 143,746,735
Sales general and administration Expense 98,677,600 91,605,163
Current Liabilities 1,148,690,256 904,705,621
Total Long Term Debt 750,280,614 885,384,770
Income from Continuing operation 160,169,575 157,041,942
Cash flow from operations 465,774,379 73,017,735

33
Calculations of M-score
Comment on M-score:
The Beneish M-Score of the Evince Textile Limited is -2.902137503 in the year of 2016-
2017.When the GMI is greater than 1, then the chances of manipulation is increased. The
deterioration of gross margin is a bad sign which may drive managers to manipulate profits. In
this case the GMI is less than 1. So this variable does not increase the possibility of
manipulations. When AQI is more than 1, the company has doubtlessly improved its
involvement in cost deferral. In this case AQI is less than 1.When a SGAI more than 1 indicates
that the value of promoting, general and administrative expenses extended proportionally
greater than income. In this case SGAI is less than 1. So, the result of eight variables did not
have any significant changes and the value of M-score is less than -2.22, therefore it can be
stated that based on the result of the Beneish M-Score, the Evince Textile Limited did not
engage with any manipulation in the context of financial reporting year 2016-2017.
Saiham Textile Mills Limited
Input Variables
Information Saiham Textile Mills Limited
2016-2017 2015-2016
Net Receivables 31,127,784 19,947,500
Sales 1,529,634,985 1,639,897,819
Cost of goods sold 1,297,995,301 1,442,917,395

34
Current Asset 2,468,784,623 2,109,435,840
Property plant and Equipment 1,879,452,117 1,929,529,957
Securities - -
Total Asset 4,348,236,740 4,038,965,797
Depreciation 43,336,028 45,094,956
Sales general and administration Expense 140,269,673 137,042,616
Current Liabilities 1,742,776,194 1,340,210,241
Total Long Term Debt - 153,618,757
Income from Continuing operation 92,381,746 76,829,256
Cash flow from operations 68,160,929 (309,687,884)
Calculations of M-Score
Comment on M-score:
The calculated value of Beneish M-Score of Saiham Textile Mills Limited is -2.046445152 in
the context of annual report 2016-2017. When days sales in receivables are increased it may d
be a final result of increased in sales for sustaining the competitive market or a manipulation
with amount of turnover. In this case DSRI has significantly increased which increases the
possibilities of manipulation. The result of GMI and AQI are okay. If growth firms face
tremendous decrease in stock prices then they may have greater incentives to manipulate
earnings. It is a positive relation between SGI and the probability of earnings manipulation.
The result of SGI is poor which is positively increases the chance of manipulation. Though
TATA has no significant change. At the point when the DEPI more prominent than 1
demonstrates that the cost at which unmistakable resources are being devalued has impeded

35
raising the open door that the organization has changed upward the appraisals of benefits' useful
lives or took after another procedure this is benefits developing. In this case DEPI is more than
1 that increases the possibilities of manipulation. When a LVGI is greater than 1 indicating the
increase in leverage. The variable is included to capture debt covenants incentives for earnings
manipulation. Here, the LVGI is greater than 1 which increases the possibilities of
manipulation. The overall value of the M-Score is -2.046545417 which is greater than -2.22.
So the company is likely to be a manipulator.
Alhaj Textile Mills Limited
Input variables
Information
Alhaj Textile Mills Limited
2016-2017 2015-2016
Net Receivables 2,718,845 2,420,774
Sales 293,285,408 371,930,696
Cost of goods sold 251,184,421 330,364,349
Current Asset 448,222,910 402,727,563
Property plant and Equipment 104,057,958 115,705,869
Securities - -
Total Asset 553,281,709 519,434,273
Depreciation 1,501,184 1,697,436
Sales general and administration Expense 19,095,273 19,929,290
Current Liabilities 154,757,962 143,258,393
Total Long Term Debt 139,123,633 139,123,633
Income from Continuing operation 32,003,317 25,644,972
Cash flow from operations 14,541,927 102,309,216
36
Calculations of M-score
Comment on M-score:
The M-Score of Alhaj Textile Mills Limited is -2.274483801 that is less than -2.22 signals that
the company did not manipulate its earnings in the context of financial reporting of the year
20106-2017. When GMI is greater than 1, it indicates that gross margins have collapsed. This
result indicates that firm is engaged in earnings manipulation. Here, the GMI of this company
is less than 1 which indicates that there is no involvement of earning manipulation. In the event
that AQI is more noteworthy than 1 it shows that the firm has conceivably expanded its
association in cost deferral. In this case the AQI of this company is not greater than 1. When
SGI is greater than 1 that increases the chances of manipulation. In this case SGI of this
company is less than 1. When DEPI is greater than 1 that indicates the possibilities of
manipulation. Here, the DEPI of this company is equal to 1 which does not create any
significant impact on the model. Furthermore, other variables do not create any significant
chances of manipulation.
Tosrifa Industries Limited
Input Variables
Information Tosrifa Industries LTD
2016-2017 2015-2016
Net Receivables 153,890,622 250,774,035
Sales 1,206,899,302 1,424,008,994
Cost of goods sold 979,938,645 1,187,684,691
Current Asset 699,369,310 1,074,644,924
Property plant and Equipment 1,265,129,038 1,211,662,868
Securities - -

37
Total Asset 2,955,416,948 2,448,915,608
Depreciation 45,277,194 21,647,875
Sales general and administration
Expense 133,048,787 130,334,525
Current Liabilities 568,918,753 304,867,294
Total Long Term Debt 262,585,727 36,319,832
Income from Continuing operation 83,338,359 110,891,969
Cash flow from operations 116,906,987 64,670,625
Calculations of M-score
Comment on M-score:
The M-Score of Tosrifa Industries Limited is -3.52671098 that is less than -2.22 signals that
the company did not manipulate its earnings in the context of financial reporting of the year
2016-2017. A large growth in day’s sales in receivables can be created the chance of credit
coverage to be able to assist income. So, increasing DSRI causes a positive sign of
manipulation. In this company DSRI is okay which does not involve any manipulation. When
GMI is greater than 1 which increases the possibilities of manipulation. In this case GMI is less
than 1 that indicates that GMI of this company is good. When AQI is more than 1, the company
has doubtlessly improved its involvement in cost deferral. Here, AQI of this company is less
than 1 which is good for the company. When SGI is greater than 1 it indicates the chances of
probability of earnings manipulation. In this case SGI is less than 1 which shows that there is
no possibility of manipulation. When DEPI is greater than 1 it indicates that company may be
manipulated with the deprecation methods for increasing income. In this case DEPI is less than
1 which indicated that there is no manipulation with these deprecation methods. Unbalanced
increment in deals shows the positive connection amongst SGAI and the likelihood of control.
Here, SGAI of this company has no significant impact on the M-score.

38
Comparability of Eight Variables with Five Selected Companies In this report, I have compared each variable’s result with five selected companies. I have
represented these comparability result with the help of Bar Chart. These chart are as follows:
1. Days Sales in Receivables Index (DSRI)
Days sales in Receivables Index (DSRI)
Square Textile
Ltd.
Evince Textile
Ltd.
Saiham
Textile Mills
Ltd.
Alhaj Textile
Mills Ltd.
Tosrifa
Industries Ltd.
0.984928759 0.866114917 1.672972148 1.42430097 0.724054544
The greater DSRI increases the possibilities of manipulation. In this bar chart, the DSRI of
Tosrifa Industries Ltd., Evince Textile Ltd., Square Textile Ltd. are lower than Alhaj Textile
Mills Ltd. and Saiham Textile Mills Ltd. So, Alhaj Textile Ltd. and Saiham Textile Mills Ltd.
have increased the possibilities of earning manipulation.
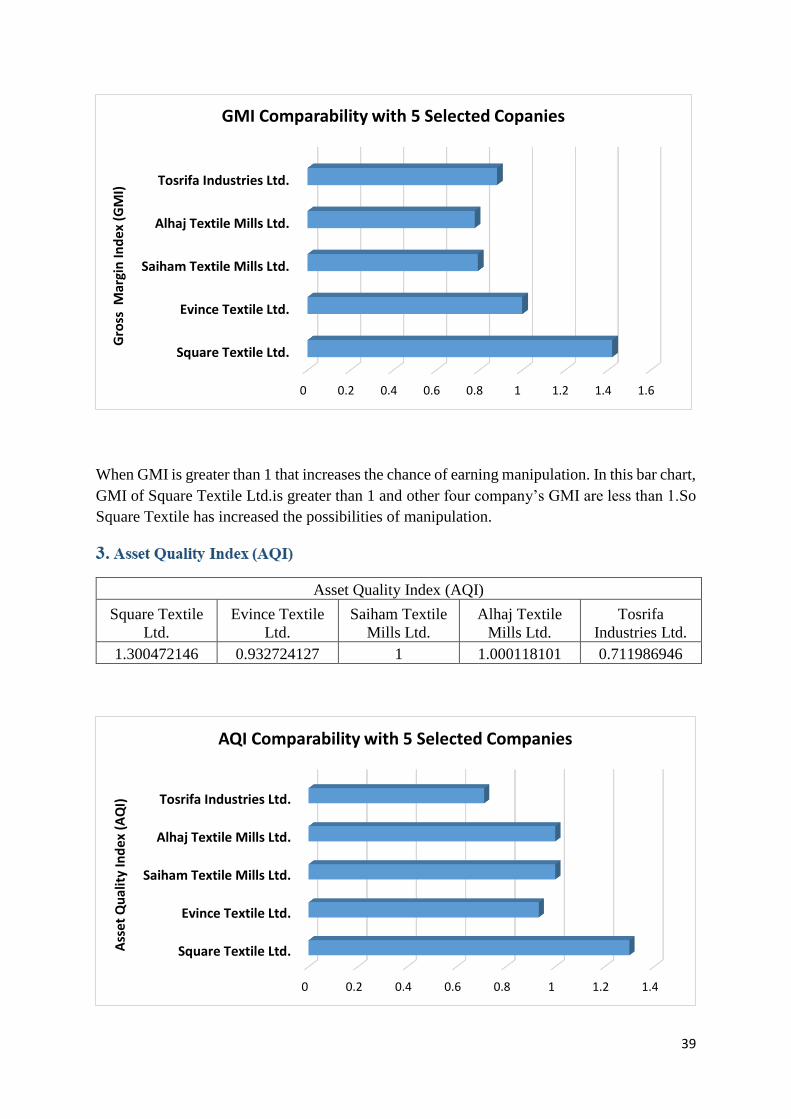
3. Gross Margin Index (GMI)
Gross Margin Index (GMI)
Square Textile
Ltd.
Evince Textile
Ltd.
Saiham Textile
Mills Ltd.
Alhaj Textile
Mills Ltd.
Tosrifa
Industries Ltd.
1.420161736 0.999998704 0.793197111 0.778534772 0.882502836
0 0.2 0.4 0.6 0.8 1 1.2 1.4 1.6 1.8
Square Textile Ltd.
Evince Textile Ltd.
Saiham Textile Mills Ltd.
Alhaj Textile Mills Ltd.
Tosrifa Industries Ltd.
Day
s sa
les
in R
ece
ivab
les
Ind
ex
(DSR
I)
DSRI Comparability with 5 selected Companies
39
When GMI is greater than 1 that increases the chance of earning manipulation. In this bar chart,
GMI of Square Textile Ltd.is greater than 1 and other four company’s GMI are less than 1.So
Square Textile has increased the possibilities of manipulation.
Asset Quality Index (AQI)
Square Textile
Ltd.
Evince Textile
Ltd.
Saiham Textile
Mills Ltd.
Alhaj Textile
Mills Ltd.
Tosrifa
Industries Ltd.
1.300472146 0.932724127 1 1.000118101 0.711986946
0 0.2 0.4 0.6 0.8 1 1.2 1.4 1.6
Square Textile Ltd.
Evince Textile Ltd.
Saiham Textile Mills Ltd.
Alhaj Textile Mills Ltd.
Tosrifa Industries Ltd.
Gro
ss M
argi
n In
dex
(G
MI)
GMI Comparability with 5 Selected Copanies
0 0.2 0.4 0.6 0.8 1 1.2 1.4
Square Textile Ltd.
Evince Textile Ltd.
Saiham Textile Mills Ltd.
Alhaj Textile Mills Ltd.
Tosrifa Industries Ltd.
Ass
et Q
ual
ity
Ind
ex (
AQ
I)
AQI Comparability with 5 Selected Companies

40
In this bar chart, AQI of Square Textile Ltd. is greater than 1 which increases the chance of
manipulation and other four company’s AQI are equal to 1 or less than 1which indicates that
there is a lower possibility of manipulation.
4. Sales Growth Index (SGI)
Sales Growth Index (SGI)
Square Textile
Ltd.
Evince Textile
Ltd.
Saiham Textile
Mills Ltd.
Alhaj Textile
Mills Ltd.
Tosrifa
Industries Ltd.
0.930731313 1.104757149 0.932762375 0.788548542 0.847536292
Massive increase in SGI indicates a possibility of earning manipulation. In this bar chart, SGI
of Saiham Textile, Evince Textile and Square Textile have higher SGI and have increased the
possibilities of manipulation and other company have lower SGI.
5. Depreciation Index (DEPI)
Depreciation Index (DEPI)
Square Textile
Ltd.
Evince Textile
Ltd.
Saiham Textile
Mills Ltd.
Alhaj Textile
Mills Ltd.
Tosrifa
Industries Ltd.
1.410552026 1.0124922 1.013271175 1.0166583 0.508006422
0 0.2 0.4 0.6 0.8 1 1.2
Square Textile Ltd.
Evince Textile Ltd.
Saiham Textile Mills Ltd.
Alhaj Textile Mills Ltd.
Tosrifa Industries Ltd.
Sale
s G
row
th In
de
x (S
GI)
SGI Comparability with 5 Selected Companies

41
In this bar chart, only the DEPI of Tosrifa Industries Ltd. are less than 1 which decreases the
possibility of manipulation. The other four companies increases the possibilities of
manipulation because the DEPI is equal to 1 or greater than 1 which increases the chance of
manipulation.
Square Textile
Ltd.
Evince Textile
Ltd.
Saiham Textile
Mills Ltd.
Alhaj Textile
Mills Ltd.
Tosrifa
Industries Ltd.
1.127144703 0.975061045 1.287329677 1.215082069 1.204462109
0 0.2 0.4 0.6 0.8 1 1.2 1.4 1.6
Square Textile Ltd.
Evince Textile Ltd.
Saiham Textile Mills Ltd.
Alhaj Textile Mills Ltd.
Tosrifa Industries Ltd.
De
pre
ciat
ion
Ind
ex
(DEP
I)DEPI Comparability with 5 Selected Companies
6. Sales General and Administrative Expenses Index (SGAI)
Sales and General and Administrative Expense Index (SGAI)
0 0.2 0.4 0.6 0.8 1 1.2 1.4
Square Textile Ltd.
Evince Textile Ltd.
Saiham Textile Mills Ltd.
Alhaj Textile Mills Ltd.
Tosrifa Industries Ltd.
Sale
s an
d G
en
eral
an
dA
dm
inis
trat
ive
Exp
en
seIn
dex
(SG
AI)
SGAI Comparability with 5 Selected Companies

42
In this bar chart, Evince textile ltd. has decreased the chance of manipulation and other four
companies have increased the chance of manipulation. Because the lower SGAI decreases the
chance of manipulation and the higher SGAI increases the chance of manipulation.
7. Total Accruals to Total Assets (TATA)
TATA indicates that higher positive accruals(less liquidity) to be related with a higher
probability of income control. In this bar chart, Tosrifa Industries Ltd. and Evince Textile Ltd.
have negative TATA and other three companies have positive TATA. So, Alhaj Textile Ltd.,
Saiham Textile Mills Ltd and Square Textile Ltd. have increased the possibilities of
manipulation and other company has decreased the chances of manipulation.
8. Leverage Index (LVGI)
Leverage Index (LVGI)
Square Textile
Ltd.
Evince Textile
Ltd.
Saiham Textile
Mills Ltd.
Alhaj Textile
Mills Ltd.
Tosrifa
Industries Ltd.
1.508977342 1.018175584 2.083671689 0.977056385 1.019421695
-0.08 -0.06 -0.04 -0.02 0 0.02 0.04 0.06
Square Textile Ltd.
Evince Textile Ltd.
Saiham Textile Mills Ltd.
Alhaj Textile Mills Ltd.
Tosrifa Industries Ltd.
Tota
l Acc
ruls
to
To
tal A
sse
ts(T
ATA
)
TATA Comparability with 5 Selected Companies
Square Textile
Ltd.
Evince Textile
Ltd.
Saiham Textile
Mills Ltd.
Alhaj Textile
Mills Ltd.
Tosrifa
Industries Ltd.
0.029786767 -0.077711125 0.045570262 0.031559673 -0.011358339
Total Accruals to Total Assets (TATA)

43
When a LVGI is more than 1 indicating the increase in leverage. The variable is incorporated
to catch obligation pledges motivating forces for income control. In this bar chart, Saiham
Textile Mills Ltd. has higher LVGI than other four companies. So, Saiham Textile has the
higher possibilities of manipulation.
0 0.5 1 1.5 2 2.5
Square Textile Ltd.
Evince Textile Ltd.
Saiham Textile Mills Ltd.
Alhaj Textile Mills Ltd.
Tosrifa Industries Ltd.
Leve
rage
Ind
ex (
LVG
I)LVGI Comparability with 5 Selected Companies

44
Chapter 7
Conclusion

45
Conclusion
Fraud is a serious problem that has plagued the business community. The concerns of
preventing fraud are mounting as the occurrences and negative impact of fraud have escalated
over the years. Financial statement fraud is found to be the most worrying as it involves
management of the company and causes the highest loss to investors. Several mathematical
models have been developed to help regulators and auditors to detect fraud early.in this report,
Beneish M-Score model is used to detect financial fraud. It is commonly used by Large and
small accounting firm in their Audit process. The model is a screening model that help about
risk of fraud. As a result If anyone assess high risk of fraud one can try to compensate for the
measured Assessment of the risk to avoid in fact having a real case of fraud Or to avoid legal
problems.

46
Chapter 8
Appendix

47
References Websites:
http://alhajtextilemills.com/files/Annual_General_Report_2016-2017.pdf
http://alhajtextilemills.com/index.php/extensions/our-mission
http://alhajtextilemills.com/index.php/extensions/our-vision
http://lankabd.com/dse/stock-market/ETL/evince-textiles-
limited/listPortalPaginationAnnouncement.html?isLimited=true&storyPortalCategoryId=2&c
ompanyId=370&goToHomePageParam=true&stockId=646
http://lankabd.com/mubasherFileServer/File.Exchange_English_Reports/SAIHAMTEX%202
016-2017%20Annual.pdf
http://www.til.com.bd/about-us/company-info/
http://www.til.com.bd/about-us/company-info/
http://www.til.com.bd/corporate/mission-vision/
http://www.til.com.bd/wp-content/uploads/2017/11/TIL-Audit-Report-2016-17.pdf
https://brisbaneacfe.org/library/third-party-fraud/common-financial-statement-frauds/
https://en.wikipedia.org/wiki/Beneish_M-Score
https://textile.squaregroup.com/inbusiness.html
https://textile.squaregroup.com/sqtextile.html
https://textile.squaregroup.com/STXL%20Annual%20Report%202017%20All%20Pages.co
mpressed_n.pdf
https://www.bloomberg.com/research/stocks/private/snapshot.asp?privcapId=51612467
https://www.investopedia.com/terms/b/beneishmodel.asp
https://www.investopedia.com/terms/b/beneishmodel.asp#ixzz5DT0gkijO
https://www.investopedia.com/terms/e/earnings-management.asp#ixzz5EywiDoxz
https://www.purdueglobal.edu/news-resources/guide-financial-statement-fraud/
https://www.scribd.com/doc/33484680/The-Detection-of-Earnings-Manipulation-Messod-D-
Beneish


