Page 1
Department of Business Administration
Rani Channamma University,
Belagavi
A Project Report On
“A study on Corporate Actions on Selected Stocks
of Bombay Stock Exchange”
Submitted By
SAIDUSAB DANGI
MB141041
2015-16
In Partial Fulfillment Of
Master of Business Administration
June, 2016
Under the guidance of
Internal Guide
Prof. Vishnukant S. Chatpalli
Company Guide
Santosh Tikare
Page 2
Declaration
I hereby declare that project Titled “A Study on Impact of Corporate Actions
on Selected Stocks of Bombay Stock Exchange” submitted by me to the Department of
Business Administration, Rani Channamma University, Belagavi, in partial fulfillment of
the requirement for the award of degree of Master of Business Administration is an
original work carried out by me under the guidance and supervision of Prof. Vishnukant
S. Chatpalli. The information has been collected from genuine & authentic sources.
The project report is not submitted to any other university/institute for the award
of any degree/diploma and it has been individually carried out as part of Student
Internship Project, means for academic purpose only.
Thanking You
SAIDUSAB DANGI
Page 3
Acknowledgement
A summer project is a golden opportunity for learning and self-development. I
consider myself very lucky and honored to have so many wonderful people lead me
through in completion of this project. On the very outset of this report, I would like to
extend my sincere & heartfelt obligation towards all the personages who have helped me
in this endeavor. Without their active guidance, help, cooperation & encouragement, I
would not have made headway in the project.
I am thankful to our Honorable Chairman Dr. S. C. Patil for giving me a big
opportunity under grow internship Project
I express my deepest thanks to my internal guide Prof. Vishnukant S. Chatpalli
for their guidance and support. He supported to us by showing different method of
information collection about the company. He helped all time when we needed and he
gave right direction toward completion of project.
I wish to express my indebted gratitude and special thanks to Mr. Santosh
Tikare, Sharewealth Securities Ltd Belgaum who in spite of being extraordinarily busy
with his duties, took time out to hear, guide and keep me on the correct path and allowing
me to carry out my industrial project work at their esteemed organization and extending
during the training.
I also acknowledge with a deep sense of reverence, my gratitude towards my
parents and member of my family, who has always supported me morally as well as
economically.
At last but not least gratitude goes to all of my friends who directly or indirectly
helped me to complete this project report.
Any omission in this brief acknowledgement does not mean lack of gratitude.
Thanking You
SAIDUSAB DANGI
Page 4
Scanned by CamScanner
Page 5
Scanned by CamScanner
Page 6
Scanned by CamScanner
Page 7
Executive Summary
Corporate events have numerous effects on the stock market and it is been
observed that stock price movements is an area of research that attracted the attention
of various researchers. Therefore, the present study attempts to contribute to the
understanding of the behavior of Indian share prices in relation to corporate actions. A
standard event study methodology is adopted in this study to examine the impact and
price reactions of BSE Sensex companies of BSE from January 2015 to December
2015 surrounding 60 days of the announcement dates. Abnormal returns were
calculated and t-tests are conducted to test the significance. From the study, it can be
inferred that stock split, Rights issue, Bonus, Dividend, Mergers and Buy-back of
stocks etc. announcement have positive impact of stock prices around announcement
dates.
Corporate actions are the actions initiated at the corporate level having
material impact on the company’s financial structure and ultimately the stakeholders
who are the owners of company.
This study is focused on the effect of various corporate actions like bonus
issue, rights issue, stock split, mergers, buy back of stocks etc. It covers the wider
range of shares from sectors comprised in Sensex index and investigates the corporate
announcement effects on Sensex companies and the abnormal change in the price
movements and liquidity around the announcement and effective date of action.
The proposed study is descriptive in nature, purely based on secondary data.
Companies listed under the BSE 100 index have been selected at a random basis.
Event study methodology is used to data analysis, which tries to measure the effect of
an event and how quickly these events are reflected in asset prices, is used to analyses
the effect of the selected events, Dividend, Stock split, Merger & Acquisition and
Bonus issue.
In this method two-stage approach is used to test the stock price responses to
corporate action announcement. The first stage consists of estimation of parameter
like beta based on the ex-post returns on stocks and market index, and expected
returns on each of the stocks based on the market model.
In the second stage these estimated parameters are used to calculate abnormal
returns around the event day. In this study, the date of corporate action announcement
is defined as day 0 or event day. If event day is a non-trading day then the
Page 8
immediately following trading day is considered as an event day. Pre-announcement
period includes 30 trading days prior to the corporate action announcement date, (-30
to -1). Post-announcement period includes 30 trading days after the corporate action
announcement (+1 to +30). Thus, we have taken the event window of 61 trading days
(including day 0 as the event day).
All the companies in BSE Sensex 100 index forms the population. From the
total population, the sample set for each event is selected based on the availability of
the dates of announcement of stock split, Bonus, Dividend and mergers and
acquisition among BSE Sensex listed companies of BSE during January 2015 to
December 2015 have been considered as the sample size, and only recent 5 companies
from each event are selected for the data analysis. Study used event study method to
analyze the data.
Overall company analysis shows that more number of positive abnormal
returns before corporate action announcement & less number of positive abnormal
returns after announcement. Hence, it can be stated that market reacts to corporate
action announcement positively before announcement and less positive after the
announcement. Paired sample t test proves that corporate action announcement exerts
an impact on share price. This study is of immense utility to investors as they can
understand changes in share prices of companies and market movement during bonus
announcements that would be helpful to them for making good portfolio investment
decision in the right time.
Page 9
Dept. Business Administration, RCU Belagavi P a g e | 1
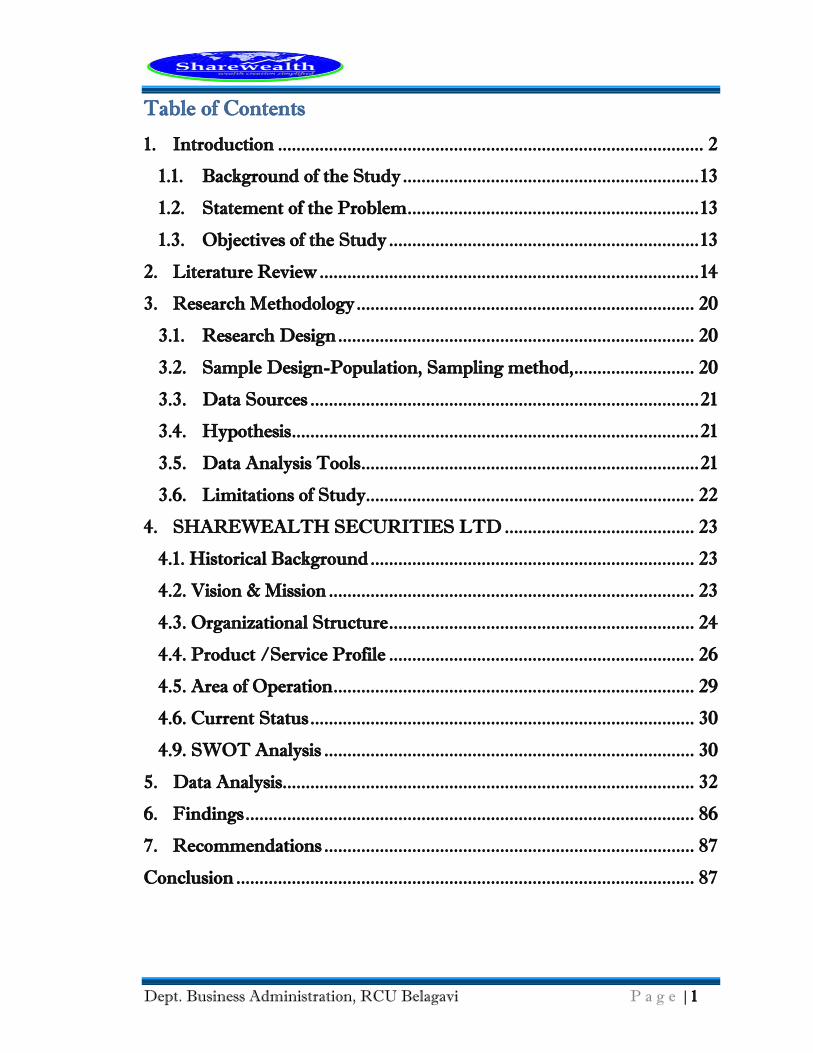
Table of Contents
1. Introduction ............................................................................................ 2
1.1. Background of the Study ................................................................ 13
1.2. Statement of the Problem ............................................................... 13
1.3. Objectives of the Study ................................................................... 13
2. Literature Review .................................................................................. 14
3. Research Methodology ......................................................................... 20
3.1. Research Design ............................................................................. 20
3.2. Sample Design-Population, Sampling method, .......................... 20
3.3. Data Sources .................................................................................... 21
3.4. Hypothesis ........................................................................................ 21
3.5. Data Analysis Tools ......................................................................... 21
3.6. Limitations of Study....................................................................... 22
4. SHAREWEALTH SECURITIES LTD ......................................... 23
4.1. Historical Background ...................................................................... 23
4.2. Vision & Mission ............................................................................... 23
4.3. Organizational Structure .................................................................. 24
4.4. Product /Service Profile .................................................................. 26
4.5. Area of Operation .............................................................................. 29
4.6. Current Status ................................................................................... 30
4.9. SWOT Analysis ................................................................................ 30
5. Data Analysis ......................................................................................... 32
6. Findings ................................................................................................. 86
7. Recommendations ................................................................................ 87
Conclusion ................................................................................................... 87
Page 10
Dept. Business Administration, RCU Belagavi P a g e | 2
1. Introduction
Stock market securities are more than a passive token of investment value to those
who deal in it. In the present day financial markets, investment has become complicated
and is both an art and science. The art of the investment is to see that the return is
maximized with the minimum of risk, which is inherent in investments. A number of
factors – both internal and external to the organization can cause changes in the returns of
the securities and a study of these factors and the pattern of their impact on security
returns have generated considerable interest to all the stake holders of the capital market.
The cumulative effect of a number of corporate actions can cause a share to
undergo a complete metamorphosis. By means of corporate actions, securities acquire a
life of their own and an ability to transform them and make investors change their
decision patterns. Corporate actions and the consequent corporate information are
potential sources that capital markets may use in revising the prices of common stocks.
The starting point of corporate actions is the ownership of individual units of
investments. The ownership of common stock gives the investor the right to elect board
of directors, vote for corporate actions that require shareholder approval, share in
corporate earnings in the form of dividends, to participate additional shares being issued
(Right issue), and to retrieve residual assets of the company at the time of liquidation. So,
along with ownership of shares, there are benefits and rules to protect the rights attached
to each share.
The type and kind of corporate action would vary according to the way it is being
defined. As per one definition, the corporate action is described as “an event initiated by
a company that affects its share”. Another one goes like this “a corporate action occurs,
when changes are made to capital structure or financial position of an issuer of a security
that affect any of the securities it has issued or shareholders”.
Out of these four corporate actions which are selected as the events, two of them
do have monetary implications and the other two have strategic implications. As is
evident, dividend and bonus issue are having monetary implication and stock split and
merger information are having strategic implication as far as the shareholders are
concerned. In short, the representativeness of the sampling done in order to select the four
Page 11
Dept. Business Administration, RCU Belagavi P a g e | 3
events for the study have become comprehensive by incorporating events having
monetary and strategic dimensions.
Corporate actions are the actions initiated at the corporate level having material
impact on the company’s financial structure and ultimately the stakeholders who are the
owners of company.
In other words corporate actions are events initiated by issuer of securities that
directly or indirectly affects its shareholders or bondholders, whether positively or
negatively.
Types of Corporate Actions
Corporate actions are classified as mandatory, voluntary and mandatory with
choice corporate actions.
I. Mandatory Corporate Action:
A mandatory corporate action is an event initiated by the corporation by the board
of directors that affects all shareholders. Participation of shareholders is mandatory for
these corporate actions. Mandatory Corporate Actions Includes Cash Dividend, Stock
Splits, Mergers, Pre-refunding, Return of capital, Bonus Issue, Asset ID Change, Pari-
passu and Spinoffs.
A. Stock Split and Reverse Spilt: A corporate action in which a company’s existing shares
are divided into multiple shares. Stock split divides each of the outstanding shares of a
company, thereby lowering the price per share - the market will adjust the price on the
day the action is implemented.
When a stock split is declared by the company the number of shares held
increases but the investment value/market capitalization remains the same similar to
bonus issue. The stock is split with reference to the face value. Suppose the stock’s face
value is Rs.10, and there is a 1:1 stock split then the face value will change to Rs.5. If you
owned 1 share before split you would now own 2 shares after the split.
Similar to bonus issue, stock split is usually to encourage more retail participation
by reducing the value per share.
Page 12
Dept. Business Administration, RCU Belagavi P a g e | 4
How to benefit from this news Stock - splits/Reverse splits normally increase
the liquidity of stocks and now there are more buyers and sellers for the same stock.
Normally companies announce splits if they are quite confident about the future growth
prospects. One can invest and benefit from this news if the company is a quality
company.
B. Spin-Offs: Spin off means a company breaking up itself into smaller units. The creation
of an independent company through the sale or distribution of new shares of an existing
business/division of a parent company.
C. Mergers and Acquisitions: Mergers is an event where two or more companies merge
into one aiming to be more competitive and for more profitability. Likewise Acquisition
means a bigger company acquiring a smaller one for further expansion.
How to benefit from this news normally - whenever Target Company is
acquired the acquiring company has to pay a premium for this purchase which in turn
results in increase in stock price of the target company in short term. As the acquiring
company has to pay the premium its stock price decreases in short term. An investor can
use acquisition news to buy into Target Company and sell parent company in order to
gain in short term.
D. Bonus Issue: It is an additional dividend given to the shareholders that can be in cash or
in the form of stock. When companies have outstanding performance with surplus profit,
they may decide to issue bonus to the shareholders.
A bonus issue is a stock dividend, allotted by the company to reward the
shareholders. The bonus shares are issued out of the reserves of the company. These are
free shares that the shareholders receive against shares that they currently hold. These
allotments typically come in a fixed ratio such as, 1:1, 2:1, 3:1 etc.
If the ratio is 2:1 ratio, the existing shareholders get 2 additional shares for every
1 share they hold at no additional cost. So if a shareholder owns 100 shares then he will
be issued an additional 200 shares, so his total holding will become 300 shares. When the
bonus shares are issued, the number of shares the shareholder holds will increase but the
overall value of investment will remain the same.
Similar to the dividend issue there is a bonus announcement date, ex-bonus date,
and record date. Companies issue bonus shares to encourage retail participation,
Page 13
Dept. Business Administration, RCU Belagavi P a g e | 5
especially when the price per share of a company is very high and it becomes tough for
new investors to buy shares. By issuing bonus shares, the number of outstanding shares
increases, but the value of each share reduces as shown in the example above.
II. Voluntary Corporate Action :
Voluntary corporate actions are actions requiring a decision from the investor on
whether or not to participate. Corporation will not process these actions automatically
because the decision on whether to participate will vary for every investor. Shareholders
may choose to take no action which will leave their securities unaffected by the
Corporate Action. Voluntary corporate action includes Tender Offer, Rights issue,
making buyback offers to the shareholders while delisting the company from the stock
exchange etc.
A. Buyback: Buyback is an action in which company offers to buys back its stock from the
current shareholders at an attractive price.
A buyback can be seen as a method for company to invest in itself by buying
shares from other investors in the market. Buybacks reduce the number of shares
outstanding in the market; however buyback of shares is an important method of
corporate restructuring. There could be many reasons why corporate choose to buy back
shares.
When a company announces a buy back, it signals the company’s confidence
about itself. Hence this is usually a positive for the share price.
How to benefit from this news – If based on your fundamental research you find out
that a company is undervalued and at the same time company management announces a
buyback offer its wise to invest in that stock. When the market condition improves you
will reap a handsome benefit out of this investment.
B. Rights Issue: It refers to offering additional shares to the current shareholders of the
stock. This is done by companies to raise capital for further expansion which provide its
existing shareholders the right to buy the stock at discounted rates than price making it
more lucrative.
Page 14
Dept. Business Administration, RCU Belagavi P a g e | 6
The idea behind a rights issue is to raise fresh capital. However instead of going
public, the company approaches their existing shareholders Think about the rights issue
as a second IPO but for a select group of people (existing shareholders).
The rights issue could be an indication of a promising new development in the
company. The shareholders can subscribe to the rights issue in the proportion of their
shareholding. For example 1:4 rights issue means for every 4 shares a shareholder owns,
he can subscribe to 1 additional share. Needless to say the new shares under the rights
issue will be issued at a lower price than what prevails in the markets.
However, a word of caution – The investor should not be swayed by the discount
offered by the company but they should look beyond that. Rights issue is different from
bonus issue as one is paying money to acquire shares. Hence the shareholder should
subscribe only if he or she is completely convinced about the future of the company.
Also, if the market price is below the subscription price/right issue price it is obviously
cheaper to buy it from the open market.
C. Mandatory With Choice Corporate Action :
This corporate action is a mandatory corporate action for the shareholder but they are
being presented with options. An example is cash or stock dividend option with one of
the options as default. Shareholders may or may not submit their elections. In case a
shareholder does not submit the election, the default option will be applied.
Dividend Payouts: Dividend is the payment made to the investor for sharing the profits a
company has made. It can be cash dividend or stock dividend where company offers
stock as a dividend to the current shareholders.
Dividends are paid on a per share basis. For example, during the financial year
2012-13 Infosys had declared a dividend of Rs.42 per share. The dividend paid is also
expressed as a percentage of the face value. In the above case, the face value of Infosys
was Rs.5/- and the dividend paid was Rs.42/- hence the dividend payout is said to be
840% (42/5).
It is not mandatory to pay out the dividends every year. If the company feels that
instead of paying dividends to shareholders they are better off utilizing the same cash to
fund new project for a better future, then can do so.
Page 15
Dept. Business Administration, RCU Belagavi P a g e | 7
Besides, the dividends need not be paid from the profits alone. If the company has
made a loss during the year but it does hold a healthy cash reserve, then the company can
still pay dividends from its cash reserves.
Sometimes distributing the dividends may be the best way forward for the
company. When the growth opportunities for the company have exhausted and the
company holds excess cash, it would make sense for the company to reward its
shareholders thereby repaying the trust the shareholders hold in the company.
The decision to pay dividend is taken in the Annual General Meeting (AGM)
during which the directors of the company meet. The dividends are not paid right after
the announcement. This is because the shares are traded throughout the year and it would
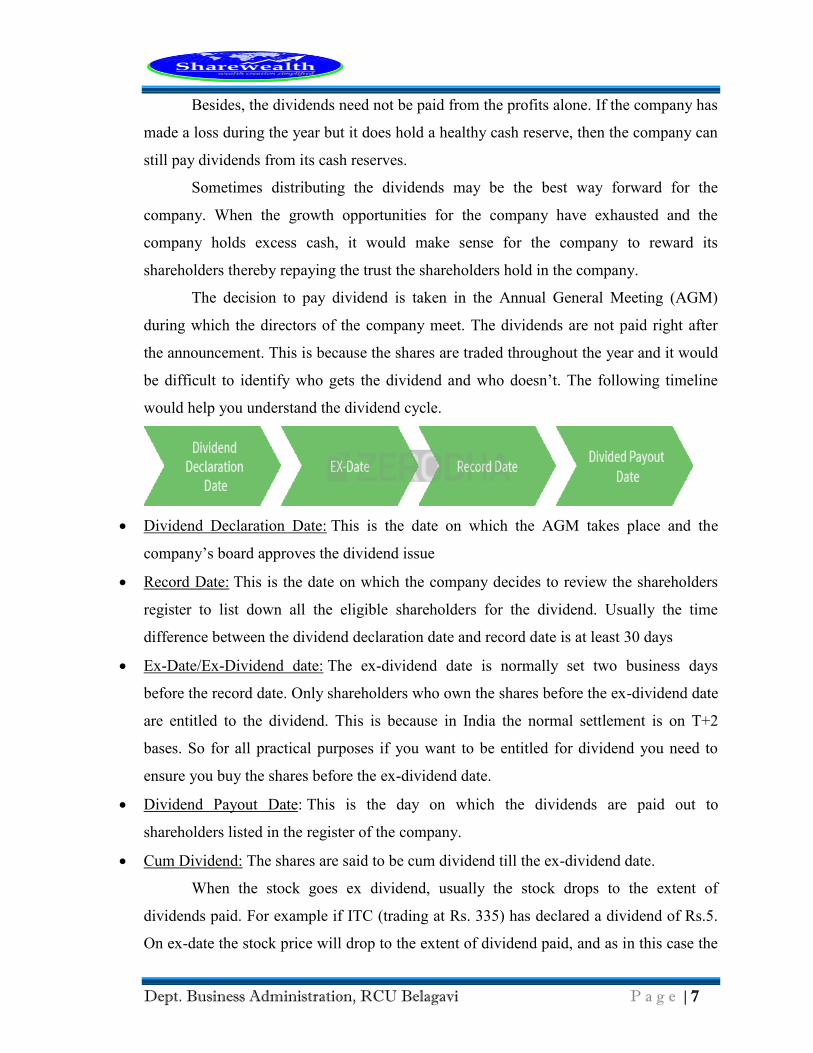
be difficult to identify who gets the dividend and who doesn’t. The following timeline
would help you understand the dividend cycle.
Dividend Declaration Date: This is the date on which the AGM takes place and the
company’s board approves the dividend issue
Record Date: This is the date on which the company decides to review the shareholders
register to list down all the eligible shareholders for the dividend. Usually the time
difference between the dividend declaration date and record date is at least 30 days
Ex-Date/Ex-Dividend date: The ex-dividend date is normally set two business days
before the record date. Only shareholders who own the shares before the ex-dividend date
are entitled to the dividend. This is because in India the normal settlement is on T+2
bases. So for all practical purposes if you want to be entitled for dividend you need to
ensure you buy the shares before the ex-dividend date.
Dividend Payout Date: This is the day on which the dividends are paid out to
shareholders listed in the register of the company.
Cum Dividend: The shares are said to be cum dividend till the ex-dividend date.
When the stock goes ex dividend, usually the stock drops to the extent of
dividends paid. For example if ITC (trading at Rs. 335) has declared a dividend of Rs.5.
On ex-date the stock price will drop to the extent of dividend paid, and as in this case the
Page 16
Dept. Business Administration, RCU Belagavi P a g e | 8
price of ITC will drop down to Rs.330. The reason for this price drop is because the
amount paid out no longer belongs to the company.
Dividends can be paid anytime during the financial year. If it’s paid during the
financial year it is called the interim dividend. If the dividend is paid at the end of the
financial year it is called the final dividend.
How to benefit from this news – Let’s say stock price for company A is Rs 100 today.
There is a dividend declaration of Rs 2/share. That means each stock holder will get Rs
2/share as cash if he holds stocks of company A on or before Ex-dividend date. As
markets react to every good news stock price of company A will reach Rs 102 or even
higher before Ex-dividend date. As dividend declaration results in stock price
appreciation, make a list of good dividend declaring companies and figure out in which
quarter and round what date they declare dividends. Invest in them before dividend
declaration date and benefit from price appreciation.
Introduction of Stock Market (Industry Profile)
The history of the Indian capital market, in particular can be traced back to 1861
when the American civil war began. Several companies were formed during this period
and many banks came to the fore to handle the finances registered under the British
companies act. The stock exchange Mumbai came into existences in 1875. It was an
unincorporated body of stockbrokers, which started doing business in the city under a
banyan tree. Business as essentially confined to company owners and brokers, with very
little interest evinced by the general public. There had been much fluctuation in the stock
market on account of the American war and battles in Europe.
History of Indian stock exchange
Indian stock market is one of the oldest in Asia. Its history dates back to nearly
200 years ago. In 1887, they formally established in Bombay, the “native share and stock
brokers association” (which is alternatively known as “the stock exchange “). In 1895,
the stock exchange acquired a premise in the same street and it was inaugurated in 1899.
Thus, the stock exchange at Bombay was consolidated.
Page 17
Dept. Business Administration, RCU Belagavi P a g e | 9
History of Indian Stock Market: Indian stock market marks to be one of the oldest
stock market in Asia. It dates back to the close of 18th century when the East India
Company used to transact loan securities. In the 1830s, trading on corporate stocks and
shares in Bank and Cotton presses took place in Bombay.
Though the trading was broad but the brokers were hardly half dozen during 1840
and 1850. An informal group of 22 stockbrokers began trading under a banyan tree
opposite the Town Hall of Bombay from the mid-1850s, each investing a (then) princely
amount of Rupee 1. This banyan tree still stands in the Horniman Circle Park, Mumbai.
In 1860, the exchange flourished with 60 brokers. In fact the 'Share Mania' in India began
with the American Civil War broke and the cotton supply from the US to Europe stopped.
Further the brokers increased to 250. The informal group of stockbrokers organized
themselves as the native Share and Stockbrokers Association which, in 1875, was
formally organized as the Bombay Stock Exchange (BSE). BSE was shifted to an old
building near the Town Hall. In 1928, the plot of land on which the BSE building now
stands (at the intersection of Dalal Street, Bombay Samachar Marg and Ham Street in
downtown Mumbai) was acquired, and a building was constructed and occupied in 1930.
In 1956, the Government of India recognized the Bombay Stock Exchange as the
first stock exchange in the country under the Securities Contracts (Regulation) Act. The
most decisive period in the history of the BSE took place after 1992. In the aftermath of a
major scandal with market manipulation involving a BSE member named Harshad
Mehta, BSE responded to calls for reform with intransigence. The foot-dragging by the
BSE helped radicalize the position of the government, which encouraged the creation of
the National Stock Exchange (NSE), which created an electronic marketplace. NSE
started trading on 4 November 1994. Within less than a year, NSE turnover exceeded the
BSE. BSE rapidly automated, but it never caught up with NSE spot market turnover. The
second strategic failure at BSE came in the following two years. NSE embarked on the
launch of equity derivatives trading. BSE responded by political effort, with a friendly
SEBI chairman (D. R. Mehta) aimed at blocking equity derivatives trading. The BSE and
D. R. Mehta succeeded in delaying the onset of equity derivatives trading by roughly five
years. But this trading, and the accompanying shift of the spot market to rolling
settlement, did come along in 2000 and 2001 - helped by another major scandal at BSE
Page 18
Dept. Business Administration, RCU Belagavi P a g e | 10
involving the then President Mr. Anand Rathi. NSE scored nearly 100% market share in
the runaway success of equity derivatives trading, thus consigning BSE into clearly
second place. Today, NSE has roughly 66% of equity spot turnover and roughly 100% of
equity derivatives turnover. Stock Exchange provides a trading platform, where buyers
and sellers can meet to transact in securities.
Meaning of stock exchange
Stock Exchanges are an organized marketplace, either corporation or mutual
organization, where members of the organization gather to trade company stocks or other
securities. The members may act either as agents for their customers, or as principals for
their own accounts.
Stock Markets:
Stock Market is a market where the trading of company stock, both listed
securities and unlisted takes place. It is different from stock exchange because it includes
all the national stock exchanges of the country. For example, we use the term, "the stock
market was up today" or "the stock market bubble."
The Indian market has 22 stock exchanges. The larger companies are enlisted with BSE
and NSE. The smaller and medium companies are listed with OTCEI (Over The counter
Exchange of India). These stock exchanges are located in Delhi, Mumbai, Bangalore,
Ahmadabad, etc
Bombay stock exchange (BSE)
BSE is the oldest stock exchange in Asia. The extensiveness of the indigenous
equity broking industry in India led to the formation of the Native Share Brokers
Association in1875, which later became Bombay Stock Exchange Limited (BSE). BSE is
widely recognized due to its pivotal and pre-eminent role in the development of the
Indian capital Market. In 1995, the trading system transformed from open outcry system
to an online screen-based order-driven trading system.
BSE has a nation-wide reach with a presence in more than 450 cities and towns of
India. BSE has always been at par with the international standards. It is the first exchange
in India and the second in the world to obtain an ISO 9001:2000 certifications. The equity
market capitalization of the companies listed on the BSE was US$1.93 trillion as of
Page 19
Dept. Business Administration, RCU Belagavi P a g e | 11
December 2013, making it the 4th largest stock exchange in Asia and the 8th largest in
the world. The BSE has the largest number of listed companies in the world. As of June
2013, there are over 5,085 listed Indian companies and over 8,196 scrips on the stock
exchange, the Bombay Stock Exchange has a significant trading volume. Though many
other exchanges exist, BSE and the National Stock Exchange of India account for the
majority of the equity trading in India.
The Bombay stock exchange limited, (formerly the stock exchange, Mumbai;
popularly called as BSE) is the oldest stock exchange in Asia with a rich heritage. It is
located at Dalal Street, Mumbai; India. BSE was established in 1875 as “the native share
and stock brokers”. It was the first stock exchange in the country to obtain permanent
recognition in 1956 from the Government of India under the securities contract Act 1956.
There are around 4700 companies listed with stock exchange and has a significant trading
volume. Over the past 133 years, BSE has facilitated the growth of the Indian corporate
sector by providing it with an efficient access to resources. There is perhaps no major
corporate in India which has not sourced BSE’s services in raising resources from the
capital market today, BSE is the world number 1 exchange in terms of the number of
listed companies and the world’s 5th
in transaction numbers,. The market capitalization
as on Jan 31, 2014 stood at USD 1.79 trillion.
National Stock Exchange (NSE):
With the liberalization of the Indian economy, it was found inevitable to lift the
Indian stock market trading system on par with the international standards. On the basis
of the recommendations of high powered Pherwani Committee, the National Stock
Exchange was incorporated in 1992 by Industrial Development Bank of India (IDBI),
Industrial Credit and Investment Corporation of India (ICICI), Industrial Finance
Corporation of India (IFCI), all Insurance Corporations, selected commercial banks and
others. Trading at NSE takes place through a fully automated screen-based trading
mechanism which adopts the principle of an order-driven market. Trading members can
stay at their offices and execute the trading, since they are linked through a
communication network. The prices at which the buyer and seller are willing to transact
will appear on the screen. When the prices match the transaction will be completed and a
confirmation slip will be printed at the office of the trading member.
Page 20
Dept. Business Administration, RCU Belagavi P a g e | 12
NSE has several advantages over the traditional trading exchanges. They are as follows:
NSE brings an integrated stock market trading network across the nation.
Investors can trade at the same price from anywhere in the country since inter-market
operations is streamlined coupled with the countrywide access to the securities.
Delays in communication, late payments and the malpractice’s prevailing in the
traditional trading
Mechanism can be done away with greater operational efficiency and
informational transparency in the Stock market operations, with the support of total
computerized network. The National stock exchange of India limited has genesis in the
report of the high powered study group on establishment of new stock exchanges. Which
recommended promotion of a National stock exchange by financial institutions (FIs) to
provide access to investors from all across the country on an equal footing? Based on the
recommendations, NSE was promoted by leading financial institutions at the behest of
the Government of India and was incorporated in November 1992 as a tax-paying
company unlike other stock exchange in the country. Indian markets have recently
thrown open a new avenue for retail investors and traders to participate: commodity
derivatives. For those who want to diversify their portfolios beyond shares, bonds and
real estate, commodities are the best option. Till some months ago, this wouldn't have
made sense. For retail investors could have done very little to actually invest in
commodities such as gold and silver -- or oilseeds in the futures market. This was nearly
impossible in commodities except for gold and silver as there was practically no retail
avenue for punting in commodities. However, with the setting up of three multi-
commodity exchanges in the country, retail investors can now trade in commodity futures
without having physical stocks! Commodities actually offer immense potential to become
a separate asset class for market-savvy investors, arbitrageurs and speculators. Retail
investors, who claim to understand the equity markets, may find commodities an
unfathomable market. But commodities are easy to understand as far as fundamentals of
demand and supply are concerned. Retail investors should understand the risks and
advantages of trading in commodities futures before taking a leap.
Page 21
Dept. Business Administration, RCU Belagavi P a g e | 13
1.1. Background of the Study
Corporate events have numerous effects on the stock market and it is been
observed that stock price movements is an area of research that attracted the attention of
various researchers. Therefore, the present study attempts to contribute to the
understanding of the behavior of Indian share prices in relation to corporate actions. A
standard event study methodology is adopted in this study to examine the impact and
price reactions of BSE Sensex companies of BSE from January 2015 to December 2015
surrounding 60 days of the announcement dates. Abnormal returns were calculated and t-
tests are conducted to test the significance. From the study, it can be inferred that stock
split, Rights issue, Bonus, Dividend, Mergers and Buy-back of stocks etc. announcement
have positive impact of stock prices around announcement dates.
1.2. Statement of the Problem
This study is focused on the effect of various corporate actions like bonus issue,
rights issue, stock split, mergers, buy back of stocks etc. It covers the wider range of
shares from sectors comprised in Sensex index and investigates the corporate
announcement effects on Sensex companies and the abnormal change in the price
movements and liquidity around the announcement and effective date of action.
1.3. Objectives of the Study
a. To study the various important corporate announcements.
b. To assess the impact of Corporate action announcement on share prices
c. To examine whether there is any abnormal returns around the Corporate Action
announcement window.
d. To support informed investors in understanding the price pressure and liquidity
prevailing around the Corporate Action announcement date.
e. To identify the time window (before and after announcement) that maximizes the return
for shareholders.
Page 22
Dept. Business Administration, RCU Belagavi P a g e | 14
2. Literature Review
Corporate actions and Share prices
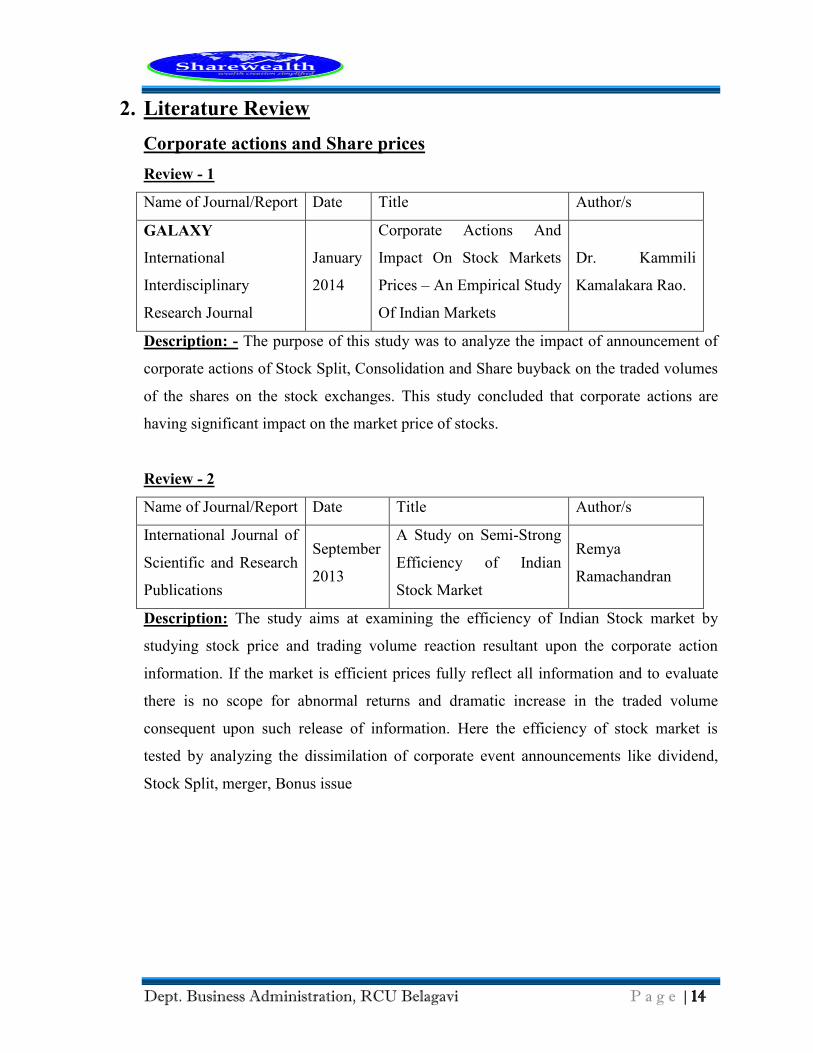
Review - 1
Name of Journal/Report Date Title Author/s
GALAXY
International
Interdisciplinary
Research Journal
January
2014
Corporate Actions And
Impact On Stock Markets
Prices – An Empirical Study
Of Indian Markets
Dr. Kammili
Kamalakara Rao.
Description: - The purpose of this study was to analyze the impact of announcement of
corporate actions of Stock Split, Consolidation and Share buyback on the traded volumes
of the shares on the stock exchanges. This study concluded that corporate actions are
having significant impact on the market price of stocks.
Review - 2
Name of Journal/Report Date Title Author/s
International Journal of
Scientific and Research
Publications
September
2013
A Study on Semi-Strong
Efficiency of Indian
Stock Market
Remya
Ramachandran
Description: The study aims at examining the efficiency of Indian Stock market by
studying stock price and trading volume reaction resultant upon the corporate action
information. If the market is efficient prices fully reflect all information and to evaluate
there is no scope for abnormal returns and dramatic increase in the traded volume
consequent upon such release of information. Here the efficiency of stock market is
tested by analyzing the dissimilation of corporate event announcements like dividend,
Stock Split, merger, Bonus issue
Page 23
Dept. Business Administration, RCU Belagavi P a g e | 15
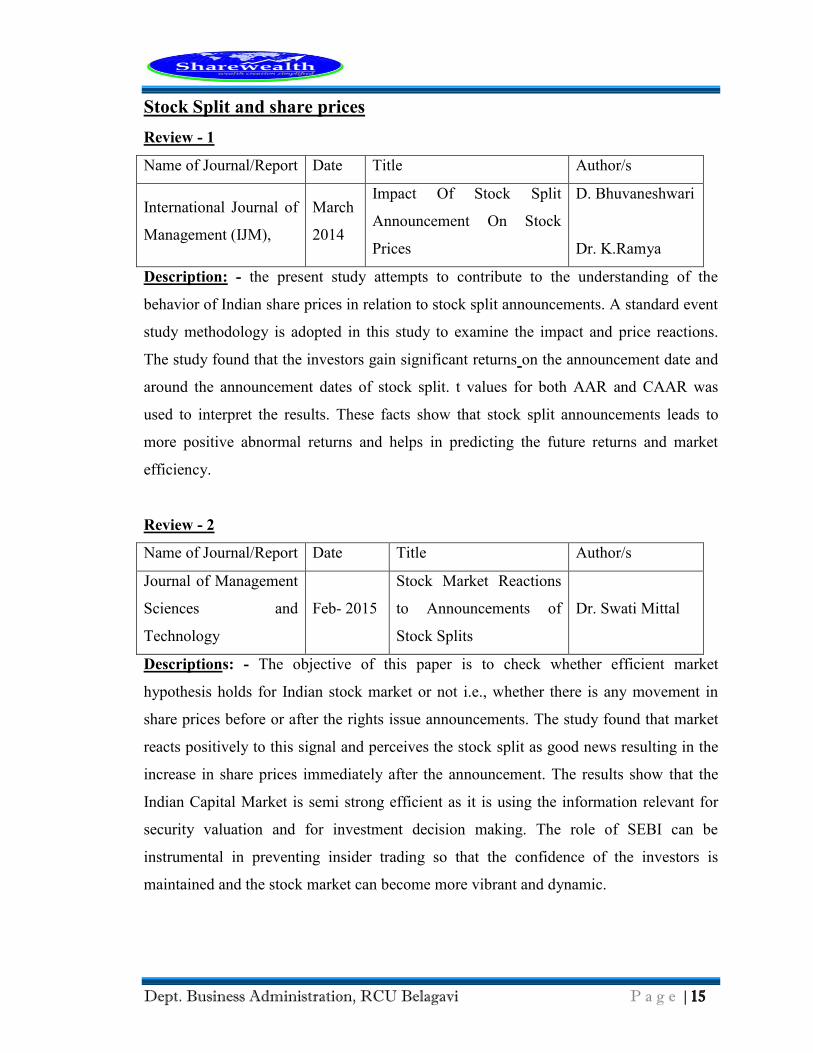
Stock Split and share prices
Review - 1
Name of Journal/Report Date Title Author/s
International Journal of
Management (IJM),
March
2014
Impact Of Stock Split
Announcement On Stock
Prices
D. Bhuvaneshwari
Dr. K.Ramya
Description: - the present study attempts to contribute to the understanding of the
behavior of Indian share prices in relation to stock split announcements. A standard event
study methodology is adopted in this study to examine the impact and price reactions.
The study found that the investors gain significant returns on the announcement date and
around the announcement dates of stock split. t values for both AAR and CAAR was
used to interpret the results. These facts show that stock split announcements leads to
more positive abnormal returns and helps in predicting the future returns and market
efficiency.
Review - 2
Name of Journal/Report Date Title Author/s
Journal of Management
Sciences and
Technology
Feb- 2015
Stock Market Reactions
to Announcements of
Stock Splits
Dr. Swati Mittal
Descriptions: - The objective of this paper is to check whether efficient market
hypothesis holds for Indian stock market or not i.e., whether there is any movement in
share prices before or after the rights issue announcements. The study found that market
reacts positively to this signal and perceives the stock split as good news resulting in the
increase in share prices immediately after the announcement. The results show that the
Indian Capital Market is semi strong efficient as it is using the information relevant for
security valuation and for investment decision making. The role of SEBI can be
instrumental in preventing insider trading so that the confidence of the investors is
maintained and the stock market can become more vibrant and dynamic.
Page 24
Dept. Business Administration, RCU Belagavi P a g e | 16
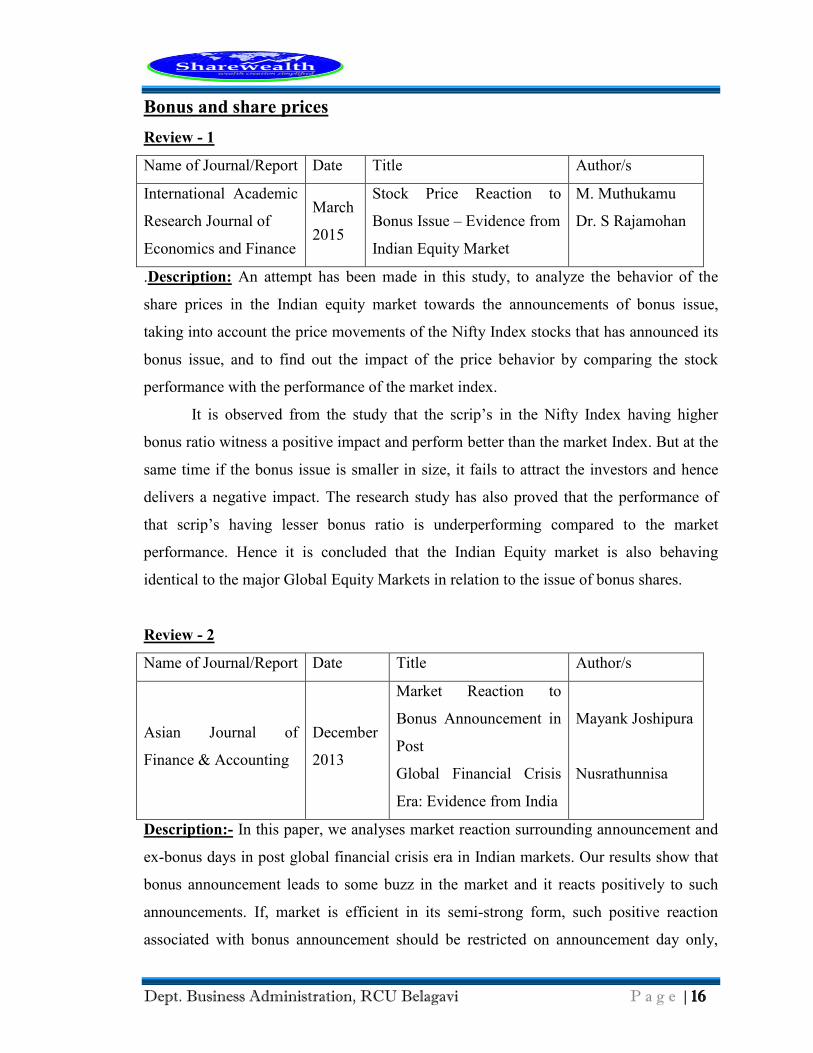
Bonus and share prices
Review - 1
Name of Journal/Report Date Title Author/s
International Academic
Research Journal of
Economics and Finance
March
2015
Stock Price Reaction to
Bonus Issue – Evidence from
Indian Equity Market
M. Muthukamu
Dr. S Rajamohan
.Description: An attempt has been made in this study, to analyze the behavior of the
share prices in the Indian equity market towards the announcements of bonus issue,
taking into account the price movements of the Nifty Index stocks that has announced its
bonus issue, and to find out the impact of the price behavior by comparing the stock
performance with the performance of the market index.
It is observed from the study that the scrip’s in the Nifty Index having higher
bonus ratio witness a positive impact and perform better than the market Index. But at the
same time if the bonus issue is smaller in size, it fails to attract the investors and hence
delivers a negative impact. The research study has also proved that the performance of
that scrip’s having lesser bonus ratio is underperforming compared to the market
performance. Hence it is concluded that the Indian Equity market is also behaving
identical to the major Global Equity Markets in relation to the issue of bonus shares.
Review - 2
Name of Journal/Report Date Title Author/s
Asian Journal of
Finance & Accounting
December
2013
Market Reaction to
Bonus Announcement in
Post
Global Financial Crisis
Era: Evidence from India
Mayank Joshipura
Nusrathunnisa
Description:- In this paper, we analyses market reaction surrounding announcement and
ex-bonus days in post global financial crisis era in Indian markets. Our results show that
bonus announcement leads to some buzz in the market and it reacts positively to such
announcements. If, market is efficient in its semi-strong form, such positive reaction
associated with bonus announcement should be restricted on announcement day only,
Page 25
Dept. Business Administration, RCU Belagavi P a g e | 17
however, we can see that market gets some hint of such potential announcement at least
two days before but the biggest positive market reaction is observed on announcement
day itself and not on any of the following day in the announcement window. That
indicates that bonus announcement do carry positive information content and that is
getting reflected just before and immediately on its announcement and that provides
support for information content and some evidence of Indian stock market is efficient in
its semi-strong form.
Dividend and share prices
Review on Dividend - 1
Name of Journal/Report Date Title Author/s
International Journal of
Financial Management
April
2012
Stock Price Reaction to
Dividend Announcements
Shaveta Gupta,
Balram Dogra,
A K Vashisht,
Shevata Ghai
Description: - the present study is an attempt to study the stock price reaction to 65
dividend announcements (increase) by 28 companies during the period 2006-09 listed on
BSE 30 Sensex. Corporate dividend policy certainly matters for the shareholders. The
extent of its effect may be different for different markets depending upon the different
market microstructure, tax regime and control environments. Findings also revealed that
dividend signal sends good news to cause larger price movements than those involving
bad news. This suggests that bad news may be discounted long before the dividend
announcement, so later dividend may carry little information. An alternative explanation
of the positive impact of dividend increase may be that they serve to reduce the potential
exploitation of the smaller shareholders by the larger ones, with different policy
implication regarding the need to enhance the transparency and public confidence. This
study should be regarded as an attempt towards understanding the importance of
corporate payout policy and its impact especially the cash dividend increase.
Page 26
Dept. Business Administration, RCU Belagavi P a g e | 18
Review - 2
Name of Journal/Report Date Title Author/s
International Journal of
Information
Technology and
Knowledge
Management
July
2010
Impact Of Dividend
Announcement On Stock
Prices
Neetu Mehndiratta
& Shuchi Gupta
Description: The present study attempts to contribute positively to the understanding of
the behavior of Indian share prices in relation to the dividend announcements. Dividend
announcements usually are considered as the positive signal to the shareholders and its
positive impact on the share prices is also expected.
Using an event study methodology paper find that despite of investors do not gain
significant value in the period preceding as well as on the dividend announcement day,
yet they can gain value in the post announcement period. Investors do shift their security
positions at the time of dividend announcement, which indicate that in post
announcement period there is a possibility of information content in dividend
announcement in NSE. The evidence nevertheless shows that dividend increases lead
more positive abnormal returns, supporting the Efficient Market Hypothesis.
Rights issue and share prices
Review - 1
Name of Journal/Report Date Title Author/s
Researcher World -
Journal of Arts, Science
& Commerce
Oct.
2011
An Empirical Analysis Of
Impact Of Right Issues On
Shareholders Returns Of
Indian Listed Companies
Pooja Miglani
Description: This study explores the impact of right shares issued by Indian companies
that took place during 2005 & 2010. The samples of 32 right issues have been used to
study the announcement effect. The study examines the stock price reaction to
information content of right issues with a view of finding whether Indian stock market is
semi-strong efficient or not. The standard event study methodology has been used for the
Page 27
Dept. Business Administration, RCU Belagavi P a g e | 19
purpose of examining the right issue announcement reaction. The study reveals
statistically significant abnormal returns on the announcement & surrounding dates.
Review - 2
Name of
Journal/Report Date Title Author/s
EXCEL
International
Journal of
Multidisciplinary
Management
Studies
July
2012
An Empirical Study On Announcement
Effect Of Right Issue On Share Price
Volatility And Liquidity And Its Impact
On Market Wealth Creation Of Informed
Investors In Bangalore With Special
Reference To Cnx Nifty Stocks Of NSE
Suresha B
And
Dr.Gajendra
Naidu
Description: This paper investigates the market reaction to rights issue announcement
news, using an event study methodology for Nifty stocks from 1995 to 2011 and also
examines neglected firm hypothesis, Price pressure hypothesis. It is also observed that
there is no significant change in trade volume for the observations stocks during event
window. The study concludes that the Indian market reacts negatively to rights issue
announcement.
Page 28
Dept. Business Administration, RCU Belagavi P a g e | 20
3. Research Methodology
The proposed study is descriptive in nature, purely based on secondary data.
Companies listed under the BSE 100 index have been selected at a random basis. Event
study methodology is used to data analysis, which tries to measure the effect of an event
and how quickly these events are reflected in asset prices, is used to analyses the effect of
the selected events, Dividend, Stock split, Merger & Acquisition and Bonus issue.
In this method two-stage approach is used to test the stock price responses to
corporate action announcement. The first stage consists of estimation of parameter like
beta based on the ex-post returns on stocks and market index, and expected returns on
each of the stocks based on the market model.
In the second stage these estimated parameters are used to calculate abnormal
returns around the event day. In this study, the date of corporate action announcement is
defined as day 0 or event day. If event day is a non-trading day then the immediately
following trading day is considered as an event day. Pre-announcement period includes
30 trading days prior to the corporate action announcement date, (-30 to -1). Post-
announcement period includes 30 trading days after the corporate action announcement
(+1 to +30). Thus, we have taken the event window of 61 trading days (including day 0
as the event day).
3.1. Research Design
The research design for the study is conclusive in nature as conclusive research
tests hypothesis of the problem and draws definite conclusion for implementation.
3.2. Sample Design-Population, Sampling method,
All the companies in BSE Sensex index forms the population. From the total
population, the sample set for each event is selected based on the availability of the dates
of announcement of stock split, Bonus, Dividend and mergers and acquisition among
BSE Sensex listed companies of BSE during January 2015 to December 2015 have been
considered as the sample size, and only recent 5 companies from each event are selected
for the data analysis
Page 29
Dept. Business Administration, RCU Belagavi P a g e | 21
3.3. Data Sources
Three sets of data have been used in this study. The first set of data consists of corporate
actions announcement made by the sample companies. The source of data from the
published Journals, magazines, newspapers, websites, financial markets etc.
The second set of data consists of daily-adjusted closing prices of the selected stocks
from BSE Sensex Index. Daily-adjusted closing prices are assumed to reflect the
consensus of the market participants regarding price of the stock at the end of the trading.
The third set of data consists of BSE 100 index of ordinary share prices complied and
published by BSE on daily basis. These data have been collected from BSE website
(http://www.bseindia.com). Companies with their company code, BSE symbol and date
of corporate action announcement during the selected range of years.
3.4. Hypothesis
H1: There is a significant impact on the price of shares due to Corporate Actions
H0: There is no impact on the price of shares due to Corporate Actions
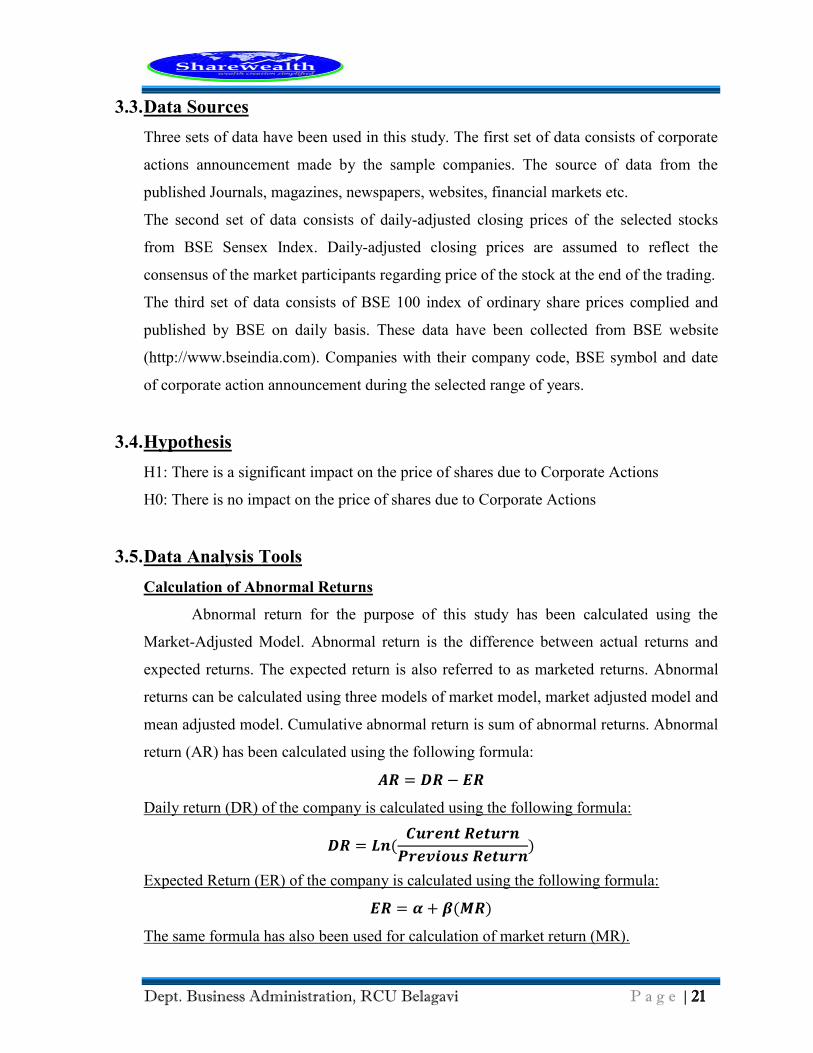
3.5. Data Analysis Tools
Calculation of Abnormal Returns
Abnormal return for the purpose of this study has been calculated using the
Market-Adjusted Model. Abnormal return is the difference between actual returns and
expected returns. The expected return is also referred to as marketed returns. Abnormal
returns can be calculated using three models of market model, market adjusted model and
mean adjusted model. Cumulative abnormal return is sum of abnormal returns. Abnormal
return (AR) has been calculated using the following formula:
𝑨𝑹 = 𝑫𝑹 − 𝑬𝑹
Daily return (DR) of the company is calculated using the following formula:
𝑫𝑹 = 𝑳𝒏(𝑪𝒖𝒓𝒆𝒏𝒕 𝑹𝒆𝒕𝒖𝒓𝒏
𝑷𝒓𝒆𝒗𝒊𝒐𝒖𝒔 𝑹𝒆𝒕𝒖𝒓𝒏)
Expected Return (ER) of the company is calculated using the following formula:
𝑬𝑹 = 𝜶 + 𝜷(𝑴𝑹)
The same formula has also been used for calculation of market return (MR).
Page 30
Dept. Business Administration, RCU Belagavi P a g e | 22
𝑴𝑹 = 𝑳𝑵 (𝑪𝒖𝒓𝒆𝒏𝒕 𝑹𝒆𝒕𝒖𝒓𝒏
𝑷𝒓𝒆𝒗𝒊𝒐𝒖𝒔 𝑹𝒆𝒕𝒖𝒓𝒏)
t Test:
The 5% (1.69) level of significance with appropriate degree of freedom was used
to test the null hypothesis of no significant abnormal returns after the event day. The
conclusions are based on the results of t values on ARs for the event window. The t test
statistics for AR for each day during the event window is calculated as:
𝒕(𝑨𝑹) =𝑨𝑹
𝑺𝒕𝒂𝒏𝒅𝒂𝒓𝒅 𝒆𝒓𝒓𝒐𝒓
3.6. Limitations of Study
a. Study is limited to only stocks of BSE 100 Index.
b. Study of corporate actions is limited to Dividend, Bonus, Stock splits and Merger &
Acquisition only.
c. The data collection was for only period of 1 year (January 2015 to December 2015).
d. Research methodology and data analysis tools are limited only “Event Study
Methodology”.
e. Analysis of stock prices is only limited to Pre-announcement period includes 30 trading
days prior to the corporate action announcement date, (-30 to -1). Post-announcement
period includes 30 trading days after the corporate action announcement (+1 to +30).
Thus, we have taken the event window of 61 trading days (including day 0 as the event
day).
f. The time period of the project work was only 2 months
g. The project is mainly depended on secondary sources.
Page 31
Dept. Business Administration, RCU Belagavi P a g e | 23
4. Sharewealth Securities Ltd
4.1. Historical Background
Sharewealth is promoted by a group of Financial Market Professionals having
more than 20 years of experience in Financial Markets.
Sharewealth Securities Ltd is the first corporate member of National Stock
Exchange of India Ltd, Bombay Stock Exchange Ltd and MCX Stock Exchange Ltd
(MCX-SX) from THRISSUR, the Cultural Capital of Kerala. Sharewealth is also a
Depository Participant with CDSL (Central Depository Services (India) Ltd).
Corporate Office
4th FLOOR, POOMA COMPLEX,
No. 25 / 469 / 23, M G ROAD,
THRISSUR – 1
PHONE: 0487 - 2436500 (30 Lines)
0487 - 2442351 / 52/ 53/ 54
Website: www.sharewealthindia.com
EMAIL: [email protected]
: [email protected]
4.2. Vision & Mission
"To educate growing investing public in a simple & practical way to help
them to protect their hard earned money and to make more money from financial &
commodity markets", which we mean by "wealth creation simplified"
Competitors
Page 32
Dept. Business Administration, RCU Belagavi P a g e | 24
There are several financial security companies playing their roles in Indian equity
market. But Sharewealth faces competitions from these few companies.
1. Share Khan (SSKI)
2. Karvy Stock Broking Ltd.
3. Geojit BNP Paribas
4. Religare Securities
5. HDFC Securities
6. Kotak securities
7. Angel Broking Ltd
8. Asith C Mehta stock brokers Ltd
9. Reliance securities Ltd.
10. Anand Rathi
4.3. Organizational Structure
Promoters of the Company
Sharewealth is promoted by a group of Financial Market Professionals having
more than 20 years of experience in Financial Markets, and various professional
dignitaries from different fields of entrepreneurship.
Mr. T.B.Ramakrishnan
(Ramki)
Managing Director & CEO
1. CEO is leading the core team of Sharewealth, which has a
highly competent diversified Board of Directors.
Mr.Ramki is a Stock Market Analyst, Ex. Treasurer &
Governing Council Member of Cochin Stock Exchange
Ltd (1998-2000) and former Kerala Regional Head of
Sharekhan who has got more than 20 years of experience
in Financial Markets.
2. Dr.Anil Menon Chairman
3. Mr.C.G.Surendran Vice-Chairman
4. Mr.Joseph P Antony Executive director
5. Mr. Anchery Ramanathan Directors of the company
Page 33
Dept. Business Administration, RCU Belagavi P a g e | 25
6. Mr.T.S.Rajan,
7. Mr. Shibu Cheeran
8. Mr.N.C.Chummar
9. Dr.Saifu Kokkat
10. Mr.N.Nandakumar
11. Mr. Vincent Paliakkara
12. A.Y.Khalid
Group of Company Directors
Mr.N.C.Peethambaran
Mr.T.V.N Girishkumar
Mr.Mani Paul
Page 34
Dept. Business Administration, RCU Belagavi P a g e | 26
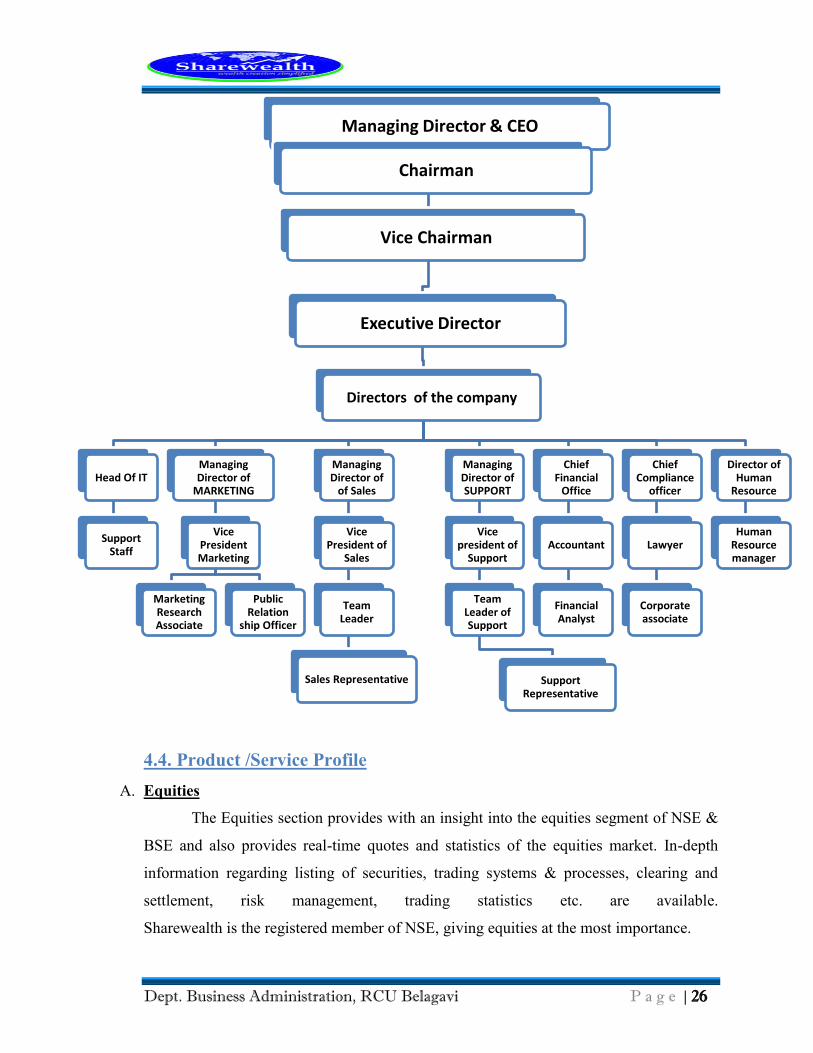
4.4. Product /Service Profile
A. Equities
The Equities section provides with an insight into the equities segment of NSE &
BSE and also provides real-time quotes and statistics of the equities market. In-depth
information regarding listing of securities, trading systems & processes, clearing and
settlement, risk management, trading statistics etc. are available.
Sharewealth is the registered member of NSE, giving equities at the most importance.
Managing Director & CEO
Chairman
Vice Chairman
Executive Director
Directors of the company
Head Of IT
Support Staff
Managing Director of
MARKETING
Vice President Marketing
Marketing Research Associate
Public Relation
ship Officer
Managing Director of
of Sales
Vice President of
Sales
Team Leader
Sales Representative
Managing Director of SUPPORT
Vice president of
Support
Team Leader of Support
Support Representative
Chief Financial
Office
Accountant
Financial Analyst
Chief Compliance
officer
Lawyer
Corporate associate
Director of Human
Resource
Human Resource manager
Page 35
Dept. Business Administration, RCU Belagavi P a g e | 27
Sharewealth provides guidance in the exciting world of stock market with suitable
trading solutions and value-added tools and services to enhance your trading experience.
B. Derivatives
The term "Derivative" indicates that it has no independent value, i.e. its value is
entirely "derived" from the value of the underlying asset. The underlying asset can be
securities, commodities, bullion, currency, livestock or anything else. In other words,
Derivative means a forward, future, option or any other hybrid contract of pre-determined
fixed duration, linked for the purpose of contract fulfillment to the value of a specified
real or financial asset or to an index of securities.
With Securities Laws (Second Amendment) Act,1999, Derivatives has been included in
the definition of Securities. The term Derivative has been defined in Securities Contracts
(Regulations) Act, as:-
A Derivative includes: -
a security derived from a debt instrument, share, loan, whether secured or unsecured, risk
instrument or contract for differences or any other form of security;
a contract which derives its value from the prices, or index of prices, of underlying
securities;
C. Depository
A depository can be compared to a bank. A depository holds securities like
shares, debentures, bonds, Government Securities, units etc. of investors in electronic
form. Besides holding securities, a depository also provides services related to
transactions in securities. At present two Depositories viz. National Securities Depository
Limited (NSDL) and Central Depository Services (I) Limited (CDSL) are registered with
SEBI.
A depository interfaces with the investors through its agents called Depository
Participants (DPs). If an investor wants to avail the services offered by the depository, the
investor has to open an account with a DP. This is similar to opening an account with any
branch of a bank in order to utilize the bank's services.
The Depository facilities include,
Page 36
Dept. Business Administration, RCU Belagavi P a g e | 28
Dematerialization, Dematerialization, repurchase/redemption of units of mutual
funds, electronic settlement of trades in stock exchanges, receipt of non-cash corporate
benefits such as bonus, in electronic form, transmission of securities, and other facilities
like holding debt instruments in the same account, availing stock lending/borrowing
facility , etc. Sharewealth provides you all Depository services.
D. Commodities
Any product that can be used for commerce or an article of commerce which is
traded on an authorized commodity exchange is known as commodity. The article should
be movable of value, something which is bought or sold and which is produced or used as
the subject or barter or sale. In short commodity includes all kinds of goods. Forward
Contracts (Regulation) Act (FCRA), 1952 defines goods as every kind of movable
property other than actionable claims, money and securities.
In current situation, all goods and products of agricultural (including plantation),
mineral and fossil origin are allowed for commodity trading recognized under the FCRA.
The national commodity exchanges, recognized by the Central Government, permits
commodities which include precious (gold and silver) and non-ferrous metals; cereals
and pulses; ginned and un-ginned cotton; oilseeds, oils and oilcakes; raw jute and jute
goods; sugar and gur; potatoes and onions; coffee and tea; rubber and spices. Etc.
Sharewealth is the registered member of MCX.
E. Mutual Fund
Mutual fund is a mechanism for pooling the resources by issuing units to the
investors and investing funds in securities in accordance with objectives as disclosed in
offer document.
Investments in securities are spread across a wide cross-section of industries and
sectors and thus the risk is reduced. Diversification reduces the risk because all stocks
may not move in the same direction in the same proportion at the same time. Mutual fund
issues units to the investors in accordance with quantum of money invested by them.
Investors of mutual funds are known as unitholders.
Page 37
Dept. Business Administration, RCU Belagavi P a g e | 29
The profits or losses are shared by the investors in proportion to their investments.
The mutual funds normally come out with a number of schemes with different investment
objectives which are launched from time to time. A mutual fund is required to be
registered with Securities and Exchange Board of India (SEBI) which regulates securities
markets before it can collect funds from the public Sharewealth has the AMFI
registration and guides in all types of Mutual Fund.
F. IPO
An Initial Public Offer (IPO) is the selling of securities to the public in the
primary market. It is when an unlisted company makes either a fresh issue of securities or
an offer for sale of its existing securities or both for the first time to the public. This
paves way for listing and trading of the issuers securities. The sale of securities can be
either through book building or through normal public issue.
IPOs can be a risky investment. For the individual investor, it is tough to predict
what the stock will do on its initial day of trading and in the near future since there is
often little historical data with which to analyze the company. Also, most IPOs are of
companies going through a transitory growth period, and they are therefore subject to
additional uncertainty regarding their future value.
4.5. Area of Operation
Sharewealth Securities is a Full Service Broker. Membership:
NSE, SEBI Registration No: NSE INB/INF/INE 231249930
BSE, SEBI Registration No: INB 011249936
MCX-SX, SEBI Registration No: INE 261249930
MCX FMC Registration No: MCX/TCM/CORP/1054
NCDEX FMC Registration No: NCDEX/TM/CORP/935
NMCE FMC Registration No: NMCE/TCM/CORP/0295
ICEX FMC Registration No: ICEX/TCM/CORP/0019
AMFI Registration No: ARN – 77624
Depository Participant: CDSL: IN-DP-CDSL-379-2006
DP ID: 12047600
Page 38
Dept. Business Administration, RCU Belagavi P a g e | 30
4.6. Current Status
Sharewealth Securities Ltd has two group companies, Sharewealth Commodities
Pvt Ltd (Member: MCX, NCDEX, NMCE, ICEX & NSEL) and Sharewealth Financial
Services Ltd (AMFI Registered Mutual Fund Distributor). Sharewealth has a group
(Overseas Joint Venture) company at Abu Dhabi, Sharewealth Financial Consultancy
LLC. Registered & Corporate offices of Sharewealth Group of companies are at Trissur.
4.9. SWOT Analysis
Strengths
1. It is a leading online trading firm with more than 520 peoples working in the
organization.
2. Sharewealth make avail multichannel operation to all its customers through an online
system with www.sharewealthindia.com , 165 share shops in Kerala and a call center
based Dial-n-Trade facility
3. Sharewealth has dedicated and well-designed research department for fundamental and
technical research as well. Research department regularly tackle with the pulse of the
market and provide investment advices to its client at free cost on timely basis. They have
a well strike rate of 70-80%.
4. Innovative range of financial products
5. Known for transparent functioning
6. Emphasis on building stronger bond with customers
7. Services offered include Equity Trading, Commodities, Mutual Funds, IPO, and
Depository Services.
Weaknesses
1. Lack of country wide expansion due to insufficiency of investment and so it has a
localized presence almost.
2. Lack of aggressive marketing promotional strategies like visual media, print media etc.
3. Lack of well awareness among customers.
4. Lack of programs for emphasizing on customer retention.
Page 39
Dept. Business Administration, RCU Belagavi P a g e | 31
5. Rather than concentrating on retail investors, it gives more focus on HNIs.
6. Less market share as compared with major competitors.
Opportunities
1. Country has featured with high boom in capital market and so it can raise its customer
base by launching new services across.
2. It can explore new promotional media like print media and electronic media to tap small
investors easily.
3. Recently, more small investors stepping stone in to stock market because of the poor
return from the traditional investment modes like banks and post office.
4. Government has declared abolition of long term capital gain tax on shares and reduction
in short term capital gain. It makes stock market investment as better tax shelter.
5. Miraculous popularity of internet in the country makes stock market dealings easier to
any category of people from any part of the country.
6. High purchasing power and people looking to more investment opportunities
7. Growing rural market
8. Investment advisory services, Portfolio management services and Investment banking
services
Threats
1. Rival firms are coming out with aggressive marketing promotional strategies and it may
hamper acceptance of bran by new clients.
2. Rival players in the market are providing margin funds to investors on easy terms and
conditions, rather than Sharewealth provides.
3. Recently more players have been stepping into this domain which is quite enough to
destroy earnings of Sharewealth further.
4. Stringent Economic measures by Government and RBI
5. Entry of foreign finance firms in Indian Market
Page 40
Dept. Business Administration, RCU Belagavi P a g e | 32
5. Data Analysis
I. Stock Split
To analyze the impact of stock split announcement on selected companies the
abnormal returns of beta adjusted share prices of companies having stock split
announcement were found for each day in the event window .
There are five selected stock split announcements companies samples (Recent 5
Companies) are considered for the analysis in the sample companies during the study
period. The abnormal returns of each company on each day are found out and it is
cumulated to get CAR. This part focuses on the effect of dividend information release by
testing the significance of difference in returns between the period before and after the
Dividend announcement
1. Bank of Baroda
Calculation AR, CAR and t Test for each day
Before After
Period AR CAR t Test Period AR CAR t Test
-30 0.0162 0.0162 1.1371 1 -0.0165 -0.0165 -1.1530
-29 0.0124 0.0286 0.8658 2 -0.0132 -0.0296 -0.9240
-28 0.0012 0.0298 0.0856 3 0.0036 -0.0261 0.2513
-27 -0.0011 0.0287 -0.0802 4 -0.0332 -0.0593 -2.3267
-26 -0.0148 0.0139 -1.0354 5 -0.0985 -0.1578 -6.9007
-25 0.0047 0.0186 0.3278 6 -0.0276 -0.1853 -1.9319
-24 0.0193 0.0379 1.3554 7 -0.0072 -0.1926 -0.5069
-23 -0.0237 0.0142 -1.6613 8 0.0050 -0.1876 0.3490
-22 -0.0031 0.0111 -0.2183 9 -0.0323 -0.2199 -2.2650
-21 0.0128 0.0239 0.8950 10 -0.0059 -0.2258 -0.4103
-20 0.0131 0.0369 0.9171 11 0.0088 -0.2169 0.6198
-19 0.0054 0.0423 0.3768 12 0.0123 -0.2046 0.8621
-18 -0.0092 0.0332 -0.6411 13 0.0070 -0.1976 0.4907
-17 0.0104 0.0436 0.7311 14 -0.0125 -0.2101 -0.8741
-16 -0.0046 0.0390 -0.3218 15 -0.0033 -0.2134 -0.2344
-15 -0.0032 0.0358 -0.2236 16 -0.0007 -0.2141 -0.0467
Page 41
Dept. Business Administration, RCU Belagavi P a g e | 33
-14 -0.0081 0.0277 -0.5686 17 -0.0066 -0.2207 -0.4631
-13 0.0037 0.0314 0.2621 18 -0.0300 -0.2508 -2.1051
-12 0.0103 0.0418 0.7229 19 0.0359 -0.2148 2.5183
-11 0.0097 0.0515 0.6813 20 0.0088 -0.2060 0.6155
-10 -0.0121 0.0394 -0.8465 21 -0.0307 -0.2367 -2.1516
-9 -0.0244 0.0150 -1.7087 22 -0.0013 -0.2380 -0.0876
-8 0.0112 0.0262 0.7839 23 -0.0148 -0.2528 -1.0356
-7 0.0067 0.0329 0.4688 24 0.0217 -0.2311 1.5211
-6 -0.0038 0.0291 -0.2648 25 0.0148 -0.2163 1.0336
-5 -0.0147 0.0145 -1.0269 26 -0.0247 -0.2410 -1.7313
-4 -0.0201 -0.0056 -1.4085 27 0.0205 -0.2205 1.4372
-3 -0.0042 -0.0098 -0.2931 28 -0.0273 -0.2478 -1.9111
-2 -0.0181 -0.0279 -1.2664 29 0.0173 -0.2305 1.2131
-1 0.0330 0.0051 2.3088 30 0.0067 -0.2238 0.4691
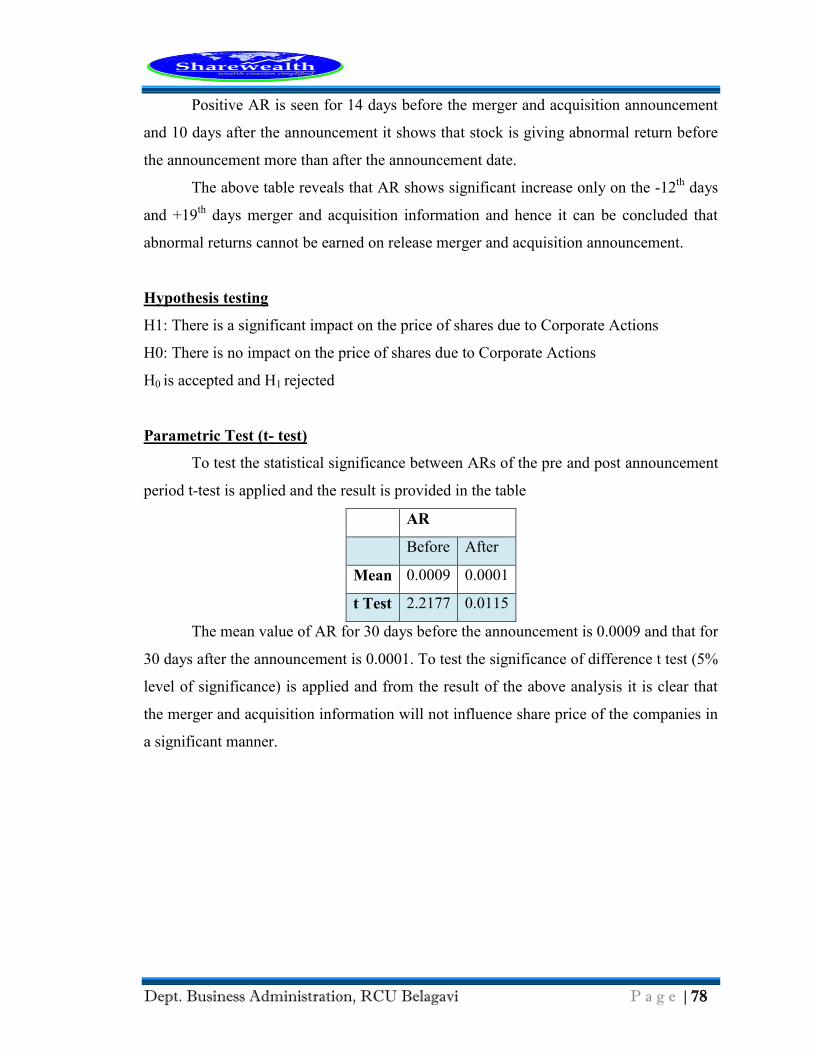
Positive AR is seen for 16 days before the split announcement and 12 days after
the announcement it shows that stock is giving abnormal return before the announcement
more than after the announcement window.
The above table reveals that AR shows significant increase only on the -12th
days
and +19th
days split information and hence it can be concluded that abnormal returns
cannot be earned on release split announcement.
Hypothesis testing
H1: There is a significant impact on the price of shares due to Corporate Actions
H0: There is no impact on the price of shares due to Corporate Actions
H0 is accepted and H1 rejected
Parametric Test (t- test)
To test the statistical significance between ARs of the pre and post-split
announcement period t-test is applied and the result is provided in the table
Abnormal Return
Before After
Mean 0.0002 -0.007
t Test 0.3542 -0.1542
Page 42
Dept. Business Administration, RCU Belagavi P a g e | 34
The mean value of AR for 30 days before the announcement is 0.0002 and that for
30 days after the announcement is -0.007. To test the significance of difference t test (5%
level of significance) is applied and from the result of the above analysis it is clear that
the split information will not influence share price of the companies in a significant
manner.
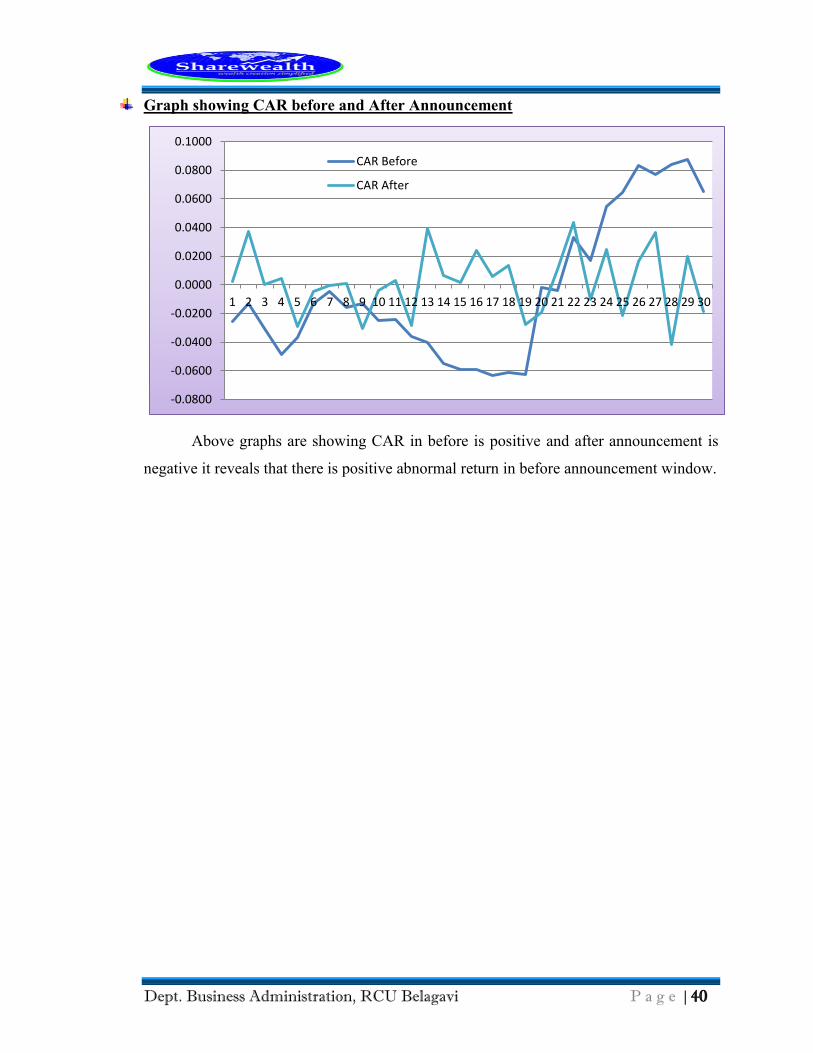
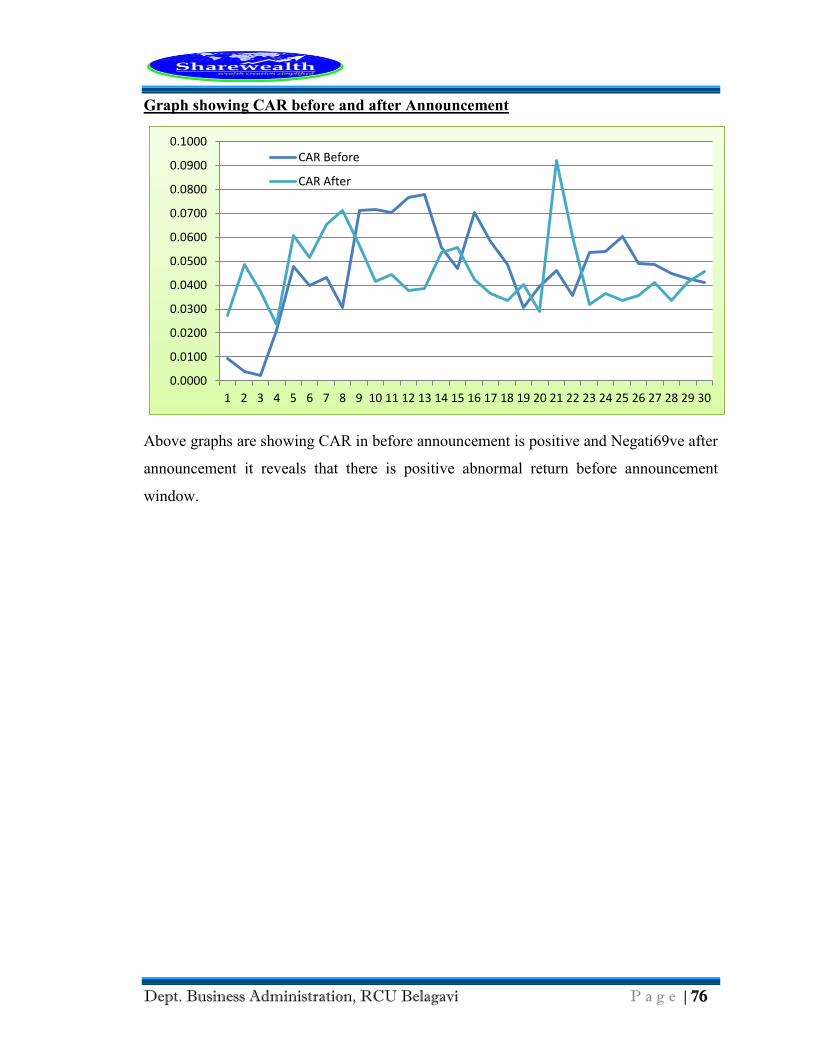
Graph showing CAR before and after Announcement
Above graph showing CAR in before announcement is positive and Negative
after announcement it reveals that there is positive abnormal return before announcement
window.
-0.3000
-0.2500
-0.2000
-0.1500
-0.1000
-0.0500
0.0000
0.0500
0.1000
1 2 3 4 5 6 7 8 9 10 11 12 13 14 15 16 17 18 19 20 21 22 23 24 25 26 27 28 29 30
CAR Before
CAR After
Page 43
Dept. Business Administration, RCU Belagavi P a g e | 35
2. Tech Mahindra Ltd
Calculation AR, CAR and t Test for each day
Before After
Period AR CAR t Test Period AR CAR t Test
-30 -0.0204 -0.0204 -1.5170 1 -0.0080 -0.0080 -0.5932
-29 0.0087 -0.0117 0.6481 2 -0.0308 -0.0388 -2.2922
-28 -0.0032 -0.0149 -0.2372 3 0.0041 -0.0347 0.3060
-27 -0.0082 -0.0230 -0.6072 4 -0.0044 -0.0391 -0.3262
-26 -0.0240 -0.0470 -1.7860 5 -0.0011 -0.0402 -0.0814
-25 0.0261 -0.0210 1.9379 6 -0.0076 -0.0478 -0.5676
-24 0.0183 -0.0027 1.3616 7 -0.0378 -0.0855 -2.8084
-23 -0.0083 -0.0110 -0.6162 8 0.0060 -0.0796 0.4434
-22 0.0028 -0.0082 0.2095 9 0.0019 -0.0777 0.1417
-21 -0.0043 -0.0125 -0.3210 10 0.0125 -0.0652 0.9269
-20 -0.0226 -0.0351 -1.6831 11 0.0145 -0.0507 1.0821
-19 -0.0063 -0.0414 -0.4655 12 0.0276 -0.0231 2.0507
-18 -0.0063 -0.0476 -0.4662 13 -0.0050 -0.0281 -0.3740
-17 0.0034 -0.0442 0.2565 14 -0.0126 -0.0407 -0.9372
-16 -0.0097 -0.0539 -0.7204 15 0.0013 -0.0394 0.0988
-15 -0.0032 -0.0571 -0.2417 16 -0.0058 -0.0452 -0.4295
-14 0.0253 -0.0318 1.8835 17 -0.0037 -0.0489 -0.2771
-13 0.0083 -0.0235 0.6190 18 -0.0179 -0.0668 -1.3314
-12 -0.0042 -0.0277 -0.3118 19 -0.0072 -0.0740 -0.5365
-11 0.0148 -0.0129 1.0972 20 0.0093 -0.0647 0.6944
-10 -0.0062 -0.0191 -0.4595 21 -0.0128 -0.0774 -0.9493
-9 -0.0021 -0.0212 -0.1580 22 -0.0214 -0.0988 -1.5883
-8 -0.0181 -0.0393 -1.3481 23 -0.0494 -0.1482 -3.6730
-7 0.0131 -0.0262 0.9770 24 0.0113 -0.1369 0.8403
-6 0.0280 0.0018 2.0827 25 0.0316 -0.1052 2.3527
-5 -0.0248 -0.0230 -1.8419 26 0.0148 -0.0905 1.1001
-4 -0.0081 -0.0310 -0.5995 27 0.0125 -0.0780 0.9269
-3 0.0029 -0.0281 0.2185 28 -0.0230 -0.1010 -1.7113
-2 0.0116 -0.0164 0.8656 29 -0.0061 -0.1071 -0.4522
-1 -0.0232 -0.0397 -1.7291 30 0.0096 -0.0974 0.7168
Page 44
Dept. Business Administration, RCU Belagavi P a g e | 36
Above table shows that Positive AR is seen for 13 days before the split
announcement and 12 days after the announcement it shows that stock is giving abnormal
return before the announcement more than after the announcement window.
The above table reveals that AR shows significant increase only on the -25th
, -14th
, -6th
days and +12th
, +25 days split information and hence it can be concluded that
abnormal returns can be earned on release split announcement in both before and after
window.
Hypothesis testing
H1: There is a significant impact on the price of shares due to Corporate Actions
H0: There is no impact on the price of shares due to Corporate Actions
H1 is accepted and H0 rejected
Parametric Test (t- test)
To test the statistical significance between ARs of the pre and post-split
announcement period t-test is applied and the result is provided in the table
AR
Before After
Mean -0.0013 -0.0032
t Test -2.9524 -7.2476
The mean value of AR for 30 days before the announcement is 0.0002 and that for
30 days after the announcement is -0.007. To test the significance of difference t test (5%
level of significance) is applied and from the result of the above analysis it is clear that
the split information will not influence share price of the companies in a significant
manner.
Page 45
Dept. Business Administration, RCU Belagavi P a g e | 37
Graph showing CAR before and after Announcement
Above graph showing CAR in before and after announcement is Negative; it
reveals that there is no positive abnormal return before announcement window.
-0.1600
-0.1400
-0.1200
-0.1000
-0.0800
-0.0600
-0.0400
-0.0200
0.0000
0.0200
1 2 3 4 5 6 7 8 9 10 11 12 13 14 15 16 17 18 19 20 21 22 23 24 25 26 27 28 29 30
CAR Before
CAR After
Page 46
Dept. Business Administration, RCU Belagavi P a g e | 38
3. Cadila Healthcare Ltd
Calculation AR, CAR and t Test for each day
Before After
Period AR CAR t Test Period AR CAR t Test
-30 -0.0253 -0.0253 -1.32 1 0.0021 0.0021 0.11
-29 0.0120 -0.0134 0.62 2 0.0375 0.0375 1.96
-28 -0.0175 -0.0308 -0.91 3 0.0004 0.0004 0.02
-27 -0.0177 -0.0486 -0.93 4 0.0043 0.0043 0.23
-26 0.0120 -0.0366 0.63 5 -0.0295 -0.0295 -1.54
-25 0.0234 -0.0132 1.22 6 -0.0049 -0.0049 -0.25
-24 0.0085 -0.0047 0.44 7 -0.0008 -0.0008 -0.04
-23 -0.0111 -0.0158 -0.58 8 0.0007 0.0007 0.04
-22 0.0027 -0.0131 0.14 9 -0.0305 -0.0305 -1.59
-21 -0.0121 -0.0252 -0.63 10 -0.0039 -0.0039 -0.20
-20 0.0007 -0.0245 0.04 11 0.0029 0.0029 0.15
-19 -0.0117 -0.0362 -0.61 12 -0.0283 -0.0283 -1.48
-18 -0.0038 -0.0400 -0.20 13 0.0393 0.0393 2.05
-17 -0.0152 -0.0552 -0.80 14 0.0068 0.0068 0.35
-16 -0.0037 -0.0590 -0.20 15 0.0013 0.0013 0.07
-15 -0.0001 -0.0591 -0.01 16 0.0243 0.0243 1.27
-14 -0.0044 -0.0635 -0.23 17 0.0056 0.0056 0.29
-13 0.0021 -0.0614 0.11 18 0.0132 0.0132 0.69
-12 -0.0013 -0.0627 -0.07 19 -0.0279 -0.0279 -1.46
-11 0.0610 -0.0017 3.19 20 -0.0192 -0.0192 -1.00
-10 -0.0022 -0.0039 -0.11 21 0.0110 0.0110 0.57
-9 0.0368 0.0329 1.92 22 0.0438 0.0438 2.29
-8 -0.0159 0.0170 -0.83 23 -0.0103 -0.0103 -0.54
-7 0.0381 0.0551 1.99 24 0.0249 0.0249 1.30
-6 0.0094 0.0645 0.49 25 -0.0211 -0.0211 -1.10
-5 0.0188 0.0833 0.98 26 0.0163 0.0163 0.85
-4 -0.0059 0.0774 -0.31 27 0.0364 0.0364 1.90
-3 0.0066 0.0840 0.35 28 -0.0417 -0.0417 -2.18
-2 0.0034 0.0874 0.18 29 0.0197 0.0197 1.03
-1 -0.0220 0.0654 -1.15 30 -0.0183 -0.0183 -0.96
Page 47
Dept. Business Administration, RCU Belagavi P a g e | 39
Positive AR is seen for 14 days before the split announcement and 18 days after
the announcement it shows that stock is giving abnormal return after the announcement
more than before the announcement window
The above table reveals that AR shows significant increase only on the -11th
, -9th
,
-7th
days and +2nd
, 13th, 22nd, 27th
days split information and hence it can be concluded
that abnormal returns can be earned on release split announcement.
Hypothesis testing
H1: There is a significant impact on the price of shares due to Corporate Actions
H0: There is no impact on the price of shares due to Corporate Actions
H1 is accepted and H0 rejected
Parametric Test (t- test)
To test the statistical significance between ARs of the pre and post-split
announcement period t-test is applied and the result is provided in the table
AR
Before After
Mean 0.00449 0.00181
t Test 7.03691 2.83079
The mean value of AR for 30 days before the announcement is 0.0045 and that for
30 days after the announcement is -0.0018. To test the significance of difference t test
(5% level of significance) is applied and from the result of the above analysis it is clear
that the split information will influence share price of the companies in a significant
manner in both before and after window.
Page 48
Dept. Business Administration, RCU Belagavi P a g e | 40
Graph showing CAR before and After Announcement
Above graphs are showing CAR in before is positive and after announcement is
negative it reveals that there is positive abnormal return in before announcement window.
-0.0800
-0.0600
-0.0400
-0.0200
0.0000
0.0200
0.0400
0.0600
0.0800
0.1000
1 2 3 4 5 6 7 8 9 10 11 12 13 14 15 16 17 18 19 20 21 22 23 24 25 26 27 28 29 30
CAR Before
CAR After
Page 49
Dept. Business Administration, RCU Belagavi P a g e | 41
II. Bonus
To analyze the impact of bonus announcement on selected companies the
abnormal returns of beta adjusted share prices of companies having dividend
announcement were found for each day in the event window .
There are five selected bonus announcements companies samples (Recent 5
Companies) are considered for the analysis in the sample companies during the study
period. The abnormal returns of each company on each day are found out and it is
cumulated to get CAR. This part focuses on the effect of dividend information release by
testing the significance of difference in returns between the period before and after the
Dividend announcement.
1. Aurobindo Pharma Ltd.
Calculation AR, CAR and t Test for each day
Before After
Period AR CAR t Test Period AR CAR t Test
-30 0.0052 0.0052 -0.4402 1 -0.0130 -0.0130 -0.5601
-29 -0.0029 0.0023 -0.0852 2 -0.0168 -0.0298 -0.7212
-28 -0.0103 -0.0081 0.5283 3 -0.0006 -0.0304 -0.0268
-27 0.0083 0.0002 -0.8282 4 -0.0009 -0.0313 -0.0368
-26 0.0053 0.0055 0.0801 5 0.0394 0.0081 1.6914
-25 -0.0075 -0.0020 0.1626 6 -0.0138 -0.0057 -0.5935
-24 0.0213 0.0193 0.1618 7 0.0002 -0.0055 0.0086
-23 0.0056 0.0250 0.2649 8 -0.0208 -0.0263 -0.8929
-22 -0.0118 0.0131 0.4304 9 0.0241 -0.0022 1.0357
-21 -0.0029 0.0102 0.3113 10 -0.0081 -0.0103 -0.3478
-20 -0.0190 -0.0088 0.6403 11 0.0007 -0.0096 0.0309
-19 0.0121 0.0033 0.1465 12 0.0009 -0.0086 0.0392
-18 0.0397 0.0430 -0.1608 13 0.0254 0.0167 1.0883
-17 -0.0158 0.0273 0.2355 14 -0.0144 0.0023 -0.6162
-16 0.0025 0.0298 -0.0971 15 0.0153 0.0177 0.6575
-15 -0.0081 0.0217 -0.3522 16 -0.0066 0.0111 -0.2836
-14 0.0235 0.0452 0.2826 17 0.0052 0.0163 0.2232
-13 -0.0091 0.0361 0.4446 18 -0.0116 0.0046 -0.4993
Page 50
Dept. Business Administration, RCU Belagavi P a g e | 42
-12 -0.0336 0.0024 -0.0116 19 -0.0040 0.0006 -0.1730
-11 -0.0048 -0.0024 0.1756 20 0.0355 0.0361 1.5228
-10 0.0112 0.0088 0.2172 21 0.0096 0.0457 0.4132
-9 0.0002 0.0091 -0.0053 22 0.0273 0.0730 1.1736
-8 0.0288 0.0379 -0.7331 23 0.0018 0.0748 0.0773
-7 0.0110 0.0489 -0.1518 24 0.0246 0.0994 1.0545
-6 -0.0049 0.0440 0.1371 25 -0.0023 0.0971 -0.1006
-5 0.0067 0.0507 0.5092 26 0.0128 0.1098 0.5486
-4 0.0115 0.0623 -0.0324 27 -0.0007 0.1092 -0.0281
-3 -0.0165 0.0458 0.3208 28 -0.0107 0.0985 -0.4578
-2 -0.0107 0.0351 0.4158 29 0.0049 0.1035 0.2124
-1 0.0010 0.0362 0.0363 30 0.0050 0.1085 0.2145
Positive AR is seen for 17 days before the bonus announcement and 14 days after
the announcement it shows that stock is giving abnormal return before the announcement
more than after the announcement date.
The above table reveals that AR shows significant there is no increase hence it
can be concluded that abnormal returns cannot be earned on release bonus
announcement.
Hypothesis testing
H1: There is a significant impact on the price of shares due to Corporate Actions
H0: There is no impact on the price of shares due to Corporate Actions
H0 is accepted and H1 rejected
Parametric Test (t-test)
To test the statistical significance of increase in AR due to bonus information t-
test is applied and the result is shown in the table
AR
Before After
Mean 0.0012 0.00361
t Test 1.5533 4.6540
The average abnormal return of 30 days before the announcement of the bonus is
0.0012 which increased to 0.0036 after the announcement. To find whether this
Page 51
Dept. Business Administration, RCU Belagavi P a g e | 43
difference in abnormal return is significant or not, t-test is conducted. The test result
indicates that the difference in price before is not significant and after the bonus
announcement is significant, thus confirms that investor can earn abnormal return after
bonus information. So it is evident that bonus information has no significant impact on
price of shares after event window.
Graph showing CAR before and after Announcement
Above graph showing CAR in before and after announcement is positive it
reveals that there is positive abnormal return both announcement window.
-0.0400
-0.0200
0.0000
0.0200
0.0400
0.0600
0.0800
0.1000
0.1200
1 2 3 4 5 6 7 8 9 10 11 12 13 14 15 16 17 18 19 20 21 22 23 24 25 26 27 28 29 30
Before
After
Page 52
Dept. Business Administration, RCU Belagavi P a g e | 44
2. Federal Bank Ltd.
Calculation AR, CAR and t Test for each day
Before After
Period AR CAR t Test Period AR CAR t Test
-30 0.0214 0.0214 1.3223 1 0.0113 0.0113 0.6982
-29 -0.0048 0.0166 -0.2966 2 -0.0056 0.0057 -0.3446
-28 -0.0168 -0.0002 -1.0358 3 0.0146 0.0203 0.8991
-27 0.0009 0.0007 0.0525 4 -0.0047 0.0156 -0.2929
-26 0.0033 0.0039 0.2013 5 -0.0151 0.0004 -0.9339
-25 0.0105 0.0144 0.6465 6 -0.0240 -0.0236 -1.4790
-24 -0.0129 0.0015 -0.7952 7 -0.0123 -0.0358 -0.7573
-23 -0.0040 -0.0024 -0.2440 8 -0.0694 -0.1052 -4.2832
-22 -0.0031 -0.0055 -0.1890 9 -0.0002 -0.1054 -0.0120
-21 0.0231 0.0176 1.4263 10 -0.0058 -0.1112 -0.3565
-20 -0.0135 0.0041 -0.8337 11 -0.0019 -0.1131 -0.1168
-19 -0.0040 0.0001 -0.2481 12 0.0083 -0.1048 0.5108
-18 -0.0051 -0.0050 -0.3175 13 0.0043 -0.1006 0.2631
-17 0.0014 -0.0037 0.0842 14 0.0082 -0.0923 0.5089
-16 0.0129 0.0092 0.7954 15 -0.0086 -0.1009 -0.5318
-15 0.0342 0.0434 2.1072 16 -0.0091 -0.1100 -0.5617
-14 -0.0159 0.0275 -0.9806 17 -0.0256 -0.1357 -1.5801
-13 -0.0033 0.0242 -0.2044 18 -0.0062 -0.1419 -0.3849
-12 -0.0059 0.0183 -0.3643 19 0.0010 -0.1409 0.0620
-11 -0.0130 0.0053 -0.7998 20 0.0044 -0.1365 0.2692
-10 -0.0013 0.0040 -0.0825 21 -0.0143 -0.1509 -0.8849
-9 0.0481 0.0520 2.9646 22 0.0060 -0.1449 0.3684
-8 -0.0101 0.0419 -0.6240 23 -0.0050 -0.1499 -0.3097
-7 0.0103 0.0522 0.6350 24 0.0132 -0.1367 0.8168
-6 -0.0058 0.0464 -0.3550 25 -0.0131 -0.1498 -0.8085
-5 0.0009 0.0474 0.0571 26 -0.0098 -0.1596 -0.6052
-4 0.0254 0.0727 1.5658 27 0.0122 -0.1474 0.7502
-3 0.0039 0.0767 0.2416 28 0.0125 -0.1350 0.7687
-2 -0.0023 0.0744 -0.1398 29 -0.0036 -0.1386 -0.2213
-1 -0.0147 0.0597 -0.9065 30 -0.0071 -0.1456 -0.4356
Page 53
Dept. Business Administration, RCU Belagavi P a g e | 45
Positive AR is seen for 13 days before the bonus announcement and 11 days after
the announcement it shows that stock is giving abnormal return before the announcement
more than after the announcement date.
The above table reveals that AR shows significant increase only on the -15th
and -
19th
day’s bonus information and hence it can be concluded that abnormal returns cannot
be earned on release bonus announcement.
Hypothesis testing
H1: There is a significant impact on the price of shares due to Corporate Actions
H0: There is no impact on the price of shares due to Corporate Actions
H0 is accepted and H1 rejected
Parametric Test (t- test)
To test the statistical significance between ARs of the pre and post-bonus
announcement period t-test is applied and the result is provided in the table
AR
Before After
Mean 0.00199 -0.00485
t Test 3.68294 -8.9843
The mean value of AR for 30 days before the announcement is 0.0019 and that for
30 days after the announcement is -0.0048. To test the significance of difference t test
(5% level of significance) is applied and from the result of the above analysis it is clear
that the split information will influence share price of the companies in a significant
manner in pre announcement window.
Page 54
Dept. Business Administration, RCU Belagavi P a g e | 46
Graph showing CAR before and after Announcement
Above graph showing CAR in before announcement is positive and Negative
after announcement it reveals that there is positive abnormal return before announcement
window.
-0.2000
-0.1500
-0.1000
-0.0500
0.0000
0.0500
0.1000
1 2 3 4 5 6 7 8 9 10 11 12 13 14 15 16 17 18 19 20 21 22 23 24 25 26 27 28 29 30
CAR Before
CAR After
Page 55
Dept. Business Administration, RCU Belagavi P a g e | 47
3. Kotak Mahindra Bank Ltd.
Calculation AR, CAR and t Test for each day
Before After
Period AR CAR t Test Period AR CAR t Test
-30 -0.0001 -0.0001 -0.01 1 0.0013 0.0013 0.08
-29 -0.0027 -0.0028 -0.17 2 0.0024 0.0037 0.15
-28 0.0077 0.0049 0.50 3 -0.0039 -0.0002 -0.25
-27 -0.0031 0.0018 -0.20 4 -0.0060 -0.0063 -0.39
-26 0.0000 0.0018 0.00 5 -0.0046 -0.0108 -0.30
-25 0.0048 0.0066 0.31 6 0.0298 0.0190 1.92
-24 0.0146 0.0212 0.94 7 -0.0117 0.0073 -0.75
-23 -0.0042 0.0170 -0.27 8 0.0051 0.0124 0.33
-22 0.0090 0.0260 0.58 9 -0.0131 -0.0007 -0.84
-21 -0.0156 0.0104 -1.00 10 -0.0005 -0.0013 -0.03
-20 -0.0095 0.0009 -0.61 11 -0.0063 -0.0076 -0.41
-19 -0.0204 -0.0195 -1.31 12 0.0119 0.0044 0.77
-18 0.0177 -0.0018 1.14 13 0.0073 0.0117 0.47
-17 -0.0169 -0.0187 -1.09 14 0.0217 0.0334 1.40
-16 -0.0032 -0.0219 -0.21 15 -0.0086 0.0248 -0.55
-15 -0.0037 -0.0257 -0.24 16 -0.0199 0.0049 -1.28
-14 -0.0018 -0.0274 -0.11 17 -0.0415 -0.0367 -2.67
-13 0.0060 -0.0215 0.38 18 -0.0094 -0.0461 -0.61
-12 0.0080 -0.0135 0.51 19 0.0031 -0.0430 0.20
-11 0.0139 0.0004 0.90 20 -0.0056 -0.0486 -0.36
-10 0.0046 0.0051 0.30 21 0.0169 -0.0317 1.09
-9 0.0101 0.0152 0.65 22 -0.0002 -0.0319 -0.01
-8 -0.0132 0.0020 -0.85 23 0.0084 -0.0235 0.54
-7 0.0016 0.0036 0.10 24 0.0026 -0.0209 0.16
-6 0.0035 0.0070 0.22 25 -0.0096 -0.0305 -0.62
-5 0.0046 0.0117 0.30 26 0.0079 -0.0226 0.51
-4 0.0186 0.0303 1.20 27 0.0166 -0.0060 1.07
-3 -0.0102 0.0201 -0.66 28 0.0060 0.0000 0.39
-2 0.0052 0.0252 0.33 29 -0.0209 -0.0209 -1.35
-1 -0.0122 0.0130 -0.79 30 0.0065 -0.0144 0.42
Page 56
Dept. Business Administration, RCU Belagavi P a g e | 48
Positive AR is seen for 16 days before the bonus announcement and 14 days after
the announcement it shows that stock is giving abnormal return before the announcement
more than after the announcement date.
The above table reveals that AR shows significant increase only on the 6th
day
Bonus information and hence it can be concluded that abnormal returns cannot be earned
on release Bonus announcement.
Hypothesis testing
H1: There is a significant impact on the price of shares due to Corporate Actions
H0: There is no impact on the price of shares due to Corporate Actions
H0 is accepted and H1 rejected
Parametric Test (t- test)
To test the statistical significance between ARs of the pre and post-bonus
announcement period t-test is applied and the result is provided in the table
AR
Before After
Mean 0.0004 -0.0005
t Test 0.8365 -0.9272
The mean value of AR for 30 days before the announcement is 0.0004 and that for
30 days after the announcement is -0.0005. To test the significance of difference t test
(5% level of significance) is applied and from the result of the above analysis it is clear
that the split information will not influence share price of the companies in a significant
manner.
Page 57
Dept. Business Administration, RCU Belagavi P a g e | 49
Graph showing CAR before and after Announcement
Above graphs are showing CAR in before announcement is positive and Negative
after announcement it reveals that there is positive abnormal return before announcement
window.
-0.0600
-0.0500
-0.0400
-0.0300
-0.0200
-0.0100
0.0000
0.0100
0.0200
0.0300
0.0400
1 2 3 4 5 6 7 8 9 10 11 12 13 14 15 16 17 18 19 20 21 22 23 24 25 26 27 28 29 30
CAR Before
CAR After
Page 58
Dept. Business Administration, RCU Belagavi P a g e | 50
4. Divi's Laboratories Ltd
Calculation AR, CAR and t Test for each day
Before After
Period AR CAR t Test Period AR CAR t Test
-30 0.0419 0.0419 3.1782 1 0.0049 0.0049 0.3709
-29 0.0269 0.0688 2.0371 2 -0.0068 -0.0019 -0.5124
-28 0.0004 0.0692 0.0291 3 -0.0108 -0.0126 -0.8163
-27 -0.0119 0.0573 -0.9013 4 0.0058 -0.0069 0.4373
-26 0.0138 0.0711 1.0450 5 0.0086 0.0018 0.6549
-25 0.0341 0.1052 2.5857 6 -0.0020 -0.0002 -0.1497
-24 0.0519 0.1571 3.9322 7 -0.0049 -0.0051 -0.3687
-23 0.0052 0.1623 0.3916 8 -0.0014 -0.0064 -0.1029
-22 0.0222 0.1845 1.6823 9 -0.0373 -0.0437 -2.8244
-21 -0.0510 0.1335 -3.8656 10 0.0022 -0.0415 0.1637
-20 -0.0358 0.0977 -2.7135 11 0.0033 -0.0382 0.2513
-19 0.0020 0.0997 0.1547 12 0.0002 -0.0381 0.0121
-18 0.0155 0.1152 1.1708 13 -0.0217 -0.0598 -1.6437
-17 0.0089 0.1241 0.6780 14 -0.0099 -0.0697 -0.7535
-16 0.0555 0.1796 4.2054 15 -0.0008 -0.0705 -0.0604
-15 -0.0181 0.1615 -1.3751 16 0.0294 -0.0411 2.2250
-14 -0.0111 0.1504 -0.8397 17 -0.0197 -0.0609 -1.4959
-13 -0.0116 0.1388 -0.8805 18 0.0047 -0.0562 0.3538
-12 -0.0188 0.1200 -1.4255 19 -0.0034 -0.0596 -0.2568
-11 -0.0300 0.0899 -2.2759 20 0.0112 -0.0484 0.8500
-10 -0.0043 0.0856 -0.3239 21 0.0049 -0.0435 0.3694
-9 -0.0256 0.0600 -1.9406 22 0.0128 -0.0307 0.9681
-8 0.0422 0.1023 3.2003 23 0.0156 -0.0151 1.1855
-7 -0.0034 0.0988 -0.2590 24 0.0303 0.0152 2.2974
-6 0.0093 0.1082 0.7049 25 0.0054 0.0206 0.4091
-5 0.0052 0.1133 0.3905 26 0.0286 0.0492 2.1639
-4 0.0053 0.1186 0.3988 27 -0.0086 0.0406 -0.6525
-3 0.0037 0.1223 0.2824 28 -0.0119 0.0287 -0.8997
Page 59
Dept. Business Administration, RCU Belagavi P a g e | 51
-2 -0.0004 0.1219 -0.0270 29 -0.0278 0.0009 -2.1099
-1 0.0036 0.1255 0.2735 30 0.0139 0.0147 1.0510
Positive AR is seen for 18 days before the bonus announcement and 15 days after
the announcement it shows that stock is giving abnormal return before the announcement
more than after the announcement window.
The above table reveals that AR shows significant increase only on the -30th
, -29th
-25 -24 -16 -8 days and +16th
+24th
+26th
days split information and hence it can be
concluded that abnormal returns can be earned on release bonus announcement.
Hypothesis testing
H1: There is a significant impact on the price of shares due to Corporate Actions
H0: There is no impact on the price of shares due to Corporate Actions
H1 is accepted and H0 rejected
Parametric Test (t- test)
To test the statistical significance between ARs of the pre and post- bonus
announcement period t-test is applied and the result is provided in the table
AR
Before After
Mean 0.00418 0.00049
t Test 9.51267 1.11672
The mean value of AR for 30 days before the announcement is 0.0041 and that for
30 days after the announcement is 0.0005. To test the significance of difference t test (5%
level of significance) is applied and from the result of the above analysis it is clear that
the split information will influence share price of the companies in a significant manner.
Page 60
Dept. Business Administration, RCU Belagavi P a g e | 52
Graph showing CAR before and after Announcement
Above graph showing CAR in before and after announcement is positive
announcement it reveals that there is positive abnormal return in both announcement
window.
-0.1000
-0.0500
0.0000
0.0500
0.1000
0.1500
0.2000
1 2 3 4 5 6 7 8 9 10 11 12 13 14 15 16 17 18 19 20 21 22 23 24 25 26 27 28 29 30
CAR Before
CAR Before
Page 61
Dept. Business Administration, RCU Belagavi P a g e | 53
5. Colgate-Palmolive (India) Ltd
Calculation AR, CAR and t Test for each day
Before After
Period AR CAR t Test Period AR CAR t Test
-30 -0.0083 -0.0083 -0.73 1 0.0138 0.0138 1.23
-29 -0.0051 -0.0134 -0.46 2 -0.0005 0.0133 -0.05
-28 0.0021 -0.0113 0.19 3 -0.0082 0.0051 -0.72
-27 -0.0115 -0.0228 -1.02 4 0.0138 0.0189 1.23
-26 -0.0003 -0.0231 -0.03 5 0.0032 0.0221 0.29
-25 0.0028 -0.0203 0.25 6 -0.0086 0.0136 -0.76
-24 0.0034 -0.0169 0.30 7 -0.0056 0.0080 -0.50
-23 0.0047 -0.0122 0.42 8 -0.0168 -0.0088 -1.49
-22 0.0044 -0.0078 0.39 9 -0.0139 -0.0227 -1.23
-21 -0.0079 -0.0158 -0.71 10 0.0016 -0.0211 0.14
-20 -0.0199 -0.0357 -1.77 11 -0.0130 -0.0340 -1.15
-19 0.0100 -0.0257 0.89 12 0.0007 -0.0333 0.06
-18 0.0056 -0.0201 0.49 13 -0.0084 -0.0418 -0.75
-17 -0.0013 -0.0214 -0.11 14 -0.0062 -0.0479 -0.55
-16 0.0057 -0.0157 0.51 15 -0.0049 -0.0529 -0.44
-15 -0.0071 -0.0229 -0.63 16 0.0346 -0.0182 3.08
-14 0.0065 -0.0164 0.57 17 0.0009 -0.0174 0.08
-13 -0.0131 -0.0295 -1.16 18 0.0061 -0.0113 0.54
-12 -0.0067 -0.0361 -0.59 19 -0.0049 -0.0162 -0.43
-11 -0.0151 -0.0512 -1.34 20 -0.0046 -0.0207 -0.40
-10 -0.0268 -0.0781 -2.38 21 0.0131 -0.0076 1.16
-9 0.0082 -0.0699 0.73 22 0.0348 0.0272 3.09
-8 -0.0110 -0.0808 -0.98 23 -0.0015 0.0258 -0.13
-7 0.0229 -0.0579 2.04 24 -0.0164 0.0093 -1.46
-6 0.0339 -0.0241 3.01 25 -0.0177 -0.0084 -1.57
-5 0.0113 -0.0127 1.00 26 0.0102 0.0018 0.90
-4 0.0154 0.0027 1.37 27 -0.0081 -0.0063 -0.72
-3 -0.0218 -0.0191 -1.93 28 0.0021 -0.0042 0.19
-2 0.0094 -0.0097 0.84 29 0.0000 -0.0042 0.00
-1 -0.0133 -0.0230 -1.18 30 0.0230 0.0189 2.05
Page 62
Dept. Business Administration, RCU Belagavi P a g e | 54
Positive AR is seen for 14 days before the split announcement and 13 days after
the announcement it shows that stock is giving abnormal return before the announcement
more than after the announcement date.
The above table reveals that AR shows significant increase only on the -7th
-6th
days and +22nd
30th
days split information and hence it can be concluded that abnormal
returns cannot be earned on release split announcement.
Hypothesis testing
H1: There is a significant impact on the price of shares due to Corporate Actions
H0: There is no impact on the price of shares due to Corporate Actions
H1 is accepted and H0 rejected
Parametric Test (t- test)
To test the statistical significance between ARs of the pre and post-split
announcement period t-test is applied and the result is provided in the table
AR
Before After
Mean -0.0008 0.00063
t Test -2.0381 0.01126
The mean value of AR for 30 days before the announcement is -0.0008 and that
for 30 days after the announcement is 0.0006. To test the significance of difference t test
(5% level of significance) is applied and from the result of the above analysis it is clear
that the split information will not influence share price of the companies in a significant
manner.
Page 63
Dept. Business Administration, RCU Belagavi P a g e | 55
Graph showing CAR before and after Announcement
Above graphs are showing CAR in before and after announcement is positive it
reveals that there is positive abnormal return before announcement window
-0.1000
-0.0800
-0.0600
-0.0400
-0.0200
0.0000
0.0200
0.0400
1 2 3 4 5 6 7 8 9 10 11 12 13 14 15 16 17 18 19 20 21 22 23 24 25 26 27 28 29 30
CAR Before
CAR After
Page 64
Dept. Business Administration, RCU Belagavi P a g e | 56
III. Dividend
To analyze the impact of Dividend announcement on selected companies the
abnormal returns of beta adjusted share prices of companies having dividend
announcement were found for each day in the event window .
There are five selected Dividend announcements companies samples (Recent 5
Companies) are considered for the analysis in the sample companies during the study
period. The abnormal returns of each company on each day are found out and it is
cumulated to get CAR. This part focuses on the effect of dividend information release by
testing the significance of difference in returns between the period before and after the
Dividend announcement.
1. Grasim Industries Ltd.
Calculation AR, CAR and t Test for each day
Before After
Period AR CAR t Test Period AR CAR t Test
-30 -0.0046 -0.0046 -0.47 1 0.0071 0.0071 0.72
-29 0.0014 -0.0032 0.14 2 0.0169 0.0241 1.71
-28 0.0176 0.0144 1.77 3 -0.0015 0.0226 -0.15
-27 0.0042 0.0185 0.42 4 0.0053 0.0279 0.53
-26 -0.0091 0.0094 -0.92 5 -0.0091 0.0188 -0.92
-25 0.0099 0.0193 1.00 6 -0.0024 0.0164 -0.24
-24 -0.0149 0.0044 -1.50 7 -0.0067 0.0097 -0.67
-23 0.0079 0.0123 0.79 8 0.0007 0.0104 0.07
-22 0.0040 0.0162 0.40 9 -0.0012 0.0092 -0.12
-21 -0.0066 0.0096 -0.67 10 -0.0067 0.0025 -0.67
-20 -0.0042 0.0055 -0.42 11 -0.0094 -0.0069 -0.95
-19 0.0173 0.0228 1.74 12 0.0114 0.0045 1.15
-18 -0.0060 0.0168 -0.60 13 0.0008 0.0053 0.08
-17 -0.0053 0.0115 -0.53 14 -0.0064 -0.0011 -0.64
-16 -0.0029 0.0086 -0.29 15 0.0125 0.0114 1.26
-15 -0.0123 -0.0037 -1.24 16 -0.0074 0.0041 -0.74
-14 0.0066 0.0029 0.66 17 0.0017 0.0058 0.17
-13 -0.0029 0.0000 -0.29 18 0.0087 0.0145 0.87
Page 65
Dept. Business Administration, RCU Belagavi P a g e | 57
-12 0.0072 0.0073 0.73 19 0.0032 0.0177 0.32
-11 0.0025 0.0097 0.25 20 -0.0092 0.0085 -0.92
-10 0.0017 0.0114 0.17 21 0.0106 0.0192 1.07
-9 -0.0066 0.0048 -0.66 22 0.0091 0.0283 0.92
-8 0.0169 0.0217 1.70 23 -0.0060 0.0223 -0.60
-7 -0.0134 0.0083 -1.35 24 -0.0023 0.0200 -0.23
-6 0.0036 0.0118 0.36 25 0.0074 0.0274 0.74
-5 0.0001 0.0120 0.02 26 -0.0016 0.0258 -0.16
-4 -0.0179 -0.0059 -1.80 27 -0.0067 0.0191 -0.67
-3 -0.0008 -0.0068 -0.08 28 -0.0060 0.0131 -0.60
-2 0.0180 0.0113 1.82 29 -0.0157 -0.0026 -1.59
-1 0.0085 0.0198 0.86 30 0.0030 0.0004 0.31
Positive AR is seen for 16 days before the Dividend announcement and 13 days
after the announcement it shows that stock is giving abnormal return before the
announcement more than after the announcement date.
The above table reveals that AR shows significant increase only on the -28th
-19th
-8th
-2nd
days and +2 days Dividend information and hence it can be concluded that
abnormal returns can be earned more on before release announcement.
Hypothesis testing
H1: There is a significant impact on the price of shares due to Corporate Actions
H0: There is no impact on the price of shares due to Corporate Actions
H1 is accepted and H0 rejected
Parametric Test (t- test)
To test the statistical significance between ARs of the pre and post announcement
period t-test is applied and the result is provided in the table
AR
Before After
Mean 0.00066 0.0000
t Test 1.9916 0.0447
Page 66
Dept. Business Administration, RCU Belagavi P a g e | 58
The mean value of AR for 30 days before the announcement is 0.0006 and that for
30 days after the announcement is 0.0000. To test the significance of difference t test (5%
level of significance) is applied and from the result of the above analysis it is clear that
the split information will influence before window not influence share price of the
companies in a significant manner.
Graph showing CAR before and after Announcement
Above graph showing CAR in before announcement is positive and Negative
after announcement it reveals that there is positive abnormal return before announcement
window.
-0.0100
0.0000
0.0100
0.0200
0.0300
0.0400
0.0500
1 2 3 4 5 6 7 8 9 10 11 12 13 14 15 16 17 18 19 20 21 22 23 24 25 26 27 28 29 30
CAR After
CAR Befor
Page 67
Dept. Business Administration, RCU Belagavi P a g e | 59
2. Bharat Petroleum Corporation Ltd.
Calculation AR, CAR and t Test for each day
Before After
Period AR CAR t Test Period AR CAR t Test
-30 0.0030 0.0030 0.1750 1 0.0302 0.0302 1.7456
-29 0.0247 0.0277 1.4277 2 0.0053 0.0355 0.3060
-28 0.0004 0.0282 0.0256 3 -0.0039 0.0316 -0.2279
-27 0.0062 0.0344 0.3602 4 -0.0304 0.0011 -1.7579
-26 0.0033 0.0377 0.1888 5 0.0427 0.0438 2.4680
-25 0.0054 0.0431 0.3129 6 -0.0067 0.0371 -0.3893
-24 0.0126 0.0557 0.7268 7 -0.0298 0.0074 -1.7197
-23 -0.0070 0.0487 -0.4039 8 -0.0228 -0.0154 -1.3156
-22 -0.0009 0.0477 -0.0539 9 0.0245 0.0091 1.4156
-21 -0.0114 0.0363 -0.6611 10 0.0134 0.0225 0.7746
-20 -0.0381 -0.0018 -2.2047 11 0.0217 0.0442 1.2532
-19 -0.0199 -0.0217 -1.1486 12 0.0062 0.0503 0.3564
-18 0.0286 0.0069 1.6547 13 -0.0289 0.0215 -1.6692
-17 -0.0119 -0.0050 -0.6887 14 -0.0043 0.0172 -0.2481
-16 0.0043 -0.0007 0.2467 15 0.0010 0.0181 0.0549
-15 0.0225 0.0218 1.3032 16 0.0159 0.0340 0.9172
-14 -0.0067 0.0151 -0.3861 17 0.0113 0.0452 0.6513
-13 -0.0105 0.0046 -0.6062 18 0.0023 0.0476 0.1340
-12 -0.0417 -0.0371 -2.4101 19 0.0130 0.0606 0.7516
-11 0.0165 -0.0205 0.9539 20 -0.0467 0.0139 -2.7001
-10 -0.0370 -0.0576 -2.1391 21 -0.0159 -0.0021 -0.9215
-9 -0.0088 -0.0664 -0.5108 22 0.0049 0.0028 0.2829
-8 0.0374 -0.0290 2.1601 23 -0.0209 -0.0181 -1.2060
-7 -0.0153 -0.0443 -0.8823 24 0.0133 -0.0048 0.7675
-6 0.0343 -0.0100 1.9831 25 -0.0203 -0.0251 -1.1739
-5 -0.0019 -0.0118 -0.1080 26 0.0017 -0.0234 0.0987
-4 -0.0010 -0.0129 -0.0587 27 -0.0170 -0.0404 -0.9843
-3 0.0386 0.0257 2.2285 28 0.0078 -0.0326 0.4489
-2 -0.0168 0.0089 -0.9704 29 0.0167 -0.0160 0.9624
-1 0.0244 0.0333 1.4105 30 0.0030 -0.0130 0.1734
Page 68
Dept. Business Administration, RCU Belagavi P a g e | 60
Positive AR is seen for 15 days before the Dividend announcement and 18 days
after the announcement it shows that stock is giving abnormal return after the
announcement more than before the announcement date.
The above table reveals that AR shows significant increase only on the -8th
-6th
-
3rd
days and +1st days split information and hence it can be concluded that abnormal
returns cannot be earned on release Dividend announcement.
Hypothesis testing
H1: There is a significant impact on the price of shares due to Corporate Actions
H0: There is no impact on the price of shares due to Corporate Actions
H1 is accepted and H0 rejected
Parametric Test (t- test)
To test the statistical significance between ARs of the pre and post announcement
period t-test is applied and the result is provided in the table
AR
Before After
Mean 0.00111 -0.0004
t Test 1.92503 -0.751
The mean value of AR for 30 days before the announcement is 0.0011 and that for
30 days after the announcement is -0.0004. To test the significance of difference t test
(5% level of significance) is applied and from the result of the above analysis it is clear
that the Dividend information will not influence share price of the companies in a
significant manner.
Page 69
Dept. Business Administration, RCU Belagavi P a g e | 61
Graph showing CAR before and after Announcement
Above graph showing CAR in before and after announcement is positive it
reveals that there is positive abnormal return before and after announcement window.
-0.0800
-0.0600
-0.0400
-0.0200
0.0000
0.0200
0.0400
0.0600
0.0800
1 2 3 4 5 6 7 8 9 10 11 12 13 14 15 16 17 18 19 20 21 22 23 24 25 26 27 28 29 30
CAR Before
CAR After
Page 70
Dept. Business Administration, RCU Belagavi P a g e | 62
3. Hindustan Petroleum Corporation Ltd.
Calculation AR, CAR and t Test for each day
Before After
Period AR CAR t Test Period AR CAR t Test
-30 0.0176 0.0176 0.93 1 -0.0210 -0.0210 -1.11
-29 0.0082 0.0258 0.43 2 -0.0042 -0.0252 -0.22
-28 0.0205 0.0463 1.09 3 0.0080 -0.0171 0.43
-27 0.0325 0.0788 1.72 4 0.0016 -0.0155 0.09
-26 0.0171 0.0960 0.91 5 -0.0266 -0.0421 -1.41
-25 -0.0070 0.0890 -0.37 6 0.0014 -0.0407 0.08
-24 -0.0009 0.0881 -0.05 7 0.0095 -0.0312 0.51
-23 -0.0320 0.0561 -1.70 8 -0.0001 -0.0313 -0.01
-22 -0.0190 0.0372 -1.00 9 0.0078 -0.0234 0.42
-21 0.0084 0.0456 0.45 10 0.0079 -0.0156 0.42
-20 -0.0177 0.0279 -0.94 11 -0.0501 -0.0657 -2.65
-19 -0.0040 0.0239 -0.21 12 -0.0340 -0.0997 -1.80
-18 0.0703 0.0942 3.72 13 0.0094 -0.0903 0.50
-17 -0.0008 0.0934 -0.04 14 0.0268 -0.0635 1.42
-16 0.0000 0.0935 0.00 15 0.0209 -0.0426 1.11
-15 -0.0573 0.0361 -3.04 16 -0.0157 -0.0583 -0.83
-14 -0.0043 0.0318 -0.23 17 0.0095 -0.0488 0.51
-13 -0.0322 -0.0004 -1.71 18 -0.0214 -0.0702 -1.14
-12 -0.0051 -0.0055 -0.27 19 -0.0057 -0.0759 -0.30
-11 0.0257 0.0202 1.36 20 -0.0005 -0.0764 -0.02
-10 -0.0168 0.0034 -0.89 21 -0.0168 -0.0932 -0.89
-9 0.0099 0.0132 0.52 22 0.0236 -0.0696 1.25
-8 0.0007 0.0140 0.04 23 -0.0245 -0.0941 -1.30
-7 -0.0176 -0.0036 -0.93 24 0.0067 -0.0874 0.35
-6 0.0469 0.0433 2.48 25 -0.0341 -0.1215 -1.81
-5 -0.0040 0.0393 -0.21 26 -0.0007 -0.1222 -0.04
-4 0.0012 0.0405 0.07 27 0.0094 -0.1128 0.50
-3 -0.0106 0.0299 -0.56 28 -0.0036 -0.1164 -0.19
Page 71
Dept. Business Administration, RCU Belagavi P a g e | 63
-2 0.0215 0.0514 1.14 29 0.0164 -0.1000 0.87
-1 -0.0022 0.0492 -0.12 30 0.0145 -0.0855 0.77
Positive AR is seen for 13 days before the dividend announcement and 15 days
after the announcement it shows that stock is giving abnormal return after the
announcement more than before the announcement date.
The above table reveals that AR shows significant increase only on the -27th
-18 -
6 days dividend information and hence it can be concluded that abnormal returns cannot
be earned on release split announcement.
Hypothesis testing
H1: There is a significant impact on the price of shares due to Corporate Actions
H0: There is no impact on the price of shares due to Corporate Actions
H0 is accepted and H1 rejected
Parametric Test (t- test)
To test the statistical significance between ARs of the pre and post announcement
period t-test is applied and the result is provided in the table
AR
Before After
Mean 0.0016 -0.0028
t Test 2.6048 -4.5280
The mean value of AR for 30 days before the announcement is 0.0016 and that for
30 days after the announcement is -0.0028. To test the significance of difference t test
(5% level of significance) is applied and from the result of the above analysis it is clear
that the dividend information will influence share price of the companies in a significant
manner.
Page 72
Dept. Business Administration, RCU Belagavi P a g e | 64
Graph showing CAR before and after Announcement
Above graph showing CAR in before announcement is positive and Negative
after announcement it reveals that there is positive abnormal return before announcement
window.
-0.1500
-0.1000
-0.0500
0.0000
0.0500
0.1000
0.1500
1 2 3 4 5 6 7 8 9 10 11 12 13 14 15 16 17 18 19 20 21 22 23 24 25 26 27 28 29 30
CAR Before
CAR After
Page 73
Dept. Business Administration, RCU Belagavi P a g e | 65
4. Larsen & Toubro Ltd.
Calculation AR, CAR and t Test for each day
Before After
Period AR CAR t Test Period AR CAR t Test
-30 -0.0028 -0.0028 -0.27 1 -0.0109 -0.0109 -1.03
-29 -0.0061 -0.0089 -0.58 2 0.0114 0.0005 1.07
-28 -0.0091 -0.0181 -0.86 3 -0.0003 0.0001 -0.03
-27 -0.0084 -0.0265 -0.79 4 -0.0021 -0.0020 -0.20
-26 -0.0143 -0.0407 -1.34 5 0.0206 0.0186 1.94
-25 0.0100 -0.0308 0.94 6 0.0018 0.0204 0.17
-24 0.0134 -0.0174 1.26 7 0.0154 0.0358 1.45
-23 -0.0134 -0.0309 -1.27 8 -0.0082 0.0276 -0.77
-22 -0.0042 -0.0351 -0.40 9 -0.0077 0.0199 -0.72
-21 -0.0070 -0.0421 -0.65 10 -0.0237 -0.0038 -2.23
-20 -0.0023 -0.0443 -0.21 11 -0.0130 -0.0168 -1.22
-19 -0.0037 -0.0481 -0.35 12 -0.0152 -0.0320 -1.43
-18 0.0242 -0.0238 2.28 13 0.0074 -0.0246 0.69
-17 0.0056 -0.0182 0.53 14 -0.0249 -0.0495 -2.35
-16 -0.0051 -0.0233 -0.48 15 0.0030 -0.0465 0.29
-15 -0.0031 -0.0264 -0.29 16 -0.0244 -0.0709 -2.30
-14 -0.0049 -0.0313 -0.46 17 -0.0142 -0.0851 -1.34
-13 -0.0014 -0.0326 -0.13 18 0.0079 -0.0772 0.74
-12 0.0027 -0.0299 0.25 19 -0.0003 -0.0775 -0.03
-11 -0.0087 -0.0387 -0.82 20 0.0145 -0.0630 1.37
-10 0.0114 -0.0273 1.07 21 0.0212 -0.0419 1.99
-9 0.0046 -0.0228 0.43 22 -0.0021 -0.0440 -0.20
-8 -0.0033 -0.0261 -0.31 23 -0.0085 -0.0524 -0.80
-7 -0.0156 -0.0416 -1.47 24 -0.0011 -0.0535 -0.10
-6 -0.0025 -0.0442 -0.24 25 0.0027 -0.0508 0.25
-5 -0.0167 -0.0608 -1.57 26 0.0074 -0.0434 0.70
-4 -0.0098 -0.0707 -0.93 27 -0.0038 -0.0472 -0.35
-3 -0.0024 -0.0730 -0.22 28 0.0005 -0.0467 0.05
-2 -0.0072 -0.0803 -0.68 29 0.0049 -0.0418 0.46
-1 -0.0041 -0.0843 -0.38 30 0.0215 -0.0202 2.03
Page 74
Dept. Business Administration, RCU Belagavi P a g e | 66
Positive AR is seen for 6 days before the dividend announcement and 8 days after
the announcement it shows that stock is giving abnormal return after the announcement
more than before the announcement date.
The above table reveals that AR shows significant increase only on the -18th
days
and +5th
+21 +30 days dividend information and hence it can be concluded that abnormal
returns can be earned on release dividend announcement.
Hypothesis testing
H1: There is a significant impact on the price of shares due to Corporate Actions
H0: There is no impact on the price of shares due to Corporate Actions
H1 is accepted and H0 rejected
Parametric Test (t- test)
To test the statistical significance between ARs of the pre and post announcement
period t-test is applied and the result is provided in the table
AR
Before After
Mean -0.0028 -0.0007
t Test -7.9423 -0.0635
The mean value of AR for 30 days before the announcement is -0.0028 and that
for 30 days after the announcement is -0.0007. To test the significance of difference t test
(5% level of significance) is applied and from the result of the above analysis it is clear
that the split information will not influence share price of the companies in a significant
manner.
Graph showing CAR before and after Announcement
Page 75
Dept. Business Administration, RCU Belagavi P a g e | 67
Above graph showing CAR in before and after announcement is Negative t it
reveals that there is no positive abnormal return in both announcement window.
-0.1000
-0.0800
-0.0600
-0.0400
-0.0200
0.0000
0.0200
0.0400
0.0600
1 2 3 4 5 6 7 8 9 10 11 12 13 14 15 16 17 18 19 20 21 22 23 24 25 26 27 28 29 30
CAR Before
CAR After
Page 76
Dept. Business Administration, RCU Belagavi P a g e | 68
5. Maruti Suzuki India Ltd.
Calculation AR, CAR and t Test for each day
Before After
Period AR CAR t Test Period AR CAR t Test
-30 0.0192 0.0192 1.62 1 -0.0200 -0.0200 -1.69
-29 -0.0025 0.0167 -0.21 2 -0.0035 -0.0235 -0.29
-28 0.0025 0.0192 0.21 3 -0.0060 -0.0294 -0.50
-27 -0.0039 0.0153 -0.33 4 -0.0057 -0.0351 -0.48
-26 0.0045 0.0198 0.38 5 0.0011 -0.0340 0.09
-25 -0.0032 0.0165 -0.27 6 0.0161 -0.0179 1.36
-24 0.0145 0.0311 1.22 7 0.0008 -0.0171 0.06
-23 0.0065 0.0375 0.55 8 0.0136 -0.0035 1.14
-22 0.0027 0.0403 0.23 9 0.0028 -0.0007 0.24
-21 0.0077 0.0480 0.65 10 0.0223 0.0215 1.88
-20 0.0147 0.0626 1.24 11 0.0028 0.0243 0.23
-19 -0.0010 0.0616 -0.09 12 0.0042 0.0285 0.36
-18 -0.0027 0.0590 -0.23 13 -0.0094 0.0191 -0.79
-17 0.0214 0.0804 1.81 14 0.0081 0.0272 0.68
-16 0.0026 0.0830 0.22 15 -0.0009 0.0263 -0.08
-15 0.0014 0.0844 0.12 16 0.0011 0.0274 0.10
-14 -0.0069 0.0775 -0.58 17 0.0196 0.0470 1.65
-13 0.0020 0.0795 0.17 18 0.0139 0.0609 1.17
-12 0.0143 0.0938 1.20 19 0.0022 0.0631 0.18
-11 0.0089 0.1027 0.75 20 0.0137 0.0768 1.16
-10 0.0004 0.1031 0.03 21 -0.0005 0.0763 -0.04
-9 0.0098 0.1129 0.83 22 0.0263 0.1026 2.21
-8 0.0013 0.1142 0.11 23 -0.0093 0.0933 -0.78
-7 -0.0046 0.1097 -0.38 24 -0.0243 0.0690 -2.05
-6 0.0202 0.1298 1.70 25 -0.0549 0.0141 -4.63
-5 0.0051 0.1350 0.43 26 -0.0171 -0.0030 -1.44
-4 0.0037 0.1387 0.31 27 0.0009 -0.0021 0.07
-3 -0.0056 0.1331 -0.47 28 0.0017 -0.0004 0.14
-2 -0.0144 0.1187 -1.21 29 -0.0241 -0.0245 -2.03
-1 -0.0233 0.0953 -1.97 30 -0.0060 -0.0305 -0.51
Page 77
Dept. Business Administration, RCU Belagavi P a g e | 69
Positive AR is seen for 21 days before the dividend announcement and 16 days
after the announcement it shows that stock is giving abnormal return before the
announcement more than after the announcement date.
The above table reveals that AR shows significant increase only on the -16th
-17
days and +10 +22th
days dividend information and hence it can be concluded that
abnormal returns can be earned on release dividend announcement.
Hypothesis testing
H1: There is a significant impact on the price of shares due to Corporate Actions
H0: There is no impact on the price of shares due to Corporate Actions
H0 is accepted and H1 rejected
Parametric Test (t- test)
To test the statistical significance between ARs of the pre and post announcement
period t-test is applied and the result is provided in the table
AR
Before After
Mean 0.0032 -0.0010
t Test 8.0350 -2.5693
The mean value of AR for 30 days before the announcement is 0.0032 and that for
30 days after the announcement is -0.0010. To test the significance of difference t test
(5% level of significance) is applied and from the result of the above analysis it is clear
that the dividend information will influence share price of the companies in a significant
manner before announcement window.
Page 78
Dept. Business Administration, RCU Belagavi P a g e | 70
Graph showing CAR before and after Announcement
Above graphs are showing CAR in before announcement is positive and Negative
after announcement it reveals that there is positive abnormal return before announcement
window.
-0.0600
-0.0400
-0.0200
0.0000
0.0200
0.0400
0.0600
0.0800
0.1000
0.1200
0.1400
0.1600
1 2 3 4 5 6 7 8 9 10 11 12 13 14 15 16 17 18 19 20 21 22 23 24 25 26 27 28 29 30
CAR Before
CAR After
Page 79
Dept. Business Administration, RCU Belagavi P a g e | 71
IV. MERGER and AQUISION
To analyze the impact of Merger and acquisition announcement on selected
companies the abnormal returns of beta adjusted share prices of companies having
dividend announcement were found for each day in the event window .
There are five selected Merger and acquisition announcements companies
samples (Recent 5 Companies) are considered for the analysis in the sample companies
during the study period. The abnormal returns of each company on each day are found
out and it is cumulated to get CAR. This part focuses on the effect of dividend
information release by testing the significance of difference in returns between the period
before and after the Merger and acquisition announcement.
1. Asian paint
Calculation AR, CAR and t Test for each day
Before After
Period AR CAR t Test Period AR CAR t Test
-30 -0.0168 -0.0168 -0.92 1 0.0396 0.0396 2.18
-29 0.0204 0.0036 1.12 2 -0.0088 0.0308 -0.49
-28 0.0012 0.0048 0.07 3 -0.0396 -0.0088 -2.18
-27 0.0056 0.0104 0.31 4 0.0102 0.0014 0.56
-26 -0.0057 0.0047 -0.31 5 -0.0099 -0.0085 -0.54
-25 0.0137 0.0184 0.76 6 0.0065 -0.0019 0.36
-24 0.0086 0.0271 0.48 7 -0.0033 -0.0052 -0.18
-23 0.0002 0.0273 0.01 8 -0.0099 -0.0151 -0.55
-22 0.0073 0.0346 0.40 9 0.0050 -0.0101 0.28
-21 -0.0039 0.0307 -0.21 10 -0.0053 -0.0154 -0.29
-20 -0.0173 0.0134 -0.95 11 0.0128 -0.0026 0.71
-19 -0.0159 -0.0026 -0.88 12 0.0150 0.0124 0.82
-18 0.0069 0.0043 0.38 13 0.0030 0.0154 0.16
-17 0.0020 0.0063 0.11 14 -0.0187 -0.0033 -1.03
-16 -0.0098 -0.0035 -0.54 15 0.0144 0.0110 0.79
-15 -0.0170 -0.0205 -0.93 16 -0.0025 0.0086 -0.14
-14 0.0037 -0.0167 0.20 17 0.0014 0.0099 0.08
Page 80
Dept. Business Administration, RCU Belagavi P a g e | 72
-13 -0.0086 -0.0254 -0.48 18 -0.0078 0.0021 -0.43
-12 -0.0260 -0.0514 -1.43 19 -0.0132 -0.0111 -0.73
-11 0.0205 -0.0309 1.13 20 -0.0055 -0.0166 -0.30
-10 -0.0108 -0.0417 -0.60 21 -0.0241 -0.0407 -1.33
-9 0.0160 -0.0257 0.88 22 -0.0072 -0.0479 -0.40
-8 0.0057 -0.0199 0.32 23 -0.0132 -0.0611 -0.73
-7 0.0027 -0.0172 0.15 24 0.0047 -0.0564 0.26
-6 -0.0018 -0.0190 -0.10 25 0.0041 -0.0523 0.22
-5 0.0111 -0.0080 0.61 26 0.0161 -0.0362 0.89
-4 -0.0211 -0.0290 -1.16 27 0.0086 -0.0276 0.48
-3 0.0048 -0.0243 0.26 28 -0.0033 -0.0308 -0.18
-2 0.0001 -0.0242 0.01 29 0.0098 -0.0211 0.54
-1 -0.0053 -0.0294 -0.29 30 0.0003 -0.0208 0.01
Positive AR is seen for 17 days before the Merger and acquisition announcement
and 14 days after the announcement it shows that stock is giving abnormal return before
the announcement more than after the announcement date.
The above table reveals that AR shows significant increase only on the +2nd
days
Merger and acquisition information and hence it can be concluded that abnormal returns
cannot be earned on release Merger and acquisition announcement.
Hypothesis testing
H1: There is a significant impact on the price of shares due to Corporate Actions
H0: There is no impact on the price of shares due to Corporate Actions
H0 is accepted and H1 rejected
Parametric Test (t- test)
To test the statistical significance between ARs of the pre and post announcement
period t-test is applied and the result is provided in the table
AR
Before After
Mean -0.001 -0.0007
t Test -1.6212 -1.1482
Page 81
Dept. Business Administration, RCU Belagavi P a g e | 73
The mean value of AR for 30 days before the announcement is -0.001 and that for
30 days after the announcement is -0.0007. To test the significance of difference t test
(5% level of significance) is applied and from the result of the above analysis it is clear
that the Merger and acquisition information will not influence share price of the
companies in a significant manner.
Graph showing CAR before and after Announcement
Above graph showing CAR in before announcement is positive and Negative
after announcement it reveals that there is positive abnormal return before announcement
window
-0.0800
-0.0600
-0.0400
-0.0200
0.0000
0.0200
0.0400
0.0600
1 2 3 4 5 6 7 8 9 10 11 12 13 14 15 16 17 18 19 20 21 22 23 24 25 26 27 28 29 30
CAR Before
CAR After
Page 82
Dept. Business Administration, RCU Belagavi P a g e | 74
2. Kotak Mahindra Bank
Calculation AR, CAR and t Test for each day
Before After
Period AR CAR t Test Period AR CAR t Test
-30 0.0092 0.0092 0.60 1 0.0275 0.0275 1.78
-29 -0.0055 0.0037 -0.35 2 0.0212 0.0487 1.38
-28 -0.0015 0.0022 -0.10 3 -0.0115 0.0372 -0.75
-27 0.0187 0.0209 1.21 4 -0.0135 0.0237 -0.87
-26 0.0267 0.0476 1.74 5 0.0369 0.0606 2.40
-25 -0.0079 0.0397 -0.52 6 -0.0091 0.0515 -0.59
-24 0.0033 0.0430 0.21 7 0.0139 0.0654 0.91
-23 -0.0125 0.0305 -0.81 8 0.0056 0.0710 0.36
-22 0.0408 0.0712 2.65 9 -0.0146 0.0564 -0.95
-21 0.0004 0.0716 0.02 10 -0.0149 0.0415 -0.96
-20 -0.0013 0.0703 -0.08 11 0.0028 0.0443 0.18
-19 0.0063 0.0767 0.41 12 -0.0064 0.0379 -0.42
-18 0.0010 0.0777 0.07 13 0.0007 0.0386 0.05
-17 -0.0220 0.0557 -1.43 14 0.0151 0.0538 0.98
-16 -0.0087 0.0470 -0.57 15 0.0020 0.0558 0.13
-15 0.0236 0.0705 1.53 16 -0.0134 0.0423 -0.87
-14 -0.0123 0.0583 -0.80 17 -0.0057 0.0366 -0.37
-13 -0.0094 0.0488 -0.61 18 -0.0032 0.0334 -0.21
-12 -0.0181 0.0308 -1.17 19 0.0067 0.0401 0.44
-11 0.0085 0.0393 0.55 20 -0.0111 0.0290 -0.72
-10 0.0067 0.0460 0.43 21 0.0631 0.0921 4.10
-9 -0.0102 0.0358 -0.66 22 -0.0319 0.0603 -2.07
-8 0.0177 0.0535 1.15 23 -0.0282 0.0321 -1.83
-7 0.0007 0.0542 0.05 24 0.0043 0.0364 0.28
-6 0.0062 0.0604 0.40 25 -0.0030 0.0334 -0.19
-5 -0.0114 0.0490 -0.74 26 0.0022 0.0356 0.14
-4 -0.0005 0.0485 -0.03 27 0.0055 0.0410 0.35
-3 -0.0035 0.0450 -0.23 28 -0.0077 0.0334 -0.50
Page 83
Dept. Business Administration, RCU Belagavi P a g e | 75
-2 -0.0023 0.0427 -0.15 29 0.0077 0.0411 0.50
-1 -0.0017 0.0410 -0.11 30 0.0047 0.0457 0.30
Positive AR is seen for 14 days before the merger and acquisition announcement
and 16 days after the announcement it shows that stock is giving abnormal return after
the announcement more than before the announcement date.
The above table reveals that AR shows significant increase only on the -22nd
26th
days and +1st +5
th +21
st days merger and acquisition information and hence it can be
concluded that abnormal returns can be earned on release Merger and acquisition
announcement.
Hypothesis testing
H1: There is a significant impact on the price of shares due to Corporate Actions
H0: There is no impact on the price of shares due to Corporate Actions
H1 is accepted and H0 rejected
Parametric Test (t- test)
To test the statistical significance between ARs of the pre and post announcement
period t-test is applied and the result is provided in the table
AR
Before After
Mean 0.0014 0.0015
t Test 2.6640 2.9687
The mean value of AR for 30 days before the announcement is 0.0014 and that for
30 days after the announcement is 0.0015. To test the significance of difference t test (5%
level of significance) is applied and from the result of the above analysis it is clear that
the merger and acquisition information will influence share price of the companies in a
significant manner.
Page 84
Dept. Business Administration, RCU Belagavi P a g e | 76
Graph showing CAR before and after Announcement
Above graphs are showing CAR in before announcement is positive and Negati69ve after
announcement it reveals that there is positive abnormal return before announcement
window.
0.0000
0.0100
0.0200
0.0300
0.0400
0.0500
0.0600
0.0700
0.0800
0.0900
0.1000
1 2 3 4 5 6 7 8 9 10 11 12 13 14 15 16 17 18 19 20 21 22 23 24 25 26 27 28 29 30
CAR Before
CAR After
Page 85
Dept. Business Administration, RCU Belagavi P a g e | 77
3. TCS
Calculation AR, CAR and t Test for each day
Before After
Period AR CAR t Test Period AR CAR t Test
-30 0.0072 0.0072 0.62 1 -0.0014 -0.0014 -0.13
-29 0.0082 0.0154 0.71 2 0.0184 0.0170 1.60
-28 -0.0052 0.0102 -0.45 3 -0.0027 0.0143 -0.23
-27 -0.0011 0.0091 -0.10 4 -0.0081 0.0063 -0.70
-26 -0.0267 -0.0176 -2.31 5 -0.0016 0.0047 -0.13
-25 -0.0214 -0.0390 -1.85 6 -0.0044 0.0003 -0.38
-24 0.0089 -0.0301 0.77 7 -0.0109 -0.0106 -0.94
-23 -0.0033 -0.0334 -0.28 8 0.0093 -0.0012 0.81
-22 0.0148 -0.0185 1.28 9 -0.0102 -0.0114 -0.88
-21 -0.0080 -0.0265 -0.69 10 -0.0053 -0.0167 -0.46
-20 0.0079 -0.0186 0.68 11 -0.0005 -0.0172 -0.04
-19 0.0079 -0.0107 0.69 12 0.0013 -0.0159 0.11
-18 -0.0016 -0.0123 -0.14 13 0.0255 0.0096 2.21
-17 -0.0195 -0.0317 -1.69 14 -0.0021 0.0076 -0.18
-16 -0.0141 -0.0458 -1.22 15 -0.0108 -0.0032 -0.94
-15 0.0102 -0.0356 0.88 16 0.0032 0.0000 0.28
-14 0.0063 -0.0293 0.55 17 -0.0068 -0.0069 -0.59
-13 0.0035 -0.0257 0.31 18 -0.0050 -0.0119 -0.44
-12 0.0005 -0.0252 0.05 19 -0.0020 -0.0139 -0.17
-11 -0.0140 -0.0392 -1.21 20 0.0015 -0.0123 0.13
-10 0.0054 -0.0338 0.47 21 -0.0035 -0.0159 -0.30
-9 -0.0015 -0.0353 -0.13 22 0.0001 -0.0157 0.01
-8 0.0009 -0.0344 0.08 23 -0.0006 -0.0163 -0.05
-7 0.0095 -0.0248 0.82 24 -0.0042 -0.0205 -0.36
-6 0.0113 -0.0136 0.97 25 -0.0015 -0.0220 -0.13
-5 -0.0077 -0.0213 -0.67 26 0.0007 -0.0213 0.06
-4 0.0097 -0.0116 0.84 27 0.0006 -0.0207 0.05
-3 0.0165 0.0050 1.43 28 0.0154 -0.0053 1.33
-2 0.0337 0.0386 2.91 29 0.0099 0.0046 0.86
-1 -0.0130 0.0256 -1.13 30 -0.0026 0.0020 -0.22
Page 86
Dept. Business Administration, RCU Belagavi P a g e | 78
Positive AR is seen for 14 days before the merger and acquisition announcement
and 10 days after the announcement it shows that stock is giving abnormal return before
the announcement more than after the announcement date.
The above table reveals that AR shows significant increase only on the -12th
days
and +19th
days merger and acquisition information and hence it can be concluded that
abnormal returns cannot be earned on release merger and acquisition announcement.
Hypothesis testing
H1: There is a significant impact on the price of shares due to Corporate Actions
H0: There is no impact on the price of shares due to Corporate Actions
H0 is accepted and H1 rejected
Parametric Test (t- test)
To test the statistical significance between ARs of the pre and post announcement
period t-test is applied and the result is provided in the table
AR
Before After
Mean 0.0009 0.0001
t Test 2.2177 0.0115
The mean value of AR for 30 days before the announcement is 0.0009 and that for
30 days after the announcement is 0.0001. To test the significance of difference t test (5%
level of significance) is applied and from the result of the above analysis it is clear that
the merger and acquisition information will not influence share price of the companies in
a significant manner.
Page 87
Dept. Business Administration, RCU Belagavi P a g e | 79
Graph showing CAR before and after Announcement
Above graph showing CAR in before announcement is positive and Negative
after announcement it reveals that there is positive abnormal return before announcement
window.
-0.0600
-0.0500
-0.0400
-0.0300
-0.0200
-0.0100
0.0000
0.0100
0.0200
0.0300
0.0400
0.0500
1 2 3 4 5 6 7 8 9 10 11 12 13 14 15 16 17 18 19 20 21 22 23 24 25 26 27 28 29 30
CAR Before
CAR After
Page 88
Dept. Business Administration, RCU Belagavi P a g e | 80
4. Sun pharma
Calculation AR, CAR and t Test for each day
Before After
Period AR CAR t Test Period AR CAR t Test
-30 -0.0008 -0.0008 -0.06 1 -0.0040 -0.0040 -0.32
-29 -0.0032 -0.0040 -0.26 2 -0.0348 -0.0388 -2.78
-28 0.0005 -0.0035 0.04 3 0.0041 -0.0346 0.33
-27 -0.0203 -0.0238 -1.62 4 0.0243 -0.0104 1.94
-26 -0.0257 -0.0495 -2.05 5 -0.0232 -0.0336 -1.85
-25 0.0084 -0.0411 0.67 6 -0.0238 -0.0574 -1.90
-24 0.0335 -0.0076 2.67 7 -0.0450 -0.1023 -3.59
-23 0.0113 0.0037 0.90 8 0.0135 -0.0889 1.08
-22 0.0179 0.0217 1.43 9 -0.0899 -0.1787 -7.17
-21 0.0672 0.0889 5.36 10 0.0142 -0.1646 1.13
-20 0.0310 0.1199 2.48 11 -0.0246 -0.1892 -1.96
-19 0.0115 0.1315 0.92 12 0.0101 -0.1791 0.80
-18 -0.0144 0.1171 -1.15 13 -0.0178 -0.1969 -1.42
-17 -0.0136 0.1035 -1.09 14 -0.0061 -0.2030 -0.48
-16 0.0207 0.1242 1.65 15 0.0177 -0.1853 1.41
-15 -0.0171 0.1071 -1.36 16 0.0023 -0.1829 0.19
-14 0.0165 0.1237 1.32 17 0.0007 -0.1822 0.06
-13 0.0071 0.1308 0.57 18 0.0124 -0.1698 0.99
-12 0.0059 0.1367 0.47 19 -0.0122 -0.1820 -0.97
-11 0.0034 0.1401 0.27 20 -0.0069 -0.1888 -0.55
-10 -0.0150 0.1251 -1.20 21 0.0074 -0.1815 0.59
-9 -0.0016 0.1236 -0.13 22 0.0179 -0.1636 1.43
-8 0.0155 0.1391 1.24 23 -0.0050 -0.1686 -0.40
-7 0.0136 0.1527 1.09 24 0.0008 -0.1678 0.07
-6 -0.0168 0.1360 -1.34 25 -0.0116 -0.1794 -0.93
-5 -0.0167 0.1192 -1.34 26 0.0004 -0.1790 0.03
-4 -0.0066 0.1126 -0.53 27 0.0067 -0.1723 0.53
-3 0.0115 0.1241 0.92 28 -0.0009 -0.1733 -0.08
-2 0.0493 0.1734 3.94 29 0.0081 -0.1651 0.65
-1 0.0767 0.2502 6.12 30 0.0152 -0.1499 1.21
Page 89
Dept. Business Administration, RCU Belagavi P a g e | 81
Positive AR is seen for 18 days before the merger and acquisition announcement
and 16 days after the announcement it shows that stock is giving abnormal return before
the announcement more than after the announcement date.
The above table reveals that AR shows significant increase only on the -24th
-21st
20th
-2nd
-1st days and +4
th days merger and acquisition information and hence it can be
concluded that abnormal returns can be earned on release Merger and acquisition
announcement.
Hypothesis testing
H1: There is a significant impact on the price of shares due to Corporate Actions
H0: There is no impact on the price of shares due to Corporate Actions
H1 is accepted and H0 rejected
Parametric Test (t- test)
To test the statistical significance between ARs of the pre and post announcement
period t-test is applied and the result is provided in the table
AR
Before After
Mean 0.0083 -0.0050
t Test 19.9591 -11.9617
The mean value of AR for 30 days before the announcement is 0.0083 and that for
30 days after the announcement is -0.0050. To test the significance of difference t test
(5% level of significance) is applied and from the result of the above analysis it is clear
that the merger and acquisition information will influence share price of the companies in
a significant manner before announcement window.
Page 90
Dept. Business Administration, RCU Belagavi P a g e | 82
Graph showing CAR before and before Announcement
Above graph showing CAR in before announcement is positive and Negative
after announcement it reveals that there is positive abnormal return before announcement
window.
-0.2500
-0.2000
-0.1500
-0.1000
-0.0500
0.0000
0.0500
0.1000
0.1500
0.2000
0.2500
0.3000
1 2 3 4 5 6 7 8 9 10 11 12 13 14 15 16 17 18 19 20 21 22 23 24 25 26 27 28 29 30
CAR Before
CAR After
Page 91
Dept. Business Administration, RCU Belagavi P a g e | 83
5. Lupin
Calculation AR, CAR and t Test for each day
Before After
Period AR CAR t Test Period AR CAR t Test
-30 -0.0163 -0.0163 -0.84 1 -0.0283 -0.0283 -1.46
-29 0.0062 -0.0101 0.32 2 -0.0215 -0.0498 -1.10
-28 -0.0064 -0.0165 -0.33 3 -0.0029 -0.0527 -0.15
-27 -0.0139 -0.0304 -0.71 4 0.0154 -0.0373 0.79
-26 0.0181 -0.0123 0.93 5 -0.0115 -0.0488 -0.59
-25 0.0267 0.0144 1.37 6 0.0337 -0.0151 1.73
-24 0.0109 0.0253 0.56 7 -0.0203 -0.0354 -1.04
-23 -0.0124 0.0128 -0.64 8 -0.0112 -0.0466 -0.57
-22 -0.0236 -0.0108 -1.21 9 0.0177 -0.0289 0.91
-21 0.0205 0.0097 1.06 10 0.0117 -0.0172 0.60
-20 0.0110 0.0207 0.56 11 -0.0034 -0.0206 -0.17
-19 0.0044 0.0251 0.23 12 0.0047 -0.0159 0.24
-18 0.0028 0.0279 0.14 13 0.0046 -0.0113 0.24
-17 0.0250 0.0530 1.29 14 0.0226 0.0113 1.16
-16 -0.0114 0.0416 -0.59 15 0.0218 0.0331 1.12
-15 -0.0041 0.0375 -0.21 16 0.0080 0.0411 0.41
-14 0.0137 0.0512 0.70 17 0.0019 0.0430 0.10
-13 0.0072 0.0584 0.37 18 -0.0215 0.0215 -1.10
-12 -0.0064 0.0520 -0.33 19 0.0206 0.0422 1.06
-11 -0.0062 0.0458 -0.32 20 0.0612 0.1034 3.14
-10 0.0088 0.0546 0.45 21 -0.0032 0.1002 -0.16
-9 -0.0109 0.0437 -0.56 22 0.0016 0.1018 0.08
-8 0.0027 0.0464 0.14 23 0.0067 0.1086 0.35
-7 0.0132 0.0596 0.68 24 -0.0024 0.1061 -0.12
-6 0.0105 0.0701 0.54 25 0.0332 0.1394 1.71
-5 -0.0008 0.0693 -0.04 26 -0.0223 0.1170 -1.15
-4 0.0096 0.0789 0.49 27 0.0370 0.1540 1.90
-3 0.0021 0.0810 0.11 28 -0.0200 0.1341 -1.03
-2 -0.0416 0.0394 -2.14 29 0.0151 0.1492 0.78
-1 -0.0409 -0.0015 -2.10 30 -0.0180 0.1312 -0.93
Page 92
Dept. Business Administration, RCU Belagavi P a g e | 84
Positive AR is seen for 17 days before the merger and acquisition announcement
and 17 days after the announcement it shows that stock is giving abnormal return both the
announcement window.
The above table reveals that AR shows significant increase only on the +5th
and
+20 days merger and acquisition information and hence it can be concluded that
abnormal returns cannot be earned on release Merger and acquisition announcement.
Hypothesis testing
H1: There is a significant impact on the price of shares due to Corporate Actions
H0: There is no impact on the price of shares due to Corporate Actions
H0 is accepted and H1 rejected
Parametric Test (t- test)
To test the statistical significance between ARs of the pre and post announcement
period t-test is applied and the result is provided in the table
AR
Before After
Mean 0.0000 0.0044
t Test -0.0764 6.7429
The mean value of AR for 30 days before the announcement is 0.0000 and that for
30 days after the announcement is 0.0044. To test the significance of difference t test (5%
level of significance) is applied and from the result of the above analysis it is clear that
the merger and acquisition information will influence share price of the companies in a
significant manner.
Page 93
Dept. Business Administration, RCU Belagavi P a g e | 85
Graph showing CAR before and after Announcement
Above graph showing CAR in before announcement is Negative and positive
after announcement it reveals that there is positive abnormal return before announcement
window.
-0.1000
-0.0500
0.0000
0.0500
0.1000
0.1500
0.2000
1 2 3 4 5 6 7 8 9 10 11 12 13 14 15 16 17 18 19 20 21 22 23 24 25 26 27 28 29 30
CAR Before
CAR After
Page 94
Dept. Business Administration, RCU Belagavi P a g e | 86
6. Findings
1. Corporate actions are having positive impact on stock prices.
2. All selected stocks are earning more number of positive abnormal return before window
and less number of positive abnormal returns after announcement window
3. Corporate actions lead to more liquidity of the securities.
4. Investors are earning abnormal return before announcement window but abnormal return
was not statistically not significant
Page 95
Dept. Business Administration, RCU Belagavi P a g e | 87
7. Recommendations
a. Before announcement window of corporate action is time window that maximizes the
return for shareholders.
b. After period of announcement of corporate action is not gives satisfactory return
c. Investor can earn abnormal return surrounding the corporate announcement.
Conclusion
Overall company analysis shows that more number of positive abnormal returns before
corporate action announcement and less number of positive abnormal returns after
announcement. Hence, it can be stated that market reacts to corporate action
announcement positively before announcement and less positive after the announcement.
Paired sample t test proves that corporate action announcement exerts an impact on share
price. This study is of immense utility to investors as they can understand changes in
share prices of companies and market movement during bonus announcements that
would be helpful to them for making good portfolio investment decision in the right time.
Page 96
Dept. Business Administration, RCU Belagavi P a g e | 88
Bibliography
www.bseindia.com
www.nseindia.com
www.moneycontrol.com
www.economictimes.com
www.businessline.com
www.eventstudytools.com