ACM Reference format:Rebecca Gelles, Duncan McElfresh, and Anjali Mittu. 2018. Project Report:Perceptions of AI in Hiring. In Proceedings of , College Park, MD, October2018, 16 pages.https://doi.org/10.1145/nnnnnnn.nnnnnnn
1 INTRODUCTIONThe primary goal of this study is to answer the question of what itmeans for a ranking algorithm to be fair in the context of hiring.This question has become more significant in recent years, as manyemployers now use Applicant Tracking Systems (ATS) to recruit,screen, and rank job applicants. ATS often include a wide range oftools for tasks including parsing resumes, administering customapplication forms, managing applicant data, screening and sortingapplicants, and communicating with applicants. New developmentsin AI and machine learning promise to improve human resourcemanagement. For example, recent papers promise to rank applicantsbased on personality traits [11], predict employee performance [6],predict employee turnover [18], and select corporate directors [10].
Employers have a legal, moral, and practical obligation to usehiring practices that are fair and just [2]. Automated proceduresin hiring, such as those offered by ATS, make it difficult to assessfairness and justice. For example, suppose that an employer has10,000 applicants: an ATS filters this list to 100 candidates, and thenranks these candidates. How do we know this filtering and rankingis fair? What does “fair" mean in this context? What principlesof fairness and justice should new algorithms and AI systems up-hold? As computer scientists, we approach this problem from theperspective of algorithmic ethics.
To examine these questions, we applied the work of Lee [16]to a closely related question. In the original study, the researcherscompared peoples’ perceptions of human and algorithmic decisions.They considered four types of managerial decisions, which includedwork assignment, work scheduling, hiring, and performance evalua-tion. They constructed scenarios in which a decision was made, andthe decision-maker was described as either algorithmic or human.For each condition, they measured perceptions of trust, perceptionsof fairness, and emotional response.
1.1 Our StudyIn contrast to previous work, we narrowed our focus to only oneapplication of algorithmic decision-making which we consideredparticularly important: ranking job applicants. Given that a sig-nificant body of evidence had already been amassed comparinghuman decision-makers to computer-based ones, our study insteadfocused entirely on algorithmic decision-makers, delving into thequestion of what participants’ perceptions are of different kindsof algorithms rather than of algorithms in contrast to humans. Toexamine this question, we varied two properties of the algorithm,complexity (simple vs. complex) and transparency (transparentvs. opaque), to see how these changed participants’ perceptions.We aimed to measure how these two factors – complexity andtransparency – impact respondents’ perceptions of a job-applicantsorting algorithm. Rather than including some situations whichare purely humans based, we focused on situations in which everyscenario contains an algorithmic decision-maker. With this, wehoped to tease out participants’ feelings about how algorithmicdecisions are made, rather than focusing, as prior work did, on theiropinions on whether they should be made at all. Our study focusedon asking questions related to each of the following: trust in thealgorithm’s ability to make good-quality decisions, fairness of thedecision, and emotional response to the situation.
Unlike previous work, our study addressed how the design andpresentation of an algorithm impacts perceptions of it. This is animportant question for anyone designing an algorithmwith societalimplications, and particularly for employers, whose hiring practicesmay be subject to public scrutiny.
Hypotheses. In our study, we evaluated the following hypotheses:H1 Transparent algorithms are perceived as fairer than opaque
algorithms, and are trusted more by participants.H2 Simple algorithms are perceived as fairer than complex algo-
rithms, but are less trusted by participants.H3 Opaque algorithms elicit a more-negative response than
transparent algorithms, regardless of complexity.
2 RELATEDWORKWhile our work focuses on users’ understanding of the detailsof the differences between particular kinds of machine learningalgorithms, some of what underlies these judgments is the fear ofthe potential for bias within these algorithms, and the possibilitythat algorithm authors will not consider that issue carefully. Thisfear is not unfounded: Datta et al. demonstrated that Google jobadvertisements were showing very different postings to men versusto women [7], and Caliskan et al. show that names derived fromresumes that are evaluated by machine learning algorithms areevaluated as more “pleasant” if they come from European-Americancandidates [5].
, October 2018, College Park, MD Rebecca Gelles, Duncan McElfresh, and Anjali Mittu
But the level of bias can vary based on the algorithm used, andresearch has focused on how to reduce this bias. The measuresdesigned to reduce bias often add complexity, and reduce trans-parency, as they can counter-intuitively require the incorporationof the protected categories that there is a potential for bias againstinto the model in order to avoid discriminating on the basis of them[24]. This adds another avenue for risk, because of the need to pro-tect and store sensitive information on, for example, job applicants.There has been work on how to avoid these issues; a recent paperby Kilbertus et al. evaluated the efficacy of avoiding disparate im-pact in algorithms by incorporating encrypted sensitive attributes,so that algorithm creators would not have access to the data, andfound reasonable success [14]. Algorithms of this type are compli-cated by nature, which may place a preference for the ability tounderstand algorithms as a layperson and a preference for fairnessin algorithms into conflict.
While our paper is exploring new territory by examining thedetails of what kinds of algorithmic decision-making users prefer,it is not the first to examine user opinions on algorithmic decision-making as compared to other types of decision-makers. One partic-ularly relevant example is a recent paper by Lee [16], which stud-ies perceptions of both algorithmic and human decision-makers.The authors composed four scenarios related to work assignment,scheduling, hiring, and performance evaluation. The researcherscompared algorithmic and human decision-makers in each sce-nario, finding that respondents trusted algorithms to make betterdecisions than humans, in cases that require mechanical skills. Incases that require “human” (non-mechanical) skills, respondentstrusted algorithms less than humans, and, surprisingly, respondedwith more negative emotions to algorithmic decisions than humandecisions. Perceptions also depend on how the algorithmic decision-maker is presented. Recent work by Binns et al. [3] addressed howdifferent explanation styles affect perceptions of algorithmic de-cision makers. The authors considered several decision-makingscenarios, including hiring, and measured perceptions of fairnessand justice of each. While the results were inconclusive, the authorsfound that when respondents encountered multiple explanationstyles, respondents perceive some styles as more fair than others.
A related strain of research studies perceptions of bias in algo-rithmic systems. Woodruff et al. [22] conducted a workshop withparticipants from marginalized populations to discuss algorithmicbias. The researchers found that participants largely indicated thatperceptions of bias would affect their trust of tech companies andproducts. Complementing this work, Grgić-Hlača et al. [12] inves-tigated the underlying factors causing perceptions of bias. Theresearchers considered an algorithm for predicting criminal recidi-vism risk. They constructed scenarios in which an algorithm usedcertain features of an individual to determine recidivism risk, study-ing perceptions of fairness in how the algorithm was implemented.
As our work relates to the ability of laypeople to understandand trust the underlying features of machine learning techniques,interpretable machine learning models are an area that can aidin this effort, and help us define what transparency means in thecontext of machine learning. There has been recent developmentof tools that add interpretations to ML models: LIME [20], Gestalt[19], and ModelTracker [1]. Interpretability of ML models can beunderstood in two different ways: understanding how the model
works or having the model explain the result [17]. The former,which is more relevant for this work, can be thought of as thetransparency of the model. A model is fully transparent if the wholemodel can be understood at once, if each of the individual parts ofthe model can be understood, or if the algorithm can be understood[17].
While it is well understood that humans perceive informationdifferently, it has been shown that any form of explanation helpsto improve understanding of the model [20]. Studies have shownthat there are many benefits to making your model interpretable[13], [20], [9]. Interpretations can be used to increase learning andunderstanding of the problem, promote safety and ethics, optimizethe model to the correct criteria, and understand the trade-offs inthe model [9]. Some suggest that interpretability and transparencycould be the solution to the inability of humans to trust ML models[15] [23] [9]. This is because understanding the model helps tooptimize and confirm the level of reliability, fairness, and trustin the model. However, other studies suggest model explanationscould decrease trust in the model depending on the level of detailin explanation [4]. If the examiner felt that there was not enoughdetails in the explanation to capture the complexity of the model,they were less likely to trust the model.
In our study, we modeled our interpretations on the LIME toolbecause LIME focuses on interpretations at the level of the individ-ual prediction. This matches with the scenarios we used, modeledfrom Binns et al. [3] and Lee [16], which were also at this level. Thismethod of explanation has been shown to improve understandingof the model for experts and novices in ML [20]. It has not yetbeen shown whether the LIME method of interpretation increasesthe perceived fairness or trust of the model compared to a modelwithout interpretation.
3 METHODTo evaluate participants’ perceptions of fairness, trust, and emo-tional response in algorithms used for hiring, we relied heavilyon the work of Lee [16] and Binns et al. [3]. However, as each oftheir work was focused on a broader set of scenarios than justhiring, and involved comparing participants’ responses to humanversus algorithmic decision-makers, their techniques required adap-tation for our work. Nevertheless, we incorporated their core designprinciples, like the use of a survey providing participants with hy-pothetical scenarios involving named third parties who might gothrough the hiring processes described, and follow-up questionson Likert scales, in order to structure, collect, and analyze our data.
3.1 RecruitmentAs hiring is a process that affects most people at some point in theirlife, we were not heavily concerned about targeting a specific audi-ence for our survey, but were instead interested in reaching a largepopulation. For these reasons, we chose the platform MechanicalTurk for recruitment. We recruited exclusively participants whowere United States residents over the age of 18. Mechanical Turkhas known data biases, which were readily apparent in the partici-pant pool we ended up recruiting [8]. Likely at least partially as aresult of these biases, our participant pool ended up quite skewed:it is significantly younger, more educated, more white, and more
Project Report: Perceptions of AI in Hiring , October 2018, College Park, MD
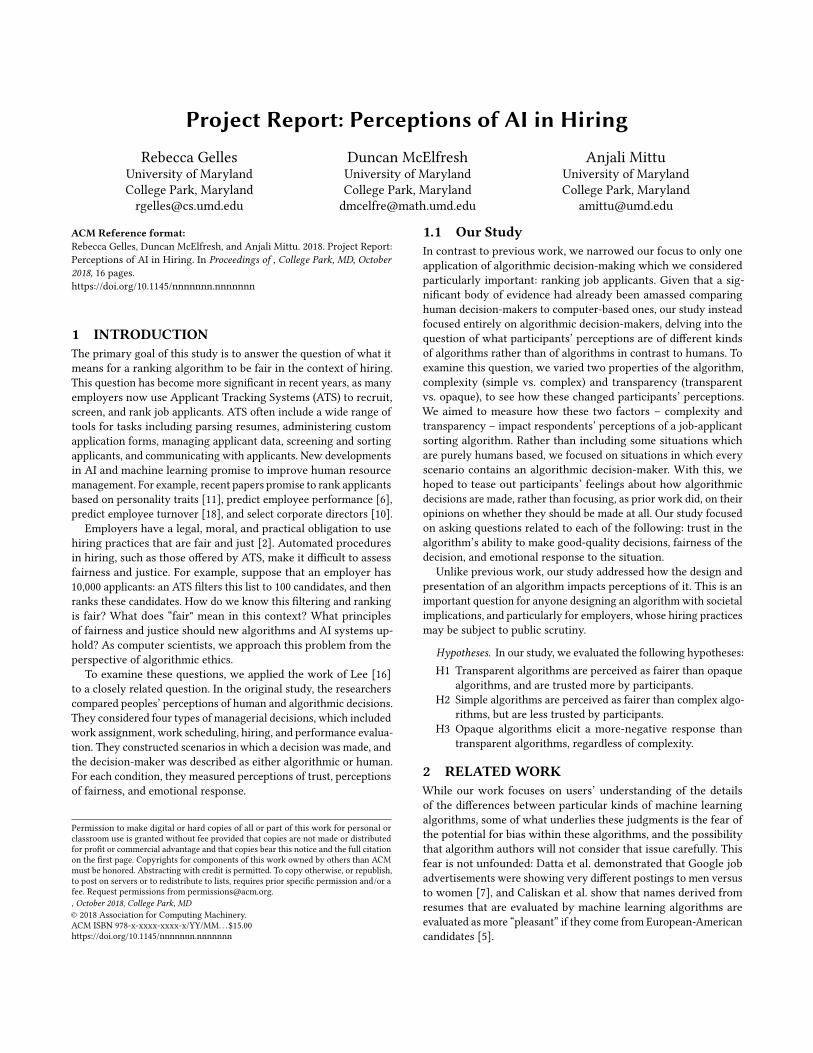
Category Value Total PercentGender Male 132 65%
Female 70 35%Age 18-29 81 40%
30-39 87 43%40-49 22 11%50-59 13 6%60+ 0 0%
Race/Ethicity Black or African American 20 10%White 148 74%Hispanic of Latino 13 7%American Indian or Alaska Native 11 6%Asian, Native Hawaiian, or Pacific Islander 2 1%Muliracial/Other 11 4%
Education Less than high school degree 1 0.5%High school graduate, diploma or the equivalent 27 13%Some college credit, no degree 36 18%Associate degree (2-year) 27 13%Bachelor’s degree (4-year) 84 41%Master’s degree 25 12%Doctorate degree 3 1%
Table 1: Participant demographic information including gender, age, ethnicity, and educational attainment.
male than the general population. Demographic data can be seenin Table 1.
In addition to demographic data, we also collected informationfrom participants on their knowledge in three key areas related tothe core concepts of the study: algorithms, artificial intelligence,and human resource management (in particular, hiring and firing).This allowed us to ensure that our sample was not drawn purelyfrom participants who were experts in the topics examined in ourstudy, or, conversely, from those who had no knowledge of them atall. As can be seen in Table 2, the vast majority of participants indi-cated they were moderately, slightly, or not knowledgeable – theseaccounted for 74%, 76%, and 74% of each of the three categories,respectively. There are still approximately a quarter of participantsin each category with a higher degree of knowledge, which shouldensure that our results represent opinions of both the general pop-ulation and those with some level of technical experience in therelevant areas.
3.2 Survey DesignAs described above, we had four different algorithmic-decision-making conditions: simple and transparent, simple and opaque,complex and transparent, and complex and opaque. We wrote fourscenarios, one for each of these conditions, using the scenarios fromLee [16] and Binns et al. [3] as a guide.
In order to avoid ordering effects, which have been shown to bequite significant in scenarios like this, we used a between-subjectsdesign [23]. Each participant was only shown one scenario, rep-resenting one of the four conditions, and then asked follow-upquestions on that scenario. Each of the four scenarios can be foundin Appendix A.
For each scenario, we asked questions on a 7-point Likert-stylescale, related to various perceptions of the algorithm, again usingLee [16] and Binns et al. [3] as a guide. We asked questions focused
on three different areas of perception: fairness, trust, and emotionalresponse. Specific questions in these areas can be found in AppendixA, and explanations of how these questions were compiled intomore general evaluations of these three categories may be found inSection 4. We constructed the survey in Qualtrics, and connected itto Mechanical Turk’s native survey tool.
3.3 EthicsThe study was approved by the University of Maryland InstitutionalReview Board. There are no known risks for the participants andthe study is not targeting any vulnerable populations. We askedparticipants to complete an online consent form, which they werealso offered a printable copy of, at the beginning of the survey,and any participants who failed to do so were disqualified fromparticipating. All of the sensitive data that we collected, includingMTurk IDs, IP addresses, cookies, and demographic data, was storedsecurely in a password-protected computer or in a reliable, security-conscious third party service.
3.4 LimitationsTo eliminate ordering effects, we used a between-subjects design.However, between-subjects designs have their own limitations: inparticular, this means that each of our scenarios were evaluatedby different participants, with different backgrounds and levels ofknowledge on the topics we studied. This is an inherent problem instudies of this nature with no easy solution. If we had found signifi-cance in any of our results, it would likely have been worthwhile toalso run the tests considering each of our demographic categoriesand knowledge answers as covariants, in order to ensure that wewere actually demonstrating a true effect, and not one caused by aconfound.
We used MTurk to recruit participants, which allowed us torecruit from a large population of varying ages, incomes, and
, October 2018, College Park, MD Rebecca Gelles, Duncan McElfresh, and Anjali Mittu
Category Value Total PercentAlgorithms Extremely knowledgeable 12 6%
Very knowledgeable 40 19%Moderately knowledgeable 79 38%Slightly knowledgeable 58 28%Not knowledgeable at all 17 8%
Artificial intelligence Extremely knowledgeable 14 7%Very knowledgeable 36 17%Moderately knowledgeable 79 38%Slightly knowledgeable 67 33%Not knowledgeable at all 10 5%
Human resource management Extremely knowledgeable 21 10%Very knowledgeable 31 15%Moderately knowledgeable 46 22%Slightly knowledgeable 54 26%Not knowledgeable at all 53 26%
Table 2: Self-reported participant knowledge about algorithms, artificial intelligence, and human resource management.
genders[21]. Still, Mturk’s population also has known variationfrom the general population [8]. Turkers are generally younger,more educated, and have lower incomes than the average American[21]. While we did not ask about income, in all other contexts thesame was true of our resulting pool of participants, which mayhave limited the external validity of our results.
Our study involves hiring decisions, which are only one algo-rithmic decision-making context. This thus makes it difficult togeneralize from this topic to other contexts. In order to ensure thatour examination of this particular topic was as strongly groundedas possible, we relied on the work of others. In fact, rather thandeveloping our own concepts of trust, fairness, and emotional re-sponse, we employed the following two previous papers as a guide:[16] and Binns et al. [3]. Both papers give strong arguments for thewhy their techniques aptly measure these concepts in their surveydesign, so we relied on their strategies when designing our own.
4 RESULTS & ANALYSIS4.1 Fairness and TrustParticipants were asked questions on their perceptions of the fair-ness and trustworthiness of each scenario. This was similar to theapproach in Lee [16]. Participants rated how fair and how trust-worthy the hiring situation was. See Appendix A for details on thequestions.
Fairness. The perception of fairness for each scenario is relatedto our H1 andH2. The result of this question is shown in Figure 1. Totest these hypotheses in regards to fairness we used the followingnull hypotheses.H1a0 Transparent and opaque algorithms produce the same distri-
bution of fairness.H2a0 Simple and complex algorithms produce the same distribu-
tion of fairness.For H1a0 we grouped responses by transparency so that we
could test each pair of differing condition. We ended up with fourpairs of conditions. These pairs were “simple/opaque" vs. “sim-ple/transparent," “complex/opaque" vs. “complex/transparent," “sim-ple/opaque" vs. “complex/transparent," and “complex/opaque" vs.
Figure 1: Histogram of fairness, by condition.
“simple/transparent." We use the Mann-Whitney U test for each pair.We found that for every pair of conditions, we cannot reject H1a0(p > 0.05).
We used similar pairing for H2a0; however, we grouped by com-plexity instead of transparency. We ended up with the followingpairs: “simple/opaque" vs. “complex/opaque," “simple/transparent"vs. “complex/transparent," “simple/opaque" vs. “complex/transparent,"and “complex/opaque" vs. “simple/transparent." Again, we used theMann-Whitney U test for each pair and found that for every pairof conditions, we cannot reject H2a0 (p > 0.05).
Trust. Similar to fairness, the perception of trust for each sce-nario is related to our H1 and H2. The result of this question isshown in Figure 2. To test these hypotheses in regards to fairnesswe used the following null hypotheses.
Project Report: Perceptions of AI in Hiring , October 2018, College Park, MD
Figure 2: Histogram of trust, by condition.
H1b0 Transparent and opaque algorithms produce the same distri-bution of trust.
H2b0 Simple and complex algorithms produce the same distribu-tion of trust.
We grouped responses in the same manner as the analysis onfairness. For H1b0 we looked at groupings by transparency. Weused the Mann-Whitney U test for each pair and found that forevery pair of conditions, we cannot rejectH1b0 (p > 0.05). ForH2b0we looked at groupings by complexity. Using the Mann-Whitney Utest for each pair, we found that for every pair of conditions, wecannot reject H2b0 (p > 0.05).
Due to the results of our analysis on fairness and trust, we arenot able to confirm either H1 or H2.
4.2 Emotional ResponseWe asked several questions to understand how participants believehow the named subject (“Alex”) of the AI hiring decision would feelin each scenario. Our approach mirrors that of Lee [16]. Questionsincluded how much participants agreed that the hiring processwould make Alex feel happy, joyful, proud, disappointed, angry, andfrustrated. All questions were on a 7-point Likert scale of agreement;see Appendix A for details.
Emotional Response Scale. As in Lee [16], we aggregatedthese six questions into a single factor (positive-emotional-response):first we flipped the polarity of the positive-emotion questions(happy, joyful, proud), so all emotional responses had the same
Positive−Emotion Factor by Condition
Positive−Emotion Factor
Per
cent
of T
otal
0
5
10
15
20
25
30
2 4 6
complex/opaque
0
5
10
15
20
25
30
complex/transparent
0
5
10
15
20
25
30
simple/opaque
0
5
10
15
20
25
30
simple/transparent
Figure 3: Histogram of emotional response factor, by condition.
polarity; then, we average the answers to all questions, such that ahigher answer corresponds to a more-positive emotional response.This positive-emotional-response scale is consistent – in our col-lected responses, we calculate a Cronbach’s α of 0.88 (Lee reportedα = 0.9.)
Testing H3. We use a set of statistical tests to check H3 is con-firmed in our experiments. The goal of these tests was to rule out avariety of null hypotheses. The first of these was the following:
H0-a Transparent conditions and opaque conditions produce thesame distribution of emotional response.
To test H0-a, we grouped emotional responses into two samples: a)for conditions (simple/opaque) and (complex/opaque), and b) for(simple/transparent) and (complex/transparent). We used a Mann-Whitney U test to determine whether these samples have the samedistribution, and found that we could not reject H0-a (p > 0.05).
Next, we tested a slightly different null hypothesis, comparingeach pair of conditions (X and Y):
H0-b Condition X and Y produce the same distribution of emo-tional response.
We again used the Mann-Whitney U test for each pair of our fourconditions (6 pairs in total). We found that for every pair of condi-tions, we could not reject H0-b (p > 0.05).
We also performed F-tests comparing variances for both H0-aand H0-b, and again found we could not reject the null hypotheses.In light of these tests, we could not confirm H3. However therewere some nuances in these data that warranted closer inspection.
, October 2018, College Park, MD Rebecca Gelles, Duncan McElfresh, and Anjali Mittu
Exploratory Analysis. Despite our inability to reject the nullhypothesis H3, some surprising features of the emotional responsedata caused us to examine it more closely. Figure 3 shows thedistribution of emotional response for each condition.
There are subtle, yet visible, differences in these conditions–perhaps due to difference in responses to individual emotional-response questions. In particular, there are significant differencesbetween the negative emotional response questions. Surprisingly,we find that transparent conditions elicit a more negative emotionalresponse than opaque conditions.
To examine this further, we created a negative-emotional-factor,using only the negative emotional-response questions; this factoris consistent (α = 0.87). Using a Mann-Whitney U test, we foundthat both the complex/transparent and simple/opaque conditionpair and the complex/transparent and complex/opaque conditionpair produced a different distribution of the negative-emotional-response factor.
Next, we fit a regression model on all conditions, using “transpar-ent” and “opaque” as binary variables; we found that “transparent”is the only significant predictor (β = −0.52, p < 0.05).1 These re-sults indicate that more transparent algorithms may in fact elicita more-negative emotional response than opaque algorithms, andthis effect may be exacerbated by the complexity of the algorithm;this warrants further study. Given this exploration, the followinghypotheses could be more relevant for future work, although quali-tative research is likely also needed:
H4 Transparency in complex decision-making algorithms elicitsa more-negative emotional response to decisions made bythese algorithms.
H5 Transparency in simple decision-making algorithms doesnot impact the emotional response to these algorithms.
5 DISCUSSIONThe survey and analysis conducted for this study were unable todraw any firm conclusions, as the study was designed to test threehypotheses about perceptions of hiring algorithms, and in each casetested we were unable to disprove the null hypothesis. Withoutadditional information, we cannot confirm exactly what this means,as there are a variety of possibilities. We will examine each of theseoptions in turn, and consider how future work could help identifywhich is most likely.
One option is simply that the effect we were looking to findhad too small an effect size to be found given our sample size. Oursample size was quite reasonable, so if this were the case, such aneffect, if it existed, would be fairly small. Given that not a singleone of our hypotheses produced a statistically significant result,simply running a larger version of the same study is likely not theright choice without future work providing more evidence pointingto this conclusion.
Another possibility is that the hypotheses considered in thisstudy do not actually match up to peoples’ baseline opinions. Sinceour hypotheses were one-tailed, if our assumptions were incorrectwe would not have identified a statistically significant result in theopposite direction. For example, if participants in our study hadbelieved, instead of hypothesis H1, that opaque algorithms were1In this model, a negative β indicates a more negative emotional response
fairer and more trustworthy than transparent algorithms, this resultwould not be found. The possibility that our basic assumptionsabout the directionality of participants’ opinions may have been offseems to be at least partially backed up by the exploratory analysisperformed on the emotional response data.
Similar to this possibility is the option that participants’ percep-tions of trust and fairness and emotional responses are not signifi-cantly influenced in either direction by the complexity and opacityof hiring algorithms. While previous work has demonstrated thatthese perceptions are influenced by whether a human or an algo-rithm is the decision-maker, we may have extrapolated too far fromthis work in assuming that the questions we aimed to answer wereones the general public would have opinions on.
In order to determine which of these possibilities may have con-tributed to our lack of results, one reasonable option would be totransition away from quantitative, deductive research and performan inductive, qualitative, study on the topic of people’s perceptionsof algorithmic decision-making. This study would have a focusnot on comparisons to human decision-makers, but on asking par-ticipants open-ended questions about what they perceived to befair ways for algorithms to make decisions, when they would finddecisions made by computer algorithms to be trustworthy, and howbeing evaluated by a computer would make them feel. By asking thequestions in an inductive format, researchers would be able to buildhypotheses that could then be formally tested in later quantitativework, with less chance of making errors in the directionality ofhypotheses.
6 CONCLUSIONIn our study, we aimed to measure participants’ perceptions oftrust, fairness, and emotional response when comparing algorith-mic decision-makers used for hiring across two different axes, com-plexity and transparency. We tested three hypotheses based onperceptions of these situation, deriving our initial hypotheses fromthe previous work that existed in the field as well as our own in-tuitions. To test these hypotheses, we based our work off of twoprevious studies which tested very similar topics, but focused oncomparing human decision-makers to algorithmic decision-makers,and tested a wide range of topics rather than focusing on hiring de-cisions [16] [3]. These studies guided our choices of study structure,questions design, and analysis technique.
After performing our study and follow-up analysis, we wereunable to confirm any of the hypotheses we identified in our ini-tial work. We put forth a number of possible explanations for thislack of confirmation, and suggested future work that could allowthe exploration of which of these explanations is most likely tobe correct, as well as providing relevant information to future re-searchers in this field. We believe that this future work could bevaluable in helping creators of algorithm-based decision makersmake better choices about how to create algorithms that peoplewill find trustworthy and fair.
REFERENCES[1] 2015. ModelTracker: Redesigning Performance Analysis Tools for Machine Learning.
ACM âĂŞ Association for Computing Machinery.[2] G Stoney Alder and Joseph Gilbert. 2006. Achieving ethics and fairness in hiring:
Going beyond the law. Journal of Business Ethics 68, 4 (2006), 449–464.
Project Report: Perceptions of AI in Hiring , October 2018, College Park, MD
[3] Reuben Binns, Max Van Kleek, Michael Veale, Ulrik Lyngs, Jun Zhao, and NigelShadbolt. 2018. ’It’s Reducing a Human Being to a Percentage’: Perceptions ofJustice in Algorithmic Decisions. In Proceedings of the 2018 CHI Conference onHuman Factors in Computing Systems. ACM, 377.
[4] Adrian Bussone, Simone Stumpf, and Dympna O’Sullivan. 2015. The role of expla-nations on trust and reliance in clinical decision support systems. In HealthcareInformatics (ICHI), 2015 International Conference on. IEEE, 160–169.
[5] Aylin Caliskan, Joanna J Bryson, and Arvind Narayanan. 2017. Semantics derivedautomatically from language corpora contain human-like biases. Science 356,6334 (2017), 183–186.
[6] Aaron Chalfin, Oren Danieli, Andrew Hillis, Zubin Jelveh, Michael Luca, JensLudwig, and Sendhil Mullainathan. 2016. Productivity and selection of humancapital with machine learning. American Economic Review 106, 5 (2016), 124–27.
[7] Amit Datta, Michael Carl Tschantz, and Anupam Datta. 2015. Automated exper-iments on ad privacy settings. Proceedings on Privacy Enhancing Technologies2015, 1 (2015), 92–112.
[8] Djellel Difallah, Elena Filatova, and Panos Ipeirotis. 2018. Demographics andDynamics of Mechanical Turk Workers. In Proceedings of the Eleventh ACMInternational Conference on Web Search and Data Mining (WSDM ’18). ACM,135–143. https://doi.org/10.1145/3159652.3159661
[9] F. Doshi-Velez and B. Kim. 2017. Towards A Rigorous Science of InterpretableMachine Learning. ArXiv e-prints (Feb. 2017). arXiv:stat.ML/1702.08608
[10] Isil Erel, Léa H Stern, Chenhao Tan, and Michael S Weisbach. 2018. SelectingDirectors UsingMachine Learning. Technical Report. National Bureau of EconomicResearch.
[11] Evanthia Faliagka, Athanasios Tsakalidis, and Giannis Tzimas. 2012. An inte-grated e-recruitment system for automated personality mining and applicantranking. Internet research 22, 5 (2012), 551–568.
[12] Nina Grgić-Hlača, Elissa M Redmiles, Krishna P Gummadi, and Adrian Weller.2018. Human perceptions of fairness in algorithmic decision making: A casestudy of criminal risk prediction. arXiv preprint arXiv:1802.09548 (2018).
[13] Johan Huysmans, Karel Dejaeger, Christophe Mues, Jan Vanthienen, and BartBaesens. 2011. An Empirical Evaluation of the Comprehensibility of DecisionTable, Tree and Rule Based Predictive Models. Decis. Support Syst. 51, 1 (April2011), 141–154. https://doi.org/10.1016/j.dss.2010.12.003
[14] Niki Kilbertus, Adrià Gascón, Matt J Kusner, Michael Veale, Krishna P Gum-madi, and Adrian Weller. 2018. Blind Justice: Fairness with Encrypted SensitiveAttributes. arXiv preprint arXiv:1806.03281 (2018).
[15] Been Kim. 2015. Interactive and Interpretable Machine Learning Models for HumanMachine Collaboration. Ph.D. Thesis. MIT, Cambridge, MA.
[16] Min Kyung Lee. 2018. Understanding perception of algorithmic decisions: Fair-ness, trust, and emotion in response to algorithmic management. Big Data &Society 5, 1 (2018), 2053951718756684.
[17] Zachary Chase Lipton. 2016. The Mythos of Model Interpretability. CoRRabs/1606.03490 (2016). arXiv:1606.03490 http://arxiv.org/abs/1606.03490
[18] Jiamin Liu, Yuxi Long, Ming Fang, Renjie He, Tao Wang, and Guosheng Chen.2018. Analyzing Employee Turnover Based on Job Skills. In Proceedings of theInternational Conference on Data Processing and Applications. ACM, 16–21.
[19] Kayur Patel, Naomi Bancroft, Steven Drucker, James Fogarty, Andrew J. Ko, andJames A. and Landay. 2010. Gestalt: Integrated Support for Implementationand Analysis in Machine Learning, In Proceedings of the 23rd annual ACMsymposium on User interface software and technology.
[20] Marco Túlio Ribeiro, Sameer Singh, and Carlos Guestrin. 2016. "Why Should ITrust You?": Explaining the Predictions of Any Classifier. CoRR abs/1602.04938(2016). arXiv:1602.04938 http://arxiv.org/abs/1602.04938
[21] Joel Ross, Lilly Irani, M. Six Silberman, Andrew Zaldivar, and Bill Tomlinson.2010. Who Are the Crowdworkers?: Shifting Demographics in Mechanical Turk.In CHI ’10 Extended Abstracts on Human Factors in Computing Systems (CHI EA’10). ACM, 2863–2872. https://doi.org/10.1145/1753846.1753873
[22] Allison Woodruff, Sarah E Fox, Steven Rousso-Schindler, and Jeffrey Warshaw.2018. A Qualitative Exploration of Perceptions of Algorithmic Fairness. In Pro-ceedings of the 2018 CHI Conference on Human Factors in Computing Systems.ACM, 656.
[23] L Richard Ye and Paul E Johnson. 1995. The impact of explanation facilities onuser acceptance of expert systems advice. Mis Quarterly (1995), 157–172.
[24] Indre Žliobaite and Bart Custers. 2016. Using sensitive personal data may benecessary for avoiding discrimination in data-driven decision models. ArtificialIntelligence and Law 24, 2 (2016), 183–201.
, October 2018, College Park, MD Rebecca Gelles, Duncan McElfresh, and Anjali Mittu
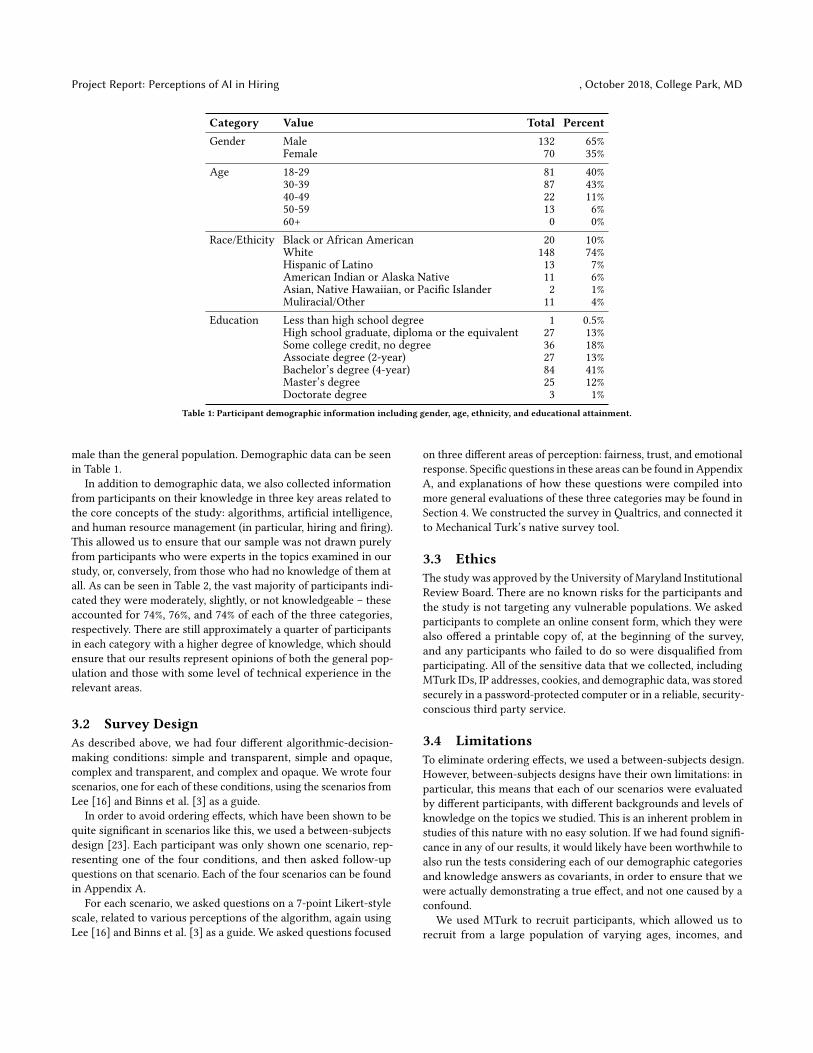
A SURVEY TEXTBelow is the text of our survey. Note that each participant was only shown one scenario (i.e., only one of the four sections of the “ScenarioBlock” is shown to each participant.)
This research is being conducted by Anjali Mittu, DuncanMcElfresh, Rebecca Gelles, and Michelle Mazurek at the Universityof Maryland, College Park. We are inviting you to participate in thisresearch project because you meet our requirements. The purpose
of this research project is to better understand attitudes aboutfairness in the use of automation and AI for HR purposes.
Procedures
The procedures involve the following steps:1) You will complete a survey regarding a specific hiring scenario
involving computers.2) We will ask you some demographic questions.
The entire process should take 10 minutes or less.
Potential Risksand
Discomforts
There are no known risks to participants. We will collect somepersonally identifiable information (MTurk IDs, IP addresses, andcookies) to prevent repeat attempts, but this information will be
maintained securely (see Confidentiality section) and will bedeleted at the conclusion of the study.
PotentialBenefits
There are no direct benefits to participating in this study. We hopethat, in the future, other people might benefit from this study
through improved understanding of what users consider to be afair use and explanation of computation in and surrounding the
hiring process.
Confidentiality All survey answers will be collected and analyzed anonymously;survey answers will be stored in a password-protected server. Toprevent duplicate participation, we will collect participants’ MTurk
ID, IP address, and use cookies.Any potential loss of confidentiality will be minimized by storing
this data in a password-protected server, but it will not beassociated with specific survey answers or data.
If we write a report or article about this research, your identity willbe protected to the maximum extent possible. Your information
may be shared with representatives of the University of Maryland,College Park or governmental authorities if you or someone else is
in danger or if we are required to do so by law.
Compensation
You will receive $1.20, and you will be responsible for any taxesassessed on the compensation.
You are only allowed to participate once -- if we find youparticipating a second time, you will not be paid again.
Right toWithdraw and
Questions
Your participation in this research is completely voluntary. Youmay choose not to take part at all. If you decide to participatein this research, you may stop participating at any time. If you
decide not to participate in this study or if you stop participatingat any time, you will not be penalized or lose any benefits to
which you otherwise qualify.
If you decide to stop taking part in the study, if you havequestions, concerns, or complaints, or if you need to report aninjury related to the research, please contact the investigator:
We encourage you to print a copy of this consent form for your records.
Before we begin, please verify that the Amazon Mechanical Turk ID shown below is your ID.If it is your ID, please click next. If it is not your ID, please enter your ID in the text field andthen click Next. MTurk ID: ${e://Field/MID}
Scenario Block
Please read the below situation and answer the following questions.
Alex applies for an engineering position on a job search website by submitting their resumeand personal statement. The website lists skills that are required for the job. Each time anapplication is submitted, a computer model reviews the application. The computer modelproduces a score for each application by looking at the following factors:
Keywords in the resume selected by the hiring managerEducationPast experience
The website mentions that a computer will be evaluating the application but does not mention whatfactors will be considered significant. If Alex’s score is high enough, they are called back for an
interview.
Alex applies for an engineering position on a job search website by submitting their resumeand personal statement. The website lists skills that are required for the job. Each time anapplication is submitted, a computer model reviews the application. The computer modelproduces a score for each application by looking at the following factors:
Keywords in the resume selected by the hiring managerEducationPast experienceSimilarities to applications from current highperforming employeesPrediction of personality traits from wording of resume and cover letter
The website mentions that a computer will be evaluating the application but does notmention what factors will be considered significant. If Alex’s score is high enough, they arecalled back for an interview.
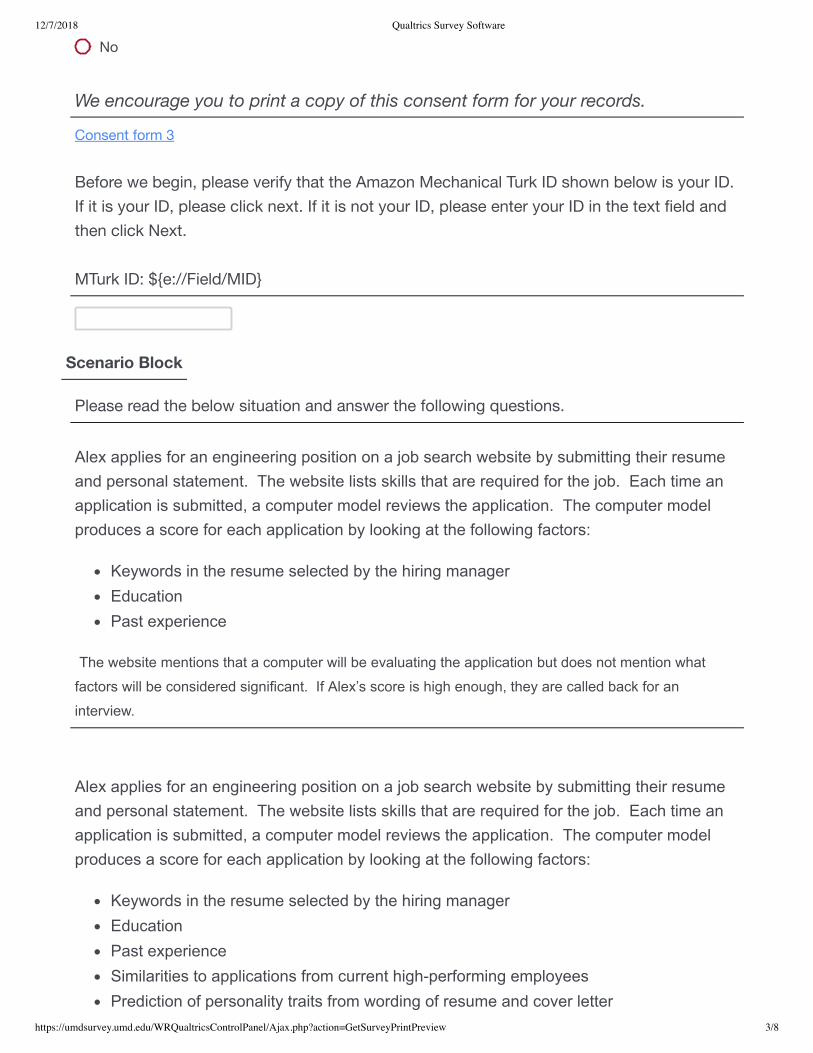
Alex applies for an engineering position on a job search website by submitting their resume and personal
statement. The website lists skills that are required for the job. Each time an application is submitted, a computer
model reviews the application. The computer model produces a score for each application by looking at the
following factors:
Keywords in the resume selected by the hiring manager
Education
Past experience
The website mentions that a computer will be evaluating the application and mentions what factors will be
considered significant. If Alex’s score is high enough, they are called back for an interview.
Alex applies for an engineering position on a job search website by submitting their resume and personal
statement. The website lists skills that are required for the job. Each time an application is submitted, a computer
model reviews the application. The computer model produces a score for each application by looking at the
following factors:
Keywords in the resume selected by the hiring manager
Education
Past experience
Similarities to applications from current highperforming employees
Prediction of personality traits from wording of resume and cover letter
The website mentions that a computer will be evaluating the application and mentions what factors will be
considered significant. If Alex’s score is high enough, they are called back for an interview.
To what extent do you understand this hiring process?
What is your knowledge of artificial intelligence?
How much experience do you have with human resource management (hiring, firing)?
Please specify the highest degree or level of school you have completed:
Block 3
Please make note of the following code. You will input it through Mechanical Turk to indicateyour completion of the study. Then click the button on the bottom of the page to submityour answers. You will not receive credit unless you click this button.
Extremely knowledgeable
Very knowledgeable
Moderately knowledgeable
Slightly knowledgeable
Not knowledgeable at all
Extremely knowledgeable
Very knowledgeable
Moderately knowledgeable
Slightly knowledgeable
Not knowledgeable at all
Extremely knowledgeable
Very knowledgeable
Moderately knowledgeable
Slightly knowledgeable
Not knowledgeable at all
Less than high school degree
High school graduate, diploma or the equivalent (for example: GED)