25
Kite Consulting | November 2021 Project Reset Why we face a new normal in dairy product prices
Kite Consulting | November 2021
Project Reset
Why we face a new normal in dairy product prices
Page 2Kite Consulting
Inflationary pressure is a factor across the dairy supply chain from farm to processor. Recent months have seen sharp increases in the cost of feed, fuel, energy, labour and fertiliser at farm level, which increases the cost of milk production. Meanwhile, dairy processors are seeing increased costs across the board – from energy to transport, labour, packaging, warehousing and distribution.
This inflationary trend also comes at a time when supply chain relationships have never been more important. Retailers and processors need to work more closely than ever with farmers to address the challenges around sustainability, particularly climate change, and success in this area requires long term relationships built on trust.
Given the slim margins across the industry, and the wider context, this inflationary pressure can only be addressed by passing costs on to consumers through a re-basing of ‘normal’ retail prices for milk, cheese and butter. If, for example, inflationary pressure remains within current parameters, the ‘new normal’ bulk butter price would need to be between £3,975 - £4,200/t (rather than current £3,200/t) and the milk cheddar bulk price would need to be between £3,425 - £3,625/t (rather than the current £3,000/t). Liquid milk prices would need to be commensurate with these levels to maintain milk supply. Without this, we believe that milk production will fall, and UK dairy production may increasingly be diverted to serving export markets rather than low margin retail and foodservice markets in the UK.
This outlook is not unique to dairy, though, with similar calls for the end of the ‘era of cheap food’ coming from other agricultural sectors and food businesses too – there is simply not the profitability in the food sector to absorb the levels of inflationary cost increases currently in play. If it is not passed on we ultimately risk the collapse of UK food supply chains.
Executive Summary
It is fair to say that the dairy supply chain has not seen inflationary cost pressures of the magnitude being witnessed today for many years, if ever. They are ubiquitous across every aspect of the supply chain – from primary farm inputs; to the price of fuel and labour to take the milk from the farm to the dairy; through the processing procedures within the factory; to packaging materials; storage and maturation; and the final transport to the end consumer - be it here or abroad.
This report assesses some of the cost price challenges that farmers and processors are facing, and what processors
Introductionare saying about the situation. It has been compiled by Kite Consulting, the agribusiness consultancy specialising in the dairy industry, and Chris Walkland, a leading market analyst in the dairy industry. It also draws on the facts, sentiment and commentary in separate contributory reports by:
• CRM AgriCommodities, on the long-term grain prospects;
• Campbell Gibbons on Future EU Agricultural Policy;
• Kite Consulting’s Cost of Production Report September 2021.
Page 3Kite Consulting
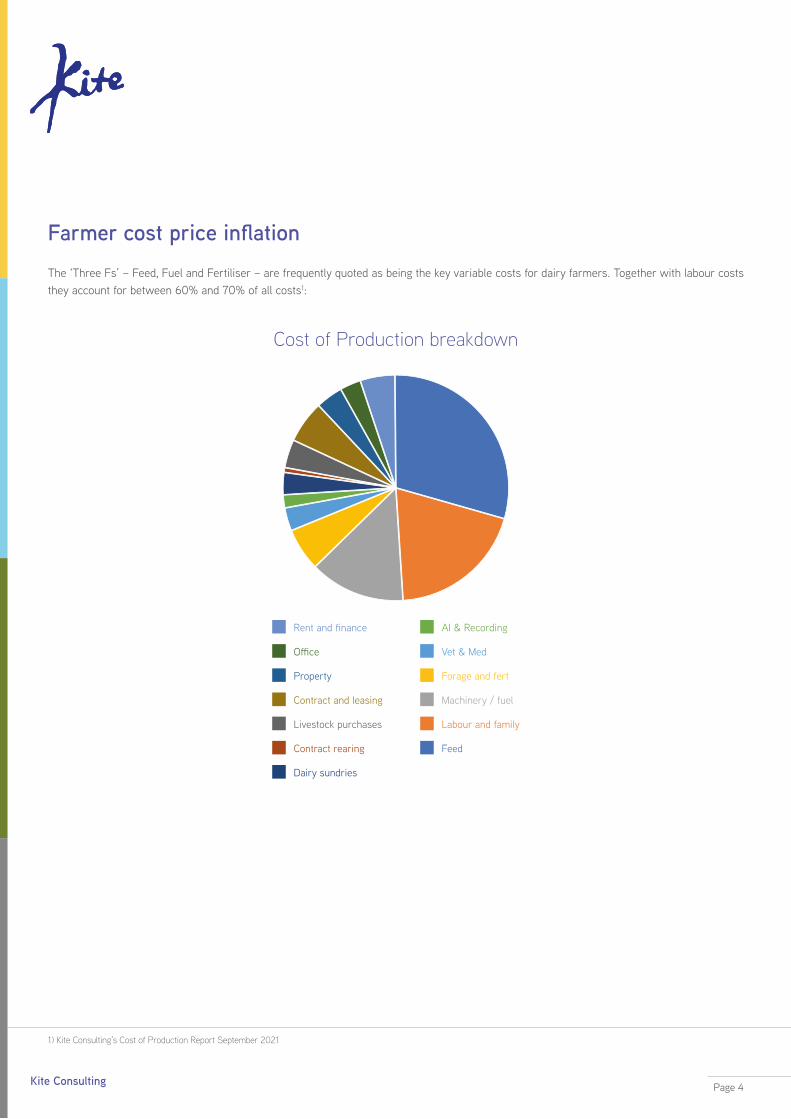
The ‘Three Fs’ – Feed, Fuel and Fertiliser – are frequently quoted as being the key variable costs for dairy farmers. Together with labour costs they account for between 60% and 70% of all costs1:
Farmer cost price inflation
Cost of Production breakdown
Page 4Kite Consulting
1) Kite Consulting’s Cost of Production Report September 2021
Page 4Kite Consulting
Contract and leasing
Livestock purchases
Contract rearing
Dairy sundries
Rent and finance
Office
Property
Vet & Med
Forage and fert
Machinery / fuel
Feed
AI & Recording
Labour and family
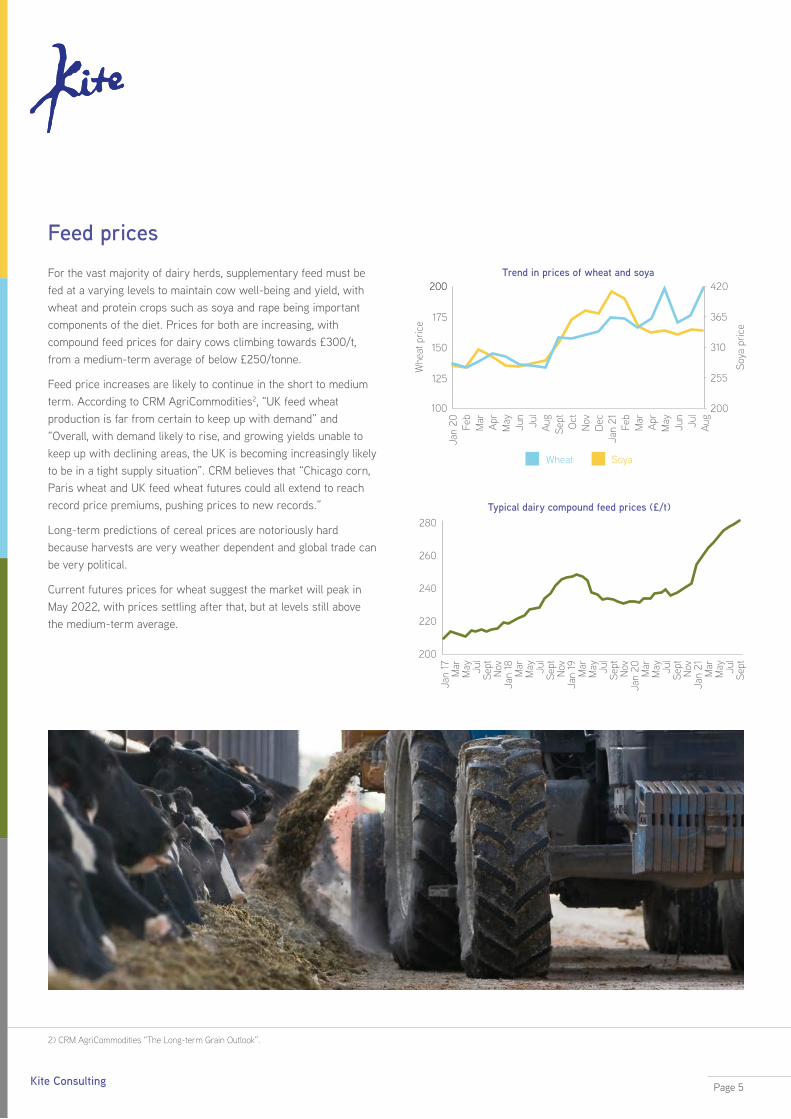
For the vast majority of dairy herds, supplementary feed must be fed at a varying levels to maintain cow well-being and yield, with wheat and protein crops such as soya and rape being important components of the diet. Prices for both are increasing, with compound feed prices for dairy cows climbing towards £300/t, from a medium-term average of below £250/tonne.
Feed price increases are likely to continue in the short to medium term. According to CRM AgriCommodities2, “UK feed wheat production is far from certain to keep up with demand” and “Overall, with demand likely to rise, and growing yields unable to keep up with declining areas, the UK is becoming increasingly likely to be in a tight supply situation”. CRM believes that “Chicago corn, Paris wheat and UK feed wheat futures could all extend to reach record price premiums, pushing prices to new records.”
Long-term predictions of cereal prices are notoriously hard because harvests are very weather dependent and global trade can be very political.
Current futures prices for wheat suggest the market will peak in May 2022, with prices settling after that, but at levels still above the medium-term average.
Feed prices
2) CRM AgriCommodities “The Long-term Grain Outlook”.
Trend in prices of wheat and soya
Whe
at p
rice
Soya
pric
e
Jan
20
Sept
May
May
Jan
21
Mar
Nov Ju
l
Jul
Mar
Feb
Oct
Jun
Jun
Feb
Apr
Dec
Aug
Aug
Apr100
125
175
150
200200 420
365
310
255
200
Wheat Soya
Typical dairy compound feed prices (£/t)
200
220
260
240
280
Jan
17
Sept
Sept
Sept
Sept
Sept
May
May
May
May
May
Jan
18
Jan
19
Jan
20
Jan
21
Mar
Mar
Mar
Mar
Mar
Nov
Nov
Nov
NovJu
l
Jul
Jul
Jul
Jul
Page 5Kite Consulting
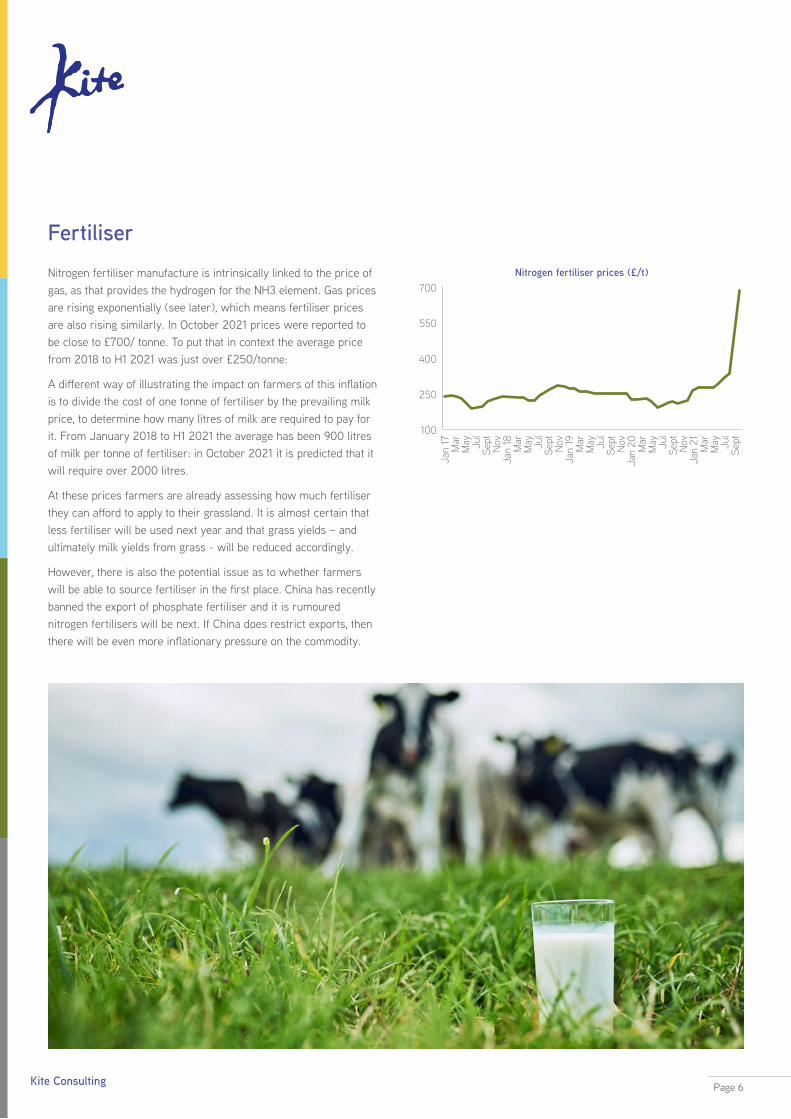
Nitrogen fertiliser manufacture is intrinsically linked to the price of gas, as that provides the hydrogen for the NH3 element. Gas prices are rising exponentially (see later), which means fertiliser prices are also rising similarly. In October 2021 prices were reported to be close to £700/ tonne. To put that in context the average price from 2018 to H1 2021 was just over £250/tonne:
A different way of illustrating the impact on farmers of this inflation is to divide the cost of one tonne of fertiliser by the prevailing milk price, to determine how many litres of milk are required to pay for it. From January 2018 to H1 2021 the average has been 900 litres of milk per tonne of fertiliser: in October 2021 it is predicted that it will require over 2000 litres.
At these prices farmers are already assessing how much fertiliser they can afford to apply to their grassland. It is almost certain that less fertiliser will be used next year and that grass yields – and ultimately milk yields from grass - will be reduced accordingly.
However, there is also the potential issue as to whether farmers will be able to source fertiliser in the first place. China has recently banned the export of phosphate fertiliser and it is rumoured nitrogen fertilisers will be next. If China does restrict exports, then there will be even more inflationary pressure on the commodity.
FertiliserNitrogen fertiliser prices (£/t)
100
250
550
400
700
Jan
17
Sept
Sept
Sept
Sept
Sept
May
May
May
May
May
Jan
18
Jan
19
Jan
20
Jan
21
Mar
Mar
Mar
Mar
Mar
Nov
Nov
Nov
NovJu
l
Jul
Jul
Jul
Jul
Page 6Kite Consulting
Page 7Kite Consulting
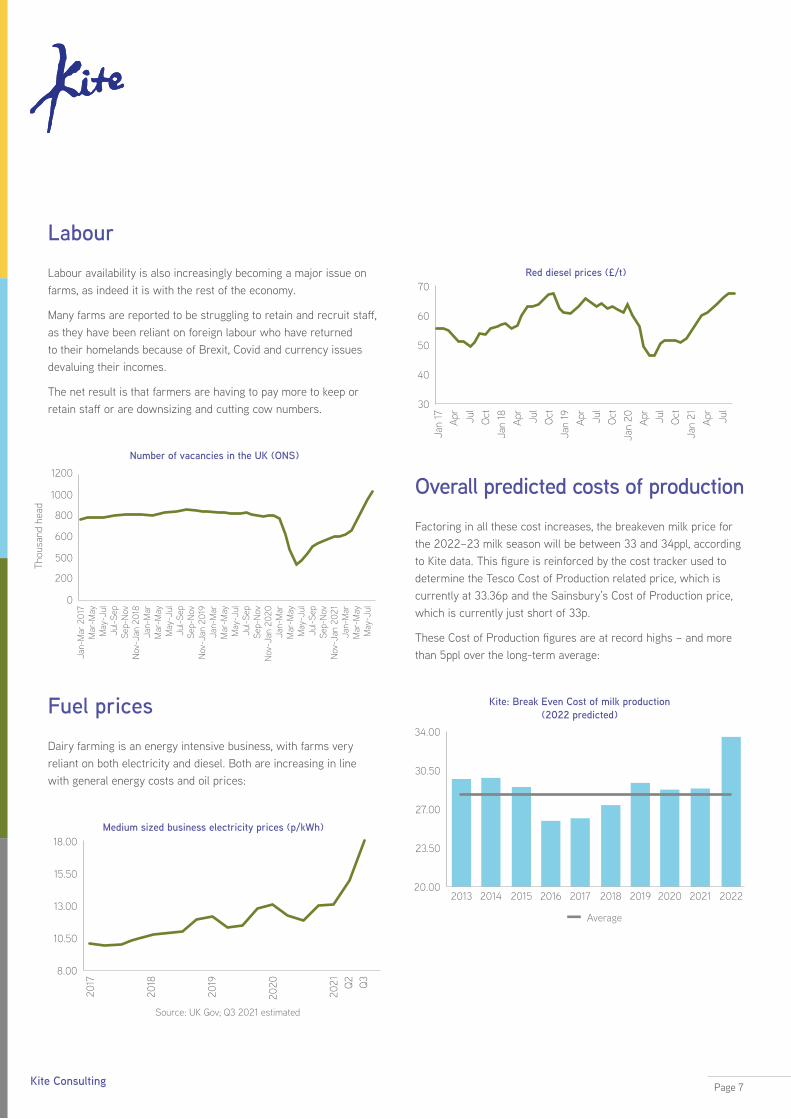
Labour availability is also increasingly becoming a major issue on farms, as indeed it is with the rest of the economy.
Many farms are reported to be struggling to retain and recruit staff, as they have been reliant on foreign labour who have returned to their homelands because of Brexit, Covid and currency issues devaluing their incomes.
The net result is that farmers are having to pay more to keep or retain staff or are downsizing and cutting cow numbers.
Labour
Dairy farming is an energy intensive business, with farms very reliant on both electricity and diesel. Both are increasing in line with general energy costs and oil prices:
Fuel prices
8.00
10.50
15.50
13.00
18.00
2017
2019
2018
Source: UK Gov; Q3 2021 estimated
2020
2021 Q2 Q3
Medium sized business electricity prices (p/kWh)
70
60
40
50
30
Jan
17
Jan
18
Jan
19
Jan
20
Jan
21Apr
Apr
Apr
Apr
Apr
Jul
Jul
Jul
Jul
Jul
Oct
Oct
Oct
Oct
Red diesel prices (£/t)
0
200
500
1000
800
600
1200
Jan-
Mar
201
7
Nov
-Jan
201
8
Nov
-Jan
201
9
Nov
-Jan
202
0
Nov
-Jan
202
1
Mar
-May
Jan-
Mar
Jan-
Mar
Jan-
Mar
Jan-
Mar
May
-Jul
Mar
-May
Mar
-May
Mar
-May
Mar
-May
Jul-S
ep
May
-Jul
May
-Jul
May
-Jul
May
-Jul
Sep-
Nov
Jul-S
ep
Jul-S
ep
Jul-S
ep
Sep-
Nov
Sep-
Nov
Sep-
Nov
Thou
sand
hea
d
Number of vacancies in the UK (ONS)
Factoring in all these cost increases, the breakeven milk price for the 2022–23 milk season will be between 33 and 34ppl, according to Kite data. This figure is reinforced by the cost tracker used to determine the Tesco Cost of Production related price, which is currently at 33.36p and the Sainsbury’s Cost of Production price, which is currently just short of 33p.
These Cost of Production figures are at record highs – and more than 5ppl over the long-term average:
Overall predicted costs of production
Kite: Break Even Cost of milk production (2022 predicted)
34.00
27.00
30.50
23.50
20.002013 2016 20192014 2017 20202015 2018 2021 2022
Average
Page 8Kite Consulting
The implications of farmers not being paid a minimum Cost of Production price are significant, especially in a post-Brexit world where changes in farming policy mean farmers will have the option of taking an incentive to retire, or to farm in a way that prioritises ‘public money for public goods’ rather than farming to produce food. In either situation, it is easy to see an increase in the number of retiring farmers or land exiting dairy production.
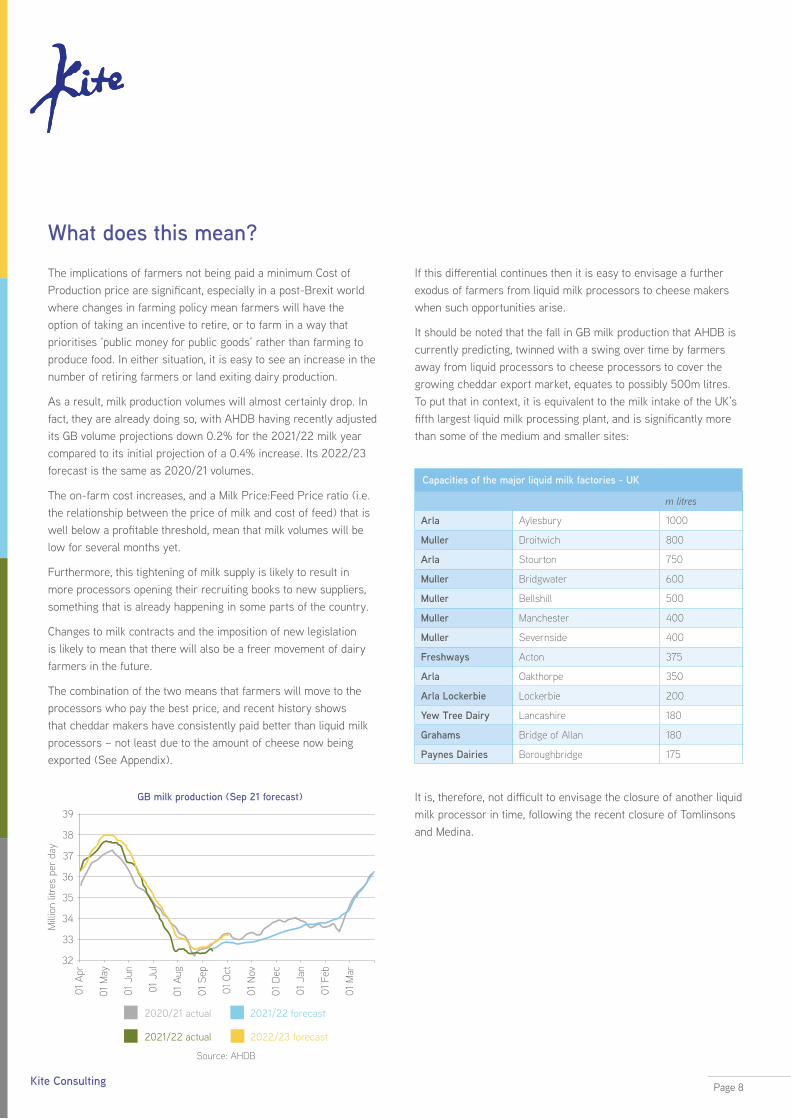
As a result, milk production volumes will almost certainly drop. In fact, they are already doing so, with AHDB having recently adjusted its GB volume projections down 0.2% for the 2021/22 milk year compared to its initial projection of a 0.4% increase. Its 2022/23 forecast is the same as 2020/21 volumes.
The on-farm cost increases, and a Milk Price:Feed Price ratio (i.e. the relationship between the price of milk and cost of feed) that is well below a profitable threshold, mean that milk volumes will be low for several months yet.
Furthermore, this tightening of milk supply is likely to result in more processors opening their recruiting books to new suppliers, something that is already happening in some parts of the country.
Changes to milk contracts and the imposition of new legislation is likely to mean that there will also be a freer movement of dairy farmers in the future.
The combination of the two means that farmers will move to the processors who pay the best price, and recent history shows that cheddar makers have consistently paid better than liquid milk processors – not least due to the amount of cheese now being exported (See Appendix).
What does this mean?If this differential continues then it is easy to envisage a further exodus of farmers from liquid milk processors to cheese makers when such opportunities arise.
It should be noted that the fall in GB milk production that AHDB is currently predicting, twinned with a swing over time by farmers away from liquid processors to cheese processors to cover the growing cheddar export market, equates to possibly 500m litres. To put that in context, it is equivalent to the milk intake of the UK’s fifth largest liquid milk processing plant, and is significantly more than some of the medium and smaller sites:
It is, therefore, not difficult to envisage the closure of another liquid milk processor in time, following the recent closure of Tomlinsons and Medina.
Capacities of the major liquid milk factories - UK
Arla Aylesbury 1000
Muller Droitwich 800
Arla Stourton 750
Muller Bridgwater 600
Muller Bellshill 500
Muller Manchester 400
Muller Severnside 400
Freshways Acton 375
Arla Oakthorpe 350
Arla Lockerbie Lockerbie 200
Yew Tree Dairy Lancashire 180
Grahams Bridge of Allan 180
Paynes Dairies Boroughbridge 175
m litres
39
36
Mill
ion
litre
s pe
r da
y
33
34
35
37
38
32
01 A
pr
01 S
ep
01 A
ug
01 J
an
01 F
eb
01 M
ar
01 M
ay
01 O
ct
01 J
un
01 N
ov
01 J
ul
01 D
ec
GB milk production (Sep 21 forecast)
2020/21 actual 2021/22 forecast
2021/22 actual 2022/23 forecast
Source: AHDB
Page 9Kite Consulting
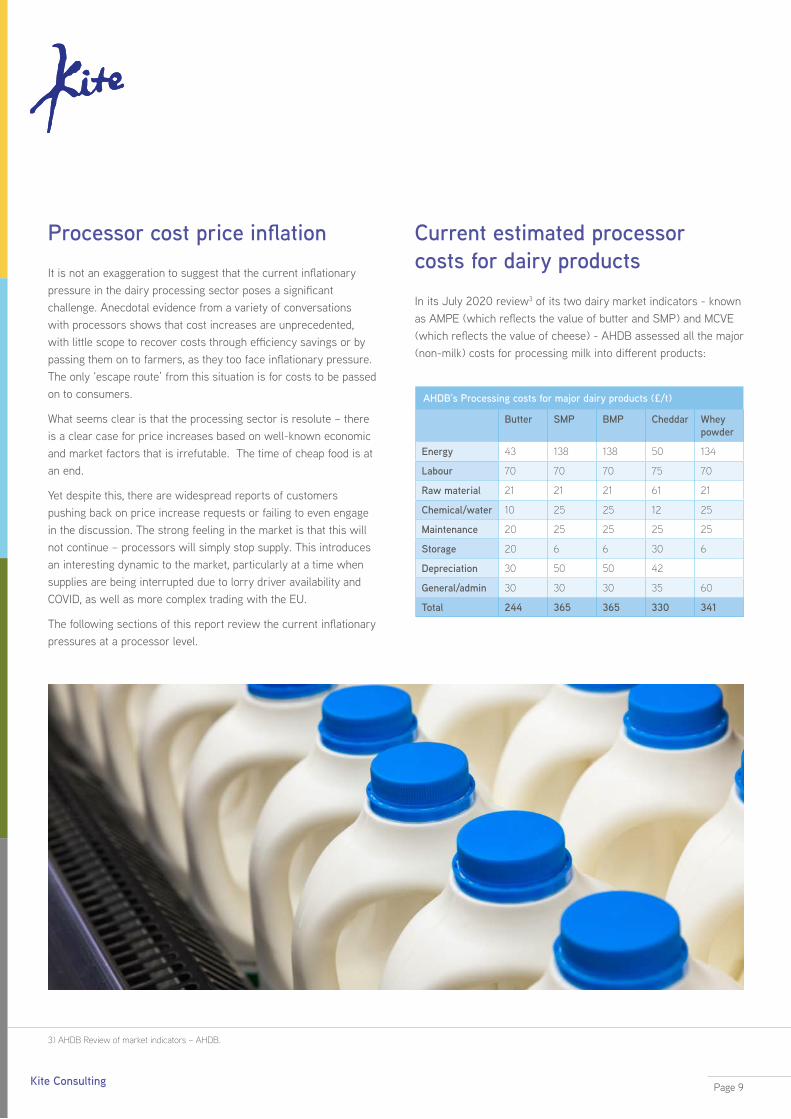
It is not an exaggeration to suggest that the current inflationary pressure in the dairy processing sector poses a significant challenge. Anecdotal evidence from a variety of conversations with processors shows that cost increases are unprecedented, with little scope to recover costs through efficiency savings or by passing them on to farmers, as they too face inflationary pressure. The only ‘escape route’ from this situation is for costs to be passed on to consumers.
What seems clear is that the processing sector is resolute – there is a clear case for price increases based on well-known economic and market factors that is irrefutable. The time of cheap food is at an end.
Yet despite this, there are widespread reports of customers pushing back on price increase requests or failing to even engage in the discussion. The strong feeling in the market is that this will not continue – processors will simply stop supply. This introduces an interesting dynamic to the market, particularly at a time when supplies are being interrupted due to lorry driver availability and COVID, as well as more complex trading with the EU.
The following sections of this report review the current inflationary pressures at a processor level.
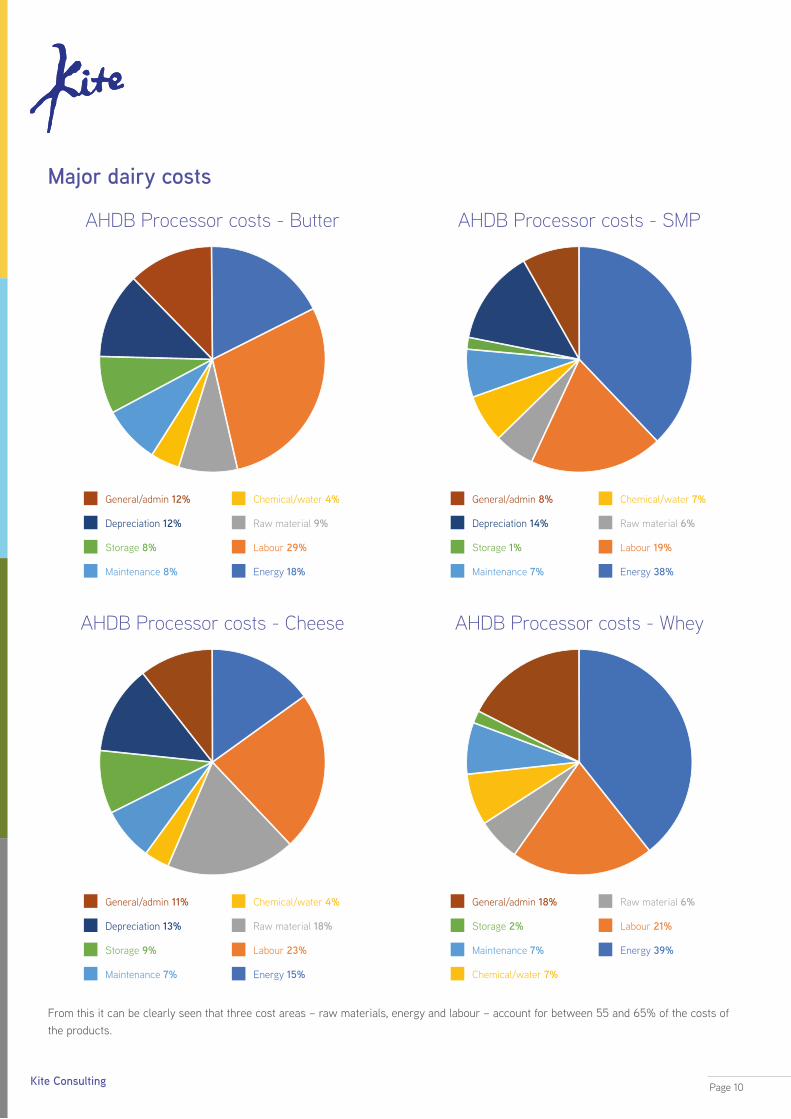
In its July 2020 review3 of its two dairy market indicators - known as AMPE (which reflects the value of butter and SMP) and MCVE (which reflects the value of cheese) - AHDB assessed all the major (non-milk) costs for processing milk into different products:
Processor cost price inflation Current estimated processor costs for dairy products
3) AHDB Review of market indicators – AHDB.
AHDB’s Processing costs for major dairy products (£/t)
Butter SMP BMP Cheddar Whey powder
Energy 43 138 138 50 134
Labour 70 70 70 75 70
Raw material 21 21 21 61 21
Chemical/water 10 25 25 12 25
Maintenance 20 25 25 25 25
Storage 20 6 6 30 6
Depreciation 30 50 50 42
General/admin 30 30 30 35 60
Total 244 365 365 330 341
Page 10Kite Consulting
Major dairy costs
AHDB Processor costs - Butter AHDB Processor costs - SMP
Maintenance 8%
General/admin 12%
Depreciation 12%
Storage 8%
Energy 18%
Labour 29%
Chemical/water 4%
Raw material 9%
AHDB Processor costs - Cheese
Maintenance 7%
General/admin 11%
Depreciation 13%
Storage 9%
Energy 15%
Labour 23%
Chemical/water 4%
Raw material 18%
AHDB Processor costs - Whey
Maintenance 7%
General/admin 18%
Storage 2%
Chemical/water 7%
Energy 39%
Labour 21%
Raw material 6%
Maintenance 7%
General/admin 8%
Depreciation 14%
Storage 1%
Energy 38%
Labour 19%
Chemical/water 7%
Raw material 6%
From this it can be clearly seen that three cost areas – raw materials, energy and labour – account for between 55 and 65% of the costs of the products.
Page 11Kite Consulting
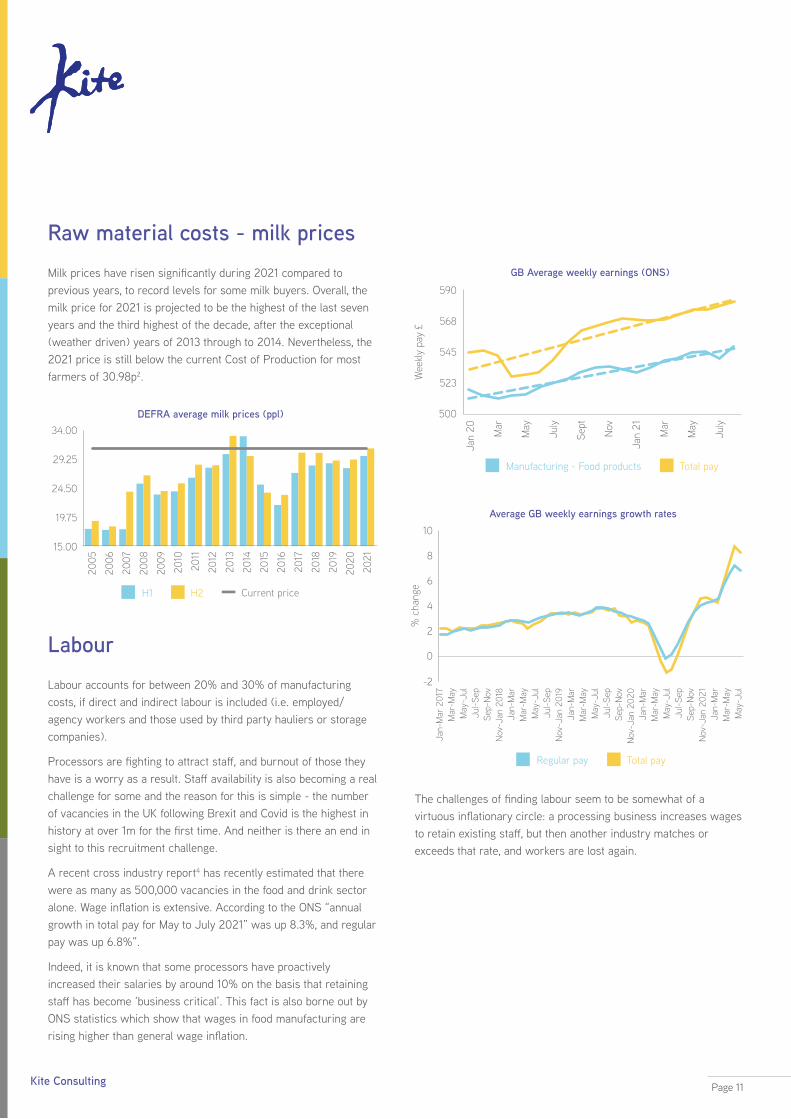
Milk prices have risen significantly during 2021 compared to previous years, to record levels for some milk buyers. Overall, the milk price for 2021 is projected to be the highest of the last seven years and the third highest of the decade, after the exceptional (weather driven) years of 2013 through to 2014. Nevertheless, the 2021 price is still below the current Cost of Production for most farmers of 30.98p2.
Raw material costs - milk prices
DEFRA average milk prices (ppl)
29.25
34.00
19.75
24.50
15.00
2005
2013
2009
2017
2007
2015
2011
2019
2006
2014
2010
2018
2008
2016
2012
2020
2021
H1 H2 Current price
Labour accounts for between 20% and 30% of manufacturing costs, if direct and indirect labour is included (i.e. employed/agency workers and those used by third party hauliers or storage companies).
Processors are fighting to attract staff, and burnout of those they have is a worry as a result. Staff availability is also becoming a real challenge for some and the reason for this is simple - the number of vacancies in the UK following Brexit and Covid is the highest in history at over 1m for the first time. And neither is there an end in sight to this recruitment challenge.
A recent cross industry report4 has recently estimated that there were as many as 500,000 vacancies in the food and drink sector alone. Wage inflation is extensive. According to the ONS “annual growth in total pay for May to July 2021” was up 8.3%, and regular pay was up 6.8%”.
Indeed, it is known that some processors have proactively increased their salaries by around 10% on the basis that retaining staff has become ‘business critical’. This fact is also borne out by ONS statistics which show that wages in food manufacturing are rising higher than general wage inflation.
Labour
The challenges of finding labour seem to be somewhat of a virtuous inflationary circle: a processing business increases wages to retain existing staff, but then another industry matches or exceeds that rate, and workers are lost again.
590
568
523
545
500
Jan
20
Wee
kly
pay
£
May
Sept
July
Mar
May
Mar
July
Nov
Jan
21
GB Average weekly earnings (ONS)
Manufacturing - Food products Total pay
Regular pay Total pay
10
8
6
2
4
0
-2
Jan-
Mar
201
7
May
-Jul
Sep-
Nov
Sep-
Nov
Sep-
Nov
Jan-
Mar
Jan-
Mar
Jan-
Mar
Jan-
Mar
May
-Jul
May
-Jul
May
-Jul
May
-Jul
Mar
-May
Jul-S
ep
Nov
-Jan
201
8
Nov
-Jan
202
0
Nov
-Jan
202
1
Nov
-Jan
201
9
Mar
-May
Mar
-May
Mar
-May
Mar
-May
Jul-S
ep
Jul-S
ep
Jul-S
ep
% c
hang
e
Average GB weekly earnings growth rates

Page 12Kite Consulting
DriversTransport costs are also significantly affected by increases in labour on the back of the shortage of 100,000 HGV drivers. This manifests in difficulties with on-farm milk collection, through to final product deliveries for both the domestic market and export. At the time of writing this report in October 2021 a Google search for “milk tanker driver jobs” revealed 86 vacancies. In September a similar search produced 97 vacancies.
Although most milk is still being picked up from farms, there have been some well publicised cancelled collections, with milk being dumped. And processors are having to pay significantly more to secure drivers. Anecdotal conversations with processors suggest that milk collection costs are increasing by between 15% and 30%. There is even some talk of force majeure being threatened by hauliers if the processors don’t agree to the increases.
There will be no easy fix on this issue. The Road Haulage Association has warned that there will be no early easing of the situation and that “it will take at least 18 months to train 100,000 HGV drivers”. Nor does the Government’s latest visa scheme looks as it will be a knight in shining armour. At the time of writing, of the 5,000 additional lorry driver visas the Government has agreed to issue just 300 drivers have applied, and 20 have been issued.
Fuel pricesIn addition to driver wage inflation, fuel costs are now at eight-year highs, and well above the average price since 2014.
Again, diesel prices are unlikely to fall in the short time, with 2022 projections little different to current prices.
Transport and Logistics
1.00
1.20
1.40
1.05
1.25
1.45
1.10
1.30
1.50
1.15
1.35
Jan
14
Jan
16
Jan
18
Jan
20
Jan
15
Jan
17
Jan
19
Jan
21Apr
Apr
Apr
Apr
Apr
Apr
Apr
Apr
Jul
Jul
Jul
Jul
Jul
Jul
Jul
Jul
Oct
Oct
Oct
Oct
Oct
Oct
Oct
Oct
Road diesel prices £/l
Average
Page 13Kite Consulting
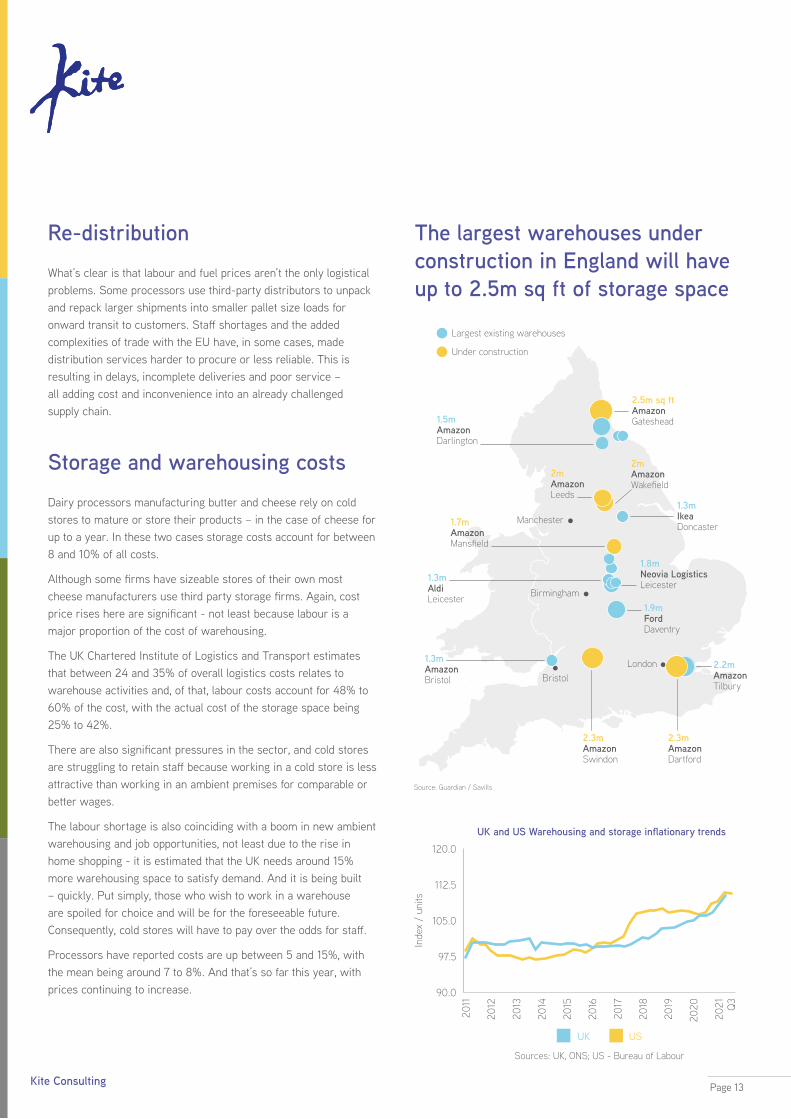
What’s clear is that labour and fuel prices aren’t the only logistical problems. Some processors use third-party distributors to unpack and repack larger shipments into smaller pallet size loads for onward transit to customers. Staff shortages and the added complexities of trade with the EU have, in some cases, made distribution services harder to procure or less reliable. This is resulting in delays, incomplete deliveries and poor service – all adding cost and inconvenience into an already challenged supply chain.
Re-distribution
Dairy processors manufacturing butter and cheese rely on cold stores to mature or store their products – in the case of cheese for up to a year. In these two cases storage costs account for between 8 and 10% of all costs.
Although some firms have sizeable stores of their own most cheese manufacturers use third party storage firms. Again, cost price rises here are significant - not least because labour is a major proportion of the cost of warehousing.
The UK Chartered Institute of Logistics and Transport estimates that between 24 and 35% of overall logistics costs relates to warehouse activities and, of that, labour costs account for 48% to 60% of the cost, with the actual cost of the storage space being 25% to 42%.
There are also significant pressures in the sector, and cold stores are struggling to retain staff because working in a cold store is less attractive than working in an ambient premises for comparable or better wages.
The labour shortage is also coinciding with a boom in new ambient warehousing and job opportunities, not least due to the rise in home shopping - it is estimated that the UK needs around 15% more warehousing space to satisfy demand. And it is being built – quickly. Put simply, those who wish to work in a warehouse are spoiled for choice and will be for the foreseeable future. Consequently, cold stores will have to pay over the odds for staff.
Processors have reported costs are up between 5 and 15%, with the mean being around 7 to 8%. And that’s so far this year, with prices continuing to increase.
Storage and warehousing costs
120.0
112.5
97.5
105.0
90.0
2011
2015
2019
2013
2017
2021
2012
2016
2020
2014
2018 Q3
Inde
x /
units
UK and US Warehousing and storage inflationary trends
UK US
Sources: UK, ONS; US - Bureau of Labour
The largest warehouses under construction in England will have up to 2.5m sq ft of storage space
Largest existing warehouses
Under construction
2.5m sq ftAmazonGateshead
2m AmazonWakeeld
2m AmazonLeeds
Manchester
Birmingham
LondonBristol
1.5mAmazonDarlington
1.7mAmazonManseld
1.3mAldiLeicester
1.3mAmazonBristol
1.3mIkeaDoncaster
1.8mNeovia LogisticsLeicester
1.9mFordDaventry
2.2mAmazonTilbury
2.3mAmazonDartford
2.3mAmazonSwindon
Source: Guardian / Savills
Page 14Kite Consulting
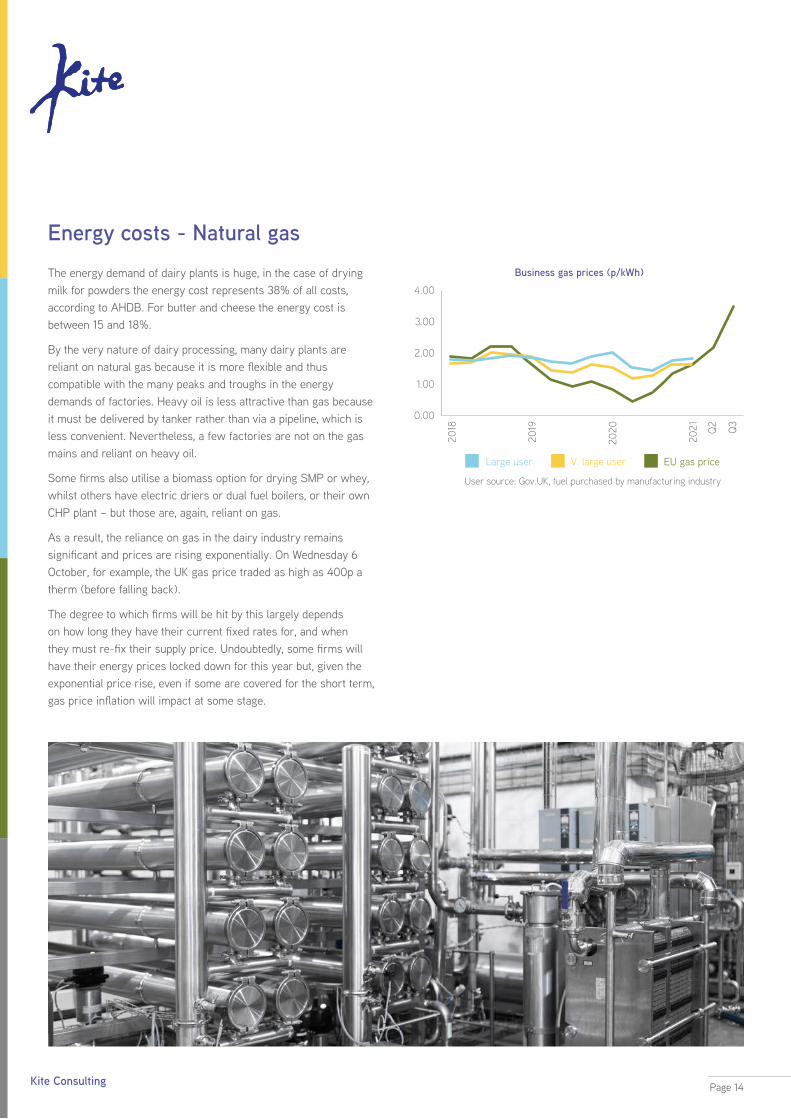
The energy demand of dairy plants is huge, in the case of drying milk for powders the energy cost represents 38% of all costs, according to AHDB. For butter and cheese the energy cost is between 15 and 18%.
By the very nature of dairy processing, many dairy plants are reliant on natural gas because it is more flexible and thus compatible with the many peaks and troughs in the energy demands of factories. Heavy oil is less attractive than gas because it must be delivered by tanker rather than via a pipeline, which is less convenient. Nevertheless, a few factories are not on the gas mains and reliant on heavy oil.
Some firms also utilise a biomass option for drying SMP or whey, whilst others have electric driers or dual fuel boilers, or their own CHP plant – but those are, again, reliant on gas.
As a result, the reliance on gas in the dairy industry remains significant and prices are rising exponentially. On Wednesday 6 October, for example, the UK gas price traded as high as 400p a therm (before falling back).
The degree to which firms will be hit by this largely depends on how long they have their current fixed rates for, and when they must re-fix their supply price. Undoubtedly, some firms will have their energy prices locked down for this year but, given the exponential price rise, even if some are covered for the short term, gas price inflation will impact at some stage.
Energy costs - Natural gas
4.00
1.00
3.00
2.00
0.00
2018
2021
2019
2020 Q
2 Q3
Business gas prices (p/kWh)
Large user V. large user EU gas price
User source: Gov.UK, fuel purchased by manufacturing industry
Page 15Kite Consulting
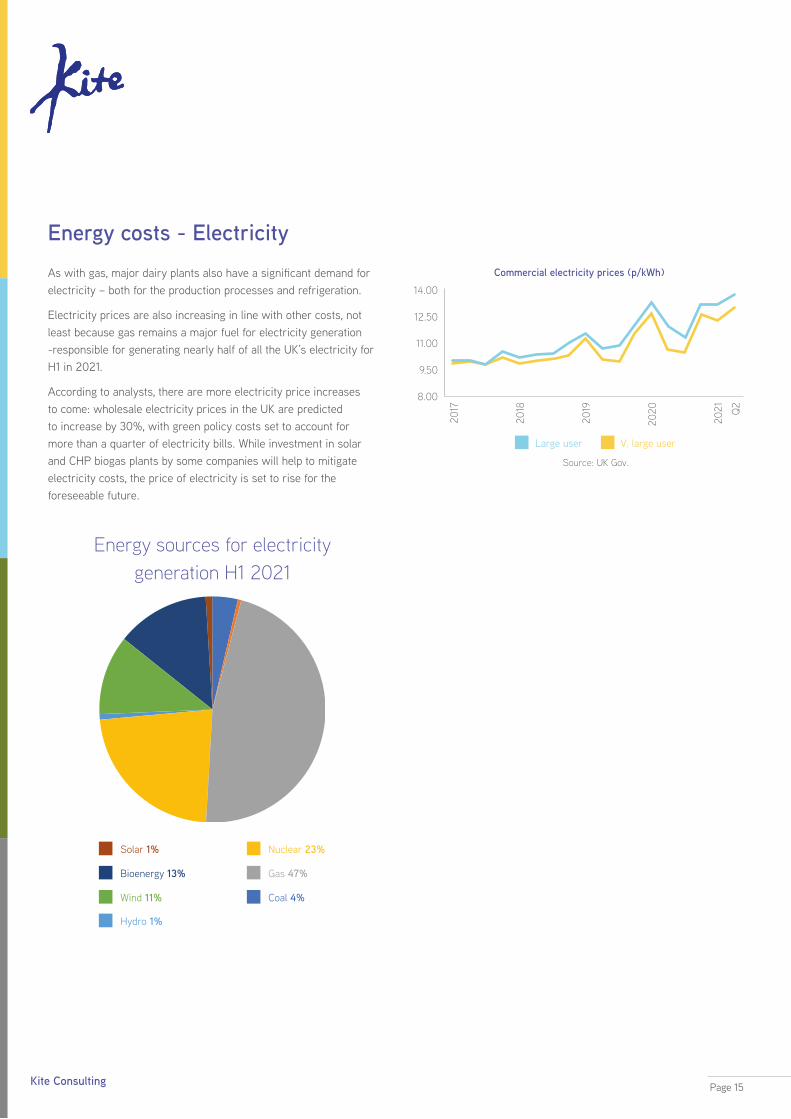
As with gas, major dairy plants also have a significant demand for electricity – both for the production processes and refrigeration.
Electricity prices are also increasing in line with other costs, not least because gas remains a major fuel for electricity generation -responsible for generating nearly half of all the UK’s electricity for H1 in 2021.
According to analysts, there are more electricity price increases to come: wholesale electricity prices in the UK are predicted to increase by 30%, with green policy costs set to account for more than a quarter of electricity bills. While investment in solar and CHP biogas plants by some companies will help to mitigate electricity costs, the price of electricity is set to rise for the foreseeable future.
Energy costs - Electricity
14.00
9.50
12.50
11.00
8.00
2017
2020
2021
2018
2019 Q2
Commercial electricity prices (p/kWh)
Large user V. large user
Source: UK Gov.
Energy sources for electricity generation H1 2021
Hydro 1%
Solar 1%
Bioenergy 13%
Wind 11%
Nuclear 23%
Gas 47%
Coal 4%
Page 16Kite Consulting
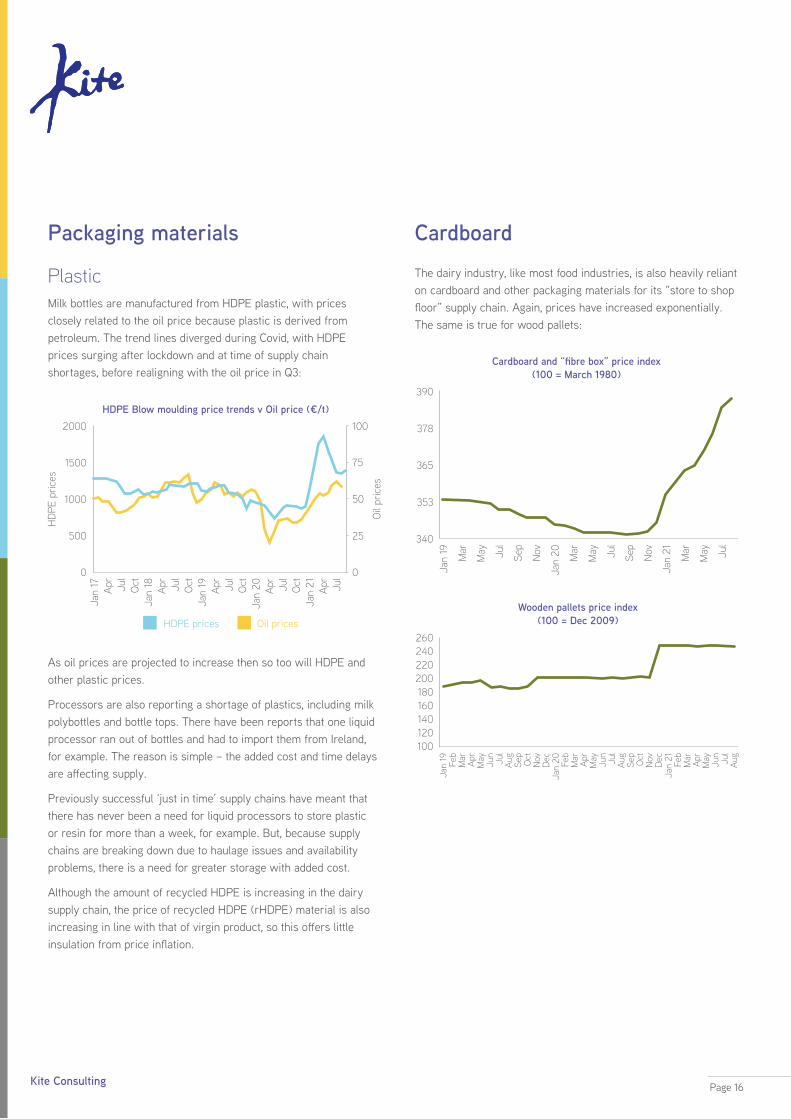
PlasticMilk bottles are manufactured from HDPE plastic, with prices closely related to the oil price because plastic is derived from petroleum. The trend lines diverged during Covid, with HDPE prices surging after lockdown and at time of supply chain shortages, before realigning with the oil price in Q3:
As oil prices are projected to increase then so too will HDPE and other plastic prices.
Processors are also reporting a shortage of plastics, including milk polybottles and bottle tops. There have been reports that one liquid processor ran out of bottles and had to import them from Ireland, for example. The reason is simple – the added cost and time delays are affecting supply.
Previously successful ‘just in time’ supply chains have meant that there has never been a need for liquid processors to store plastic or resin for more than a week, for example. But, because supply chains are breaking down due to haulage issues and availability problems, there is a need for greater storage with added cost.
Although the amount of recycled HDPE is increasing in the dairy supply chain, the price of recycled HDPE (rHDPE) material is also increasing in line with that of virgin product, so this offers little insulation from price inflation.
Packaging materials
1500
2000
500
0
1000
0
HD
PE p
rices
Oil
pric
es
25
50
75
100
Jan
17
Jan
18
Jan
19
Jan
20
Jan
21Apr
Apr
Apr
Apr
Apr
Jul
Jul
Jul
Jul
Jul
Oct
Oct
Oct
Oct
HDPE Blow moulding price trends v Oil price (¤/t)
HDPE prices Oil prices
The dairy industry, like most food industries, is also heavily reliant on cardboard and other packaging materials for its “store to shop floor” supply chain. Again, prices have increased exponentially. The same is true for wood pallets:
Cardboard
378
390
353
365
340
Jan
19
Jan
20
Jan
21Jul
Jul
Jul
Mar
Mar
Mar
Sep
Sep
May
May
May
Nov
Nov
Cardboard and “fibre box” price index (100 = March 1980)
260
120140160180200220240
100
Jan
19
Jan
20
Jan
21Feb
Feb
Feb
Jun
Jun
Jun
Mar
Mar
MarJu
l
Jul
Jul
Apr
Apr
Apr
Aug
Aug
Aug
May
May
May
Sep
Sep
Oct
Oct
Nov
Nov
Dec
Dec
Wooden pallets price index (100 = Dec 2009)
Page 17Kite Consulting
The availability and cost of CO2 were thrust into the spotlight at the end of September with the abrupt shutdown of fertiliser plants in the UK, and the indirect impact that had on CO2 manufacture.
The dairy industry largely uses CO2 in the cheese packing process but is not as reliant on it as other industries. Nitrogen gas can be used instead, but because nitrogen is not absorbed by the cheese, like CO2, the packs are less “snug” and attractive to consumers. However, the cost of both gases has increased exponentially in recent months.
CO2
CO2 N
380
400
420
300
320
120
340
360
280
N In
dex
160
140
200
180
240
220
260
Jan
17
Jan
18
Jan
19
Jan
20
Jan
21
Mar
Mar
Mar
Mar
Mar
May
May
May
May
MayJu
l
Jul
Jul
Jul
Jul
Sept
Sept
Sept
Sept
Sept
Nov
Nov
Nov
Nov
CO2 and N Producer Price Index (100 = 1982)
CO2 I
ndex
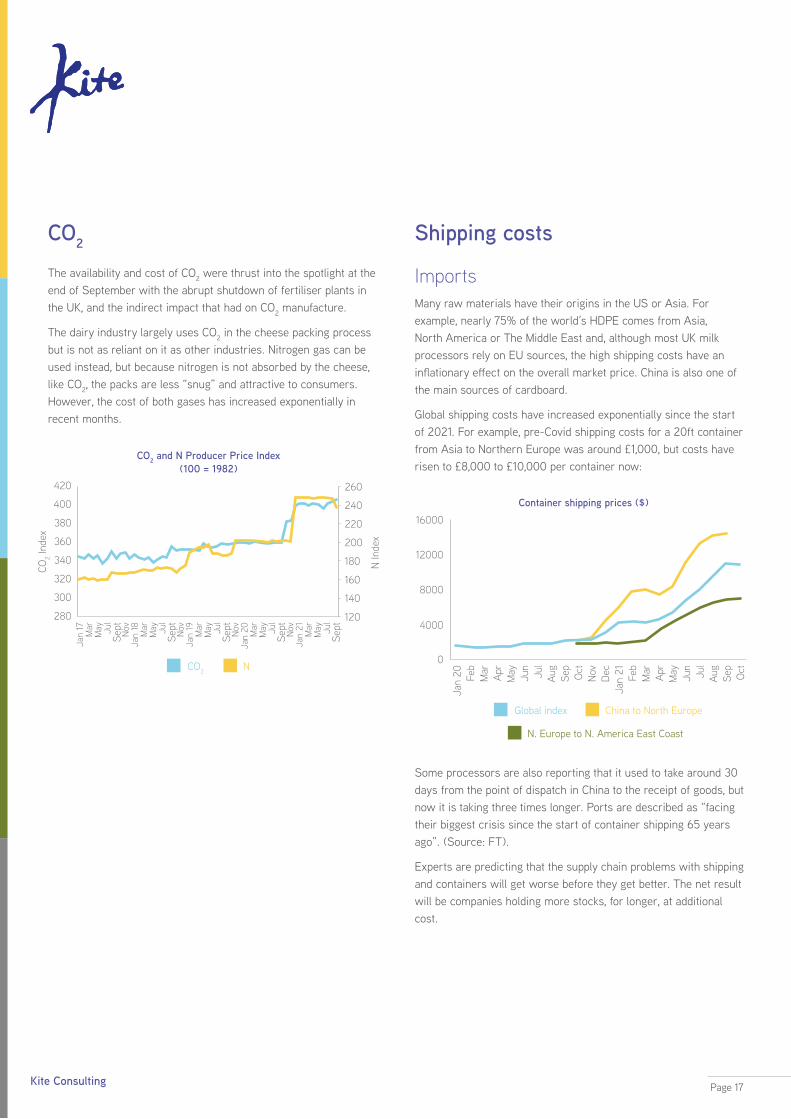
ImportsMany raw materials have their origins in the US or Asia. For example, nearly 75% of the world’s HDPE comes from Asia, North America or The Middle East and, although most UK milk processors rely on EU sources, the high shipping costs have an inflationary effect on the overall market price. China is also one of the main sources of cardboard.
Global shipping costs have increased exponentially since the start of 2021. For example, pre-Covid shipping costs for a 20ft container from Asia to Northern Europe was around £1,000, but costs have risen to £8,000 to £10,000 per container now:
Some processors are also reporting that it used to take around 30 days from the point of dispatch in China to the receipt of goods, but now it is taking three times longer. Ports are described as “facing their biggest crisis since the start of container shipping 65 years ago”. (Source: FT).
Experts are predicting that the supply chain problems with shipping and containers will get worse before they get better. The net result will be companies holding more stocks, for longer, at additional cost.
Shipping costs
16000
4000
12000
8000
0
Jan
20 Jul
Jan
21Apr
Oct
Apr
Aug
Feb
Aug
Feb
May
Nov
May
Sep
Mar
Sep
Mar Ju
l
Jun
Dec Jun
Oct
Container shipping prices ($)
Global index China to North Europe
N. Europe to N. America East Coast
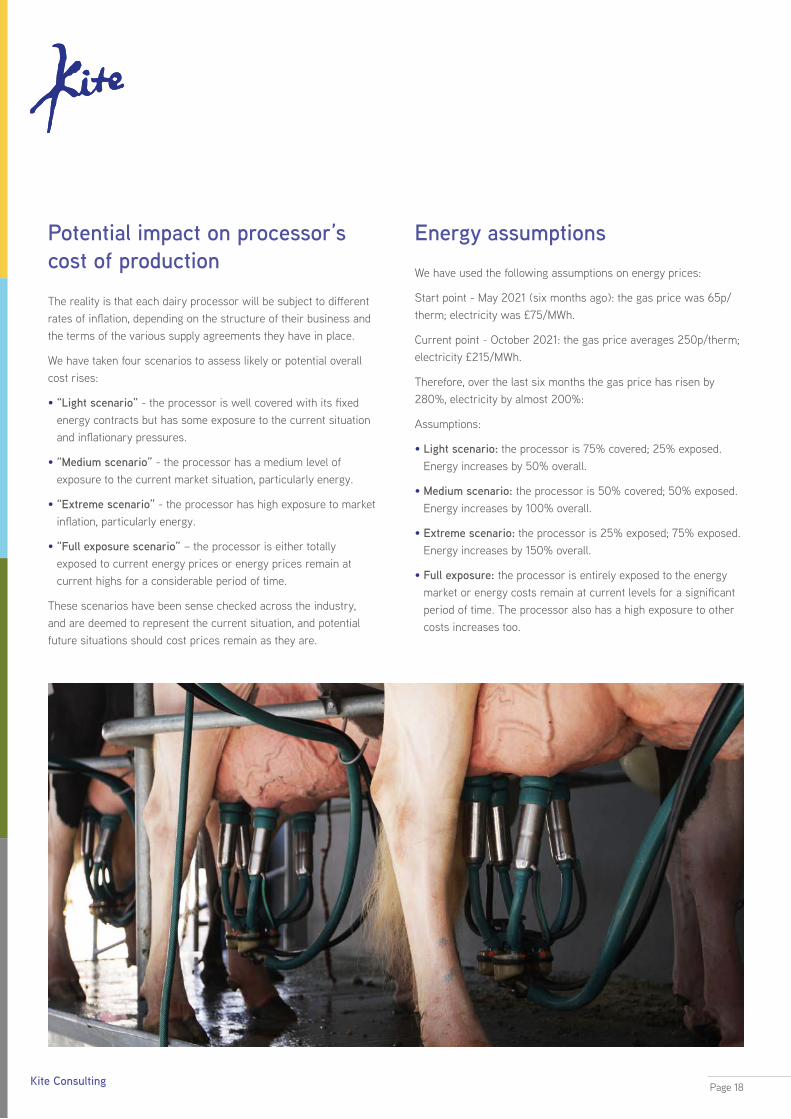
The reality is that each dairy processor will be subject to different rates of inflation, depending on the structure of their business and the terms of the various supply agreements they have in place.
We have taken four scenarios to assess likely or potential overall cost rises:
• “Light scenario” - the processor is well covered with its fixed energy contracts but has some exposure to the current situation and inflationary pressures.
• “Medium scenario” - the processor has a medium level of exposure to the current market situation, particularly energy.
• “Extreme scenario” - the processor has high exposure to market inflation, particularly energy.
• “Full exposure scenario” – the processor is either totally exposed to current energy prices or energy prices remain at current highs for a considerable period of time.
These scenarios have been sense checked across the industry, and are deemed to represent the current situation, and potential future situations should cost prices remain as they are.
We have used the following assumptions on energy prices:
Start point - May 2021 (six months ago): the gas price was 65p/therm; electricity was £75/MWh.
Current point - October 2021: the gas price averages 250p/therm; electricity £215/MWh.
Therefore, over the last six months the gas price has risen by 280%, electricity by almost 200%:
Assumptions:
• Light scenario: the processor is 75% covered; 25% exposed. Energy increases by 50% overall.
• Medium scenario: the processor is 50% covered; 50% exposed. Energy increases by 100% overall.
• Extreme scenario: the processor is 25% exposed; 75% exposed. Energy increases by 150% overall.
• Full exposure: the processor is entirely exposed to the energy market or energy costs remain at current levels for a significant period of time. The processor also has a high exposure to other costs increases too.
Potential impact on processor’s cost of production
Energy assumptions
Page 18Kite Consulting
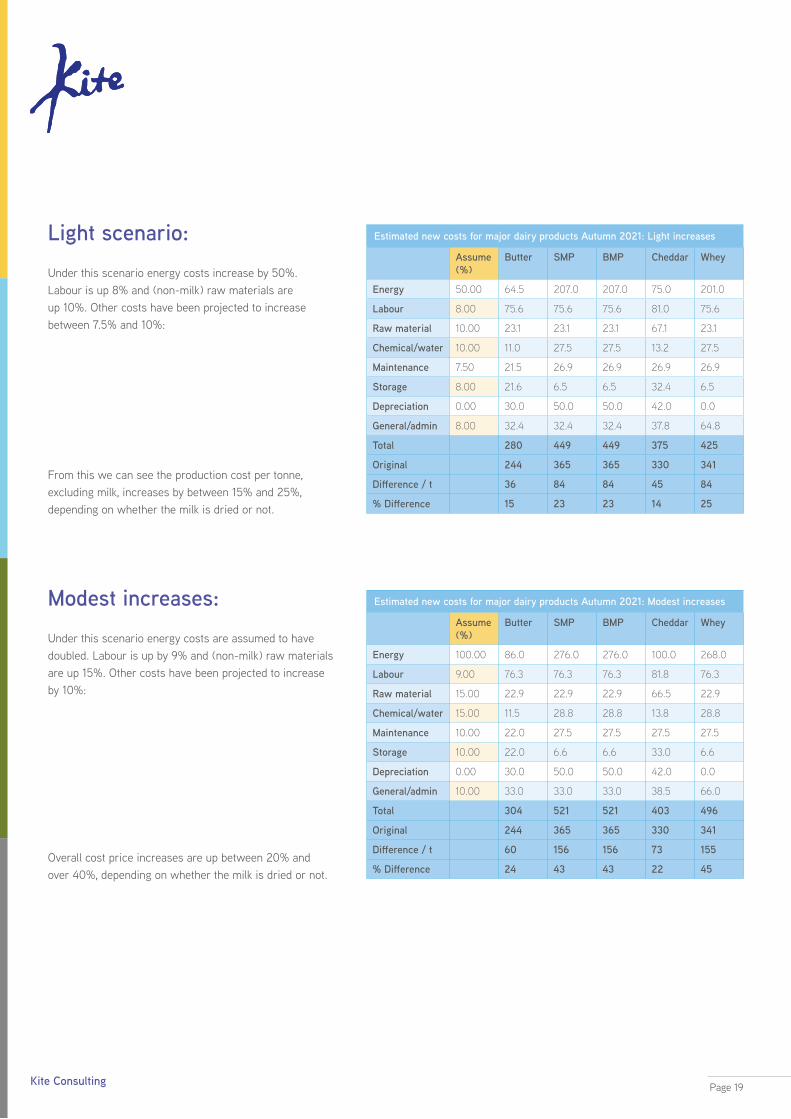
From this we can see the production cost per tonne, excluding milk, increases by between 15% and 25%, depending on whether the milk is dried or not.
Under this scenario energy costs increase by 50%. Labour is up 8% and (non-milk) raw materials are up 10%. Other costs have been projected to increase between 7.5% and 10%:
Light scenario:
Overall cost price increases are up between 20% and over 40%, depending on whether the milk is dried or not.
Under this scenario energy costs are assumed to have doubled. Labour is up by 9% and (non-milk) raw materials are up 15%. Other costs have been projected to increase by 10%:
Modest increases:
Estimated new costs for major dairy products Autumn 2021: Light increases
Assume (%)
Butter SMP BMP Cheddar Whey
Energy 50.00 64.5 207.0 207.0 75.0 201.0
Labour 8.00 75.6 75.6 75.6 81.0 75.6
Raw material 10.00 23.1 23.1 23.1 67.1 23.1
Chemical/water 10.00 11.0 27.5 27.5 13.2 27.5
Maintenance 7.50 21.5 26.9 26.9 26.9 26.9
Storage 8.00 21.6 6.5 6.5 32.4 6.5
Depreciation 0.00 30.0 50.0 50.0 42.0 0.0
General/admin 8.00 32.4 32.4 32.4 37.8 64.8
Total 280 449 449 375 425
Original 244 365 365 330 341
Difference / t 36 84 84 45 84
% Difference 15 23 23 14 25
Estimated new costs for major dairy products Autumn 2021: Modest increases
Assume (%)
Butter SMP BMP Cheddar Whey
Energy 100.00 86.0 276.0 276.0 100.0 268.0
Labour 9.00 76.3 76.3 76.3 81.8 76.3
Raw material 15.00 22.9 22.9 22.9 66.5 22.9
Chemical/water 15.00 11.5 28.8 28.8 13.8 28.8
Maintenance 10.00 22.0 27.5 27.5 27.5 27.5
Storage 10.00 22.0 6.6 6.6 33.0 6.6
Depreciation 0.00 30.0 50.0 50.0 42.0 0.0
General/admin 10.00 33.0 33.0 33.0 38.5 66.0
Total 304 521 521 403 496
Original 244 365 365 330 341
Difference / t 60 156 156 73 155
% Difference 24 43 43 22 45
Page 19Kite Consulting
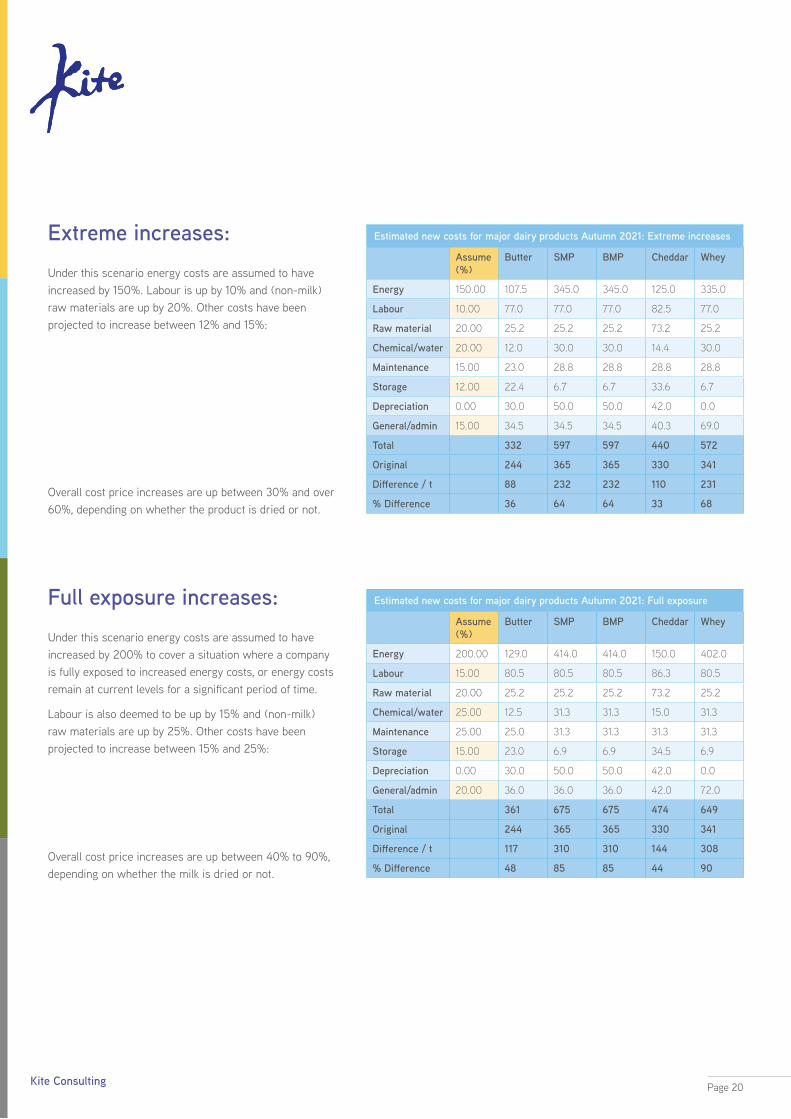
Under this scenario energy costs are assumed to have increased by 150%. Labour is up by 10% and (non-milk) raw materials are up by 20%. Other costs have been projected to increase between 12% and 15%:
Overall cost price increases are up between 30% and over 60%, depending on whether the product is dried or not.
Overall cost price increases are up between 40% to 90%, depending on whether the milk is dried or not.
Extreme increases:
Under this scenario energy costs are assumed to have increased by 200% to cover a situation where a company is fully exposed to increased energy costs, or energy costs remain at current levels for a significant period of time.
Labour is also deemed to be up by 15% and (non-milk) raw materials are up by 25%. Other costs have been projected to increase between 15% and 25%:
Full exposure increases:
Estimated new costs for major dairy products Autumn 2021: Extreme increases
Assume (%)
Butter SMP BMP Cheddar Whey
Energy 150.00 107.5 345.0 345.0 125.0 335.0
Labour 10.00 77.0 77.0 77.0 82.5 77.0
Raw material 20.00 25.2 25.2 25.2 73.2 25.2
Chemical/water 20.00 12.0 30.0 30.0 14.4 30.0
Maintenance 15.00 23.0 28.8 28.8 28.8 28.8
Storage 12.00 22.4 6.7 6.7 33.6 6.7
Depreciation 0.00 30.0 50.0 50.0 42.0 0.0
General/admin 15.00 34.5 34.5 34.5 40.3 69.0
Total 332 597 597 440 572
Original 244 365 365 330 341
Difference / t 88 232 232 110 231
% Difference 36 64 64 33 68
Estimated new costs for major dairy products Autumn 2021: Full exposure
Assume (%)
Butter SMP BMP Cheddar Whey
Energy 200.00 129.0 414.0 414.0 150.0 402.0
Labour 15.00 80.5 80.5 80.5 86.3 80.5
Raw material 20.00 25.2 25.2 25.2 73.2 25.2
Chemical/water 25.00 12.5 31.3 31.3 15.0 31.3
Maintenance 25.00 25.0 31.3 31.3 31.3 31.3
Storage 15.00 23.0 6.9 6.9 34.5 6.9
Depreciation 0.00 30.0 50.0 50.0 42.0 0.0
General/admin 20.00 36.0 36.0 36.0 42.0 72.0
Total 361 675 675 474 649
Original 244 365 365 330 341
Difference / t 117 310 310 144 308
% Difference 48 85 85 44 90
Page 20Kite Consulting
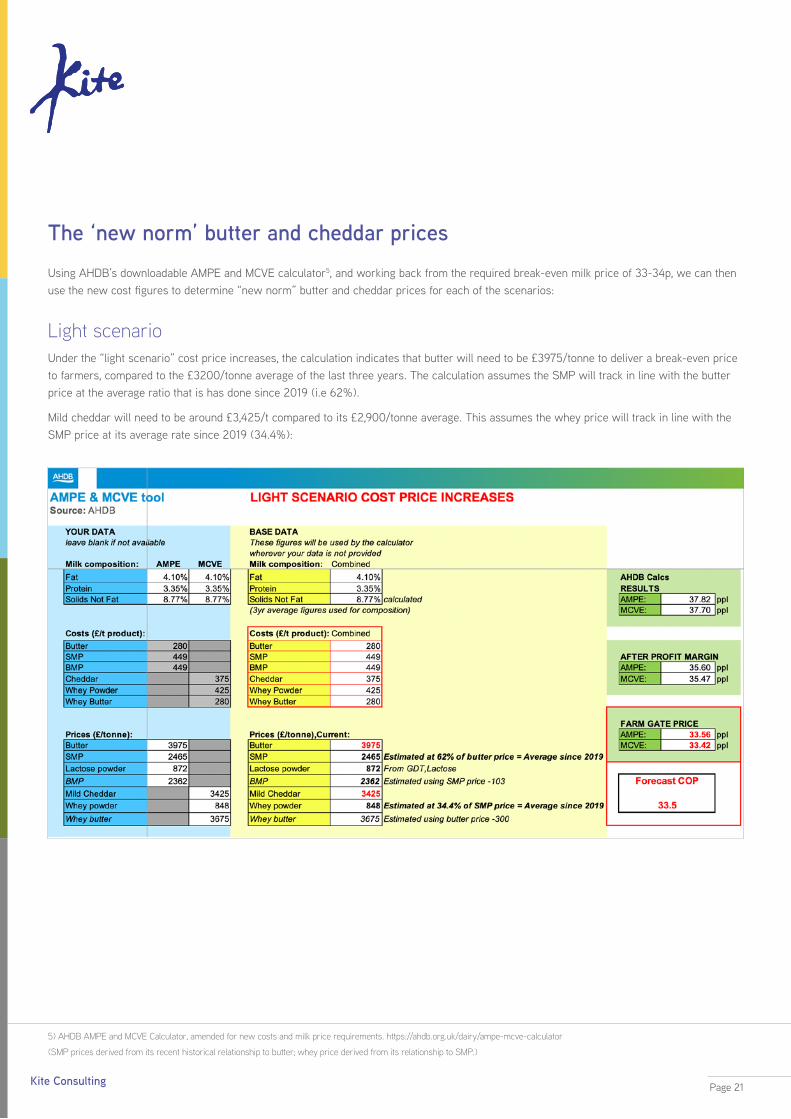
Using AHDB’s downloadable AMPE and MCVE calculator5, and working back from the required break-even milk price of 33-34p, we can then use the new cost figures to determine “new norm” butter and cheddar prices for each of the scenarios:
Light scenario Under the “light scenario” cost price increases, the calculation indicates that butter will need to be £3975/tonne to deliver a break-even price to farmers, compared to the £3200/tonne average of the last three years. The calculation assumes the SMP will track in line with the butter price at the average ratio that is has done since 2019 (i.e 62%).
Mild cheddar will need to be around £3,425/t compared to its £2,900/tonne average. This assumes the whey price will track in line with the SMP price at its average rate since 2019 (34.4%):
The ‘new norm’ butter and cheddar prices
5) AHDB AMPE and MCVE Calculator, amended for new costs and milk price requirements. https://ahdb.org.uk/dairy/ampe-mcve-calculator
(SMP prices derived from its recent historical relationship to butter; whey price derived from its relationship to SMP.)
Page 21Kite Consulting
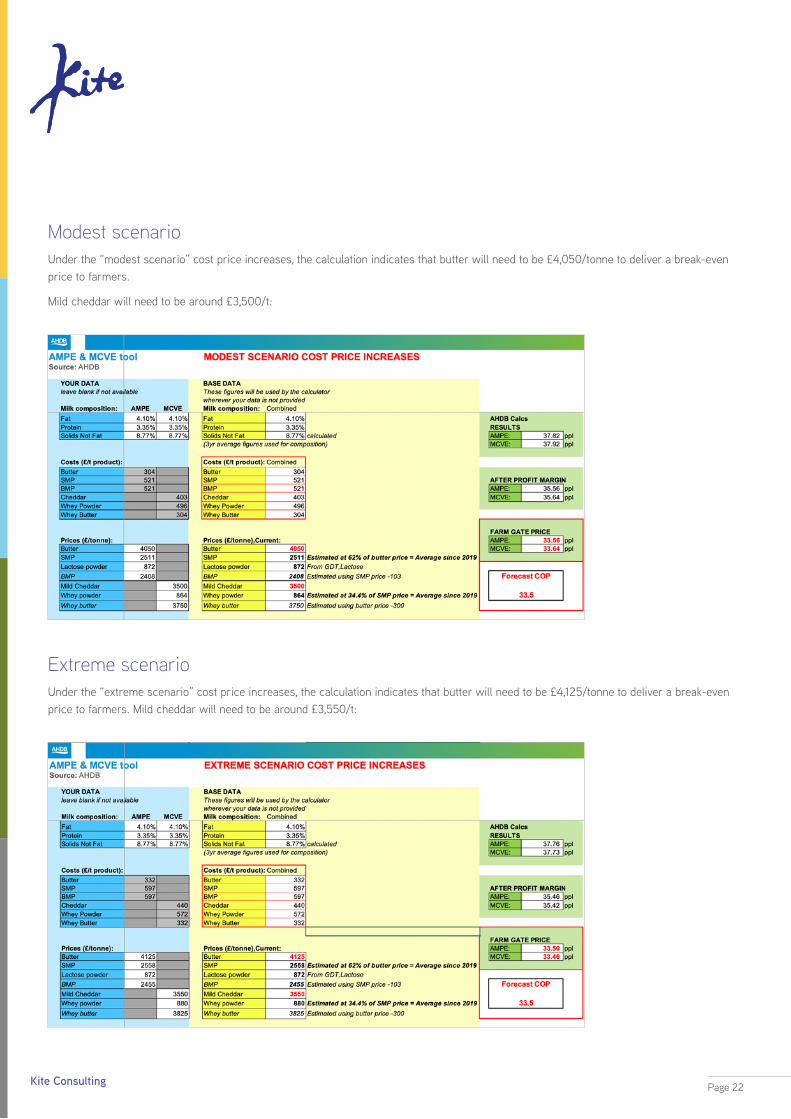
Modest scenario Under the “modest scenario” cost price increases, the calculation indicates that butter will need to be £4,050/tonne to deliver a break-even price to farmers.
Mild cheddar will need to be around £3,500/t:
Extreme scenario Under the “extreme scenario” cost price increases, the calculation indicates that butter will need to be £4,125/tonne to deliver a break-even price to farmers. Mild cheddar will need to be around £3,550/t:
Page 22Kite Consulting
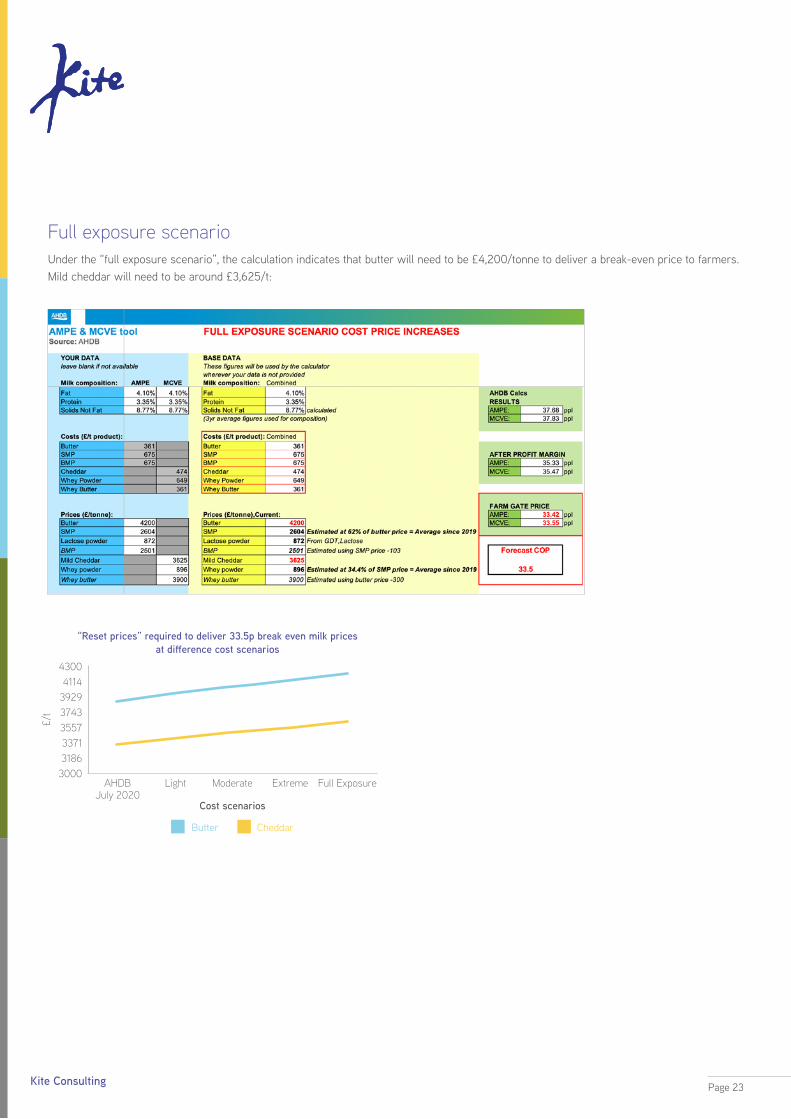
Full exposure scenario Under the “full exposure scenario”, the calculation indicates that butter will need to be £4,200/tonne to deliver a break-even price to farmers. Mild cheddar will need to be around £3,625/t:
3186
3557
3929
3371
3743
AHDB July 2020
Light Moderate
Cost scenarios
Extreme Full Exposure
43004114
£/t
3000
“Reset prices” required to deliver 33.5p break even milk prices at difference cost scenarios
Butter Cheddar
Page 23Kite Consulting
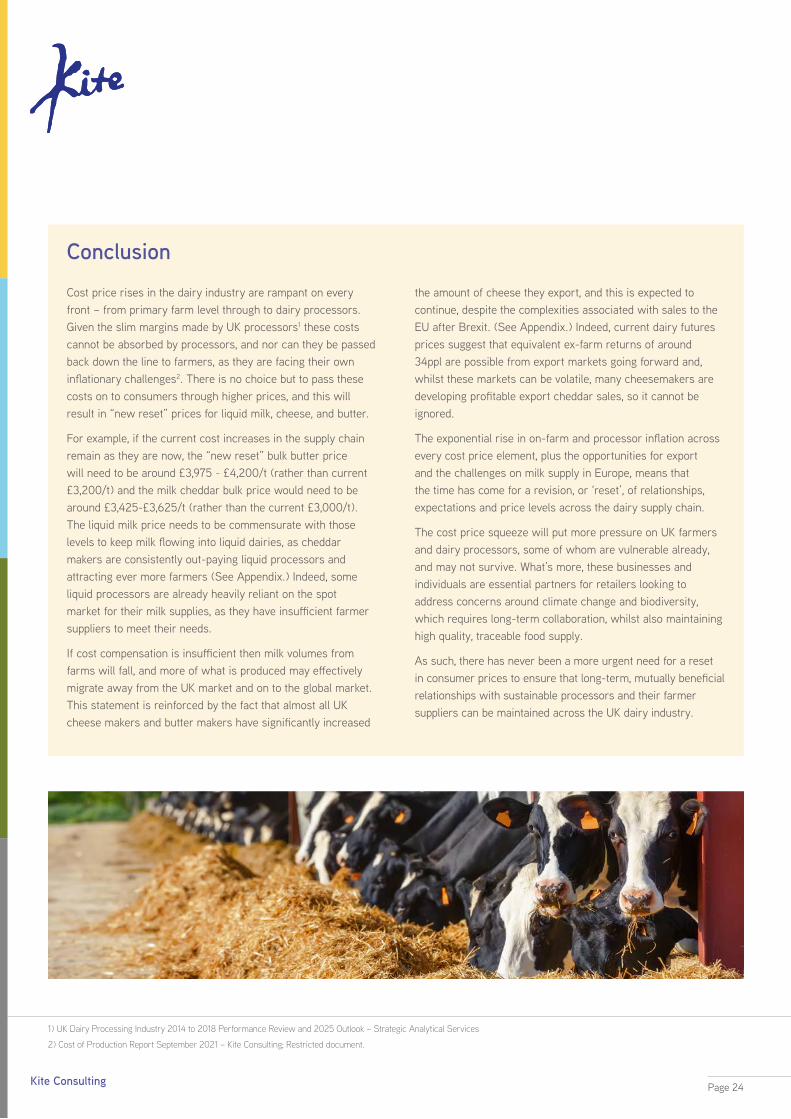
Cost price rises in the dairy industry are rampant on every front – from primary farm level through to dairy processors. Given the slim margins made by UK processors1 these costs cannot be absorbed by processors, and nor can they be passed back down the line to farmers, as they are facing their own inflationary challenges2. There is no choice but to pass these costs on to consumers through higher prices, and this will result in “new reset” prices for liquid milk, cheese, and butter.
For example, if the current cost increases in the supply chain remain as they are now, the “new reset” bulk butter price will need to be around £3,975 - £4,200/t (rather than current £3,200/t) and the milk cheddar bulk price would need to be around £3,425-£3,625/t (rather than the current £3,000/t). The liquid milk price needs to be commensurate with those levels to keep milk flowing into liquid dairies, as cheddar makers are consistently out-paying liquid processors and attracting ever more farmers (See Appendix.) Indeed, some liquid processors are already heavily reliant on the spot market for their milk supplies, as they have insufficient farmer suppliers to meet their needs.
If cost compensation is insufficient then milk volumes from farms will fall, and more of what is produced may effectively migrate away from the UK market and on to the global market. This statement is reinforced by the fact that almost all UK cheese makers and butter makers have significantly increased
Conclusionthe amount of cheese they export, and this is expected to continue, despite the complexities associated with sales to the EU after Brexit. (See Appendix.) Indeed, current dairy futures prices suggest that equivalent ex-farm returns of around 34ppl are possible from export markets going forward and, whilst these markets can be volatile, many cheesemakers are developing profitable export cheddar sales, so it cannot be ignored.
The exponential rise in on-farm and processor inflation across every cost price element, plus the opportunities for export and the challenges on milk supply in Europe, means that the time has come for a revision, or ‘reset’, of relationships, expectations and price levels across the dairy supply chain.
The cost price squeeze will put more pressure on UK farmers and dairy processors, some of whom are vulnerable already, and may not survive. What’s more, these businesses and individuals are essential partners for retailers looking to address concerns around climate change and biodiversity, which requires long-term collaboration, whilst also maintaining high quality, traceable food supply.
As such, there has never been a more urgent need for a reset in consumer prices to ensure that long-term, mutually beneficial relationships with sustainable processors and their farmer suppliers can be maintained across the UK dairy industry.
1) UK Dairy Processing Industry 2014 to 2018 Performance Review and 2025 Outlook – Strategic Analytical Services
2) Cost of Production Report September 2021 – Kite Consulting; Restricted document.
Page 24Kite Consulting
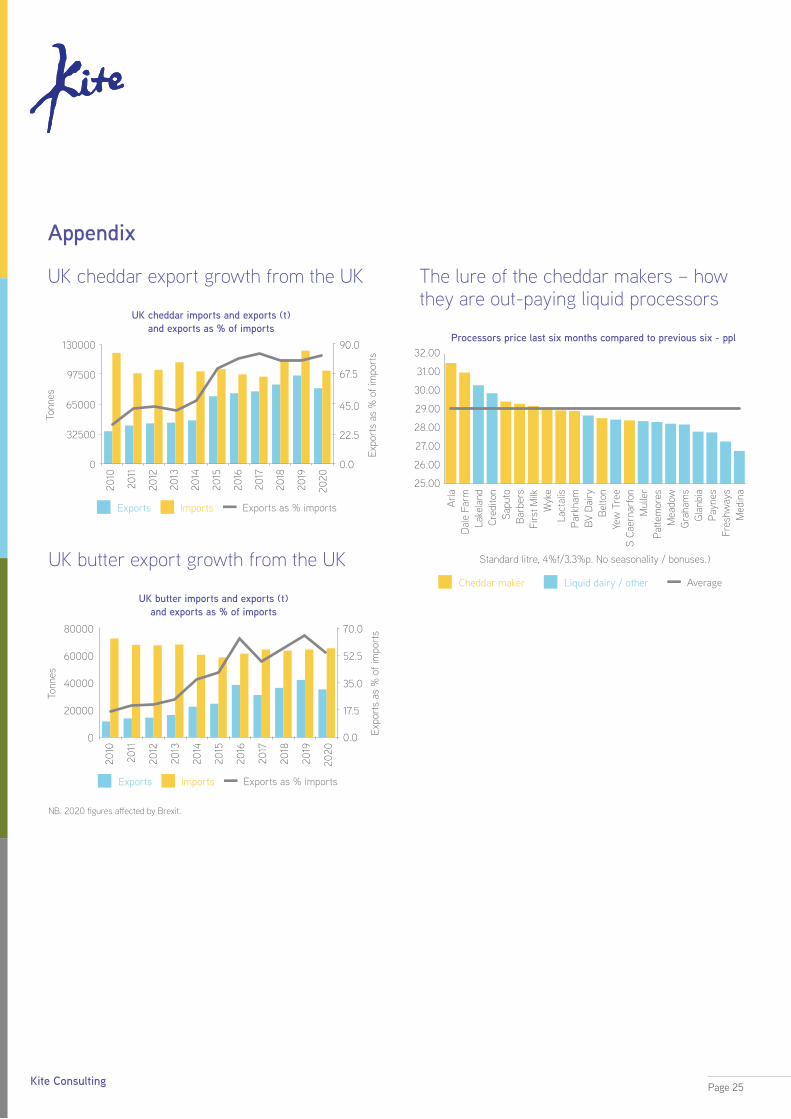
Appendix
UK cheddar export growth from the UK
UK cheddar imports and exports (t) and exports as % of imports
97500
130000 90.0
45.0
0.0
67.5
22.5
Tonn
es
Expo
rts
as %
of i
mpo
rts
32500
65000
0
2010
2017
2013
2020
2018
2015
2011
2014
2012
2019
2016
Exports Imports Exports as % imports
UK butter export growth from the UK
NB. 2020 figures affected by Brexit.
UK butter imports and exports (t) and exports as % of imports
60000
80000
20000
40000
0
2010
2018
2014
2012
2016
2011
2019
2015
2020
2013
2017
Exports Imports Exports as % imports
Tonn
es
Expo
rts
as %
of i
mpo
rts70.0
52.5
35.0
17.5
0.0
The lure of the cheddar makers – how they are out-paying liquid processors
Processors price last six months compared to previous six - ppl32.00
29.00
31.00
28.00
30.00
27.00
25.00
26.00Ar
la
BV D
airy
Barb
ers
Patte
mor
es
Sapu
to
Mul
ler
Park
ham
Payn
es
Med
ina
Lake
land
Yew
Tre
e
Wyk
e
Grah
ams
Dal
e Fa
rm
Belto
n
Firs
t Milk
Mea
dow
Cred
iton
S Ca
erna
rfon
Lact
alis
Glan
bia
Fres
hway
s
Standard litre, 4%f/3.3%p. No seasonality / bonuses.)
Liquid dairy / otherCheddar maker Average
Page 25Kite Consulting


