ADDENDUM REVISION (8/6/S) TO COVER PAGE NSF 83-67 PROPOSAL TO THE NATIONAL IENCE FOUNDATION Cer P FOR CONSIOERATION BY NSF ORGANIZATIONAL UNIT IS THIS PROPOSAL BEING SUBMIED TO ANOTHER (lndicat1 1 mo sific unit kn, i.1. pr1m, divisi, etc. I FEDERAL AGENCY1 YN _ No ; IF YES, LIST Biotic Systems and Resources: Ecosystem Studies PROGRAM ANNOUNCEMENT/LICITATION NO.: Tn"a-T�rm Ecolnoical Research Ren-al ACRONYM ISi: l cLos1NG DATE IIF ANYI: ADril 10. 1987 NAME OF SUBMIING ORGANIZATION TO WHICH AWARD SHOULD BE MADE IINCLUOE BRANCH/CAMPU:/UTHER COMNENTS) Regents, University of nnesota ADDRESS OF ORGANIZATION IINCLUDE ZIP CODE) Office of Research Adnistration, 1919 University Avenue, St. Paul, 55114 TITLE OF PROSED _PROJECT Succession, Productivity and nacs in Temperate xed Ecosysts _in Minnesota REQUESTED AMOUNT l 'ROPOSED DURATION I OE � IAEO STARTING DATE $1,475,000 Four Years January 16, 1qa7 t/PO DEPARTMENT Pl/PD ORGANIZATION Pl/PD PHONE NO. Department of Ecology and University of Minnesota 612-373-2788 Behavioral Biology Pl/PD NAME CIAL SECURITY NO.• SIGNATURE MALE" FEMA• G. David Tiln X ADDITIONAL Pl/PO ADOITIONAL PlO AODITIONAL Pl/PO AODITIONAL Pl/PD FOR RENEWAL OR CONTINUING AWARD REQUEST, SUBMITTING ORGANIZATION IS: 0 r-Profit Ornization; LIST PREVIOUS AWARD NO.: 0 Small Busin; 0 Minori Bu1in; 0 Wen-Owned 1in1•; (e cowr p instrtis, Pa 3) 'Subminion of cial urity num-• ia volunt■rY ■nd will not ■fft the org1ni1■tion•1+1alblll fw ■n ■w■rd. Ho-•. th■v •••- int■gral pan of th■ NSF information svn■m ■nd _,_ In prl thl prapo l. SSN lioit undw NSF Act of 1950, H ■nd. CHECK APPROPRIATE BOX(ESI IF THIS PROPOSAL INCLUDES ANY OF THE ITEMS LISTED BELOW: □ Anim Welfare □ Human bʦ □ Natial Environmental Poli Act □ Endanred cies □ Mari Mammal Proteion □ Rear Invving Rembinant DNA Molules □ Historical t □ Polluti ntrol □ Propriery and Priviled Informati PRINCIPAL INYESTIGATO OTHER ENDORSEMENT PROJECT DIRECTOR AUTHORIZED ORGIZATIAL REP. (iot NAME NAME NAME G. David Tian A. R. Potand Edward J. Cushi �� SIGNATURE SIG � � TITLE Prof_essor , TIT L E Director, Office of TIT L E Professor an Head, Dept. of Ecology and Research Adnistration Dept. of Ecology and Raaoral Biolo2v Behavioral Biolo�v DATE TELEPHONE NO. DATE TELEPHONE NO. DATE TELEPHONE NO. 3/25/86 Area Co: 612 Area Ce: 3/25/8 Area : 612 373-2788 373-5177 r--------,-- .............. -----1-------~- ---------+--------r-- __ _._..,_ ____ _
Transcript
ADDENDUM REVISION (8/6/83) TO COVER PAGE .. NSF 83-67
PROPOSAL TO THE NATIONAL SCIENCE FOUNDATION Cover Page
FOR CONSIOERATION BY NSF ORGANIZATIONAL UNIT IS THIS PROPOSAL BEING SUBMITTED TO ANOTHER (lndicat1 th1 molt spe,;ific unit known, i.1. prao,1m, division, etc. I FEDERAL AGENCY1 YN _ No ..x_ ; IF YES, LIST
Biotic Systems and Resources: Ecosystem Studies
PROGRAM ANNOUNCEMENT/SOLICITATION NO.:
Tn"a-T�rm Ecolnoical Research Ren-al
ACRONYM ISi:
lcLos1NG DATE IIF ANYI: ADril 10. 1987
NAME OF SUBMITTING ORGANIZATION TO WHICH AWARD SHOULD BE MADE IINCLUOE BRANCH/CAMPU:./UTHER COMPONENTS)
Regents, University of Minnesota ADDRESS OF ORGANIZATION IINCLUDE ZIP CODE)
Office of Research Administration, 1919 University Avenue, St. Paul, MN 55114
TITLE OF PROPOSED _PROJECT Succession, Productivity and Dynamics in Temperate Mixed Ecosystems _in Minnesota
REQUESTED AMOUNT l'ROPOSED DURATION
IOE�IAEO STARTING DATE
$1,475,000 Four Years January 16, 1qa7
P't/PO DEPARTMENT Pl/PD ORGANIZATION Pl/PD PHONE NO.
Department of Ecology and University of Minnesota 612-373-2788Behavioral Biology
Pl/PD NAME SOCIAL SECURITY NO.• SIGNATURE MALE" FEMALE•
G. David Tilman X
ADDITIONAL Pl/PO
ADOITIONAL Pl/PO
AODITIONAL Pl/PO
AODITIONAL Pl/PD
FOR RENEWAL OR CONTINUING AWARD REQUEST, SUBMITTING ORGANIZATION IS: 0 For-Profit Organization; LIST PREVIOUS AWARD NO.: 0 Small Business; 0 Minority Bu1ineu;
0 Women-Owned Bu1in1•; (See cowr page instructions, Paga 3) 'Subminion of social tee:urity num-• ia volunt■rY ■nd will not ■ff.ct the org1ni1■tion•1111alblllty fw ■n ■w■rd. Ho-•. th■v •••-int■gral pan of th■ NSF information svn■m ■nd _,_. In procMal"11 thl prapo .. l. SSN solioitld undw NSF Act of 1950, H am■ndld. CHECK APPROPRIATE BOX(ESI IF THIS PROPOSAL INCLUDES ANY OF THE ITEMS LISTED BELOW:
□ Animal Welfare □ Human Subjects □ National Environmental Policy Act
□ Endangered Species □ Marine Mammal Protection □ Research Involving Recombinant DNAMolecules
□ Historical Sites □ Pollution Control □ Proprietary and Privileged Information
PRINCIPAL INYESTIGATOII/ OTHER ENDORSEMENT PROJECT DIRECTOR AUTHORIZED ORGANIZATIONAL REP. (optioNllt
NAME NAME NAME G. David Tilman A. R. Potand Edward J. Cushing
7i�� SIGNATURE SIG
��
TITLE Prof_essor , TITLE Director, Office of TITLE Professor anl! Head, Dept. of Ecology and Research Administration Dept. of Ecology and Ral,,a.vioral Biolo2v Behavioral Biolo�v DATE TELEPHONE NO. DATE TELEPHONE NO. DATE TELEPHONE NO. 3/25/86
FOR NSF USE ONLY DIRECTORATE/OtVISION l?AOGFl:AM OR SECTION
~AME OF INSTITUTION (INCLUDE BRANCr-4.'CA~PUS ANO SCHOOL OR OlVISION)
Department of Ecology and Behavioral Biology University of Minnesota
AOOAESS (INCL.UDE DEPARTMENT)
Department of Ecology and Behavioral Biology 108 Zoology Building 318 Church Street SE Minneapolis, MN 55455
PRINCIPAL. INVESTlGATOR(S)
G, David Tilman
TITLE OF PROJECT
IF y
Succession, Productivity and Dynamics in Temperate Mixed Ecosystems in Minnesota TECl"'INICAL ABST~ACT !LIMIT TC 22 PICA OR 18 ELITE TYPEWRITTEN LINESI .
The Cedar Creek LTER project has established and sampled over 1100 permanent exper:lmental plots and 2300 permanent observational plots. The exper:lments are motivated by the belief that major advances in ecological understanding require a synthesis of ''micro" studies of the direct and indirect mechanisms of population interactions with ''macro" studies of ecosystem processes and feedback effects. Our research focuses on secondary succession because it is a long-term process that results from numerous direct, indirect, and feedback effects.
Our exper:lments, most replicated in four different successional fields, include ( 1) addition of various nutrients one at a time to determine which limit production; (2) addition of the major limiting soil resource, nitrogen, at various rates to establish exper:lmental productivity gradients on natural vegetation within herbivore exclosures; (3) similar productivity gradients, except with herbivores present; (4) similar productivity gradients, except on newly disturbed soil; (5) different fire frequencies in large blocks of native oak savanna; (6) different fire frequencies in a 25 yr old field; (7) studies of rates of litter production, accumulation and decomposition; (8) in situ rates of nitrogen mineralization, leaching loss, and atmospheric input; (9) greenhouse and field studies of the nitrogen and light limited growth of major pr:lmary producer species; (10) selective removal of various herbivore guilds nested within large-scale exper:lmental productivity gradients,
Our combj.nation of long-term experimental and observational studies is providing the data needed to test numerous hypotheses concerning succession and ecosystem structure. Our experiments have already suggested that the usual short-term ecological field experiment may give results that can be the exact opposite of the long-term effect of the manipulation.
NSF Form4 11.a31
Title Page .................................................................................. i
Project Sunnnary ................................................................................................................. ii
Table of Contents ........................................................................................................... iii
I. Results from Prior NSF Support .................................................................................. v
II. Project Description ................................................................................................... 1
A. Introduction ....................................................................................................... 1
B. The Cedar Creek LTER Research Program ................................................................... 7
Microplot Results to Date ................................................................................ 22
Species Richness ........................................................................................ 22 Her bi very ........................................................................................................ 23 Transient Dynamics .................................................................................... 24 Convergence, Divergence and Multiple Stable Equilibria ................ 25 Landscape Patterns versus Microplot Experimental Results •••••••••••••• 28 Litter Dynamics ............................................................................................. 29 Litter Feedback Effects on Vegetation ........................................................... 31 Dynamics of Below and Above Ground Production ........................................... 32
(Lynch 1978; Tilman 1983; Brown et al. 1986; Sterner 1986) studies. For instance,
consider two herbivore species that directly compete with each other because both consume
the same two plant species (Fig. 1A). The total effect of the herbivores on each other
can switch from "competition" to ''mutualism" as the intensity of the competition between
the two plants increases. The interaction can behave as a "mutualism" if an increase in
the density of Herbivore 1 decreases its preferred resource, Plant 1. This frees Plant 2
from competition, causing it to increase, and thus favor Herbivore 2, which feeds
preferentially on Plant 2. Thus, the total effect of one species on another depends on
both direct and indirect effects. If we are to achieve a mechanistic, potentially
predictive understanding of the functioning of natural ecosystems, we must integrate the
mechanisms of interspecific interactions into the framework of the entire ecosystem.
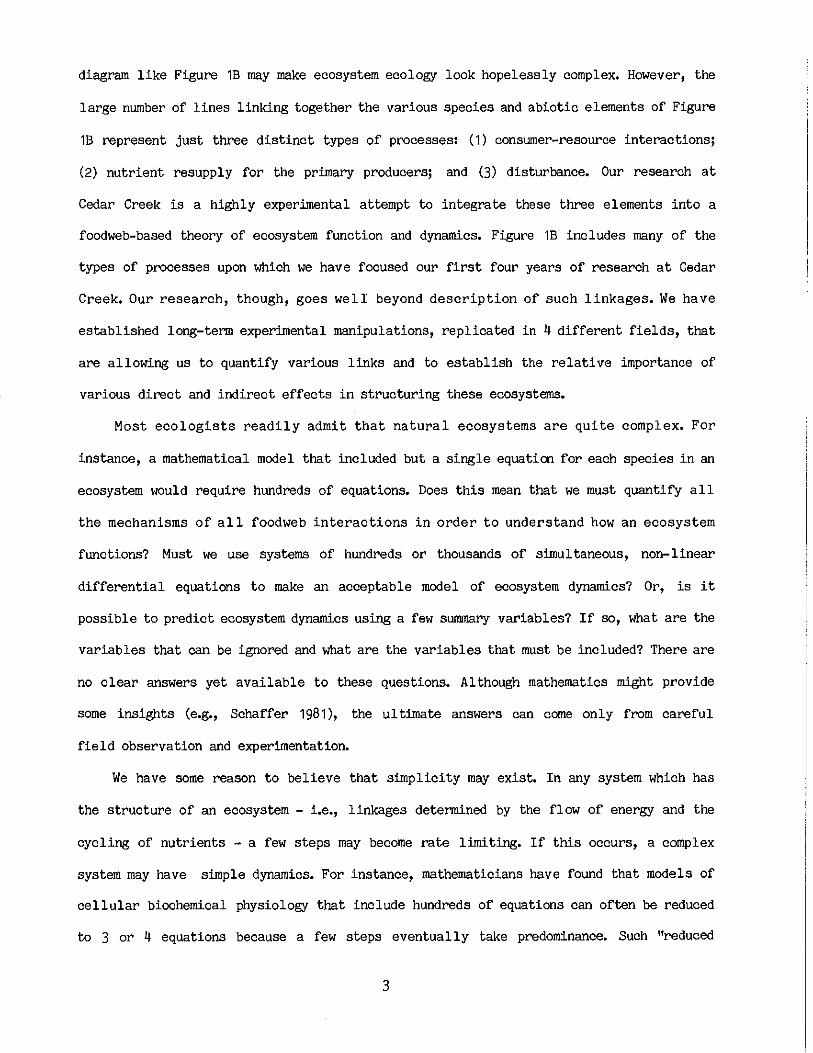
In an ecosystem there are numerous ways in which one species can indirectly affect
another species. Consider, for instance, a diagram of some of the major foodweb and
environmental linkages for an old field at Cedar Creek Natural History Area, Minnesota
(Fig. 1B). Every line shows a direct mechanism of interaction. However, the total effect
of one species on another can be understood only when both direct effects and various
indirect effects (all of the possible feedback loops) are considered. At first sight, a
2
Herbivore 1 Herbivore 2
Figure 1A, Although Herbivore 1 and 2 directly compete for food, the total effect of Herbivore 1 on Herbivore 2, and vice versa, can be positive (i.e. mutual is tic) because of indirect effects mediated through plant competition (see Vandermeer 1980).
Peromyscus
Figure 1B, A greatly simplified diagram of foodweb linkages in a Cedar Creek old field, The Cedar Creek LTER project includes studies of all the processes indicated by the arrows linking the boxes.
diagram like Figure 1B may make ecosystem ecology look hopelessly complex. However, the
large number of lines linking together the various species and abiotic elements of Figure
1B represent just three distinct types of processes: (1) consumer-resource interactions;
(2) nutrient resupply for the primary producers; and (3) disturbance. Our research at
Cedar Creek is a highly experimental attempt to integrate these three elements into a
foodweb-based theory of ecosystem function and dynamics. Figure 1B includes many of the
types of processes upon which we have focused our first four years of research at Cedar
Creek. Our research, though, goes well beyond description of such linkages. We have
established long-term experimental manipulations, replicated in 4 different fields, that
are allowing us to quantify various links and to establish the relative importance of
various direct and indirect effects in structuring these ecosystems,
Most ecologists readily admit that natural ecosystems are quite complex. For
instance, a mathematical model that included but a single equation for each species in an
ecosystem would require hundreds of equations. Does this mean that we must quantify all
the mechanisms of all foodweb interactions in order to understand how an ecosystem
functions? Must we use systems of hundreds or thousands of simultaneous, non-linear
differential equations to make an acceptable model of ecosystem dynamics? Or, is it
possible to predict ecosystem dynamics using a few swmnary variables? If so, what are the
variables that can be ignored and what are the variables that must be included? There are
no clear answers yet available to these questions. Although mathematics might provide
some insights (e.g., Schaffer 1981), the ultimate answers can come only from careful
field observation and experimentation.
We have some reason to believe that simplicity may exist. In any system which has
the structure of an ecosystem - i.e., linkages determined by the flow of energy and the
cycling of nutrients - a few steps may become rate limiting. If this occurs, a complex
system may have simple dynamics, For instance, mathematicians have found that models of
cellular biochemical physiology that include hundreds of equations can often be reduced
to 3 or 4 equations because a few steps eventually take predominance. Such "reduced
3
dimensionality" (Schaffer 1981) may lead to the major, predictable elements of ecosystem
dynamics, whereas the rest of ecosystem dynamics may remain forever in the realm of
unexplainable noise. The only way to determine if this is so is through experimentation.
By exploring, experimentally, the importance for succession of a variety of potentially
important processes, we should be able to determine to what extent the complexity of
nature can be simplified. Although our work stresses the possible importance of
complexity, ultimately we are seeking simplicity, if it exists.
The LTER research that we have already initiated, and the extensions that we propose
for the next four years, will help provide a synthesis of what have all too often been
disparate views of the natural world. Evolutionary ecology, population ecology, community
ecology and ecosystem ecology represent different perspectives that we take in trying to
understand the patterns we see in the natural world. Each of these is a simplification -
an attempt to hold most elements constant so that the importance of one or a few
elements can be rigorously explored. Ultimately,' however, these approaches must be
compatible. Organisms do not live in four separate worlds, eaoh governed by the different
perspectives of evolution, population, community or ecosystem ecology. Ecology has
reached the point where a sufficient amount is known about each of these areas that
syntheses must now be attempted. Population ecology can be greatly strengthened by
consideration of the long-term effects, the indirect effects and the feedback effects
that the ecosystem approach emphasizes. Similarly, ecosystem ecology can be strengthened
by detailed studies of the dynamics of interactions among the indi victual species that
play such a key role in the processes of productivity, energy flow and nutrient cycling.
We believe that such a synthesis wil 1 only be possible if long-term research combines
population, community and ecosystem perspectives.
This synthesis will require a marriage of what Orians (1980) has called the micro
and macro approaches in ecology. Orians (1980) stated: "We have been slow to develop
better ways of integrating the two areas because, until very recently, we had little
4
microecology worth using as building blocks for imaginative macroecological models. This
is no longer true, and much is to be done." The research program that we have established
at Cedar Creek includes long-term studies of both large-scale and small scale
unmanipulated and manipulated plots. Our large plots, which we call our "macroplots,"
are providing information on whole system responses to manipulations and to natural
environmental change. The small scale plots, our "microplots," are providing detailed
experimental information on the direct effects of various underlying processes,
especially plant competition for resources (mainly nitrogen and light), plant-herbivore
interactions, nutrient resupply processes, and biotical ly-caused disturbance. One way
that we are analyzing and synthesizing our results is through the use of a theory of
Because this theory incorporates the direct mechanisms of consumer-resource (i.e., inter
trophic level) interactions, it is easily expanded to include the various foodweb links
shown in Figure 1B. This theory can easily incorporate spatial and temporal variability,
species' differences in above and below ground allocation of production, and disturbances
such as fire or gopher mound production, However, we must point out that we are using
such theory to develop a mechanistic understanding of the direct and indirect effects
that are of major importance in structuring these old field ecosystems. Thus, we
continually apply Ockham's Razor - asking, through our experimental and observational
studies, if each element added to the model can, indeed, explain a significantly greater
portion of the observed variance, We do this because it is a trivial matter to observe
potentially complex interactions in nature - but much more difficult to demonstrate that
they are of importance. Our field needs the simplest theoretical approach that can
actually predict the dynamics of natural and perturbed ecosystems, We are sure that such
models will be more complex than classical population models -- and hope they will be
simpler than most current ecosystem models.
Our research is being performed within the context of the natural secondary
successional sequence that occurs at Cedar Creek Natural History Area. (See Appendix B
5
for a description of Cedar Creek,) We believe that a long-term, detailed, experimental
study of succession is an ideal framework within which a synthesis of population and
ecosystem approaches can develop. Succession is a long-term process that results from
numerous short-term changes. Succession is likely to result from both direct and indirect
effects. It is impossible to divorce succession from a consideration of plant life
history characteristics, from the population processes of competition and herbivory, or
from the ecosystem processes of soil development, decomposition, nutrient cycling, and
disturbance. The patterns and causes of the process of succession are the major theme
unifying the work that we propose. Our experiments and detailed observations are designed
to provide a multi-faceted view of succession from evolutionary, population, community
and ecosystem perspectives. We will explore in especially great depth any areas for which
these different perspectives seem to make conflicting predictions, for it is in these
areas that we are likely to find the greatest opportunities for new syntheses.
Al though succession has long been of interest to ecologists (e.g., Cowles 1899;
Cooper 1913; Clements 1916; Gleason 1917), there is still considerable disagreement as to
which processes are most important in controlling the dynamics of ecosystem components
and population densities following disturbance (e.g., Connell and Slatyer 1977; Peet and
Christensen 1980; McIntosh 1981; Horn 1981; Tilman 1984). There are comparable
disagreements as to the importance of physical and biotic processes in determining the
spatial variation in species composition and diversity within undisturbed habitats. These
disagreements may partially result from the unique features and past history of
particular habitats, but a larger problem is the paucity of field experiments, especially
long-term experiments. Only experimentation can distinguish mere correlates of observed
patterns from causes. However, because of the multiple paths of causation, the different
response times of these paths, and.the long life spans of many organisms, it is
imperative that such experiments be allowed to proceed for a long time. For instance,
dynamic models of ecosystem change predict that it can take foresfs 100 or more years to
6
come to a new equilibrium after a 2°c reduction in mean annual temperature (Davis and
Botkin 1985; Davis 1986). Although a 100 year experiment is hard to imagine, the Park
Grass Experiments in Rothamsted, England, are now in their 132nd year, and have become of
increasingly greater value with each sampling period (e.g., Lawes and Gilbert 1882;
Brenchley 1924; Brenchley and Warington 1958; Tilman 1982).
Because the life spans of most primary producers in the secondary successional
sequence at Cedar Creek are much shorter than those of forest canopy trees, we should
observe a more rapid response to natural disturbances or experimental manipulations than
suggested by Davis and Botkin (1985) for forests. However, even for herbaceous
vegetation, dynamic models predict that it can take 10 to 15 years for the vegetation to
attain a new equilibrium after a disturbance or a major change in the supply rate of a
limiting resource (Tilman 1985, 1986a). More importantly, these models predict that
during the first 5 years, much of the observed response to a disturbance or experimental
manipulation can be a transient response determined more by differences in the maximal
growth rates of species than by the long-term outcome of their various pathways of
interaction. This theory predicts that, at least in successional vegetation, such
transient responses are often the opposite of the true long-term effect of the
experiment. To understand how ecosystems are structured and to make intelligent decisions
concerning ecosystem management, will require that we understand the causes of both their
short-term and their long-term dynamic responses to perturbations.
B. THE CEDAR CREEK LTER RESEARCH PROGRAM
1. Objectives
The main purpose of our project is to understand the various direct and indirect
ecosystem and population processes that cause secondary succession. The processes we have
focused on are (1) the dynamics and control of soil nutrient cycles and availability,
especially for nitrogen; (2) the pattern of disturbance and the effects of disturbance on
succession; (3) the mechanisms of plant competition for soil resources and light; (4) the
7
direct effects of herbivore feeding on plants; and (5) various indirect effects of
herbivores, such as through disturbance or soil modification. Figure 1B, which
schematically illustrates the major foodweb linkages that we are exploring, shows that we
are concentrating our efforts on the decomposer, the primary producer and the herbivore
trophic levels, and on interactions within and among these levels. Al though it is not
always feasible, to the greatest extent possible we are quantifying the responses of each
species in our experimental and observational plots. Al though this entails much more
effort than lumping species by functional groups, this information is critical if we are
to achieve a synthesis of evolutionary, population and ecosystem perspectives.
We are focusing our study on various interactions within and among the decomposer,
primary producer and herbivore levels because each of these may be an important
determinant of succession. Numerous studies of succession have reported correlations
between plant abundances and the availability of various resources, especially soil
nitrogen. These correlations have been strongest for cases of primary succession (Crocker
and Major 1955; Lawrence 1958; Olson 1958; Walker et al. 1981) and secondary succession
on poor soils (Rice et al. 1960; Odum 1960; Inouye et al. 1986). Such observations have
led to one view of succession, that it is caused by a gradient through time in soil
nutrient availability (e.g., Drury and Nisbet 1973; Tilman 1982). The most recent
extension of these ideas is the resource ratio hypothesis of succession (Tilman 1985),
Similarly, several studies have suggested that much of the point-to-point spatial
heterogeneity in vegetation composition might be understood as change along gradients in
various physical or biotic factors (e.g., Zedler and Zedler 1969; Harper 1969; Whittaker
and Niering 1975; Tilman 1984). Although these observations and theory (Tilman 1980,
1982, 1985) suggest that both successional patterns and local spatial heterogeneity may
be explained as resulting from plant differentiation along temporal or spatial gradients,
there have been no direct experimental tests of these ideas.
If this view is found to have merit, though, it would provide but a partial
explanation of succession. A full explanation of succession must also include the various
8
processes that cause the temporal gradient in soil characteristics, Why is it that,
starting with a bare, mineral substrate, soil organic matter and nitrogen tend to
increase for a period of from 100 to 200 years (i.e., Crocker and Majors 1955; Olson
1957)? Why do comparable changes occur during secondary succession on nitrogen poor soils
(Rice et al 1960; Odum 1960; Inouye et al. 1986 )? Are the often cited patterns of "soil
development" during the first few hundred years of primary succession or secondary
succession merely an initial stage of longer-term soil dynamics, as is suggested by the
Walker et al. (1981) study of soils and vegetation in the sand dunes of eastern
Australia? Although short-term experiments (Abul-Fatih and Bazzaz 1979; Hils and VanKat
1982) lead to the clear rejection of Clement's "facilitation hypothesis" of succession,
might long-term studies reveal an element of "facilitation" in succession? If so, we must
be sure that it can be explained within the current framework of evolution by natural
selection. If it cannot be, then we must explore all the underlying assumptions of both
the evolutionary and ecosystem perspectives to seek a resolution,
It has long been thought that herbivores could have a great effect on succession
(e.g., Moore 1933; Summerhayes 1941; Tansley 1949; Connell and Slatyer 1977; Tilman
1983; Inouye et al 1986; Sterner 1986). In England, for example, areas open to sheep or
cattle grazing remain grasslands whereas areas from which these herbivores are excluded
often become forest (Grubb 1986). However, it is not known what aspects of herbivory
(i.e., selective feeding, local disturbance, nutrient cycling, etc,) actually cause the
observed effects or if herbivores would be important at their natural densities in
unmanaged ecosystems. To understand the role of herbivores at their natural densities
during succession will require long-term experimental and observational studies of both
their direct and indirect effects. We are performing such studies at Cedar Creek,
2. Approach
Our study of the mechanisms controlling secondary succession uses broad-scale,
comparative studies of ecosystem patterns, long-term experimental manipulations, and
9
shorter-term studies of various underlying mechanisms and processes, During the past four
years doing our research, we have established the following permanent field plots:
(1) 2300 observational quadrats (distributed among 22 old fields) to provide detailed information on spatial variation within and among old fields and to document long-term changes in natural vegetation,
(2) 33 experimental 20m x 50 m plots to determine the long-term, interactive effects of herbivores and primary productivity (manipulated with N addition) on ecosystem dynamics.
(3) 162 experimental 4m x 4m plots to determine the joint effects of disturbance ( via discing) and primary production (manipulated through N addition) on succession in the absence of herbivores,
(4) 207 experimental 4m x 4m plots to determine the effects of nitrogen addition on succession in the absence of disturbance and herbivory,
(5) 162 experimental 4m x 4m plots to determine herbivore microhabitat choice and the effects of herbivores on the dynamics of succession,
(6) 168 herbivore removal experimental plots to determine the long-term effects of exclusions of various herbivore species or functional groups and how these effects depend on the rate of primary productivity.
(7) 24 experimental 8m x8m plots to determine the effects of different fire frequencies on secondary successional plant dynamics and soil development.
(8) 288 sampling sites (24 sites in each of 12 compartments) in native oak savanna stands that have been subject to different fire frequencies for the past 20 years.
(9) 48 experimental 4m x 4m plots to determine the joint effects of soil pH (experimentally manipulated) and nitrogen (experimentally manipulated) on the dynamics of nitrifying bacteria, litter decay, nitrogen cycling and plant dynamics,
(10) 12 10m x 30m deer exclosures and controls in two early successional fields to determine effects of deer browsing on old field succession,
In addition to the above on-going experimental and observational studies, we have
performed a variety of short-term observational and experimental studies on a variety of
ecosystem and population processes, including: (1) rates of nitrogen mineralization; (2)
rates of litter decay; (3) rates of atmospheric nitrogen inputs and soil leaching losses
of nitrogen in fields of different successional ages; (4) rates of nitrogen fixation by
associative bacteria; (5) greenhouse studies of nitrogen and light limited growth of
major plant species; (6) gopher feeding preference studies; (7) gopher habitat use
patterns; (8) grasshopper habitat use; and (9) seasonal patterns of below-ground and
1 0
above-ground primary production in an old field chronosequence.
The research proposed for the next four years of the Cedar Creek LTER project is
described in the remainder of this document. About 2/3 of the research represents a
continuation of the detailed, long-term experimental and observational studies that we
have already initiated. The remainder of our proposed research is equally divided between
efforts at intersite and theoretical syntheses and detailed, shorter-term studies of the
factors controlling processes such as litter dynamics, soil spatial heterogeneity, carbon
and nitrogen interactions in soils and local disturbance frequencies. We want to stress
that the vast majority of our studies were designed to be long-term studies. We have
invested considerable energy in initiating a uniquely thorough series of experiments that
may not give us their greatest payback for another 5 or 10 years. We have been willing to
make these investments because we believe that such long-term experiments are the only
way in which we can answer fundamental ecological questions.
3. The Five Core Topics for L'.l'ER Projects: In addressing our central research questions,
we established a sufficiently broad research program that it addressed, in considerable
detail, all five of the core research topics that were specified by the National Science
Foundation as being unifying elements among all the LTER sites. Table 1 lists these five
core topics and, for each topic, names the Cedar Creek experiments that contribute to
each area. The names used to describe each experiment are the same as those used in the
remainder of this grant proposal. Although we feel that these five core areas are
important in establishing a common ground among the LTER sites and in assuring that the
research at each site takes a broad, ecosystem-oriented approach, the five core areas, by
themselves, do not specify the major hypotheses that are likely to motivate any given
research project. Because we wish to discuss how our research addresses the specific
research questions we have raised above, we will not discuss in detail greater than that
given in Table 1 how our work relates each of the five core areas.
C. OLD FIELD SUCCESSIONAL C!Il!ONOSEQUENCE
At the time of European settlement in the 188o•s, most upland areas of Cedar Creek
1 1
TABLE 1. SlJ!t,IARY OF CEDAR CREEK RESEARCH IN THE FIVE CORE AREAS
Topic 1: Pattern and Control of' Primary Production
A. Old Field Successional Chronosequence (within and between field comparisons of standing crop and soil nutrients in 2300 permanent quadrats).
B. Nitrogen-Gradient Microplot Experiments (year-by-year information on primary production in 36 control plots in each field; role of nitrogen in primary production; replicates with and without mammalian herbivores).
C, Seasonal Productivity Patterns (biweekly sampling of above ground biomass to species throughout the growing season).
D. Macroplot Nitrogen Gradient Experiments (standing crop and plant species abundances at various nitrogen levels; effects of grasshoppers, other insects and various small mammal functional classes on productivity).
E, Long-Term Monoculture Experiments (monocultures of the five major primary producer species, with each monoculture replicated on 10 different soil types in the field; within season and year-to-year dynamics of production),
F. Dynamics of Below and Above Ground Production (biweekly samples of root biomass by depth and of above ground biomass in relation to soil nutrients and water availability).
Topic 2: Spatial and Temporal Distributions of' Selected Populations
A. Old Field Successional Chronosequence (spatial abundance patterns for major plant species; temporal patterns inferred from a chronosequence).
B. Macroplot Nitrogen Gradient Experiments (small mammal and grasshopper population densities in control and nitrogen addition plots).
C, Nitrogen-Gradient Microplot Experiments (dynamics of invasion and habitat use by small mammals on a grid of plots that differ in their rate of primary production) •
D. Nitrogen-Gradient Microplot Experiments (biweekly and year-to-year dynamics of major plant species).
E. Gopher Habitat Use (continuous recording of below ground habitat use by gophers).
F. Gopher Feeding Experiments (studies of gopher foraging in relation to plant density and plant tissue N levels).
Topic 3: Pattern and Control of' Organic Matter Accmnilation
A. Litter Dynamics (experimental study of litter decomposition and the influence of nitrogen availability on decomposition).
B. Oak Savanna Burn Experiments (survey of vegetation and soils, including litter and soil organic matter, in the 20th year of prescribed burning),
TABLE 1. (continued) c. Nitrogen Mineralization and Nitrification (interrelations of organic carbon,
total nitrogen and nitrogen mineralization).
D. Nitrogen-Gradient Microplot Experiments (annual and biweekly litter samples show dynamics of litter accumulation in relation to primary production).
E. Long-Term Monoculture Experiments (litter accumulation in monocultures of five dominant grass species grown on 10 different soil mixtures; litter quality feedback effects on nitrogen dynamics).
Topic 4: Patterns of Inorganic Inputs and Nutrient Movements
A. Macroplot Lysimeters (a total of 66 modified porous cup lysimeters provide periodic information on nitrogen loss from intact soil/vegetation cores in 22 control plots and 44 N addition plots).
B. Precipitation collectors (rainbuckets; wet/dry fall collectors; atmospheric nutrient inputs).
C. Nitrogen Mineralization and Nitrification (buried bag experiments throughout the growing season replicated in 4 fields),
D. N-15 Addition Experiments (N-15 injections to various soil depths at different times in growing season; N-15 accumulation in plants, soil fractions),
E. Nitrification and Soil pH (experimental plots to determine effects of soil pH on dynamics of ni trifying bacteria).
F. Long-Term Monoculture Experiments (changes in soil nutrients in response to plant growth; feedback effects of litter production by different species),
Topic 5: Patterns and Frequency of Disturbance
A. Old Field Successional Chronosequence (gopher mounds and other small scale disturbances in 22 old fields; relations between disturbance, field age and soil chemistry).
B. Windstorm Forest Disturbance (permanent quadrats on forested areas that suffered or did not suffer extreme adult tree mortality from a major wind storm; seedling and sapling survival patterns will be followed for next 10+ years),
C. Macroplot and Microplot Experiments (annual or more frequent surveys of smal 1-scale disturbance),
D, Oak Savanna Burn Experiments (20 years of burning native oak savanna vegetation at different frequencies).
E. Fire and Secondary Succession (replicated compartments burned at different frequencies).
contained an oak savanna - prairie vegetation. By about 1910, many of these areas had
been clearcut and cultivated (Pierce 1954). The well-sorted, excessively well-drained
fine sands of Cedar Creek were poor in nitrogen, and were further depleted by
agriculture. Starting in about 1930, farmers began abandoning fields from agriculture.
Secondary succession in these fields thus began under conditions of significant nitrogen
limitation. From 1930 to the present time, 78 different fields, ranging in size from 1 to
more than 40 ha, have been abandoned on the land that is now Cedar Creek Natural History
Area. Additional fields at Cedar Creek are still farmed so that they may be abandoned
over the next 50 years to provide Cedar Creek with a rich array of old fields for
comparative and experimental research.
At the start of our LTER research, we chose 22 of these 78 fields to form a
successional chronosequence. In each field we established 100 permanent 1.0m x 0.5m
quadrats (150 quadrats in Fields A and B). We collected a soil sample from the center of
each quadrat and estimated vegetative cover, to species, of all plants in each quadrat.
We also determined the abundances of several major herbivores in each field. In addition,
we recorded if a given sampling quadrat happened to fall on a recently disturbed area.
The results of this survey are described in detail in Inouye et al. (1986).
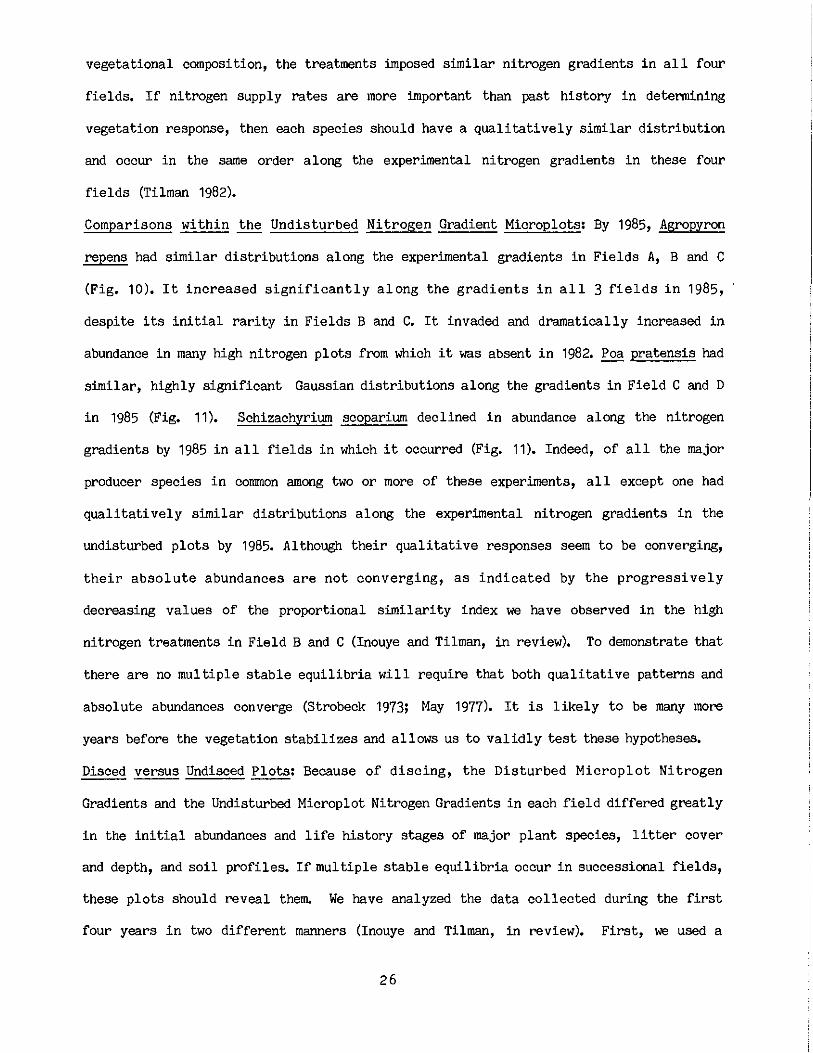
We found that total soil nitrogen increased significantly with field age (Fig. 2A),
and that total cover by vascular plants (Fig. 2B) and litter (Fig. 2C) increased
significantly with total soil nitrogen. Light penetration to the soil surface was
negatively correlated with total plant biomass. The total species richness of a field
(Fig. 2D) and the quadrat-to-quadrat heterogeneity in species composition within a field
increased significantly with field age. In contrast, the species richness of individual
quadrats decreased with increasing soil nitrogen. Thus, the greater species richness of
older fields was not caused by an increased number of species within small areas
(quadrats), but by increased quadrat-to-quadrat heterogeneity within older fields. This
greater vegetation heterogeneity corresponded with the greater spatial heterogeneity in
12
A. Soil Nitrogen B. Vascular Plants C. Litter ~ 900
70 60 I • • "' 60 ,!!
~ • Ill f 600 • II 50 • > 40
"' • > 40 8 .5 • • 8 • • • • -. .. • 30 " ~ 300 c • 1l 20 ~ 20 Ill • • r - 0.67** 0 • Ji ;f 10 a.
Average Field Nitrogen (mg/kg) Fleld Age (years) ,I: Average Flekt Nitrogen (ppm)
Figure 2. Relations among various parameters measured in the Old Field Successronal Chronosequence. Each point in each figure is an average over all samples (100 or 150) collected in a particular field. See Inouye et al. (1986) for further details.
900
900
nitrogen within older fields.
Cover of annual plants (Fig. 2E) and of species of European origin decreased
significantly with field age and nitrogen, but annuals still comprised more than 20% of
the vegetation of 25 year old fields. Cover of perennials (Fig, 2F) and of woody plants
(Fig. 2G) increased with field age and nitrogen, but woody plants were less than 15% of
total vegetative cover in even the oldest fields. Soil disturbances, most often caused by
the plains pocket gopher, Geomys bursarius, were most common in young fields and declined
significantly with field age and field nitrogen (Fig. 2 H and I). We also analyzed the
results of our observations in the 2300 permanent quadrats on a species-by-species basis,
for the 15 most abundant species during secondary succession (Fig. 3). These results have
shown that the abundance of each major plant species is strongly correlated with total
soil nitrogen. Each species seems to have a fairly individualistic, approximately
Gaussian distribution along the temporal nitrogen gradient of secondary succession. Early
successional species (Rumex acetosel la, Ambrosia artemisiifolia, Agrostis scabra, and
Hedeoma hispida) reach their peak abundance at low soil nitrogen, and decline in
abundance in more nitrogen-rich quadrats. These patterns hold both within indi victual
fields and among all fields, combined. Similarly, late successional species
(Schizachyrium scoparium, Sorghastrum nutans, Poa pratensis, and Artemisia ludoviciana)
reach their peak abundance at high soil nitrogen, both within individual fields and for
all fields combined (Fig. 3).
These patterns have led us to formulate a series of hypotheses concerning the forces
structuring these old field ecosystems. Much of our experimental and observational work
is testing these hypotheses. The major questions raised by our old-field survey are:
1. Is nitrogen the main soil resource limiting plant productivity in Cedar Creek old
fields and in native vegetation?
2. Is the rate of nitrogen mineralization in Cedar Creek soils proportional to total soil
nitrogen?
3. Is the apparent increase in soil nitrogen suggested by the old field survey really an
Figure 3. These figures show the dependence of plant abundance on soil nitrogen in the old field survey. ~•hese are based on all 2300 plant and soil samples. •ro obtain these curves, the observed total soil nitrogen levels were divided into 40 classes of equal size on a natural log scale. The average percent cover of each plant species was then calculated for all quadrats falling in each soil nitrogen interval. These averages were then smoothed once using running averages to get the figures above.
increase in nitrogen through time, or were the fields abandoned 50 years ago more
nitrogen rich than those abandoned recently?
The old field survey provided us with strong correlations, but correlations need not
be indicative of causation. If nitrogen does increase through time, we should be able to
detect these increases when we re-sample our 2200 permanent old field quadrats after a 7
year interval, The slope of the observed regression predicts that there should have been
an average increase of 6,8 ppm of N per year. After 7 years, this should thus give an
increase of almost 50 ppm of N. Because we have archived the dried soil samples we
originally collected, upon resampling these 2200 quadrats in 1990 we will be able to
directly calculate the differences in total soil nitrogen for each quadrat without having
to allow for any change that may have occurred in our chemical technique during that
interval.
4. Assuming that soil nitrogen does increase during secondary succession, what causes
this increase? Is it caused by nitrogen fixation by legumes, blue-green soil algae, or
various associative N-fixing bacteria in the rhizosphere? Or, is it caused by a slow
accumulation of fixed nitrogen that enters via wet and dry fall, and which is not lost
from the soil? To what extent can the accrual of soil nitrogen be explained by a simple
model of atmospheric inputs and atmospheric and soil leaching losses?
5, How do litter accumulation and decomposition influence soil change during succession?
Why does litter accumulate during succession? Do later successional species produce low
quality litter (high C:N ratios, high lignin content) that effectively causes soil
development to cease at a point at which those species are favored?
6. Is the observed sequence of plant species dominance during secondary succession at
Cedar Creek caused by changes in soil nitrogen and associated changes in light
interception?
a. If so, then each species should be a superior competitor at a particular rate of
nitrogen supply (Tilman 1982).
14
b. If so, then experimental changes in the rate of nitrogen supply should cause
species composition to change in a manner consistent with the patterns shown in Figure 3.
c. If so, then pairwise competition experiments should be consistent both with
species responses to experimental N gradients and with species distributional patterns
during succession (Fig. 3).
d. If so, the physiology, morphology, and growth allocation patterns of each species
should be consistent with its position of peak abundance along the temporal nitrogen
gradient of succession (Tilman 1982, 1985, 1986a).
7. Is the observed successional sequence at Cedar Creek caused by herbivory?
a. If so, then herbivore removal or addition experiments should lead to changes in
the plant connnunity composition. Specifically, the patterns we observed in our old field
survey predict that (1) removal of gophers should increase the rate of succession, since
gopher activity declined during succession in our old field survey; (2) gopher addition
should favor early successional plant species.
b. Alternatively, it may be that vegetation change, whatever its cause, is the cause
of changes in herbivore density during succession. Specifically, it may be that gopher
densities decline during succession because later successional plants are poorer foods
for gophers. If this is so, feeding trials should reveal that gophers feed preferentially
on early successional plants.
8. Is Cedar Creek succession determined by both direct and feedback effects involving
soils, plants and herbivores? If it is, the concept of cause and effect, itself, becomes
of limited utility and a systems approach would provide the only explanation for the
observed patterns.
9. Compared to many other ecosystems, herbivore densities are low in the low
productivity, nitrogen poor fields of Cedar Creek. Might herbivory be less important in
unproductive habitats, especially those with nitrogen-poor soils, because herbivores
would be protein-limited and kept to lower population densities than in more productive
ecosystems?
15
10. Do the short-term dynamic responses of ecosystems to disturbances differ from their
1 ong-term responses?
If transient effects are common, short-term experiments may give misleading
information on the true long-term role of various processes in structuring natural
communities. Only long-term observational and long-term experimental studies will be
able to determine which responses are transients and which are indicative of the long
term effects of a manipulation, However, if ecosystems do show transient effects,
experimental manipulations of ecosystems must be performed over sufficiently long periods
of time to observe both the transient and the long-term change in the ecosystem caused by
a given manipulation, If experiments are performed on too short a time scale, valid
hypothesis may be rejected and incorrect hypotheses may be supported, This is an
especially great danger because so many ecological hypotheses are qualitative statements
of the likely.long-term outcome of a process, not detailed, mechanistic models of short
term dynamics,
D. CEDAR CREEK LTER EXPERIMENTAL FIELLIS
From among the 22 fields forming the old field chronosequence, we chose four fields
in which to perform most experiments. Some work is also being done in a fifth field, We
are restricting our experiments to these five fields because we wish to obtain detailed
information on a variety of ecosystem processes, and their underlying mechanisms, in the
same localities so that we may directly compare them one to the other. The four fields
represent a successional gradient, from a 14 yr old field (Field A), to a 25 yr old
field (Field B), to a 48 yr old field (Field C) and finally to native oak savanna (Field
D). By replicating most of our long-term experiments in each of these four fields we are
able to determine if the effect of a process changes during succession and test a
variety of ideas concerning convergence, divergence and multiple stable equilibria, The
general characteristics of the five fields are given below.
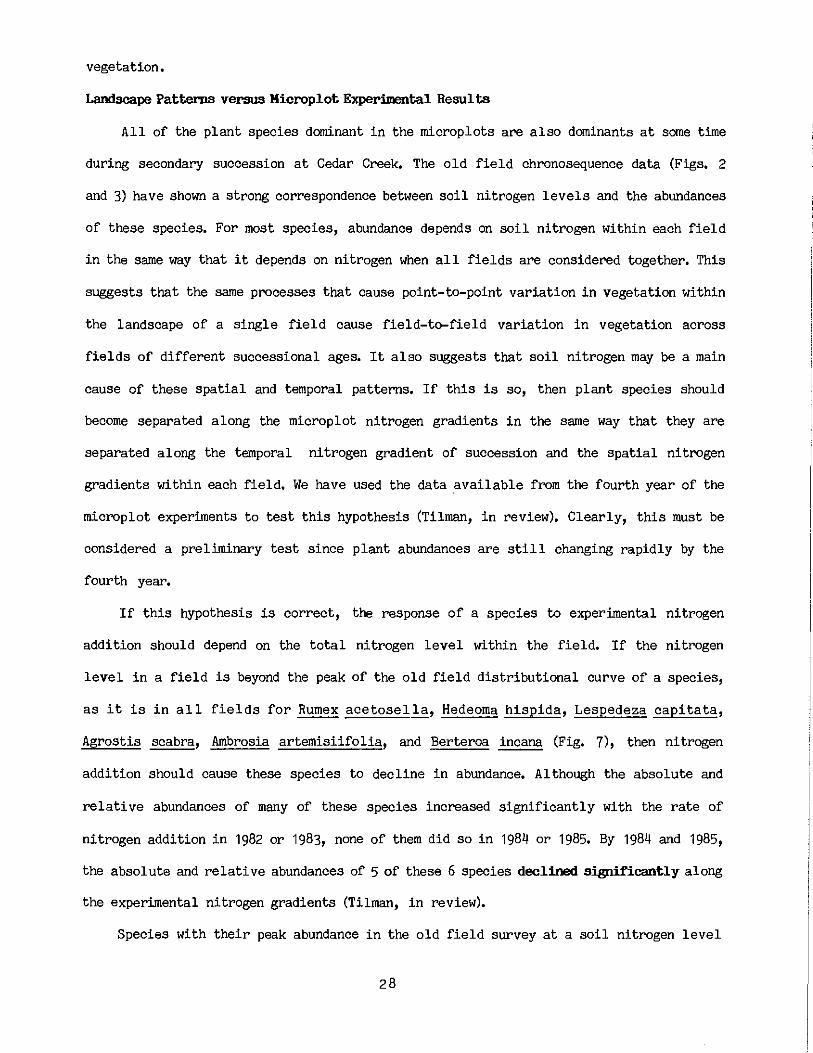
Field A (Fig. 4B) was last cultivated and planted, to soybeans, in 1968, It had been abandoned 14 years when this work began in 1982. It has a Sartell fine sand soil, an
16
A. B.
• ':,
c. D.
Figure 4.
excessively well-drained soil formed in sandy outwash and aeolian sediments (Grigal et al. 1974). The dominant species in Field A are Agropyron repens, Berteroa incana, Agrostis scabra, Achillea millefolium, Erigeron canadensis, Aristida basiramea, Ambrosia artemisiifolia, Poa pratensis, and Potentilla recta.
Field B was last farmed in 1957 (last crop: soybeans). It was 25 years old in 1982. It has a Zimmerman fine sand soil, similar to the Sartell sand except for a thicker B2t than the Sartell soil (Grigal et al. 1974). Its dominant plant species are Schizachyrium scoparium, Poa pratensis, Panicum oligosanthes, Lespedeza capitata, Cyperus filiculmis, Rosa arkansana, Solidago rigida, ands. nemoralis.
Field c, the oldest of the abandoned fields (Fig. 4A), was last farmed, to corn, in 1934. It was 48 years old in 1982. Its soil is a fine Zimmerman sand. Its dominant plants are Schizachyrium scoparium, Artemisia ludoviciana, Poa pratensis, Stipa spartea, Sorghastrum nutans, Solidago nemoralis, Aster azureus, Ambrosia coronopifolia, and Carex sp. Field C contains many seedlings and a few scattered saplings of Quercus macrocarpa, _g. ellipsoidalis, and _g. borealis, especially at the field edges, but no mature trees.
Field D, native oak savanna, has never been clear-cut or plowed, although it was possibly grazed prior to 1940. Its soil is a Sartell fine sand. It is one of several compartments in a prescribed burn experiment (White 1983). Since 1966 it has been burned, generally in late April or early May, for 2 years in succession followed by one year without burning. The entire field, including the experimental plots, was burned on April 27, 1982, April 17, 1984, and April 11, 1985, but not burned in 1983. The dominant herbaceous species are Carex muhlenbergii, Andropogon gerardi, Sorghastrum nutans, Artemisia ludoviciana, Carex pensylvanica, Solidago graminifolia, Poa pratensis, Schizachyrium scoparium, Stipa spartea, Panicum perlongum, Rubus sp., Helianthemum bicknellii, and Liatris aspera. In addition, it contains scattered oaks (Quercus macrocarpa, Q. ellipsoidalis, Q. borealis).
Field E, our fifth field, is the youngest and most nitrogen poor of all the fields. Last farmed (to rye) in 1975, it was 7 years old in 1982. Its Sartell fine sand soil is dominated by Agrostis scabra, Agropyron repens, Ambrosia artemisiifolia, Chenopodium al bum, Berteroa incana, and Crepis tectorum.
E. LONG-'IERM EXPERIMENTS
The basic layout of our on-going field experiments is illustrated in Figure 5. The
actual layout of plots in Fields C and A are shown in the aerial photographs of Figure 4A
and 4B, respectively. Note that some macroplots are not included in these pictures. Parts
C and D show closeups aerial photographs of nitrogen-gradient microplots without
mammalian herbivores (Fig. 4C) and with them (Fig. 4D). The small dots are gopher
mounds. Because of limited space in the field of native oak savanna and because of the
permanent damage to oaks that could have resulted from trenching to bury fence to exclude
gophers, some experiments were performed just in Fields A, Band C. Each experiment was
designed to test a different, though interrelated, hypothesis. Each has a different time
17
LAYOUT OF FIELD EXPERIMENTS
Undisturbed N Gradient Disturbed N Gradient
E D H H G F I B D B I
8 G F C I F G D F C H
H 8 I D E D E F C B H
E C A C H C E I F A D
A 8 D 8 G I G B C E C
D A D G C C E E I G B
8 F G I A F C D F H D
E F A H I 8 B G A I I
E H A G I E E A F H A
Single Nutrient Plots
C 8 F
A G I
H D E
A H G
F C E
D I 8
8 H
C D
E F
A B
C F
D F
I
A
G
I
G
H
LEGEND
5m0 5m
Deer and Gopher Exclosure
Nitrogen-Herbivore Interaction
E I E I G I E G
E E G G G G I G
G I E I E E G E
I I E I G E E G
I E I G G E G G
E I I E I I I G
H
A
H MACROPLOT # I
D
C
G
F MACROPLOT #2
G
A
MACROPLOT #3
MACROPLOT #4
MACROPLOT # 5
20•!,-:,------------' OOm
MACROPLOT #6
MACROPLOT #7
MACROPLOT #8
MACROPLOT #9
MACROPLOT # I 0
Figure 5. Typical layout of some of the major experiments within a field. The smaller plots are microplots whereas the larger plots are macroplots. The letters A through I refer to treatments. Note that all experiments include from 3 to 6 replicates of each treatment. Most experiments are replicated in all four experimental fields. A completely randomized experimental design was used in each experiment. For sampling frequencies for various experiments, see Table 2. See Figure 4A and B for aerial photographs of actual plot layouts in Fields A and C.
scale on which it is likely to show its response. For example, our study of above- and
below-ground productivity uses biweekly sampling throughout the entire growing season,
The fenced microplot experiments are being sampled once each year to detail year-to-year
plant and litter dynamics, Most other experiments were designed to determine the long
term, total effect of a given manipulation. These are sampled every other year on a
rotating basis, or more frequently, if possible,
1. SINGLE--NUrRIENT ADDITION EXPERIMENTS
In 1982 we established 36 plots in each of the four main experimental fields, These
36 plots were randomly assigned to receive one of 9 treatments, with 4 replicates of each
treatment in each field. The treatments consist of addition of various potentially
limiting soil resources, each added singly, as well as a control, The nutrients, added
twice a year, are N, P, K, Ca, Mg, s, a trace metal mixture, water (2.5 cm/wk throughout
the growing season). In the past four years, we have harvested above-ground biomass in
these plots four times, AN0VA of the results of these experiments, and contrasts using
Dunnett•s t (Steel and Torrie 1980), showed that nitrogen addition led to significant
increases in above-ground plant biomass compared to controls in 10 of the 16 possible
cases, Phosphorus, magnesium and water were each significant in only 1 of 16 possible
cases each. No other treatment was significant for any field or in any year, Similar
results have been obtained in separate experiments in Field E (Tilman 1983, 1984), Thus,
of all the soil resources added, nitrogen is far and away the most important in limiting
primary production throughout succession at Cedar Creek, For this reason, we have focused
on nitrogen as the most important soil factor likely to influence primary productivity,
plant community composition, and successional dynamics, Because we will continue these
experiments indefinitely, we will be able to determine if year-to-year climatic
variation affects the pattern of resource limitation at Cedar Creek,
2. NITROGEN-GRADIENT MICROPLOf EXPERIMENTS
Several of our major, long-term experiments at Cedar Creek involve manipulation of
primary productivity via nitrogen fertilization. Most of these experiments are performed
18
in what we call "microplots." Each microplot is a 4m x 4m plot separated from other
plots in the same experiment by 1m wide buffers that serve as walkways and prevent plants
in one Plot from receiving nutrients supplied to another plot. In general, our nitrogen
gradient microplot experiments contain 9 different treatments, with 6 replicates of each
treatment for each experimental type within a field. The treatments consist of a
completely unmanipulated control as well as 8 other treatments that receive the same
background mixture of P, K, Ca, Mg, s, Cu, Mn, Co, Cu, and Zn but differ in the amounts
of nitrogen added (Fig. 6). A completely randomized experimental design was used in each
field, with treatments assigned to plots at random. Nutrients are applied twice each
year, starting in 1982, with half applied in mid-May and half in late June.
This experimental design establishes a primary productivity gradient with numerous
replicates of each productivity level (Figs, 4 and 5). Many studies have suggested that
along productivity gradients there are major changes in above-ground versus below-ground
allocation (e.g., Chapin 1980; Grime 1977), species diversity (Beadle 1966; Holdridge et
-.... h .. >,
\ z I
.!1)
s t2. C
:8 '6 ~ C Q) Cl 0 ... "" z
30
15
0 ABCDEFGH
Treatment
19
Figure 6. Experimental rates of nitrogen addition for microplot and macro plot nitrogen gradient experiments. Note that rates are expressed as g/m2/yr of N (added as ammonium nitrate). Letters A through H refer to the treatments illustrated in Figure 5 (except for the Single Nutrient Plots). Treatment I received no nutrients. Treatments A through H received the same mix of P, K, Ca, Mg, s, and trace metals.
al. 1971; Specht and Rayson 1957; Al-Mufti et al 1977; Bakelaar and Odum 1978; Tilman
1982), nutrient cycling (Gorham, Vitousek and Reiners 1979), plant species composition
(Tilman 1982), herbivory (Fretwell 1977; Oksanen et al. 1981) and plant physiognomy
(Beadle 1954; Cody and Mooney 1978). We have established experimental productivity
gradients so that we may determine if there is a causal relation between productivity
(nitrogen supply rate) and such ecosystem features. We have used the basic design
detailed above to establish three different types of experiments:
(A) Undisturbed Microplot Nitrogen Gradients are performed on the existing natural
vegetation in each of the four fields, but inside mammalian herbivore exclosures;
(B) Disturbed Microplot Nitrogen Gradients are performed on newly disturbed
(thoroughly disced) ground in each field (except Field D) inside mammalian herbivore
exclosures;
(C) Microplot Nitrogen Gradients with Herbivores are performed on the existing
natural vegetation in each field (except field D) in an area that is open to herbivores.
These three different experimental types, because of the replication of treatments
within each field and the replication of experiments among the fields, allow us to
assess the direct and indirect effects of several processes, The Undisturbed Microplot
Nitrogen Gmdient experiments show the effects of changes in nitrogen supply rates on
productivity, species diversity, vegetation height, vegetation composition, and litter
dynamics for existing vegetation, The Microplot Nitrogen Gradients with Herbivores will
demonstrate how mammalian herbivory depends on primary productivity and standing crop,
They can be compared with the microplots without herbivores. This comparison will
demonstrate if the herbivores are having a significant impact on species diversity,
species dominance patterns, primary productivity, and litter dynamics. The difference
between the fenced and the unfenced plots is a measure of the total effect of mammalian
herbivores, The Disturbed Microplot Nitrogen Gradient experiments, in comparison with
those on indisturbed ground, test for convergence and thus for the presence of multiple
stable equilibria in these ecosystems. If ecosystems have multiple stable equilibria
20
(Lewontin 1969; Strobeck 1973; May 1977, 1979), all future states of an ecosystem will
depend on its past history. This is because multiple stable equilibria imply that, even
in exactly identical physical environments with exactly the same repertoire of species,
the long-term outcome of their inte!'actions will depend on initial species densities,
Although Connell and Sousa (1983) suggested that multiple stable equilibria may be rare
in natul'e, theory predicts that they could be common (May 1977, 1979), There are not yet
any field experiments with sufficient replication and a sufficiently long period of
observation to determine if or when ecosystems have multiple stable equilibria. Our
comparisons of the long-term outcomes of the microplot nitrogen gradient experiments
performed on disturbed versus those on adjacent undisturbed ground should determine the
frequency of multiple stable equilibria in old fields. We will compare these results with
those from qualitatively similar experiments performed at the Niwot Ridge LTER site,
The microplots, in conjunction with a variety of short-term experiments, al'e
providing information on the mechanisms of interspecific intel'action. Such information
is critical in testing hypotheses suggested by our old field chronosequence survey. One
of the goals of our work is to determine how small scale processes can be integrated into
landscape level patterns. For instance, our old field survey suggests that long-term
changes in nitrogen availability may be a cause of the successional pattern (Fig, 3), If
this hypothesis is correct, then the pattern of vegetational composition along
experimental nitrogen gradients should be consistent with the patterns observed along the
natural nitrogen gradients both within and among the 22 fields of our sul'vey. Although 4
years is too short a time within which to expect vegetation to reach a new state
determined by our experimental rates of nitrogen addition, there are already broad
similarities between the patterns in Fig. 3 and those observed in our Undisturbed
Nitrogen Gradient Microplots (Tilman, #1 in review). If the long-term pattern of change
in the microplots proves to be consistent with the pattern of field-to-field variation in
the old field chronosequence and if the 2300 quadrats in the old fields show changes
21
consistent with the original pattern in the old fields, then it could be validly
concluded that the mechanisms encompassed by the microplots were an important control of
landscape patterns,
Microplot Results to Date
These experiments have already yielded a weal th of information. Indeed, we have
prepared four manuscripts, containing 100+ pages of text and 22 figul"es, based on our
results to date (Tilman, i/1 in review; Tilman, i/2 in review; Inouye and Tilman, in
review; Inouye and Huntly, in review). We can provide but a brief summary of these here.
In none of the fields, for none of the microplot nitrogen gradient experiments, did
total plant biomass, plant height, species richness, litter production or light
penetration respond to the combined addition of P, K, Ca, Mg, Sand trace metals. In
contrast, plant biomass and height increased significantly, and light penetration
decreased significantly with added nitrogen in all three experimental types in all four
fields (Fig. 7), This supports the view that nitrogen is the major limiting soil resource
in old fields and native vegetation at Cedar Creek.
Species Richness
Although species richness was unaffected by or increased slightly with nitrogen
addition during the first field season, species richness decreased significantly with
the rate of nitrogen addition in subsequent years. On avel"age over all the experiments in
all the fields, more than 50% of the species had been displaced from high nitrogen
treatments by 1985 (Fig, 7 M-P), The decreased diversity observed along these gradients
is consistent with predictions of resource competition theory. Theory (Tilman 1982: 113)
predicts that species richness should decline most rapidly with enrichment when all
resoul"ces but one are added in excess. This is because all species should become limited
by the same resource (the resource not added -- here, probably light), and the one
species that is the superior competitor for that resource should displace all others. A
superior competitor for a resource is a species that is able attain a more rapid net
growth rate at low levels of that resource (Tilman 1980). The strong inverse correlation
22
N- 500 A. Field A 000 r"·=-=""'cc--=-=~ ~ 1982 1983 1984 1985 1982 1983 1984 1985
"' ~
! I
BOO C. flelcl C 1982 1983 1984 1985
BOO D. Fiekl D 1982 1983 1984 1985
Figure 7. Undisturbed Nitrogen-Gradient Microplot Experiments. Each bar in each histogram of this figure shows the average value of a variable over all 6 replicates for a particular field and year. Treatment I, the control, received no nutrients. It is shown separate from, and to the left of, treatments A through H. Treatments A through H form the nitrogen gradient, with the rate of nitrogen addition increasing progressively from treatment A (no nitrogen) to treatment H (highest rate of nitrogen addition each year). Treatments A through H received the same mixture of P, K, Ca, Mg, Sand trace metals. Parts A-D of this figure show total above-ground living plant biomass in all treatments in 1982, 1983, 1984 and 1985 in fields A, B, C and D, respectively. The proportion of light penetrating to the soil surface is similarly shown in parts E-H. Average vegetation height, shown in parts I-L, was calculated as a weighted average of heights of the major species. Species richness, shown in parts M-P, is the average number of species found in 0.3m2 samples collected in the six replicates of each treatment.
between species richness and light penetration (Fig. 7) supports this view. Our
experimental results to date are consistent with the work of Beadle 1966, Dix and Smeins
1967, Grime 1973, Huston 1980, Bond 1983, Elberse et al. 1983, Milton 1947, Willis and
Yemm 1961, Kirchner 1977, Bakelaar and Odum 1978, Silvertcwn 1980, and Tilman 1982. They
also agree with the significant decrease in species richness that we observed in our more
nitrogen rich old field quadrats (Inouye et al. 1986).
Herbivory
There were some significant differences between the nitrogen gradient experiments
with herbivores and those without. Various grasshopper species (Melanopus femurrubrum
and !'.!.e_ bivittatus), a vole (Microtus pennsylvanicus), and the plains pocket gopher
(Geomys bursarius) (Fig. 8) demonstrated strong preferences for the plots receiving
higher rates of nitrogen addition. Several other herbivorous insects responded similarly
(Strauss, in review). The strong preference of gophers for the high nitrogen treatments
was associated with a much greater rate of microsite disturbance within these plots
caused by gopher mounds (Fig. 8). This increased gopher activity caused within-plot
spatial variation in light penetration to increase with productivity. This increased
spatial heterogeneity apparently allows several annual and short-lived perennial plants
to persist in high nitrogen treatments from which they were displaced in the absence of
gophers (Tilman 1983). Thus, there is an indirect, feedback effect of gophers on
successional dynamics because gophers prefer more productive sites but their activity
creates early successional conditions. Up to the present time, however, despite
significant effects of the nitrogen gradients en herbivores, the presence of herbivores
has not led to qualitative changes in the responses of most dominant plant species to the
nitrogen gradients. This may mean that herbivores do not greatly influence successicnal
dynamics and local spatial structure at Cedar Creek, or that more than four years are
required for them to have an effect. Our next four years of work should provide the
answer.
23
0 I[ ... Pi. VJ u C: :::, 0 :!:
Experiment A-11 Experiment E-8
8 25
20 6
15
4 10
2 5
0 0
E G A C F H
Treatment
Figure 8. Production of new gopher mounds (see Fig. 4D) increases highly significantly with nitrogen addition rate. Treatments I to E to G represent a gradient of increasing N supply, as do treatments A, C, F and H. In all fields in which gophers are present, there is increased gopher feeding activity and disturbance, as estimated by gopher mounds, in more productive micro or macro plots.
Transient Dynamics
Annual plants comprised a noticeable portion of the pre-treatment plant biomass (as
estimated from the 1982 samples of the unfertilized controls) in the Undisturbed
Microplot Nitrogen Gradient experiments in Fields A and B, but were rare in Fields C and
D. In Fields A and B, the relative abundance of annual plants, as a group, increased
significantly along the nitrogen gradients in 1982, but decreased significantly along the
gradients by 1984. The relative abundance of all vascular perennial plants decreased
significantly along the gradients in 1982 in but increased along in 1984 and 1985. Thus,
nitrogen fertilization led to a period of transient dominance by annual plants, which
were then displaced by various perennial species.
Similar patterns of transient dominance can be seen in the population dynamics of
individual species. In general, the species that increased most in response to nitrogen
addition the first year decreased along the gradient in the second, third and fourth
years. For instance, in Field A the relative abundances of Berteroa incana and Ambrosia
artemisiifolia increased greatly along the gradient in 1982, but decreased in 1983 or
1984 (Fig. 9). The relative abundances of AgropYron repens, Achillea millefolium and
Figure 9. Relative abundances of some major species in the Field A Undisturbed Nitrogen-Gradient Microplots. Note the transient increases by Berteroa, Ambrosia and Hedeoma before their displacement by Agropyron. See Figure 7 for a detailed explanation of these graphs.
i il <( 0.5
j
"' ~ u C C,
0
~ 0.5
!!!
J 0
Response of
Field A Undisced
IA---+H IA--,H Treatment (N addition)
I A ------+ H I A ----> H Treatment (N addition)
Agropyron repens to Experimental Nitrogen Gradients
0.3
i ] <( 0,15
-~ j
1l ~ <(]
0,5
0
Field 8 Undisced Field C Undisced
1984 1985
I A-->H I A---->H Treatment (N addition)
Field 8 Disced
1984 1985
IA--,H IA--,H Treatment (N addition)
0.3 ..-------~ 1984 1985
i .c
~ 0.15
j
j
0 " l. .1
I A---+H I A-->H Treatment (N addition)
Field C Disced 0,4 ,--------~
1984 1985
il <( 0.2
~
I 0
I A---+H I A-->H Treatment (N addition)
Figure 10. both disced are shown.
Response of Agropyron repens to experimental nitrogen gradients in and undisturbed plots. For brevity, only the 1984 and 1985 responses See Figure 7 for a detailed explanation of these graphs.
Erigeron canadensis did not change along the gradient in 1982, but increased along the
gradient in 1983, Thus the species that grew the most rapidly initially, following an
increase in the supply rate of nitrogen, were displaced by other species that did not
respond initially, but which did increase under the new conditions of higher plant
biomass and lower light penetration, In Field B, Rumex acetosella was the only major
species to increase significantly in relative abundance along the gradient in 1982. In
1983 and 1984, its relative abundance decreased significantly along the gradient with its
absolute abundance in the highest nitrogen plots dropping by a factor of 30 from 1982 to
1983, Similar patterns occurred in Fields C and D,
These results demonstrate that the immediate response to addition of nitrogen is
often the exact opposite of the response observed several years later; i.e., that
nitrogen addition leads to a period of transient dominance by species that are later
displaced. Theory (Tilman 1985) suggests that at least some of the species dominant
during the fourth year of these experiments may also be transients. It is imperative that
experiments such as these be allowed to proceed for a period long enough to distinguish
long-term effects from transient responses.
Our results to date provide an important warning. Most ecological theory is
equilibrium theory. It attempts to predict the long-term effect of a given variable or
process. However, many ecological field experiments last only one to three years. The
results we have obtained in the first four years of our experiments at Cedar Creek
demonstrate the existence of transient responses to our experimental manipulations. Our
results suggest that these transient responses can be the exact opposite of the long-term
responses, If this is so, the current emphasis on short-term experimentation could lead
ecologists to draw improper conclusions because their experiments are too short to
detect the long-term, total effects of the manipulations,
Convergence, Divergence and Multiple Stable Equilibria
Al though the four fields differed in their initial soil chemistry and initial
25
vegetational composition, the treatments imposed similar nitrogen gradients in all four
fields, If nitrogen supply rates are more important than past history in determining
vegetation response, then each species should have a qualitatively similar distribution
and occur in the same order along the experimental nitrogen gradients in these four
fields (Tilman 1982),
Comparisons within the Undisturbed Nitrogen Gradient Microplots: By 1985, AgropYron
repens had similar distributions along the experimental gradients in Fields A, Band C
(Fig, 10). It increased significantly along the gradients in all 3 fields in 1985,
despite its initial rarity in Fields Band C, It invaded and dramatically increased in
abundance in many high nitrogen plots from which it was absent in 1982, Poa pratensis had
similar, highly significant Gaussian distributions along the gradients in Field C and D
in 1985 (Fig, 11 ), Schizachyrium scoparium declined in abundance along the nitrogen
gradients by 1985 in all fields in which it occurred (Fig, 11), Indeed, of all the major
producer species in common among two or more of these experiments, all except one had
qualitatively similar distributions along the experimental nitrogen gradients in the
undisturbed plots by 1985, Although their qualitative responses seem to be converging,
their absolute abundances are not converging, as indicated by the progressively
decreasing values of the proportional similarity index we have observed in the high
nitrogen treatments in Field Band C (Inouye and Tilman, in review). To demonstrate that
there are no multiple stable equilibria will require that both qualitative patterns and
absolute abundances converge (Strobeck 1973; May 1977), It is likely to be many more
years before the vegetation stabilizes and allows us to validly test these hypotheses.
Disced versus Undisced Plots: Because of discing, the Disturbed Microplot Nitrogen
Gradients and the Undisturbed Microplot Nitrogen Gradients in each field differed greatly
in the initial abundances and life history stages of major plant species, litter cover
and depth, and soil profiles, If multiple stable equilibria occur in successional fields,
these plots should reveal them. We have analyzed the data collected during the first
four years in two different manners (Inouye and Tilman, in review), First, we used a
26
Field C-Undisced
Schizachyrium scoparium 0.6
i li~~I il 1985
~ 0
0 C m IA-H IA-H IA-H IA-H "C C ~ .0 Field C-Dlsced <(
.~ Schlzachyrlum scoparium
j 0·15 1982 1983 1984 1985 a:
1.0 Paa pratensis
1982 1984 1983 1985
0 IA---H I A-H I A-~H I A-H
0.16 Paa pratensis
1982 1983 1984
O I A---H t A-H I A-H I A-H
Treatment
0.3
0
0.4
Agropyron repens
1982 1983 1984 1985
- I IA-H IA-H IA-H IA-H
Agropyron repens
1982 1983 1984 1985
Figure 11, experimental
Convergence in the response of three dominant nitrogen gradients in disced versus undisturbed areas
plants to of Field C,
the
proportional similarity index (Pielou 1984) to compare treatments between disced and
undisced plots in the same field (Fig 12), Within each treatment, similarity increased
strongly through time in Field A. Similarity was low, but increased through time in
Fields B and C (Fig, 12). Second, we compared the responses of major species to the
gradients in the disturbed and the undisturbed fields (e.g., Fig, 11 ), In general, this
suggested that convergence was occurring but there were some cases of divergence, Whether
or not these plots converge is of great ecological importance, for it is a measure of the
role of history versus biotic interaction in structuring ecosystems, Thus, we plan to
sample all these plots once each year for as long as we have funding,
We will also perform a series of invasion experiments to determine if species not
yet present in particular plots or fields can successfully increase in abundance. This is
an especially important question for the high nitrogen plots, since many of these have
become virtual monocul tures. They may be monocul tures because the dominant species are
the superior competitors of all the species at Cedar Creek, or they may be invasible by
other species that are not yet present in the field. We will perform two different types
of invasion experiments. Both will be located in the Unfenced Nitrogen Gradient
Microplots, because we have 16 replicates of each treatment for these plots and thus can
afford to use several replicates in this experiment, One experiment will consist of
reciprocal transplants of 20 cm diameter cores of turf among low, medium and high
nitrogen plots in Fields A and D. This will determine if native tallgrass prairie species
and/or AgropYron repens can invade and displace each other. We will also perform seed
addition experiments to determine if seeds and vegetative plants of a given species
differ in their ability to invade, If they do, this would suggest that there could be
multiple stable equilibria in this vegetation, since established plants would have a
lasting advantage. These invasion experiments, in combination with the ongoing
observations in the microplots, should determine the extent and prevalence of
convergence, divergence and multiple stable equilibria in Cedar Creelc successional
27
X
"' D C
X
"' D C
X
"' u C
1.0
0.9
OB
07
0.6
05
0.4
0.3
0.2
0.1
a Field A Disturbed & Undisturbed
1.0
0.9
0.6
0.7
0.6
0.4
03
0.2
0.1
0.0
b
A
A
1.0 re __ _ 0.9
0.6
0.7
■ 1982
■ 1983
111 1954
□ 1985 0.6 ,~--~
0.5
0.4
0.3
0.2
0.1
0.0 A
B C O E
Treatment
Field B Disturbed &Undisturbed
B C O E
Treatment
Field C Disturbed & Undisturbed
B C O E
Treatment
G H
G H
G H
Figure 12. Average similarity of disced versus undisced plots within each field. Each bar is the mean proportional similarity (Pielou 1984) of the 36 pairwise comparisons among disced versus undisced plots in each treatment. Note the sharp increase in similarity through time.
vegetation,
Landscape Patterns versus Microplot Experimental Results
All of the plant species dominant in the microplots are also dominants at some time
during secondary succession at Cedar Creek, The old field chronosequence data (Figs, 2
and 3) have shown a strong correspondence between soil nitrogen levels and the abundances
of these species. For most species, abundance depends on soil nitrogen within each field
in the same way that it depends on nitrogen when all fields are considered together. This
suggests that the same processes that cause point-to-point variation in vegetation within
the landscape of a single field cause field-to-field variation in vegetation across
fields of different successional ages. It also suggests that soil nitrogen may be a main
cause of these spatial and temporal patterns, If this is so, then plant species should
become separated along the microplot nitrogen gradients in the same way that they are
separated along the temporal nitrogen gradient of succession and the spatial nitrogen
gradients within each field. We have used the data available from the fourth year of the
microplot experiments to test this hypothesis (Tilman, in review), Clearly, this must be
considered a preliminary test since plant abundances are still changing rapidly by the
fourth year.
If this hypothesis is correct, the response of a species to experimental nitrogen
addition should depend on the total nitrogen level within the field. If the nitrogen
level in a field is beyond the peak of the old field distributional curve of a species,
as it is in all fields for Rumex acetosella, Hedeoma hispida, Lespedeza capitata,
Agrostis scabra, Ambrosia artemisiifolia, and Berteroa incana (Fig, 7), then nitrogen
addition should cause these species to decline in abundance. Although the absolute and
relative abundances of many of these species increased significantly with the rate of
nitrogen addition in 1982 or 1983, none of them did so in 1984 or 1985, By 1984 and 1985,
the absolute and relative abundances of 5 of these 6 species declined significantly along
the experimental nitrogen gradients (Tilman, in review).
Species with their peak abundance in the old field survey at a soil nitrogen level
28
greater than in an experimental field (such as Schizachyrium scoparium, Artemisia
ludoviciana, and Sorghastrum nutans) should have a Gaussian (quadratic) distribution
along the experimental gradients. This was so for Artemisia ludoviciana and Sorghastrum
nutans in Fields B, C and Din 1984 and 1985, However, Schizachyrium scoparium declined
along the experimental nitrogen gradient, without any sign of increasing at low rate of N
addition, as would be predicted by its response as shown in Figure 3,
Lastly, for species that increased in percent cover throughout the entire nitrogen
range in the old field survey (Agropyron repens, Rubus sp., and Poa pratensis), an
increasing or Gaussian distribution is expected along the experimental gradients. These
species showed just such responses to the experimental nitrogen gradients.
In total, 12 of the 15 most abundant plant species responded qualitatively
similarly in 1985 to the experimental gradients and the spatial and temporal gradients of
the old field survey, By 1985 we observed marked similarities in the responses of major
plant species to nitrogen addition in all our experiments, whether or not herbivores were
present and whether or not they were disturbed, These preliminary results thus support
the hypothesis that increases in soil nitrogen through time may be a major cause of the
pattern of secondary succession observed at Cedar Creek and that spatial heterogeneity in
nitrogen may be an important determinant of spatial variation in vegetation within a
landscape. They also suggest that herbivores may be much less important than nitrogen
mineralization rates in determining plant community structure at Cedar Creek, However, as
discussed later, herbivores, especially gophers, seem to be a major cause of soil spatial
heterogeneity. Thus, it seems likely that the total effect of herbivores may become
increasingly great through time. This is a possibility that will be addressed during our
next four years.
Litter Dynamics
To gain a better understanding of litter dynamics, we performed an experimental
study of litter decomposition in the Undisturbed Microplot Nitrogen Gradient experiments.
29
In these experiments, we harvested little bluestem (Schizachyrium scoparium) in plots
that had received three different treatments: no N addition, moderate N addition, and
high N addition. We then placed the little bluestem in litter bags in the field, and
collected litter bags each month of the growing season during the next 1.5 years. We
found little direct effect of nitrogen addition on litter decomposition. However, we did
find that litter produced by plants growing on higher N plots had a lower C:N ratio, and
this lower ratio corresponded with an increased rate of decomposition (Pastor, Stillwell
and Tilman, in preparation).
Our microplots afford us another opportunity to study litter dynamics. Each year we
have sampled and will continue to sample both peak living plant standing crop and litter
mass in each of the 369 fenced Nitrogen Gradient Microplots. In addition, we perform
biweekly sampling of vegetation and litter in selected plots in Field C. These samples
allow us to directly observe seasonal and yearly dynamics of litter and the dependence of
these dynamics on rates of nitrogen addition and above-ground plant production. For
instance, for the Undisturbed Nitrogen Gradient Microplots of Field A, total litter was
independent of treatment in 1982 but was highly dependent on treatment by 1984 and 1985.
We have also used our data on litter and primary production to calculate the proportion
of annual production that decomposes during the next year. For Fields A and D, litter
decomposition rate increased significantly with the rate of nitrogen addition. However,
the opposite pattern was observed in Fields Band C. Our seasonal sampling of litter and
above-ground plant biomass revealed that litter accumulates at a fairly constant rate
from early May through mid-August, and then rapidly declines. This means that living
plant standing crop and litter both reach peak levels at the same time. The rapid decline
in both litter and living standing crop after mid-August means that most litter
decomposition occurs in September and October. Our data on seasonal production in these
plots suggests that early season production of litter is a major factor inhibiting late
season production by cool-season grasses. The most likely mechanism to explain this is
that early season litter causes bacterial immobilization of available soil nitrogen later
30
in the season, and thus inhibits late season growth. This may explain the unexpected
rapidity with which Poa pratensis displaced Schizachyrium scoparium from high nitrogen
plots, It may also explain the tendency for fire to lead to a replacement of Poa by
Schizachyrium. Because of the critical role of litter in the nitrogen cycle, we will
continue to monitor litter dynamics in these plots, We plan to expand our studies of
litter decomposition and its effects on nitrogen availability and plant growth (see next
section).
Litter Feedback Effects on Vegetation
An additional reason we plan to expand our studies on litter comes from some
intriguing dynamic interactions we have observed in the high nitrogen plots in Field B
and C. Before we began our experiments, these plots tended to be dominated by
Schizachyrium scoparium (little bluestem) or Poa pratensis (bluegrass), Agropyron repens
(quack grass) was rare. However, following nitrogen addition, Agropyron increased greatly
in the plots which initially contained some Agropyron, In plots in which Agropyron was
initially absent, Poa pratensis became dominant, provided it had been present initially.
Replicates that initially lacked both Poa and Agropyron became dominated by
Schizachyrium. Thus, there was a pattern of marked divergence in these high nitrogen
treatments. This divergence amounted to a magnification of pre-existing plot-to-plot
variation in the abundances of these three species,
The litter characteristics of these three species led to an even greater divergence,
Schizachyrium and Agropyron both have stiff, strong, lignified stems, Poa, in contrast,
has a relatively thin and weak stem. The dense stands of Poa which were produced on some
plots in response to our two highest rates of nitrogen addition lodged in the late autumn
of 1984, This created a dense, thick litter layer through which the shoots of the plants
that had lived in the plots in 1984 did not penetrate in 1985, The main plants present in
the lodged plots in 1985 were a few species of annuals (Chenopodium album and Polygonum
convol vulus) that were able to invade and grow despite the thick, dense litter layer,
31
Despite their rarity, these annuals, because of their rapid growth, completely covered
these plots by the end of the 1985, Thus, we have a case of apparent "retrograde
succession" caused by a rapid increase in the productivity of a species that lodges
easily.
We do not lmow what will happen in these plots in the long-term, Clearly, their
future composition is going to depend on the rate of Poa litter decomposition and on the
ability to invade of species that are not so easily lodged, If Agropyron can successfully
invade these plots and can displace Poa (as it has done in other replicates of these
treatments), this event may prove to be a 4 to 6 year transient on the way to a single
stable equilibrium point determined by the treatment. However, it may be that AgropYron
will be unable to invade, Some Poa had re-established by the end of 1985 but there had
been no invasion by Agropyron. If Poa increases again, and again lodges within a few
years, high productivity could lead to a pattern of cyclic succession, The next 5 to 10
years will show us which course nature takes. To understand the cause of this course, we
plan to initiate a series of litter addition and removal experiments within subsections
of the microplots, and determine the effects of these on plant growth and nitrogen
mineralization rates,
Dynamics of Below and Above Ground Production
The objective of this work is to examine root and foliage dynamics at the community
level as they relate to old-field succession. The study is being conducted in the
unfenced nitrogen gradient microplots in Fields A, B, C, and D, The main questions being
addressed are:
(1) Do whole-community root:shoot ratios shift along successional and nutrient
gradients?
(2) What is the relationship between observed root:shoot ratios and the actual
patterns of below and above ground production?
To address these questions, we are taking matched, bi-weekly samples of both below
and above ground plant biomass throughout the growing season. Because high rates of
32
nitrogen supply could lead to water depletion, we have installed neutron probe tubes in
the plots. This allows us to detect interactions among nitrogen, water, and field age.
For above-ground biomass, we manually separate living plant material from litter. For
below ground biomass, we wash samples and then manually separate roots from soil organic
matter. Although the sandy soils of Cedar Creek make this work much easier than it would
be on most other soils, the separation of roots is time-consuming. Our preliminary
results show that root:shoot ratios increase during secondary succession at Cedar Creek
from about 5.2: 1 in young fields to about 11 : 1 in our 50 yr old field. We have also
seen that fertilization leads to increased root:shoot ratios in early succession but to
decreased ratios in late successional fields. Once we have completed our analysis of root
samples (which are kept frozen from the time they are obtained until analyzed), we will
use the sequential difference method to estimate the seasonal total rates of both above
and below ground production in our plots.
3. MACROPLOr NITROGEN GRADIENT EXPERIMENTS
In addition to the mioroplot experiments, we have established a series of 20m x 50m
"macroplots" in the four fields. These macroplots receive three different treatments: no
nutrient addition, addition of N and all other nutrients at an intermediate rate
(treatment E of the microplots; Fig. 6) and addition of N and other nutrients at a high
rate (treatment G; Fig. 6). In Fields A, Band D there are 3 replicates of each of these
3 treatments, giving a total of 9 plots per field. Because of limited space, there are
only 2 replicates per treatment in Field C. Except for small portions to be discussed
later, these plots are open to all herbivores. Each plot is large enough to include the
home ranges of several individual small mammals and for selective habitat patch foraging
by deer. As such, they are providing us with information on total responses of these old
field ecosystems to changes in their productivity, because the observed effects include
both the direct effects of changes in productivity on plants and various indirect effects
mediated through herbivores. Much of our work on nutrient inputs, outputs, and cycling is
33
performed in the macroplots, as is much of our work on direct and indirect effects of
herbivores, The herbivore work includes both population responses of herbivores to
changes in primary production and vegetational changes in small areas from which various
herbivore species or functional groups are excluded.
Lysimeters
Within each macroplot we installed two soil core tube lysimeters that are equipped,
at their bottom (1 m depth), with a porous cup attached to an evacuated collecting
chamber. These were made by driving a 15 cm diameter piece of PVC pipe around existing
vegetation to a depth of 1 m, removing the pipe with its soil/vegetation core intact, and
gluing a porous cup to its bottom. The lysimeter was then placed back in the hole, We
collect soil leachate from these 66 lysimeters throughout the growing season, Our
analyses of the leachates have allowed us to determine nitrogen leaching loss rates in
Fields A, B, C and D. To date, we have not found a significant increase in nitrogen loss
rates following nitrogen addition, suggesting that the soil microbial community is
efficient at retaining nitrogen. Precipitation collectors in each field have shown that
the annual rate of atmospheric nitrogen loading corresponds closely with those reported
by nearby NADP stations. Interestingly, the estimated annual rate of increase in soil
nitrogen during succession (6.8 ppm of N/yr for the upper 10 cm of soil) is very close to
the rate of atmospheric nitrogen loading. This suggests that the soil nitrogen increases
we observe during succession at Cedar Creek may be caused by atmospheric inputs coupled
with low leaching losses. However, for this process to lead to a leveling off of soil
nitrogen in late successional soils, loss rates must increase on richer soils. Although
we do yet have evidence that this is caused by leaching, we will continue to monitor
nitrogen leaching loss.
Nitrogen Mineralization and Nitrification
We determined net nitrogen mineralization and nitrification during the 1984 growing
season by the in situ buried bag incubation method (Eno 1960). This method correlates
34
highly .with estimates of N and P cycling in croplands, grasslands, forests and savanna
(Westermann and Crothers 1980; Nadelhoffer et al. 1983; Pastor et al. 1984; Vitousek and
Matson 1985; Schimel et al. 1985). Three samples were taken of the upper 10 cm of soil
in each treatment in each macroplot in each field, placed in a polyethylene bag, and
incubated monthly beneath the thatch in an adjacent portion of each field. Paired samples
estimated initial levels of NH4-N and N03-N, Inorganic N was extracted from both
incubated and initial samples with 1N KCl within 24 hrs after sampling. Net N
mineralization is the increase in NH4-N and No3-N while net nitrification is the increase
in N03-N in the incubations relative to their paired initials (Schimel et al, 1985).
Net nitrogen mineralization in control plots increased with field age, from 4.4
g/m2/yr in the youngest field (A) to 6.5 g/m2/yr in the oak savanna (D), Average annual
N mineralization (Nmin) was significantly correlated with the average total N (TN)
content of the soil:
Nmin = 17 .69 + 0.029TN (r = 0.915, P <. 0,05).
Greater than 90% of the monthly N mineralization was nitrified, except in July, when 65%
was nitrified. The proportion of total N mineralized in control fields (relative N
mineralization) decreased with field age, from 6.2% in field A to 4,8% in field D. These
results are comparable to those for Colorado shortgrass prairies (Schimel et al. 1985),
but are lower than for Wisconsin forests (Nadelhoffer et al. 1983; Pastor et al. 1984).
The increase in soil C/N ratios and the decrease in relative N mineralization we
observed suggests that there may be a decline in organic matter quality during
succession. Schimel et al. (1985) found similar trends in a toposequence of shortgrass
prairie soils and hypothesized that this indicates an increase in recalcitrant, older
forms of humus. A model of soil C and N dynamics in prairie soils (Parton et al. 1983)
indicates that increases in both older recalcitrant humus and inputs of lignified
material could decrease relative N mineralization rates. In our future research, we
plan to determine if the litter of later successional species is more highly lignified,
and if lignin content of our soils increases with field age. We have many reasons to
35
believe that this might be so, since later successional species have more structural
material, which tends to be more lignified than photosynthetic tissues,_ We will also
perfom litter addition and nitrogen mineralization experiments in Fields A, B, C and D
to determine how nitrogen mineralization rates are influenced by the litter of several
different early successional species versus several different late successional species.
Carbon and Nitrogen Interactions in Soils
One of our goals is to develop a mechanistic understanding of plant and soil
dynamics. Our experimental work on plant growth suggests that the most critical aspect of
soils for plants is the rate of nitrogen mineralization, We have already collected data
on in situ rates of nitrogen mineralization across the Cedar Creek successional gradient
(Pastor, Stillwell and Tilman, in review). Our next objective is to determine how soil
nitrogen and carbon interact to determine mineralization rates. In doing our work, we
plan to start with two existing models, Parton's "Century Model" (Parton et al. 1983) and
Molina's ''NC-Soil" model (Molina et al, 1983), NC-SOIL models short-tem aspects of
nitrogen and carbon transformations in the soil-plant system. Data from our studies of
above and below ground production, litter production, litter quality, and litter
decomposition will serve as inputs for the models. Parton's Century Model is
qualitatively similar, except that it incorporates additional processes that are likely
to influence long-tem soil dynamics.
In applying, modifying and extending these models, we wil 1 address such questions
as: How do successional changes in the above- and below-ground pools of nitrogen and
carbon affect mineralization and production? Where are the most active pools, where are
the bottlenecks, and does this change during succession? What changes occur in
nitrification and denitrification? Ultimately, we want to go beyond such descriptive
models to a model that explicitly includes the mechanistic interactions of soil
microorganisms with soil organic compounds and nutrients. This logical extension of
consumer-resource theory (Tilman 1982) to the decomposer community would provide an
36
opportunity to integrate evolutionary and population concepts with an ecosystem
perspective of soils,
We will link our soil model with a model of plant competition and dynamics (Tilman
1980, 1982, 1985, 1986a). The end result will be a mechanistic, ecosystem model of the
dynamics of soil change, primary production, species turnover, species diversity and
successional dynamics, Critical tests of this model will be provided by a variety of our
experiments, especially the nitrogen gradient microplots, the long-term monoculture and
competition experiments, and the old field chronosequence observations.
Herbivore Population Densities
We have established permanent trapping stations in each macroplot to determine
seasonal and year-to-year population dynamics of small mammals, We also regularly
determine densities of herbivorous insect species, especially grasshoppers. In doing our
work, we have found an intriguing indirect interaction between gophers and grasshoppers,
Grasshoppers preferentially oviposit in gopher mounds. This means that local population
densities of grasshoppers may be positively correlated with gopher densities. However,
both grasshoppers and gophers feed on the same plant species, and thus potentially
compete. Such direct competition, if it exists, should make grasshopper and gopher
densities be negatively correlated, and would seem to select against grasshopper
preference for gopher mound oviposition. Seastedt (1985), though, reports that above
ground and below-ground feeding herbivores may function as mutualists because plants, in
response to above-ground herbivory, allocate more growth below-ground, and vice versa. We
plan to pursue these interrelations at Cedar Creek.
Herbivores: Direct and Indirect Effects
Within each 20m x 50m macroplot in Fields A, Band c, we established 7 herbivore
exclosure plots. Each plot is 2m x 4m. The purpose of this work is to determine the
influence of soil nitrogen availability on populations of plants and herbivores, and to
determine the feedback effects of herbivores on plants at varying levels of nitrogen
supply. The treatments consist of separate removal of each of four different groups of
37
herbivores (using mechanical barriers or selective toxins). The four herbivore groups
experimentally removed from the 2m x 4m plots were (1) Microtus pennsyl vanicus, an above
ground vertebrate; (2) Geomys bursarius, a fossorial vertebrate; (3) above-ground
invertebrates, primarily chewing insects; and (4) below-ground invertebrates. The fifth
treatment consisted of removal of all four herbivore groups. The final two treatments
were two different controls. Because the same seven treatments were replicated in each of
the macroplots in Fields A, B, and C, they allow us to determine how both the total
effect and the indirect effect of each herbivore group depends on field age and nitrogen
supply rate,
Nitrogen addition directly affected both plant and herbivore populations. Nitrogen
limited primary productivity and affected plant species richness and absolute and
relative abundance of the common species. Vole and grasshopper populations increased in
the fields after nitrogen addition, and appeared to be nitrogen limited. Most herbivores
were behaviorally responsive to differences among plots receiving different levels of
nitrogen, and were most active on high nitrogen plots. Despite these herbivore effects,
dominant plant species changed with nitrogen addition in qualitatively the same manner as
in the Undisturbed Nitrogen Gradient Microplots, for which herbivores were excluded,
Both gophers and voles were also behaviorally responsive to the presence/absence of
other herbivore groups. Gopher mound production was significantly higher in above-ground
and below-ground invertebrate removals in Field A, Vole captures were negatively
correlated with mounds produced the previous year. The effects of herbivores on plants
varied with nitrogen addition, reflecting both differences in herbivore behavior and
changes in competitive relationships among plants. Most significant herbivore effects
were herbivore X nitrogen interactions, Effects of herbivores on plants, al though
statistically significant, were generally minor, at least for the more abundant plant
species, Several rarer plant species that were common enough to be analyzed showed large
effects of herbivores. Nevertheless, despite three years of herbivore removal, they had
38
an insignificant effect on total community productivity.
The results to date suggest that the patterns of dominance and succession determined
by nitrogen addition alone have not been significantly altered by the presence or absence
of herbivores, If this pattern holds during the next 5 years of the Cedar Creek LTER
project, it would have profound implications for the field of ecology, It would suggest
that the pattern of succession is not highly dependent on herbivore population densities.
Moreover, by comparing the responses we observe on the nitrogen poor, unproductive soils
of Cedar Creek with those observed in other more productive research areas, such as the
Konza Prairie LTER site, the Coweeta LTER site, the Andrews LTER site, the successional
grassland communities of southern England (Brown 1985), and the Serengeti savanna
(McNaughton 1979, 1984), we should be able to determine if there is a tendency, as has
been suggested by Fretwell (1977) and Oksanen et al. (1981) for herbivores to have
maximal impact in moderately productive ecosystems.
Disturbance Rates
Several times each year we directly enumerate all new gopher mounds and other
disturbances in each macroplot, We do this because our work to date suggests that the
light and nutrients provided by these mounds are major limiting resources for some plant
species.
F. CYTilER HERBIVORE STUDIFS
or the hundreds of species of herbivores at Cedar Creek, the plains pocket gopher,
whitetail deer, and several species of grasshoppers are the most abundant. Although we
have done work on other herbivores, we have focused our initial efforts on these three.
1. Gophers Habitat Use and Effects on Soils and Roots
Most gopher (Geomys bursarius) movement is below-ground. We established a 50m x 1 00m
grid within which we used radiotelemetry to continuously monitor the movement patterns of
all resident gophers. We have compared the observed pattern of habitat use with numerous,
detailed measures of below-ground plant biomass and soil chemistry in the gopher tracking
grid, This has allowed us to learn a great deal about the habitat use patterns and social
39
interactions of gophers, as well as the impact of gophers on soils and below-ground
standing crop (Zinnel and Tester, in preparation).
Indi victual gophers frequently abandoned one territory to take over an adjacent,
previously abandoned territory. Newly abandoned territories have significantly lower root
biomass than newly selected territories, This suggests that indi victual gophers exploit
resources in one locality, and then move to another. The tendency for the same areas to
be used year after year as gopher den sites has a profound impact on soil development.
Gophers cache food, urinate, and defecate within the 6 m2 area that comprises their den
site, but forage over ca. 400 m2, The long-term effect of this behavior is to create a
deep, highly organic, nitrogen rich soil at the den site, This soil supports rapid root
regrowth. The long-term effect of gopher foraging is to concentrate the limiting soil
resource, nitrogen, into patches in which the gopher does most of its feeding. Other
sampling of soils of Cedar Creek (Tilman, Inouye and Huntly, in preparation) has shown
localized "hot spots" of nitrogen rich soils that may correspond with current or former
gopher den sites. Our old field survey suggested that much of the species diversity of
old fields could be explained by spatial heterogeneity in soil nitrogen (Inouye et al.
1986). Although our herbivore removal experiments have not shown major short-term effects
of herbivores on vegetational composition and dynamics, herbivores may have long-term
effects on soil heterogeneity and thus on plant diversity. We plan to thoroughly sample
the soils of the gopher habitat use field to determine to what extent its spatial
heterogeneity can be explained by gopher activity.
2. Gopher Feeding Experiments
Because little quantitative information is available on the diet and feeding
behavior of Geomys bursarius (see, though Myers and Vaughan 1964; Ward et al. 1963; Luce
et al. 1980), we established experiments to: 1) determine if gophers prefer certain plant
species; 2) determine the relative importance of plant nitrogen and water content on food
choices; and 3) investigate effects of plant patch density on feeding activity (Behrend
40
and Tester, in review),
Gophers preferred plant species characteristic of early successional stages to those
characteristic of later stages, but showed no preference for plant species with higher
tissue nitrogen levels, In addition, gophers did not discriminate among plants of the
same species that had been grown at different nitrogen levels. However, gophers fed
significantly longer and more frequently in patches with high plant density. These
findings are consistent with observations made using the radiotelemetry system and with
the highly significant increases in gopher mounds in unfenced high nitrogen plots (Tilman
1983; Inouye and Huntly, in review).
3. Deer Exclosure Experiments
Although Cedar Creek contained forest or oak savanna prior to farming and although
all our old fields are bordered by native savanna or forest, woody plants are very slow
to establish in old fields, There are several alternative hypotheses which could explain
this. First, woody plants may be poor competitors on nitrogen poor soils but superior
competitors on the more nitrogen-rich woodland soils on which greater height would be
advantageous (Tilman 1986a). Our nitrogen addition experiments will eventually provide a
test of this hypothesis, An alternative hypothesis is that deer browsing may prevent the
reestablishment of woody plants in old fields, Cedar Creek is a major winter yarding area
for deer. Many woody plants experience heavy browsing damage, To determine if deer
browsing could be cause for delayed re-invasion of woody plants, in 1982 we established a
series of deer exclosures, On the margins of Fields A and B we established 6 permanent
10m x 30m plots. The long axis of each plot was perpendicular to the field/forest
ecotone, with 5m of the 30m length of each plot extending into the forest. For each
field, 3 of the plots, chosen at random, were fenced to a height of 2 m to exclude deer
and 3 were left unfenced. Each year since then we have monitored growth of and browsing
pressure on all individual woody plants. Average growth for all trees less than 120 cm
tall was consistently greater inside the exclosures. If this trend continues, it would
suggest that deer are a major cause of slow tree re-establishment in old fields,
41
One unexpected result from our deer exclosure plots has been the importance of
gophers as a source of mortality for woody vegetation. We have been able to positively
identify numerous saplings that were killed by gophers. While the mortality rate per
year is low, these trees spend a long time in size classes that are susceptible to gopher
predation. Thus, gophers may also be important in preventing the re-establishment of
trees. Our various gopher exclosure experiments will ultimately provide us with a test of
this hypothesis.
4. Grasshoppers: Transient Population Dynamics?
Our survey of grasshopper densities in the 22 old fields showed that overall
grasshopper density declines during succession, but that there is a successional sequence
of grasshopper species that is associated with the pattern of vegetational change.
However, during the first four years of our microplot and macroplot experiments, the
pattern of grasshopper response to nitrogen addition rates differed markedly from the
correlational pattern we observed in the old field survey. To date, nitrogen addition has
led to increased densities of early successional, rapidly reproducing grasshopper
species. We do not yet know if this is a transient effect, or if there will be a
significant difference between our experimental and observational results. There are
many reasons to expect the grasshopper responses to be transient. During each of the four
years of nutrient addition experiments, there have been marked changes in plant species
composition. Because one year's population densities of grasshoppers are determined by
the last year's reproduction, grasshoppers should respond even slower to experimental
changes in productivity than plants. In addition, grasshopper species may be only weakly
competing with each other. Their initial response may mainly reflect growth rate
differences. Thus, it may take many years for the grasshopper composition of our nitrogen
addition plots to reflect the experimentally-induced changes in productivity. If this
proves to be so, it may be necessary to re-evaluate the validity of most current studies
of insect herbivore community structure, because most studies look only at the one or two
42
year responses to manipulations, and thus may be studies of transient effects,
5. Microtus Response to Sodium and Nitrogen
Belovsky (1978) reported that moose on Isle Royale foraged so as to optimize their
intake of two essential nutrients -- protein and sodium. Some serendipitous observations
in our single-nutrient addition experiments suggest that Microtus may bias its foraging
to increase its sodium intake, One of the treatments in those experiments is the addition
of sodium sulfate. We found that the Microtus that invaded the fenced plots over the
winter of 1984-1985 had denuded the vegetation of this treatment in Field A. Microtus
scat counts were 3,2 times higher in the sodium sulfate plots than controls, This was the
only treatment to have significantly greater scat counts than controls, using ANOVA with
contrasts, We plan to continue such observations, and al"e considel"ing an expel"iment to
test for nitl"ogen/sodium intel"aotions.
G. Ol'HER STUDIES OF DISTURBANCES
1. Oak Savanna Bum Experiments
In 1966, a 145 ha al"ea in the southeastern col"ner of Cedar' Ct"eek was divided into 12
compal"tments fol" a study of the effects of val"ious burning fl"equencies on vegetation
composition, The tl"eatments consisted of (1) annual burning, (2) burning fol" 2 out of
every 3 years, (3) burning every third year', ( 4) burning every 6 to 7 years and (5) no
burning. Each treatment was replicated at least twice. The LTER project has now taken
over responsibility for this experiment, The results of the fil"st systematic survey of
these burn compartments were published in White (1983). In 1984 we established 24
permanent quadl"ats in each compartment and sampled soils, plants and herbivol"es in each
quadrat. The data have been entered into a data base and we are proceeding with our"
analyses, We will l"esample each of our" pel"manent quadl"ats in the Oak Savanna Burn
Experiments every 5 years,
2. Fire and Secondary Succession
In 1984 we established an experiment in Field B to determine the effects of
different fire fl"equencies on soil development, vegetation dynamics and herbivol"e
43
densities in a successional field, This experiment was designed to complement the Oak
Savanna Burn Experiment as well as the burning experiments being conducted at the Konza
LTER. There are four different burn treatments that correspond with those at Konza:
(1) controls that are never burned
(2) plots burned every fourth year
(3) plots burned every other year
(4) plots burned every year.
Each plot is 8m x 8m, There are six replicates of each treatment, with the experiments
laid out in the field in a completely randomized experimental design, We sampled soils
and vegetation of all 24 plots when they were established in 1983, In 1984 we began the
burning regime, We will resample these plots in 1987, when we will have completed one
cycle of burning, and in 1991 at the end of 8 years (two complete cycles).
3- Windstorm Forest Disturbance
In 1983, an unusually violent windstorm created a major disturbance in forested
areas at Cedar Creek, It toppled and uprooted numerous trees in a swath about 200 m wide
and many kilometers long, To study the long-term effects of this major disturbance, we
established 11 permanent 1 Om x 50m plots. In each plot we recorded various
characteristics both of the trees that had been damaged or killed and of the trees,
saplings and seedlings that were not damaged. In 1985, Michael Palmer, a graduate student
at Duke University, resampled these plots. The plots will be resampled again in 1988 and
in 1991, By that time we should have a fairly good picture of response of forest vegetation
to wind disturbance.
IL OTHER STUDIES OF SOJL/PLANT IN'l'ERACTIONS
1. Seasonal Productivity Pattems and Temperature-Dependent Plant Growth
Al though it would be impossible for us to sample all our experiments frequently
enough to determine the seasonal effects of our various treatments, we realize that peak
standing crop is not a good measure of primary productivity and that a single sample per
44
year can mask many potentially important variations that occur within the growing season.
Thus, we are sampling some control and fertilized microplots in Field C at biweekly
intervals throughout the entire snow-free period. As in al 1 our sampling, we have sorted
all plants to species and dried and weighed each species individually. These data have
proven critical in interpreting litter dynamics in our plots and in demonstrating
seasonal separation of the major producer species.
This sampling is being done in conjunction with an experimental, growth chamber
study of temperature, nitrogen and light dependent growth of a warm-season and two cool
season grasses (Schizachyrium scoparium, Poa pratensis, and Agropyron repens). These
growth chamber data may be useful in understanding both the observed seasonal separation
of these three species and the tendency for nitrogen addition to favor cool season
grasses over warm season grasses in the field.
2. Long-Tenn Grass Monoculture and Ccmpetition Experiments
Our first work on soil-dependent plant growth was a greenhouse study of nitrogen
limited seedlings. These experiments, performed on nine plants common during secondary
succession at Cedar Creek, showed a highly significant correlation between the nitrogen
limited growth rate of each of species and its order of dominance during secondary
succession (Tilman 1986b). Specifically, species that are dominant during early secondary
succession have significantly greater rates of biomass gain at low rates of nitrogen
supply than do species that are dominant during late succession. This supports the
hypothesis that the species dominant on early succession, nitrogen-poor soils of Cedar
Creek are superior nitrogen competitors (Tilman 1982). However, the experiments do not
suggest why late successional species can displace early successional species as soil
nitrogen levels increase.
One hypothesis that could explain the ability of later successional species to
displace early successional species from the more nitrogen rich soils of late succession
is that light becomes a more important limiting resource during late succession (Tilman
1982, 1985). To test this, we are growing plants in the field in pots containing 8 liters
45
of soil. The soils are various mixtures of subsurface sand with a rich organic top soil.
The other experimental variable was light, which is reduced below incident levels using
shade cloth. We use 7 different soil mixtures and 7 different light levels in a complete
factorial experiment which will be harvested (above and below. ground) after two growing
seasons. These data should determine if the observed successional patterns of these
species and the observed responses of these species to our experimental microplot and
macroplot nitrogen gradient experiments are consistent with resource competition theory
(Tilman 1982, 1985).
Although 8 liter pots are unusually large for such experiments, they may be too
small to include two critical aspects of plant competition: (1) shading and (2) soil
modification through litter production. Thus, in the spring of 1986 we will begin field
experiments designed to determine the relations between soil nitrogen mineralization
rates, soil nitrogen availability, light attenuation, and the dynamics of production and
competition for five major grass species (Agrostis scabra, Schizachyrium scoparium, Poa
pratensis, Andropogon gerardii, and Agropyron repens). These experiments will be
conducted on 10 different soil mixtures, all of which were prepared in the autumn of
1985. The 35m x 35m area was prepared by removing the upper 1 m of surface soil, leaving
behind a very nitrogen poor (90 ppm of N) subsurface sand. This sand was then mixed in 10
different proportions with a rich (1400 ppm of N) sandy soil to give nitrogen levels that
span the range observed in the Cedar Creek old field chronosequence. In the spring of
1986, each of the 10 soil types will be divided into 64 0.7m x 0.7m plots. Each plct
will receive seed of one grass species or of various combinations of these five species.
These are cur long-term monoculture and competition experiments. During each field season
we will monitor the rates of nitrogen mineralization and the amounts of extractable
ammonia and nitrate in these plots. These will provide an excellent data base against
which to test our nitrogen mineralization models and to determine the effects of nitrogen
mineralization on the above and below ground production of each of the species.
46
The single-species plots will determine if the different qualities of litter
produced by each of these species have a long-term feedback effect on the nitrogen cycle.
Although it will take several years for a litter layer to develop and influence nitrogen
mineralization rates, these five species differ greatly in C:N ratios and lignin content.
Only experimental monocul tures can determine the long-term feedback effects of individual
species on soil dynamics. Thus, these new experiments are a critical part of our attempt
to understand the linkages between plant and soil dynamics.
These experiments will also provide a detailed test of the ways in which soil
nitrogen mineralization rates and light interception influence interspecific plant
competition. Up until now, almost all work on terrestrial plant competition (see review
in Harper 1977) has been qualitative and phenomenological. It has described the outcome
of the interaction, but could not predict the outcome based on a priori information. We
believe that it should be possible to predict the outcome of interspecific plant
competition using information on the resource dependence of plant growth (see Tilman
1982). The monoculture experiments will provide the information that theory says is
needed to predict the outcome of competition. Thus, these experiments will provide the
first test of the validity of resource competition theory for terrestrial plants. If this
theory can predict the outcome of interspecific competition, it would have immediate
application to many agricultural and forestry problems. We believe that these experiments
are a logical and critical step in our attempt to synthesize the mechanisms of
interspecific interactions into an ecosystem perspective that includes decomposer
dynamics and plant/decomposer/nutrient feedback effects.
3- N15 Uptake - Spatial and Seasonal Dynamics in Natural Vegetation
This research is testing the hypothesis that the dominant primary producer species
are differentiated in their timing and location of nitrogen uptake, and that such niche
differences facilitate the coexistence of these plant species. These experiments,
performed in Field C, involved replicated plots into which N15 was injected at two
different depths (2 cm and 12 cm) at each of three different times of the year. N15
47
uptake is being monitored using foliar samples for the seven most abundant species in the
ratio analysis of the first samples has shown significant between-treatment differences
and clear niche separation by depth for several species. An exciting direction for
future work in this area is to look for niche shifts in pairs of selected species. Thus,
assuming that our analyses of these data, once completed, shows this to be a valuable
technique, we plan to apply it to interspecific interactions in our long-term monoculture
and competition experiments.
4. Nitrification and Soil pH
In conjunction with Dr. Edwin Schmidt, Department of Microbiology, University of
Minnesota, we have established a full factorial soil pH x soil nitrogen experiment. This
experiment is designed to determine the effects of soil pH and nitrogen supply on the
population dynamics of both nitrifying bacteria and vascular plants. Our sampling will
begin in 1986. This work adds another major physical factor, soil pH, to those studied at
Cedar Creek, and could potentially help tie together the dynamics of major decomposer and
producer species.
I. Syntheses: Theoretical and Intersite
Our research program is motivated by a series of broad, general ecological
hypotheses. Although it is absolutely necessary to perform detailed experimental and
observational tests of these hypotheses in a particular ecosystem, as we are doing at
Cedar Creek, we firmly believe that our research is providing insights and a theoretical
framework that apply to all ecosystems. It is our goal to understand the general
mechanisms of interaction among species and between species and their physical
environment, and to synthesize these into a theory of ecosystem structure and function.
Our work represents a constant process of feedback between theory, experimentation and
observation. Our initial hypothesis that foodweb (consumer-resource) interactions could
48
provide the necessary framework for such a synthesis has been reinforced many times
during the first four years of our LTER research, as has our belief in the value of
integrating evolutionary, population, and ecosystem perspectives.
Several of our published papers reflect the synthetic approach we are taking. In one
paper (Tilman 1986a) we have suggested that the same processes that select for different
plant life histories, morphologies and physiognomies along current productivity gradients
were also responsible for the pattern of evolution of land plants from single-celled
algae 350 million years ago. We further suggested that this link between ecosystem
productivity and the evolution of plant life histories and morphologies is the major
factor leading to convergent evolution in the biomes of the world. We have recently
developed an explicit size-dependent model of plant competition to explore these ideas in
more depth. The results of this further theoretical work as well as a synthesis of the
first four years of research at Cedar Creek are being prepared for publication as a book
that has been accepted for publication by Princeton University Press. We have also
developed a new theory of succession, "the resource ratio hypothesis of succession"
(Tilman 1985). This theory, which includes plant life history differences, plant
competitive abilities, and soil nutrient and light availabilities, predicts that there
should be a continuum between primary successions, secondary successions on poor soils,
and secondary successions on rich soils, but that the relative importance of plant life
histories, competitive abilities and habitat modification change along this continuum. A
third major synthetic paper presents and analyzes a multi-trophic-level model of foodweb
interactions, and discusses its generality and applicability (Tilman 19860).
Because it is our long-term goal to explain those general patterns that occur across
the world's ecosystems, we will continue to seek and test beth empirical and theoretical
syntheses. The LTER network provides us with a unique opportunity to make such syntheses,
for it spans a wide range of ecosystem types. We have already begun a number cf studies
at Cedar Creek that can be directly compared with research being performed at other LTER
sites. Specifically:
49
(1) A major theme of the Niwot Ridge LTER project is that disturbance tends to increase
the rate at which ecosystems change toward a state that reflects current environmental
conditions. Our microplot experiments provide an opportunity to test this hypothesis and
to compare old field ecosystems with tundra. We imposed identical nitrogen gradients in
the disturbed and the undisturbed nitrogen gradient microplots. Our results to date
strongly suggest that the disturbed and undisturbed plots are converging and that the
disturbed plots are responding somewhat more rapidly (Figs, 10 and 12). Dave Tilman plans
to visit Pat Weber at Niwot Ridge this swnmer to establish the framework for comparisons
between Cedar Creek and Niwot Ridge.
(2) A central focus of the Konza LTER project is the role of disturbance by fire in
structuring the prairie ecosystem, Fire was also historically important at Cedar Creek.
Thus, we have established a series of permanent sampling quadrats within a 145 ha block
of oak savanna that was divided into 12 plots that have been subjected to various burn
frequencies since 1966. We have also begun an experiment on the effect of fire
disturbance frequencies on the pattern of old field succession. The data collected in
these two experiments will allow us to make extensive comparisons of the effects of fire
on Cedar Creek versus Konza vegetation, soils, and herbivores.
(3) Fossorial mammalian herbivores are of great importance both at Cedar Creek and at the
Niwot Ridge LTER site. At both sites, these organisms are a major source of soil
disturbance and thus have a potentially major impact on a variety of local and landscape
patterns. John Tester (Cedar Creek) and Jim Halfpenny (Niwot Ridge) are working on a
comparison and cross-site synthesis of gopher impacts.
(4) We are also interested in cross-site comparisons of processes controlling the
seasonal and year-to-year dynamics of above-ground and below-ground productivity.
Tilman's recent theoretical work has led to some predictions of patterns of allocation to
above versus below ground processes that could be ideally tested using data from the
other terrestrial LTER sites.
50
(5) Another area of cross-site comparative work concerns the impact of herbivores on
primary producers. Analyses that we (Huntly, Inouye, Tilman, Tester) are just now
completing suggest that herbivores have'maximal impact in moderately productive habitats.
We are interested in seeing if this pattern holds, in general, across a wide range of
ecosystems. We already have some evidence that it may apply to aquatic foodchains
(Sterner 1986) as well as terrestrial foodchains. We (Huntly, Inouye and Tilman) plan to
organize an intersite symposium on this question, as we believe that almost all LTER
sites have data that are relevant to this question.
(6) Briand and Cohen (1984) have suggested that all foodchains have a similar structure,
with an approximately constant proportion of the total ecosystem species richness
occurring on each trophic level. The actual proportions that they reported from a survey
of 62 foodchains agree amazingly well with predictions of consumer-resource theory
(Tilman 19860). However, this agreement may be caused more by the taxonomic biases of the
investigators than by actual patterns. We plan to determine if the data being collected
at the other LTER sites on primary producer, herbivore, predator, and decomposer species
can provide additional tests of these ideas.
(7) The broad range of ecosystems included in the LTER network provide a major
opportunity to test the generality of the consumer-resource theory that we are
developing. To this end, we propose establishing one set of Unfenced Nitrogen Gradient
Microplot experiments at the Niwot Ridge LTER site and one at the Jornada Desert LTER
site. The serpentine soils of northern California, such as at Jasper Ridge, would be an
ideal site for a third set of plots. We have chosen these sites because they are
dominated by herbaceous vegetation, but they differ dramatically in their soils and
climate from Cedar Creek. Although these experiments would require a considerable
dedication of time by Tilman, they are of critical importance in determining the
generality of the Cedar Creek results.
There are many other areas in which we are collecting data that are of potential
intersite interest, including data on the controls of nitrogen mineralization rates,
51
litter decomposition rates, seasonal patterns of primary productivity, grasshopper
dynamics, precipitation chemistry, and nitrogen leaching loss rates, Although the long
term experiments and observations are the main focus for the Cedar Creek LTER project, we
designed these experiments to answer a series of broad ecological questions. We are eager
to form contacts with other sites so that we may determine the generality of our
experimental and theoretical results. As the LTER network has developed, an increasingly
great portion of our efforts have gone toward syntheses and cross-site comparisons. With
the cross-site experimental work that is currently in operation and that we are planning,
we feel justified in asserting that more than 15% of our annual budget is being spent on
such syntheses and cross-site comparisons (see Section C of the budget justification).
J. SmtWlY
During the first four years of the Cedar Creek LTER project, we have established a
wide array of well-replicated, long-term experiments and a series of long-term
observational plots in successional fields and native oak savanna. Twelve of our major
field projects, and the frequency with which various physical and biotic components will
be and have been measured, are summarized in Table 2. The central goal of our work is to
understand the various direct and indirect processes that structure successional
ecosystems and that lead to the patterns of succession that we observe at Cedar Creek and
in other habitats. Our work is an attempt to place the mechanisms of interspecific
interaction into the framework of the entire ecosystem, As suggested by Figure 2 and
Table 1, we consider all the various elements of our project to be interrelated, We are
focusing our work on disturbance, soil processes, plant/soil interactions,
herbivore/plant interactions, and herbivore/soil interactions. We believe that the
qualitative similarities of succ~ssion worldwide (MacMahon 19B1) suggests that there are
a few general processes that underlie successional dynamics worldwide. As our
experimental work clarifies the role of various ,processes in control ling succession at
Cedar Creek, we will continually apply our results to other areas to try to determine how
52
.TABLE 2. PROPOSED SAMPLING FREQUENCY FOR THE PERMANENT CEDAR CREEK LTER EXPERIMENTS.
The following codes are used to indicate the frequency with which a particular item or process has been and will be measured within a particular experimental or observational plot. See text for a full description.
A= Sampled every other week of the growing season B = Sampled 2 to 4 times per growing season C = Sampled once each year D = Sampled every other year E = Sampled every 3 or 4 years F = Sampled every 5 to 7 years N = Not sampled
ITEM BEING MEASURED OR OBSERVED
Experiment Vegetation Root Mass Litter Soil Chem Herbivores Disturbance
Single Nutrient
Undisturbed N Gradient Microplots
Disturbed N Gradient
C
C
Micro plots C
Nitrogen Gradients with Herbivores D/A 1
Macroplot N Gradients D
Macroplot Herbivore Exclosures D
Old Field Chronosequence F
Oak Savanna Burns F
Fire and Secondary Succession E
Deer Exclosures C
pH, N & Nitrification D
Long-Term Monoculture & Competition B
N
N
N
N
N
F
F
E
N
D
B
C
C
C
D
D
F
F
E
N
D
B
1 Sampled every other week in two field seasons only.
C
C
C
D
D
F
F
E
E
B
B
C
B
B
B
B
B
F
F
E
B
D
B
C
B
B
B
B
A
F
F
E
C
D
N
general they are.
Most of the research that we propose for the next funding period represents a
continuation and extension of our present work. Although we will perform other short-term
studies on particular processes, the focus of our efforts is our long-term plots. We
firmly believe that the field of ecology needs long-term experimentation in order to
understand the processes that cause the patterns we see in nature. Only experimentation
can separate spurious correlation from causation. Only experimentation can demonstrate
the total effect of one element of an ecosystem on another element. Long-term experiments
are needed because of the long life spans of many organisms, and because indirect
effects, which are propagated through other species and processes, necessarily take
longer than direct effects. The strongest argument for the need for long-term
experiments, though, comes directly from our experimental results to date. For both
plants and herbivores, we have seen highly significant transient responses (e.g., Fig.
9) to our experimental manipulations. These transient responses, probably caused by
differences in maximal growth rates, in initial starting conditions, and in time scales
for direct versus indirect effects, may well prove to be the opposite of the long-term
effect of the manipulations. Whatever their cause, the presence of such transient
responses provide an important warning: the response of an ecosystem to an experimental
manipulation depends on the time scale on which it is measured. Up to the present time,
most ecological theory has been concerned with the long-term effect of various processes.
However, this theory has most often been "tested" using short-term experiments. Such
experiments, despite their apparent statistical rigor, may not have tested the
hypotheses proposed, The Cedar Creek experiments can provide a uniquely thorough, long
term record of the ways in which various direct and indirect effects influence the
structure and dynamics of successional communities.
53
III. LITERATURE CITED
Abul-Fatih, H,A,, and F.A. Bazzaz. 1979. The biology of Ambrosia trifida L, I. The influence of species removal on the organization of the plant community, New Phytologist 83:813-816,
Al-Mufti, M., C, Sydes, S. Furness, J. Grime, and S. Band, 1977, A quantitative analysis of shoot phenology and dominance in herbaceous vegetation. Journal of Ecology 65:759-792,
Bakelaar, R. and E. Odum, 1978, Community and population level responses to fertilization in an old-field ecosystem. Ecology 59:660-671,
Beadle, N.C.W. 1954, Soil phosphate and the delimitation of plant communities in eastern Australia, Ecology 35:370-375,
Beadle, N,C,W, 1966, Soil phosphate and its role in molding segments of the Australian flora and vegetation, with special reference to xeromorphy and sclerophylly. Ecology 35:370-375,
Behrend, A,F. and J.R. Tester. In review. Aspects of the feeding ecology of the plains pocket gopher (Geomys bursarius) at Cedar Creek Natural History Area, Minnesota.
Belovsky, G,E. 1978, Diet optimization in a generalist herbivore: the moose. Theoretical Population Biology 14:105-134,
Bond, W. 1983, On Alpha diversity and the richness of the Cape flora: a study in southern cape fynbos. In F,J, Kruger, D.T. Mitchell, and J, U, M. Jarvis, eds.Mediterranean~ Ecosystems. Springer-Verlag Berlin, Germany 552 pps.
Brenchley, W. 1924. Manuring of Grassland for Hay. Rothamsted Monographs on Agricultural Science, Harpendon, U,K. 144 pp.
Brenchley, W. and K. Warrington, 1958, The Park Grass Plots at Rothamsted. Rothamsted Experimental Station, Harpendon, U.K. 144 pp.
Briand, F. and J. Cohen. 1984. Community food webs have scale-invariant structure. Nature 307:264-267.
Brown, J,H., D.W. Davidson, J.C. Munger, and R.I. Inouye. 1986. Experimental community ecology: The desert granivore system. Pages 41-61 in J. Diamond and T. Case, Eds., Community Ecology. Harper and Row, New York.
Brown, V.K. 1985. Successional patterns in plant and insect communities. The Linnean Society of London.
Chapin, F.S., III. 1980. The mineral nutrition of wild plants. Annual Review of Ecology and Systematics 11 :233-260.
Clements, F.E. 1916. Plant Succession. Carnegie Institute Washington Publication 242. 512 pp.
Cody, M.L. and H.A. Mooney. 1978, Convergence versus nonconvergence in Mediterraneanclimate ecosystems. Annual Review of Ecology and Systematics 9:265-321.
Connell, J.H. and R.O. Slatyer. 1977. Mechanisms of succession in natural communities and their role in community stability and organization. American Naturalist 111:1119-1144.
Connell, J.H. and W.P. Sousa. 1983. On the evidence needed to judge ecological stability or persistence. American Naturalist 121:789-824.
Cooper, W.S. 1913, The climax forest of Isle Royale, Lake Superior and its development. Botanical Gazette 55: 1-44, 115-140, 189-235,
Cowles, H.C. 1899. The ecological relations of the vegetation on the sand dunes of Lake Michigan. Botanical Gazette 27:95-117, 167-202, 281-308, 361-391.
Crocker. R,L., and J, Major. 1955, Soil development in relation to vegetation and surface age at Glacier Bay, Alaska. Journal of Ecology 43: 427-448.
Davis, M.B. 1986. Climatic instability, time lags, and community disequilibrium. Pages 269-284 in J. Diamond and T. Case, eds., Community Ecology. Harper and Row, Inc., New York.
Davis, M.B. and D.B. Botkin. 1985. Sensitivity of cool temperate forests and their fossil pollen record to rapid temperature change. Quaternary Research 23:327-340.
Dix, R., and F. Smeins. 1967. The prairie, meadow and marsh vegetation of Nelson County, North Dakota, Canadian Journal of Botany 45:21-58.
Drury, W.H., and I.C.T. Nisbet. 1973, Succession. Journal of the Arnold Arboretum 54:
54
331-368. Elberse, W.Th., J.P. van den Bergh, and J.G.P. Dirven. 1983. Effects of use and mineral
supply on the botanical composition and yield of old grassland on heavy-clay soil. Netherlands Journal of Agricultural Sciences 31:63-88.
Eno, C.F. 1960. Nitrate production in the field by incubating the soil in polyethylene bags. Soil Science Society of America Proceedings 24:277-279.
Fretwell, S.D. 1977. The regulation of plant communities by food chains exploiting them. Perspectives in biology and medicine 20:169-185.
Gleason, H.A. 1917. The structure and development of the plant association. Bulletin of the Torrey Botanical Club 44:463-481.
Gorham, E., P.M. Vitousek, and W.A. Reiners. 1979. The regulation of chemical budgets over the course of terrestrial ecosystem succession. Annual Review cf Ecology and Systematics 10:53-84.
Grigal, D.F., L.M. Chamberlain, H.R. Finney, D.V. Wroblewski, and E.R. Gross. 1974. Seils of the Cedar Creek Natural History Area. Miscellaneous Report 123, University of Minnesota Agricultural Experiment Station, Saint Paul, Minnesota, USA.
Grime, J. 1973. Control of species density in herbaceous vegetation. Journal of Environmental Management. 1: 151-167.
Grime, J. 1979. Plant Strategies and Vegetation Processes. John Wiley and Sons, Ltd., Chichester. 222 pp.
Grubb, P.J. 1986. Problems posed by sparse and patchily distributed species in speciesrich plant communities. Pages 207-226 in J. Diamond and T. Case, eds., Community Ecology. Harper and Row Publishers, New York.
Harper, J.L. 1969. The role of predation in vegetational diversity. Pages 48-62, in Diversity and stability in ecological systems, Brookhaven Symposium in Biology 22.
Harper, J.L. 1977. Population Biology of Plants. Academic Press, New York. Hils, M.H. and J,L. VanKat. 1982. Species removals from a first-year old-field plant
community. Ecology 63:705-711. Holdridge, L., W. Grenke, W. Hatheway, T. Liang, and J. Tosi,Jr. 1971. Forest
Environments in Tropical Life Zones: _! Pilot Study. Pergamon Press, Oxford. Holt, R.D. 1977. Predation, apparent competition and the structure of prey communities.
Theoretical Population Biology 12:197-229, Horn, H.S.1981. Some causes of variety in patterns of secondary succession. Pages 24-35
in D.C. West, H.H. Shugart, and D.B. Botkin, editors, Forest Succession concepts and application, Springer-Verlag, New York, New York USA.
Huston, M. 1980. Soil nutrients and tree species richness in Costa Rican forests. Journal of Biogeography 7:147-157.
Inouye, R.S. and N.J. Huntly. In review. Fine-scale microhabitat selection by small mammals in response to fertilization and disturbance in old fields in Minnesota.
Inouye, R.S. and D. Tilman. In review. Convergence and divergence along experimental nutrient gradients.
Inouye, R.S., N.J. Huntly, D. Tilman, J.R. Tester, M. Stillwell, and K.C. Zinnell. 1986. Old field succession on a Minnesota sand plain. Ecology, in press.
Kirchner, T. 1977. The effects of resource enrichment of the diversity of plants and arthropods in a shortgrass prairie. Ecology 58:1334-1344.
Lawes, J., and J. Gilbert. 1880. Agricultural, botanical and chemical results of experiments on the mixed herbage of permanent grassland,conducted for many years in succession on the same land.I. Philosophical Transactions of the Royal Society 171: 189-416.
Lawlor, L.R. 1979. Direct and indirect effects of n-species competition. Oecologia 43:355-364.
Lawrence, D.B. 1958. Glaciers and vegetation in Southeastern Alaska. American Scientist 46:89-122.
Levine, S.H. 1976. Competitive interactions in ecosystems. American Naturalist 110:903-910.
Lewontin, R.C. 1969. The meaning of stability. Pages 13-24 in Diversity and Stability in Ecological Systems. Brookhaven Symposium on Biology, no. 22.
Luce, D.G., R.M. Case, and J. Stubbendieck. 1980. Food habits of the plains pocket gopher on western Nebraska rangeland. Journal of Range Management 33:129-131.
55
Lynch, M. 1978. Complex interactions between natural co-exploiters--Daphnia and Ceriodaphnia. Ecology 59:552-564.
MacMahon, J.A. 1981. Successional processes: comparisons among biomes with special reference to probable roles of and influences on animals. Pages 277-304 in D.C. West, H.H. Shugart, and D.B. Botkin, eds., Forest Succession: Concepts and
-Applications. Springer-Verlag, New York. May, R.M. 1977. Thresholds and breakpoints in ecosystems with a multiplicity of stable
states. Nature 269:471-477. May, R.M. 1979. The structure and dynamics of ecological communities. Pages 385-407 in
R.M. Anderson, B.D. Turner, and L.R. Taylor, eds., Population Biology. Blackwell Scientific, Oxford.
McIntosh, R.P. 1981. Succession and ecological theory. In D.C. West, H.H. Shugart and D.B. Botkin, eds. Forest Succession: Concepts and Application. Springer-Verlag, New York.
McNaughton, S.J. 1979. Grassland-herbivore dynamics. In A.R.E. Sinclair and M. NortonGriffith, eds., Serengeti: dynamics of ~ ecosystem. University of Chicago Press, Chicago.
Milton, W. 1947. The yield, botanical and chemical composition of natural hill herbage under manuring, controlled grazing and hay conditions. I. Yield and botanical composition. Journal of Ecology 35:65-89.
Molina, J.A.E., C.E. Clapp, M.J. Shaffer, F.W. Chichester, and W.E. Larson. 1983. NCSOIL, a model of nitrogen and carbon transformations in soil: description, calibration, and behavior. Soil Science Society of America Journal 47:85-91.
Moore, B. 1933. Oak woodlands on clay in southwestern England and scarcity of natural regeneration of oak. Forestry 7.
Myers, G.T. and T.A. Vaughan. 1964. Food habits of the plains pocket gopher in eastern Colorado. Journal of Mammalogy 45:588-598.
Nadelhoffer, K.J., J.D. Aber, and J.M. Melillo. 1983. Leaf litter production and soil organic matter dynamics along a nitrogen availability gradient in southern Wisconsin (USA). Canadian Journal of Forest Research 13:12-21.
Odum, E.P. 1960. Organic production and turnover in old field succession. Ecology 41:34-49.
Oksanen, L., S.D. Fretwell, J. Arrud and P. Niemela. 1981. Exploitation ecosystems in gradients of primary productivity. American Naturalist 118:240-261.
Olson, J.S. 1958. Rates of succession and soil changes on southern Lake Michigan sand dunes. Botanical Gazette 119: 125-169.
Orians, G.H. 1980. Micro and macro in ecological theory. Bioscience 30:79. Parton, W.J., J. Perrson, and D.W. Anderson. 1983. Simulation of organic matter in
Swedish soils. Pages 511-516 in L.W. Lauenroth, G.V. Skogerboe and M. Flug, eds., Analysis of Ecological Systems: State of the Art in Ecological Modelling. Elsevier Scientific Publishing Company, Amsterdam, Netherlands.
Pastor, J., J.D. Aber, C.A. McClaugherty, and J.M. Melillo. 1984. Aboveground production and N and P cycling along a nitrogen mineralization gradient on Blackhawk Island, Wisconsin. Ecology 65: 256-268.
Pastor, J., M.A. Stillwell, and D. Tilman. In preparation. Litter dynamics in Minnesota old fields.
Peet, R.K., and N.L. Christensen. 1980. Succession: a population process. Vegetation 43:131-140.
Pielou, E.C. 1984. The Interpretation of Ecological Data. John Wiley and Sons, New York. 263 pp.
Pierce R.L. 1954. Vegetation cover types and the land use history of Cedar Creek Natural History Reservation, Anoka and Isanti Counties, Minnesota. M.S. Thesis, University of Minnesota.
Rice, E.L., W.T. Penfound, and L.M. Rohrbaugh. 1960. Seed dispersal and mineral nutrition in succession in abandoned fields in central Oklahoma. Ecology 41 :224-228.
Schaffer,W.M. 1981. Ecological abstraction: the consequences of reduced dimensionality in ecological models. Ecological Monographs 51:383-401.
Schimel, D., M.A. Stillwell, and R.G. Woodmansee. 1985. Biogeochemistry of C, N, and P on a soil catena of the shortgrass steppe. Ecology 66:276-282.
56
Seastedt, T.R. 1985. Maximization of primary and secondary productivity by grazers. American Naturalist 126:559-564.
Silvertown, J. 1980. The dynamics of a grassland ecosystem: botanical equilibrium in the park grass experiment. Journal of Applied Ecology 17:491-504.
Specht, R.L. and P. Rayson. 1957. Dark Island Heath (Ninety Mile Plain, South Australia) I. Definition of the ecosystem, Australian Journal of Botany 5:52-85.
Steel, R,G,D,, and J.H. Torrie, 1980, Principles and Procedures of Statistics, McGrawHill, New York, New York, USA,
Sterner, R.W. 1986. Herbivores' direct and indirect effects on algal populations, Science 231:605-607,
Strauss, S. In review. Direct and indirect effects of host plant fertilization on an insect herbivore community.
Strobeck, C, 1973, N species competition. Ecology 54:650-654. Summerhayes, v.s. 1941. Effects of voles (Microtus agrestis) on vegetation. Journal of
Ecology 29:14-48. Tansley, A.G. 1949. The British Isles and Their Vegetation, Cambridge Press, Cambridge. Tilman, D. 1980. Resources: a graphical-mechanistic approach to competition and
predation. American Naturalist 116:362-393, Tilman, D, 1982. Resource Competition and Community Structure, Princeton University
Press, Princeton, New Jersey, USA, Tilman, D. 1983, Plant succession and gopher disturbance along an experimental gradient.
Oecologia 60:285-292, Tilman, D. 1984. Plant dominance along an experimental nutrient gradient. Ecology
65:1445-1453, Tilman, D. 1985, The resource ratio hypothesis of succession, American Naturalist
125:827-852. Tilman, D. 1986a, Evolution and differentiation in terrestrial plant communities: the
importance of the soil resource: light gradient. In T. Case and J, Diamond, eds., Community Ecology. Harper and Row, New York.
Tilman, D, 1986b, Nitrogen-limited growth in plants from different successional stages, Ecology, in press.
Tilman, D. 1986c. A consumer-resource approach to community structure. American Zoologist, in press,
Tilman, D, #1 In review. Secondary succession and the pattern of plant dominance along experimental nitrogen gradients.
Tilman, D. #2 In review. Do old-field plant communities have multiple stable equilibria? Vandermeer, J,H. 1980. Indirect mutualism: variations on a theme by Stephen Levine,
American Naturalist 116:441-448, Vitousek, P.M. and P.A. Matson. 1985, Disturbance, nitrogen availability, and nitrogen
losses in an intensively managed loblolly pine plantation. Ecology 66:1360-1376, Walker, J,, C.H. Thompson, I.F. Fergus, and B.R. Tunstall. 1981, Plant succession and
soil development in coastal sand dunes of subtropical eastern Australia. In D,C, West, H,H, Shugart, and D,B, Botkin, eds. , Forest Succession: Concepts and Application. Springer-Verlag, New York,
Westermann, D.T. and S,E, Crothers. 1980, Measuring soil nitrogen mineralization under field conditions. Agronomy Journal 72:1009-1012,
White, A,S. 1983, The effects of thirteen years of annual prescribed burning on a Quercus ellipsoidalis co!llllunity in Minnesota. Ecology 64:1081-1085.
Whittaker, R.H., and W.A. Niering, 1975, Vegetation of the Santa Catalina mountains, Arizona, V. Biomass, production, and diversity along the elevation gradient. Ecology 56:771-790,
Willis, A., and E. Yemm. 1961, Braunton Burrows: mineral nutrient status of the dune soils. Journal of Ecology 49:377-390,
Zedler, J., and P. Zedler, 1969, Association of species and their relationship to microtopography within old fields, Ecology 50:432-442,
Zinnel, K,C, and J,R. Tester. In preparation. Effects of pocket gophers (Geomys bursarius) on root biomass,
57
IV. PERSONNEL
A. The LTER Working Group
Cedar Creek is used the year around primarily by research scientists and graduate students involved in research. Because it is only a 40-minute drive from the University of Minnesota, researchers have the dual advantages of a natural area and nearby urban facilities. Most scientists working at Cedar Creek have been from the University of Minnesota. However, Cedar Creek has funds that are available each year specifically to encourage outside researchers to start a project at Cedar Creek. Such funds have helped Dr. James Reichman (Kansas State University), and Dr. Mark Davis (Macalester College) start projects at Cedar Creek.
Cedar Creek has a full-time, year-around staff that includes a resident manager (David Bosanko), a secretary (Bev Medvecky), a chief electronics engineer (Larry Kuechle), an associate scientist (Richard Reichle), and a teaching assistant (Kathleen Zinnel). In addition, during the spring, summer and autumn, up to 40 more individuals work at Cedar Creek on a variety of ecological research projects. The LTER project is the largest of these. The researchers most heavily involved in the LTER project are:
Faculty and Post-Doctoral
Dr. David Tilman, Professor, Department of Ecology and Behavioral Biology,• U of M Dr. John Tester, Professor, Department of Ecology and Behavioral Biology, U of M Dr. David Grigal, Professor, Department of Soil Science, U of M Dr. Richard Inouye, Post-Doctoral Researcher and LTER Site Manager Dr. Nancy Huntly, Post-Doctoral Researcher on the LTER project Dr. John Pastor, Research Associate (20% time on LTER)
Graduate Students
David Wedin, NSF Pre-Doctoral Fellow (Advisor: D. Tilman) Robert McKane, Ph. D. student (Advisor: D. Grigal) Mike Norland, Ph. D. student (Advisor: D. Grigal) Jeff Brokaw, Ph. D. student (Advisor: P. Regal) Robert Sterner, NSF Pre-Doctoral Fellow (Advisor: D. Tilman) Rebecca Goldburg, Ph. D. student (Advisor: P. Morrow) Sharon Strauss, Ph. D. student (Advisor: D. Strong, Florida State U.) Mark McKone, Ph. D. student (Advisor: E. Cushing; Ph. D. completed 9/85) Taber Allison, Ph. D. student (Advisor: P. Jordan) Kathleen Zinnel, Ph. D. student (Advisor: J. Tester) Mary Cowan, M.s. student (Advisor: D. Tilman) Andrew Behrend, M.S. student (Advisor: J. Tester; M.S. completed 9/85)
Because most graduate students at the University of Minnesota are supported by University fellowships or by Teaching Assistantships, the LTER project can attract student researchers by offering just supply and equipment funds. In addition to the individuals listed above, there are several other scientists whose research has been partially supported by LTER funds or whose projects have built on or been coordinated with the LTER project:
Dr. James Reichman, Department of Biology, Kansas State University Dr. Edwin Schmidt, Departments of Microbiology and Soil Science, U of M Dr. Patrice Morrow, Department of Ecology and Behavioral Biology, U of M Dr. Marie Davis, Department of Biology, Macalester College, st. Paul, MN Dr. David Tonkyn, Post-Doctoral Researcher, Ecology and Behavioral Biology
58
To this group must be added the cadre of undergraduates who have worked as field assistants each year, The LTER project hires 10 - 12 field assistants each summer (five of these with funds provided by the Field Biology Program), These indi victuals, most of them undergraduate biology majors or incoming ecology graduate students, are coordinated by two crew leaders hired by the LTER project, and are overseen by our Site Manager, Dr. Richard Inouye.
The current group of researchers has a range of skills and research interests that complement each other and span the full breadth of questions that we are pursuing (see attached Vitae for details). The main focus for this project, and its continuity, are provided by the long-term experimental and observational plots that we have established and by the tenured University of Minnesota faculty researchers, especially the Principal Investigator, David Tilman. In any research group of this size, it is natural for its composition to evolve through time as various scientists complete their projects and as others are attracted to the group, perhaps because of new questions or problems that arise. However, we believe that the long-term experimental and observational plots we have established, our thorough documentation of our experimental design and data, our data management, and the commitment of senior researchers wil 1 assure the long-term continuity and viability of this project.
B. Project Organization and Data Management
The Cedar Creek LTER project is a coordinated, multi-investigator effort designed to address the questions posed in this (and the preceeding) proposal. The project is coordinated by David Tilman, the PI. When we started the project, we decided that we could accomplish our research goals most effectively by establishing a rigorous series of field experiments that we would monitor on a regular basis for the duration of the project. We believe that such experiments are absolutely essential if we are to help make ecology a potentially predictive, mechanistic science, In addition, these experiments are providing a pool of common, shared information that individual investigators can use in building and testing various synthetic hypotheses. For these reasons, we have allocated a large portion of our resources to establishing, sampling and managing the data that come from our experimental plots, These data will provide the tests of our major hypotheses and are the framework upon which all our synthetic and theoretical efforts are built. However, we have also felt that our project needed more breadth than could be provided by our 10 major field experiments. To attain this breadth, we have hired post-doctoral researchers and have encouraged faculty and graduate students to perform additional work in the experimental plots or in the same fields in which the experiments are located, This has the dual advantages of allowing these investigators to know much more about the biology of the organisms they are woking on and providing the project with knowledge of other processes at work in these fields. This approach, we believe, has allowed our project to have an unusually strong experimental approach at the same time that it has significant breadth.
The large number of samples we collect caused us to have sample analysis and data management problems during our first two years. For instance, during the first field season we collected more than 3000 soil samples to establish pre-treatment soil chemistry for all our experimental plots. In order to analyze these for total nitrogen, pH, P, K, Ca, Kand Mg, we had to establish a highly automated soil chemistry laboratory. We have now done that, Our analytical instruments (balances, a one-channel Autoanalyzer, and a two-channel Autoanalyzer) are all interfaced with microcomputers that served as data loggers and data analyzers. These allow us to accurately analyze several hundred soil chemistry samples per day, and to have the data immediately added to our data base. Our project employees a ful 1-time indi victual at the level of "Junior Scientist" to run our chemistry laboratory as well as several part-time student laboratory technicians.
We solved our second major problem using similar technology. Because we sort all our field samples to species, we have to weigh more than 10,000 plant samples each summer.
59
The first year we weighed the samples, manually recorded the data on data sheets, entered the data into a computer data base, verified the data, and then manipulated the data to have proper units, We have greatly simplified those steps and increased our accuracy by interfacing electronic balances with microcomputers, Now, in the time required for a balance to weigh a sample, we enter the sample code into the microcomputer, and the microcomputer records the weight,, We have written software that transforms these data files into the form needed by our data management software. Thus, at the end of every week of the field season, we have available to us the final data base detailing the data that have just been collected.
Data management, itself, was our third major problem. We initially tried using mainframe computer data management software and statistical packages. However, we found this to be cumbersome, expensive (more than $15,000 per year in computer charges), and lacking the interactive graphics capabilities crucial for understanding large data sets, We have now switched to IBM-XT microcomputers and use Knowledgeman and Statgraphics software. The relational data base management system and the interactive graphics capabilities of these packages, combined with the ability of hard disks to store large data sets, has been an ideal comibination. In addition to the technological side of data management, we have spent much time throughly documenting all our data sets, and assuring that the various data sets are compatible. We have also found that data management is a full-time job. Our data manager is a full-time employee with a M.S. in statistics,
The data collected in our field experiments, the services of our chemistry laboratory, and the services of our data manager are available to all members of the LTER working group. These data and services, and the focus provided by our coordinated field experiments and observations, are the major elements binding together the different researchers in the Cedar Creek LTER project.
60
BIBLIOGRAPHY
(In additi.on to the papers listed below, Dr. Tester had published 39 pay,ers prior to 1971,) ·
jj;hneider, D.B., L.D. t-ech and J.R. Tester. 1971. t-tivements of female raccoons and their young as determined by radio tracking. llnimal Behavior ltlnogra,:x,s 4(1):1-43.
Siniff, o.a., J.R. Tester and v.a. Kuechle. 1971. Some observations on the activity patterns of Weddell Seals as recorded by telemetry, /lntarctic Pinnipedia, Antarctic Fesearch Series, 18:173-180.
Rongstad, 0.J. and J.R. Tester. 1971. Behavior and maternal relations of yOtX1g snowshoe hares. J. Wild!. t-enage. 35(2):338-346.
Tester, J.R., o.B. Siniff and C.R. Jessen. 1971. Use of telemetry as a means of studying spacing and behavior of animals. In Esser, A., editor. Behavior and Environment, Proceedings Intl. Symp. on Use of Space by Pnimals and t-en. Plenum Press, New York. pp. 117-120.
Tester, J.R. 1971. Interpretation of ecological and behavioral data on wild animals obtained by telemetry with special reference to errors and uncertainties. In Symposium on Biotelemetry, Pretoria, South Africa, ~vent>er l97r. pp. 383-408.
Schladweiler, J.L. and J.R. Tester. 1972. Survival and behavior of hand-reared mallards released in the wild. J. Wildl. Manage. 36(4):1118-1127.
Tester, J.R. and A. watson, 1973. Spacing and territoriality of woodcock Scolopax rusticola based on roding behaviour. Ibis 115:135-138.
Fuller, M.R. and J.R. Tester. 1973. An automatic radio tracking system for biotelemetry. Raptor Research 7(3/4):105-106.
Fuller, M.R., T.H. Nicholls and J.R. Tester. 1974. Raptor conservation and management applications of biotelemetry studies from Cedar Creek Natural History Area. Raptor Research Report 2:33-44.
Tester, J.R. and D.B. Siniff. 1974. Relevance of home range concepts to game biology. Intl. Cong. Game Biol. 11:287-296.
Gilmer, D.S., I.J. Ball, L.M. COwardin, J.H. Reichman and J.R. Tester. 197.5. Habitat use and home range of mallards breeding in Minnesota. J. Wild!. Manage. 39(4):781-789.
Storm, G.L., R.D. Andrews, R.L. Phillips, R.A. Bishop, D.B. Siniff and J.R. Tester. 1976. ltlrr:t,ology, reproduction, dispersal, and mortality of midwestern red fox po!JJlations. Wildlife ltlnogra,:x,s, lltl. 49, 82 pp.
Tester, J.R., J.W. Ternes and D.B. Siniff. 1977. ~avior and mortality of free-ranging raccoons, snowshoe hares, and striped skunks after exposure to 300 R gamma radiation. Radiation Res. 69:500-512.
81
winter, ·J.0., v.e. Kuechle, o.e. Siniff and J.R. Tester. 1978. Equiµnent and methods for radio tracking freshwater fish. Lhiv. of Minn. Pg. Exp. station, Miscellaneous Report 152, 18 pp.
1-k>useknecht, C.R. and J.R. Tester. 1978. D:!nning habits of striped sk1..11ks. Pmer. Midl. Nat. 100(2):424-430.
Tester, J,R. 1979, ~alysis of circadian rhythms of free-ranging manrnals. In Bio telemetry IV, Proc. 4th Inti. Symp. Bio telemetry. Garmisch-Partenkirchen, Germany, pp. 167-170.
Hoskinson, R.L. and J.R. Tester. 1980. Migration behavior of pronghorn antelope in southeastern Idaho. J. Wild!. M:inage. 44(1):132-144.
Pietz, P.J. and J.R. Tester. 1982. Habitat selection by sympatric spruce and ruffed grouse in north-central Minnesota. J. Wild!. M:lnage. 46(2):391-403.
Pietz, P.J. and J,R. Tester. 1983. Habitat selection by snowshoe hares in north-central Minnesota. J. Wild!. Manage. 47(3):686-696.
Er lien, 0.A. and J.R. Tester. 1984. Population ecology of sciurids in northwestern Minnesota. canadian Field Jleturalist. 98(1):1-6.
Figala, J., J. Tester and G. Seim. 1984. Analysis of the circadian rhythm of a snowshoe hare (L~puf americanus, Lagomorpha) from telemetry data. Vestnik Ces os ovenske Spolecnosti Zoologicke. 48:14-23.
Seal, U.S., 0.B. Siniff, J.R. Tester and T.0. Williams. 1985, Chemical immobilization and blood analysis of feral horses (Eguus caballus). J. Wild!. Disease. 21:411-416.
Figala, J. and J.R. Tester. In press. Comparison of seasonal rhythms of activity of grey squirrels in captivity and in the wild. Vestnik Ceskoslovenske Spolecnosti Zoologicke.
Tester, J.R. In press. Seasonal changes in activity rhythms of free-ranging animals. canadian Field Naturalist.
Siniff, o. B., J.R. Tester and G.L. 1-tl-ahon. In press. Foaling rate and survival of feral horses in western Nevada. J. Range M!nage.
Figala, J. 1 P. Filippi and J.R. Tester. Seasonal rhythm of foraging activity in a captive fenale nallard. S:Jbmitted to J. Wildl. M!nage.
Behrend, A.F. and J.R. Tester. Aspects of feeding ecology of the plains pocket gopher (Geomys tlursarius). S:Jbmitted to Ecology.
Inouye, R.S., N.J. Huntly, 0. Tilman, J.R. Tester, M. Stillwell, and K.C. Zinnel. Old field succession on a Minnesota sand plain. S:Jbmitted to Ecology.
82
A. BIJDGE'l' .nmIFICATIClf (First and Subsequent Years)
Although the following budget justification specifically lists the relevant amounts only for the first year of this four year project, each of the remaining three years is essentially identical to the first year, except that most salaries have been adjusted for inflation (assumed to be 5% per year). Thus, years 2, 3 and 4 are all budgeted with the same number and types of personnel as given here for year 1. Any substantive deviation from the justification listed for the first year is specifically listed on the Proposal Budget form (NSF Form 1030) for that year.
A. 1. Senior Pe."501Del
Although many faculty are actively engaged in the LTER project, most are supported on 12-month contracts, and thus do not need sumner salary. For that reason, when this project began we decided to limit summer support for senior personnel to the PI. This policy has allowed us to have more funds available to direcly support the post-doctoral researchers, research associates, graduate students and technicians who are more direclty involved in the day-to-day operation of the project. We feel that this policy has been a major reason that we have been able to establish and sample our wide range of experimental and long-term observational projects.
B. 1. Post-Doctora 1 Asaoc1 at--".s
a. Soils (Dr. John Pastor; 20% time as a "Research Associate") b. Soil/Ecosystem Ecology (full-time; being advertized now) c. Plant-Herbivore Interactions (Dr. Nancy Huntly) d. Plant-Soil Interaction.9 (full time; being advertized now)
$ 5,990. 18,488. 18,488. 18,488.
Post-doctoral research associates are a major source of breadth for the Cedar Creek project. Clearly, post-doctoral associates are not long-term appointments. However, such appointments allow the flexibility that is required in a long-term, evolving research program. Post-doctoral associates can be hired to answer specific research questions as they arise and encouraged to establish long-term experiments. We believe that many of these individuals will continue their coomittment to their research after they leave Cedar Creek. By hiring a sequence of post-doctoral associates with a broad range of skills and interests, we hope to build a core of researchers dedicated to the Cedar Creek program that is much more diverse than could ever be accomplished with the slow rate of turnover of university faculty.
There are three individuals who are currently appointed at the post-doctoral level: Dr. John Pastor, Dr. Nancy Huntly, and Dr. Richard Inouye. (Because Dr. Inouye is our Site Manager, he is officially in the "Other Professional" category below). Our new budget calls for us to hire two more post-doctoral researchers. Because of the importance of these position.9, we have already started to advertise them, and hope to them on-board for the 1986 field season. We will only co!L9ider those individuals who have proven their scientific productivity. From among this group we will chose those individuals whose expertise can broaden our project and help address the new questions that have been raised by our research.
B. 2. ot.her Professiomls
a. Site/Data Manager (Dr. Richard Inouye) $23,615. Dr. Inouye is responsible for the day-to-day supervision of our summer field crew. The Site/Data Manager also oversees data
88
collection and data management for the project.
b. Soil Chemist (Cliff Maddox, Junior Scientist) $21,396, Cliff Maddox works full-time running our analytical soil chemistry laboratory, He perfonns thousands of analyses of soil samples each year for such items as total soil nitrogen, extractable nitrate and anmonia, pH, sand/silt/clay, as well as analyzing atmospheric wet and dry fall and lysimeter samples.
B, 3, Graduate Students
One half-time graduate student, 12 months per year (Most Ecology graduate students are supported by fellowships,)
B, 4. Uooergraduate Students
a. Two "Crew Leaders" for the summer field crew ($2,575 each for 10 weeks of sunmer field work)
b. Five "Crew Members" for the summer field crew ($2,472 each for 10 weeks of sunmer field work)
$10,797,
$5,150,
$12,360,
The Cedar Creek project has a very ambitious sampling schedule. The only way that we are able to accanplish our research is by hiring undergraduate students who assist with sample collection, sorting, weighing and data entry. Our actual summer field crew is approximately twice the size budgeted, with the other individuals hired using funds provided by the University of Minnesota Field Biology Program.
B. 5. Secretarial-Clerical
This individual assists with many aspects of the research project, especially with data entry, data base management, microcanputer-assisted statistical data analysis, and microcomputer-assisted drafting,
C. Fringe Beoetits
The currently fringe benefit rates are 25,5% for faculty, 22% for civil service (including post-doctoral researchers), and 1.8% for graduate students. No fringe benefits are charged for undergraduate students.
D. Pennanent Equipnent
Although we have not yet identified the items we are likely to need, based on our past experience we will need about $12,000. for pennanent equipment.
E. Travel
1. Danestic $5,600. Attend Scientific Meetings (3 scientists at $350 each) Visit other LTER sites for intersite research (total of $3,400
for airfare, car rental, living expenses while perforndng research at other LTER sites and possibly one additional site)
2.Foreign $2,900. To visit and sample the Park Grass Experiments at the Rothamsted Experimental
Station, Harpendon, England. These experiments, which are probably the most long-tera ecological experiments in existence, were established over 130 year's ago, and al'e still in operation today (Tilman 1982). However, because of changes in the focus of the research staff at the Rothamsted Experimental Station, there al'e no longer any personnel at Rothamsted with the skills and desire to sample them. They have not been sampled since 1975 (ThU!'ston, Williams and Johnston 1976). I believe that it is essential that these, the most long-tera ecological experiments in existence, continue to be sampled. I feel especially strongly about this because the experiments are quite similar to the Cedar Creek macroplot nutrient addition experiments, and, indeed, helped inspire the Cedar Creek work. Although the Park Grass Experiments lack replicates of any treatments, they provide a unique, detailed, long-term view of the dynamics of unmanipulated and manipulated vegetation that is a perfect complement to the highly replicated Cedar Creek experiments. The University of Minnesota has granted me a Single Quarter Leave for next spring (a 3 month leave of absence with pay) so that I may sample the Rothamsted plots. However, I also require funds for airfal'e and living expenses. (I am trying to obtain the needed funds from several other soUl'ces, and will not use LTER funds if other sources become available.)
These funds will also allow me to present an invited paper on the Cedar Creek LTER Project at the International Botanical Congress in West Berlin, Ge!'many, 24 July to 1 August, 1987.
G. 1. Materials and Supplies
This category includes all the expendable supplies needed to perfora this research. The amount given is based on our experiences of the past four years, and includes expenses for fertilizers and reagent-grade chemicals used in our field work; chemicals for laboratory analyses; expendable laboratory supplies such as glassware and deionization columns; electric lawn-edging shears, blades, and bags for plant samples, fencing and iron posts used in field experiments; xeroxing; photographic services, including annual photographs of each experimental plot; aerial photography of al 1 our experimental fields; miscellaneous office supplies; miscellaneous field supplies; equipment repair.
90
B. BUDGET ALLOCATION TO INTERSITE SYNTHESES
Because our research is motivated by a series of broad, general ecological hypotheses, most of our data can be used for intersite comparisons that could lead to new syntheses and theory. However, in indicating how our resources are allocated to intrasite versus intersite activities, we will include as intersite expenditures only those items that are directly related to intersite activities that are already planned or underway. The main expense for intersite research is salary. D. Tilman will spend most of his summer effort and much of his academic year effort pursuing intersite syntheses. However, in order for Tilman to do so, it is necessary that the Site Manager take over more of the day-to-day administrative duties that Tilman would otherwise perform during the summer and academic year. Thus, in the table below we indicate that 70% of Tilman•s summer salary and 50% of the Site and Data Manager's annual salary are dedicated to intersite activity. Based on the interests of N. Huntly, J. Pastor and R. Inouye, we estimate that about 10% of their time will be spent in intersite research. Although about 60% of the annual effort of our field crew and site and data manager is dedicated to collection of data used for intersite comparisons (i.e., disturbed versus undisturbed microplots; herbivore plots; burn experiments), these data are also essential to our on-site efforts. Thus, only 30% is attributed to intersite activities. Airfare, car rental and living expenses while visiting other sites are another major expense.
Expenses Allocated to Intersite Research and Syntheses 1
Item 1987
D. Tilman 16,808 (70%)
Site/Data Manager 20,455 (50%)
Post-Doctoral Researchers 9,608 (10% of salary of 3 individuals)
Field Crew 7,459 (30% of salary of 7 individuals)
Travel and Living Expenses at 3,400 Other Sites
Research Supplies 11 100
Total 58,830
Percent of Total Annual Budget 17%
1988
1.7,647
21,478
10,088
7,832
3,400
1,100
61,555
17%
1989
18,526
22,551
10,593
8,223
3,400
1,100
64,393
17%
1990
19,454
23,679
11 , 122
8,635
3,400
1,100
67,390
17%
1 All dollar amounts shown already include both fringe benefits, if applicable, and overhead.
91
VI, CORRENT AND PENDING SUPPORT
DAVID TIUfAH
Current Support: NSF. Succession, productivity and dynamics in temperate mixed ecosystems in Minnesota (with J, R. Tester). $1,495,000. January 15, 1982 to January 14, 1987, 30% effort. Located at Cedar Creek Natural History Area,
Pending Support: NSF. Succession, productivity and dynamics in temperate mixed ecosystems in Minnesota. $1,475,000. January 15, 1987 to January 14, 1991, 30% effort. Located at Cedar Creek Natural History Area.
Propoeal.s P] anned• None.
other Agencies: This proposal will not be submitted to any other agency.
JCIIN R, TllS'l'ER
Current Support: NSF. Succession, productivity and dynamics in temperate mixed ecosystems in Minnesota (with D. Tilman). $1,495,000. January 15, 1982 to Janaury 14, 1987, 25% effort. Located at Cedar Creek Natural History Area.
Fur Institute of Canada, Determination of certain biological parameters in foxes caught with live trapping systems (with U.S. Seal). $199,970, June 1, 1985 to May 31, 1987, 5% effort. Located at Cedar Creek and Jamestown, ND.
u. s. Department of the Interior. Fertility control in wild horse populations ( with D. B. Siniff). $710,920. October 1, 1985 to September 30, 1988, 10% effort. Located in Nevada.
Proposal.s Pending: NSF. Improvement of research facilities at Cedar Creek Natural History Area. $99,580. July 1, 1986 to June 30, 1988. 5% effort. Located at Cedar Creek.
Propoeal.s Pl.anned: None
NANCY HUNl'LY
Current Support: None Proposal.s PencUng: None Proposal.s PJ armed• None
RICHARD IHOUYE
Current Support: None Proposal.s PencU ng: None Prnposals Planned• None
92
VII. APPENDICES
A. PUBLICATIONS OF THE CEDAR CREEK LTER PROJECT
Published Papers
Inouye, R.S., N.J. Huntly, D. Tilman, J.R. Tester, M. Stillwell and K.C. Zinnel. 1986. Old field succession on a Minnesota sandplain. Ecology. (In press,)
McKone, M.J. 1985. The reproductive biology of several bromegrasses (Bromus L.): Variation in breeding system, pattern of fruit maturation, and seedset. American Journal of Botany 72: 1334-1339.
McKone, M.J. and D.D. Biesboer. 1986. Nitrogen fixation in association with the roots of goldenrods (Solidago L.). Soil Biology and Biochemistry. (In press.)
McKone, M.J. and D. Tonkyn. 1986. Intrapopulation gender variation in common ragweed (Ambrosia artemisiifolia), a monoecious annual herb. Oecologia, in press.
Reichman, O.J. and S. Smith. 1985. Impact of pocket gophers on overlying vegetation. Journal of Mammalogy 66:720-725.
Sterner, R.W. 1986. Herbivores' direct and indirect effects on algal populations. Science 231:605-607.
Tester, J.R. 1986. Seasonal changes in activity rhythms of some free-ranging animals. Canadian Field Naturalist. (In press.)
Tilman, D. 1983. Plant succession and gopher disturbance along an experimental gradient. Oecologia 60:285-292.
Tilman, D. 1984. Plant dominance along an experimental nutrient gradient. Ecology 65:1445-1453.
Tilman, D. 1985. The resource ratio hypothesis of plant succession. American Naturalist 125:827-852.
Tilman, D. 1986. Evolution and differentiation in terrestrial plant communities:. the importance of the soil resource:light gradient. Pages 359-380 in T. Case and J. Diamond, eds., Community Ecology. Harper and Row, New York.
Tilman, D. 1986. Theory of consumer-resource interactions. American Zoologist. (In press.)
Tilman, D. 1986. Nitrogen-limited growth in plants from different successional stages. Ecology. (In press.)
Tilman, D. 1986. Resources, competition and the dynamics of plant communities. In M. Crawley, ed., Plant Ecology. Blackwell. (In press.)
Tilman, D., R. Kiesling, R. Sterner, S. Kilham, and F. Johnson. 1986. Green, bluegreen and diatom algae: taxonomic differences in competition ability for P, Si, and N. Archive fur Hydrobiologie. (In press.)
Zinnel, K.C. and M.F. Marozas. 1986. Computer data entry techniques used in scientific applications. Pages 61-72 in W.K. Michner, ed., Research Data Management in the Ecological Sciences. Bel le W. Baruch Library in Marine Science, No. 16, University of South Carolina Press.
93
Manuscripts in Review in Major Refereed Journals
Behrend, A,F, and J,R, Tester. Aspects of feeding ecology of the plains pocket gopher (Geomys bursarius) at Cedar Creek Natural History Area, Minnesota.
Huntly, N,J, Influence of co-occurring consumers on resources: independent, collective and interactive effects of mammalian herbivores on vegetation,
Huntly, N.J. and R,S, Inouye. Occurrence of small mammals along a grassland chronosequence: successional patterns and correlations with vegetation.
Huntly, N,J, and R,S, Inouye. Herbivory in successional old fields in Minnesota: interactions of nitrogen availability, herbivore populations, and vegetation dynamics.
Inouye, R,S, and N,J. Huntly. Fine-scale microhabitat selection by small mammals in response to fertilization and disturbance in old fields in Minnesota.
Inouye, R.S. and D. Tilman. Convergence and divergence along experimental nutrient gradients.
Inouye, R.S., N.J. Huntly, D. Tilman, and J,R. Tester, Gophers, soils, and vegetation in old-field succession on a Minnesota sandplain.
Pastor, J,, M.A. Stillwell, and D. Tilman. Nitrogen mineralization and nitrification in Minnesota old fields.
Strauss, S. Direct and indirect effects of host plant fertilization on an insect herbivore community,
Tilman, D. Do old-field plant communities have multiple stable equilibria?
Tilman, D. Secondary succession and the pattern of plant dominance along experimental nitrogen gradients.
Manuscripts in Preparation
(Listed below are only those manuscripts for which all necessary data have been collected and data analysis and writing are currently underway.)
Brokaw, J, The effects of nocturnal foraging and diel migration on rates of parasitism suffered by caterpillars of Satyrium edwardsii.
Brokaw, J, The wood ant, Formica obscurpes, as a keystone species determining the species composition of insect herbivores on burr oaks,
Huntly, N,J, Variation in seed number and size in relation to nitrogen availability of the maternal habitat.
Huntly, N.J. and D. Tilman. Correlations of tissue nitrogen with successional occurrence and competitive ability along a nitrogen availability gradient.
Huntly, N.J., D. Tilman, M.L. Cowan, and R.S. Inouye. Nitrogen and light limitation of growth and allocation in Agrostis scabra.
Inouye, R.S., N,J. Huntly, and D. Tilman. Effects of nitrogen availability on grasshopper assemblages in Minnesota old-fields,
94
Inouye, R.S, and T, Allison. Effects of deer removal on invasion of old fields by woody vegetation,
Inouye, R,S, and N,J, Huntly, Old field grasshoppers and vegetation,
McKane, R,, D, Grigal, and M, Russelle, Niche separation and overlap in an old-field plant connnunity as measured by competition for 15N.
McKane, R. and D. Grigal, Carbon and nitrogen dynamics during old-field succession.
Norland, M., B. McKane, and D. Grigal. Changes in above- and below-ground production within and among species along successional and nutrient gradients.
Norland, M. and D. Grigal. Nitrogen nutrition, soil water content, and above-ground production of an old-field successional sequence.
Pastor, J,, M.A. Stillwell, and D, Tilman. Litter dynamics in Minnesota old fields.
Tester, J,R, et al. Effects of fire frequency on native oak-savannah vegetation in eastcentral Minnesota.
Tilman, D., R.S. Inouye, and N.J. Huntly, Soil heterogeneity, plant abundance patterns and species diversity during old field succession.
Tilman, D., N,J, Huntly, R,S, Inouye, and M.L. Cowan. Do plant species differentially reduce limiting resources?
Zinnel, K.C. and J,R, Tester. Effects of pocket gophers (Geomys bursarius) on root biomass,
Book in Preparation
Tilman, D. The Dynamics of Plant Competition. (To be published by Princeton University Press,)
Theses
Behrend, A. 1985, The feeding ecology of the plains pocket gopher (Geomys bursarius) in Minnesota. M.S. Thesis, University of Minnesota,
Haarstad, J.A. 1985. Ecological relationships among eight species of coexisting burying beetles in east-central Minnesota (Coleoptera: Silphidae, Nicrophorus), Ph.D. Thesis, University of Minnesota,
Malody, K,J.A, 1985, The effects of fertilizers on lichens, M,S, Thesis, University of Minnesota.
McKone, M,J, 1985, Gender in hermaphrodites: intraspecific variation in some windpollinated plants and the effect of breeding system. Ph.D. Thesis, University of Minnesota.
Presentations at National and International Meetings
Behrend, A.F. and J,R, Tester, 1985, Feeding behavior of plains pocket gophers (Geomys bursarius) in Minnesota. Paper presented at American Society of Mammalogists meeting, University of Maine, Orono.
95
Brokaw, J, 1984, The effects of ant-tending and nocturnal foraging on the rates of parasitoid attack on caterpillars of Satyrium edwardsii. Bulletin of the Ecological Society of America 65: 164.
Goldburg, R. 1984. Ground beetle populations in fertilized and unfertilized old fields in Minnesota. Bulletin of the Ecological Society of America 65: 164.
Goldburg, H.J. 1985. Sequential flowering of neighboring plants and the movement of pollen-feeding beetles. Paper presented at the Ecological Society of America meeting, University of Minnesota, Minneapolis.
Huntly, N.J. and R.S. Inouye. 1984. Grasshopper distribution patterns within and among Minnesota old fields, Bulletin of the Ecological Society of America 65:92,
Huntly, N.J. and R.S. Inouye, 1984. Experimental and observational studies of grasshoppers on the Anoka sandplain. Abstracts of the Ninth North AmericanPrairie Conference 9: 16.
Inouye, R.S. and N.J. Huntly. 1983. Microhabitat selection by old-field small mammals in response to nitrogen fertilization and disturbance. Paper presented at theAmerican Society of Mammalogists meeting, Gainesville, Florida.
Inouye, R.S. and N.J. Huntly. 1983. Patch choice by insects and mammals: responses to fertilization of old fields. Paper presented at the Ecological Society ofAmerica meeting, Grand Forks, North Dakota.
McKane, H.B. 1984. Root biomass dynamics during old-field succession. Bulletin of the Ecological Society of America 65: 107.
Norland, M,R, 1984. Above-ground productivity of old fields along a successional gradient. Bulletin of the Ecological Society of America 65:107.
Stillwell, M.A. 1983. Nitrogen availability and organic matter accumulation during 50 years of old field succession in northern Minnesota. Bulletin of the Ecological Society of America 64.
Stillwell, M.A. 1984. Nitrogen inputs, leaching losses, and availability as controls of old field succession in Minnesota. Bulletin of the Ecological Society of America 65:189.
Strauss, s.Y. 1984. The effects of nitrogen fertilization on the insect community associated with Artemisia ludoviciana. Bulletin of the Ecological Society of America 65:163.
Tester, J.R., R.S. Inouye, G.D. Tilman, N.J. Huntly, M.A. Stillwell, and K,C, Zinnel. 1984. Succession in old fields in east-central Minnesota: patterns of vegetation, soils, and gopher activity. Bulletin of the Ecological Society of America 65:107,
Tilman, D. and J.R. Tester. 1982. Micro and macro views of succession, productivity and dynamics in oak savanna. Paper presented at the Ecological Society of America meeting, State College, Pennsylvania.
Tilman, D. 1982. Plant succession: experimental tests of a new theory of succession, Paper presented at the Ecological Society of America meeting, State College, Pennsylvania.
Tilman, D. 1983. Succession along an experimental nutrient gradient: gopher disturbances and other indirect effects. Bulletin of the Ecological Society of America.
Tilman, D. 1983, Mechanistic models of resource competition in plants. Annual Meeting of American Society of Zoologists.
Tilman, D. 1984. Old-field plant dominance along experimental nitrogen:light gradients. Bulletin of the Ecological Society of America 65:65,
Tilman, D. 1984. Trade-offs and community structure. Invited paper for the Calimigos Ranch Conference on Community Ecology, Malibu, California.
Tilman, D. 1985. Experimental studies on resource competition and succession in old fields, Bulletin of the Ecological Society of America 66:283,
Tonkyn, D.W. and P.A. Morrow. 1985, Effects of similarity among plants on diffusion of a specialist herbivore. Paper presented at the Ecological Society of America meeting, University of Minnesota, Minneapolis.
Zinnel, K.C. and J.R. Tester. 1984. Non-intrusive monitoring of plains pocket gophers. Bulletin of the Ecological Society of America 65: 166.
Zinnel, K,C. and J,R, Tester. 1984. Winter movements of plains pocket gophers (Geomys bursarius) in Minnesota. American Society of Mammalogists Abstracts 64:19.
96
B. SITE DESCRIPTION AND FACILITIES
1. Site
Cedar Creek Natural History Area is a 2,185 ha (9 square mile) experimental ecological reserve located 60 km north of the University of Minnesota in Minneapolis. It lies in a floristic tension zone with many species near their southwestern limits while others are at their northern limits. Cedar Creek's southern relict outpost of boreal forest species, its extensive oak savanna, old fields, western prairie-type lakes and marshes, many soil types, and closeness to the University make it a unique research site, Cedar Creek is owned and managed by the University of Minnesota. Al though Cedar Creek lies near a large metropolitan area, it is large enough to withstand urban pressures; its important natural areas are buffered by extensive oak forests and abandoned fields,
Cedar Creek contains a variety of natural and culturally disturbed habitats, including a thorough sequence of successional areas with known past history (Inouye et al. 1986). The major vegetation types at Cedar Creek and their approximate sizes are: old fields (850 ha); wetland marsh and carr (710 ha); oak savanna (250 ha); oak-hickoryaspen forest ( 130 ha); conifer bog (70 ha); and Great Lakes pine forest ( 40 ha). Woodlots have been free of grazing and cutting for 45 or more years and are semi-natural, Forest composition is strongly dependent on relation to natural firebreaks,
Cedar Creek lies within the Anoka Sand Plain, a large outwash plain covering about 2200 km2• In some of the area, outwash sands have been reworked by wind, resulting in a dune-shaped topography dominated by the Sartel 1 soil series (Grigal et al 1974). In other areas, deposition was apparently by slower moving waters and this, combined with a flat, low physiographic position, has led to the formation of soils of the Soderville series. On the broad flats located some distance above the water table, soils of the Nymore series, under the influence of savanna vegetation, have formed a Mollisol or prairie soil. The Zimmerman series is represented on much of the remaining mineral upland. Glacial till appears at the surface in some spots and both Inceptisols and other Alfisols can be found there. Cedar Creek also has extensive areas of organic soils, or Histosols, associated with a variety of lowland vegetation types.
2, Facilities
Cedar Creek has nine permanent buildings, including a new, modern, year-around research laboratory, a newly-remodeled dormitory-kitchen, a shop building, a large storage building and work area, a winterized animal holding facility, and four yeararound family homes. The facilities, which have been considerably expanded during the past four years because of the needs of the LTER project and of other new research projects, provide all the space and services we need to perform our research, We have a complete, well-equipped analytical chemistry laboratory that is used for soil, water and plant tissue analyses. Major items of equipment in the laboratory are: two Technicon Auto Analyzers; two Apple II-e microcomputers that control the Auto Analyzers and act as data loggers; analytical balances; shaker tables; centrifuges; fume hood; three spectrophotometers; muffle furnace; high-volume still; drying ovens; pH meter; culture boxes; autoclave; block digester. Other major items of equipment include: a walk-in drying oven; three IBM-PC controlled analytical balances for automated weighing and data entry; three IBM-XT microcomputers; a Hewlett-Packard Vectra microcomputer; HewlettPackard graphics plotter; one letter quality and four dot-matrix printers; drafting equipment and automated lettering machine; microcomputer-controlled automatic radio tracking grid for small mammals; Lambda PAR collector and meter; wet- and dry-fall atmospheric collectors; a truck; a station wagon; a tractor,