Projecting the Performance of Decision Support Workloads on Systems with Smart Storage (SmartSTOR) Windsor W. Hsu Alan J. Smith Honesty C. Young IBM Research Division IBM Almaden Research Center San Jose, CA 95120 windsor,young @almaden.ibm.com Computer Science Division University of California Berkeley, CA 94720 windsorh,smith @cs.berkeley.edu Report No. UCB/CSD-99-1057 August 1999 Computer Science Division (EECS) University of California Berkeley, California 94720
Transcript
Projecting the Performance of Decision Support Workloads on Systems withSmart Storage (SmartSTOR)
Recent developments in both hardware and software have made itworthwhile to consider embedding intelligence in storage to handlegeneral purpose processing that can be offloaded from the hosts. Inparticular, low-cost processing power is now widely available andsoftware can be made robust, secure and mobile. In this paper,we propose a general Smart Storage (SmartSTOR) architecture inwhich a processing unit that is coupled to one or more disks canbe used to perform such offloaded processing. A major part ofthe paper is devoted to understanding the performance potential ofthe SmartSTOR architecture for decision support workloads sincethese workloads are increasingly important commercially and areknown to be pushing the limits of current system designs. Ouranalysis suggests that there is a definite advantage in using fewerbut more powerful processors, a result that bolsters the case forsharing a powerful processor among multiple disks. As for soft-ware architecture, we find that the offloading of database opera-tions that involve only a single relation to the SmartSTORs is farless promising than the offloading of multiple-relation operations.In general, if embedding intelligence in storage is an inevitable ar-chitectural trend, we have to focus on developing parallel softwaresystems that can effectively take advantage of the large number ofprocessing units that will be in the system.
1 Introduction
Typical I/O devices consist of the physical device hardware (e.g.,disk platters, read/write heads), device specific electronics (e.g.,sense amplifiers) and generic electronics (a general purpose or spe-
Most of the funding for this research has been provided by IBM Corporation;additional support has been provided by the State of California under the MICRO pro-gram, Fujitsu Microelectronics, Toshiba Corporation, Microsoft Corporation, CirrusCorporation, Quantum Corporation and Sun Microsystems.
This report is also available as Research Report RJ 10145, IBM Almaden Re-search Center, San Jose, CA.
cial purpose embedded microprocessor or processors). With therapid growth in processing power per processor (estimated at a rateof 60% per year [11]), it is reasonable to consider implementingand treating the processing power placed in a disk controller asgeneral purpose, and not just as a dedicated microprogrammed em-bedded controller. For instance, a 33 MHz ARM7TDMI embeddedprocessor has recently been used to implement all the functionsof a disk controller, including the servo control [3]. If a moder-ately powerful general purpose microprocessor is combined witha reasonable amount of local memory, and placed either in a diskcontroller or a storage controller (i.e., a controller which controlsmultiple devices), then there will exist a general purpose outboardCPU with substantial excess processing capacity.
Recent advances in software technology make using this pro-cessing capacity easier than previously. In particular, software faultisolation techniques [23] as well as robust and secure languagessuch as Java [9] enable applications to be effectively isolated sothat they can be safely executed on a machine without causing ma-licious side effects. Recent emphasis on architectural neutrality andthe portability of languages [9] further enhances code mobility andeases the way for code to be moved to different machines for execu-tion. For example, in SUN’s Jini framework [20], application codecan be downloaded to the device as needed. The convergence ofthese hardware and software developments provide an opportunityfor a fundamental shift in system design by allowing applicationcode to be offloaded to the peripherals for execution.
In this paper, we propose a general architecture forSmart Stor-agein which a processing unit that is coupled to one or more diskscan be used to perform general purpose processing offloaded fromthe host. The main motivation for SmartSTOR is that many oftoday’s storage adapters and outboard controllers already containseveral general purpose commodity processors that are needed tohandle functions such as RAID [6] protection. Implementing SmartStorage would amount to enhancing these adapters and controllersto perform some general purpose processing. Besides allowing pro-cessing to be offloaded from the host processor, the Smart Storage
1
architecture also reduces data movement between the host and stor-age subsystem. In addition, it allows processing power to be auto-matically scaled with increasing storage demand. Other advantagesof embedding intelligence in storage include simplifying the costlytask of system management [5].
There have been some recent proposals for embedding in-telligence in disks [10] and these include the Intelligent Disk(IDISK) [16] and the Active Disk [1, 18]. The processors that canbe used in these disk-centric proposals are subject to the powerbudget and stringent cost constraints of the disk environment - gen-erally disks are fungible and are sold almost entirely on the basisof price. The market for high cost/high performance/high function-ality disks is very limited, and thus prices for disks in this marketsegment are higher than they would otherwise be due to the loss ofefficiencies of scale. On the other hand, SmartSTOR, by operatingat the level of the storage (i.e., multiple device) controller, can of-fer processing units that are more substantial and therefore easierto effectively use. Moreover, by allowing a processing unit to becoupled to one or more disks, the SmartSTOR architecture allowsfor more flexible scaling of processing power to increasing storagedemand. In the nearer term, the SmartSTOR architecture is likelyto be easier to accomplish because increasing the processing poweron an adapter or controller to handle general purpose processingis less risky than modifying the actual disk design. It also lowersthe barrier of entry and opens up the architecture to the creativityof more than just the few disk companies. Finally, it separates themanufacturing of low cost disks (most of which go into PCs) fromhigh performance controllers (which can go into servers, clustersand mainframes, and which are relatively price-insensitive).
The idea of moving processing closer to the disk was studiedextensively in the form of database machines during the late 1970sand early 1980s [7, 13]. Most of those database machines relied oncostly special-purpose hardware which had to be specifically pro-grammed and which prevented the database machines from takingadvantage of algorithmic advancements and improvements in com-modity hardware. In addition, the reliance on highly-specializedhardware made it difficult to develop succeeding generations of thesystem so that it was not worthwhile to expend significant effortprogramming these machines. In contrast, the SmartSTOR archi-tecture leverages commodity general purpose hardware which al-lows the system to track the continual improvements in both hard-ware and software. In particular, a SmartSTOR can be based ona standard CPU platform (e.g.,PowerPC, MIPS, X86,etc. ), forwhich there are extensive software tools, a great deal of support,and a long projected life. In addition, the technology that is nowavailable for developing portable and architecturally-neutral soft-ware can help reduce the need to program specifically for any par-ticular implementation of the SmartSTOR architecture. Further-more, shared nothing database algorithms and technology have ma-tured to the point where we should be able to exploit some of theparallelism present in the SmartSTOR architecture.
Essentially, we envision a system in which the host supervises anumber of SmartSTORs, each of which consists of a powerful pro-cessing unit, a useful amount of local memory, and a number of I/Odevices, usually disks. The host processor may generate tasks spe-cific to one SmartSTOR (i.e.,only needing data local to that Smart-STOR) and delegate that work to the SmartSTOR, which wouldthen deliver the result to the host. Alternatively, the SmartSTORcan be handed more complicated tasks that require coordinationwith other SmartSTORs. If the generation and delegation of thesetasks can be sufficiently automated and reliable, and if the load bal-ancing is successful, then the processing power of the SmartSTORCPUs and the host become additive, and the result is a much morepowerful system.
An essential element to the success of the Smart Storage ar-chitecture lies in convincing the software developers that Smart-STOR is a viable and attractive architecture. Projecting the per-formance potential of the SmartSTOR architecture is an importantfirst step in this direction. Since decision support workloads areincreasingly important commercially [4], a major part of this re-port is devoted to understanding how these workloads will per-form on the SmartSTOR architecture. In particular, we evaluatethe performance of the Transaction Processing Performance Coun-cil Benchmark D (TPC-D) [21], which is the industry-standard de-cision support benchmark, on various SmartSTOR-based systems.Our methodology is based on projecting SmartSTOR performancefrom current system performance and parameters. More specifi-cally, we use the system configurations of recent TPC-D results todetermine the number of SmartSTORs that will be needed. In ad-dition, we examine the query execution plans from two recentlycertified TPC-D systems to establish the fraction of work that canbe offloaded to the SmartSTORs. We also use recent TPC-D resultsto empirically derive the system scalability relationship so that wecan estimate the effectiveness of distributing a query among manySmartSTORs. There are clearly limits to this projection approachbut we believe that it is the most effective and appropriate method-ology at this early stage.
The rest of this report is organized as follows. In the next sec-tion, we describe the hardware and software architecture for Smart-STOR. In Section 3, we present the methodology used to project theperformance of TPC-D on systems with SmartSTOR. Performanceanalysis results are presented in Section 4. Section 5 concludes thisreport. Appendix A contains a brief overview of the TPC-D bench-mark whilst Appendix B contains the query execution plans of all17 TPC-D queries taken from a recently certified TPC-D setup.
2 The SmartSTOR Architecture
The proposed Smart Storage architecture consists of a process-ing unit that is coupled to one or more disks. Figure 1 depictssuch an architecture. We define thecardinality of a SmartSTORto be the number of disks it contains. A SmartSTOR with a car-dinality of one contains asingle diskand is referred to as SD. nour performance projection, SD is conceptually equivalent to anIDISK/Active Disk. When a SmartSTOR containsmultiple disks,we refer to it as MD.
The success of the SmartSTOR architecture hinges on the avail-ability of software that can take advantage of its unique capabili-ties. Figure 2 shows a spectrum of software options, each havingdifferent performance potential and requiring different amounts ofsoftware engineering effort. At this point in time, it is not apparentwhich software architecture, if any, will provide enough benefits tojustify its development cost but through the performance projectionthat we will perform later in this report, we hope to gain some un-derstanding that will help developers reach their own conclusions.
Intuitively, data intensive operations like filtering and aggrega-tion should be offloaded to the SmartSTOR. More generally, op-erations that rely solely on local data belonging to a single baserelation are good candidates for offloading. We refer to thissingle-relationoffloading as SR. Such operations are the basis of databasequeries and includes table/index scan, sort, group by and par-tial aggregate functions. Basically, SR includes all single-relationoperations before a join or a “table queue”, which is a mecha-nism through which the database management system (DBMS) dis-tributes data among its agents.
Although single-relation operations are the basis of databasequeries, a typical decision support query involves a lot more than
2
…
Figure 1: SmartSTOR Hardware Architecture.
No Off-loading
…
Single RelationOff-loading
…
Multiple RelationOff-loading
Processing by host
Processing by SmartSTOR
Figure 2: Possible Software Architectures.
just these basic operations. In order to distribute more process-ing to the SmartSTORs, we have to consider offloading multiple-relation operations such as joins that may involve data in one ormore SmartSTORs. Suchmultiple-relationoffloading is referredto as MR. At the extreme end, this is functionally equivalent torunning a complete shared-nothing DBMS [8, 17] such as IBM’sDB2/EEE [15] and an operating system on each SmartSTOR. Themain shortcoming of running a shared-nothing DBMS on eachSmartSTOR is the hefty resource requirement of the full-fledgedDBMS. In this case, using SmartSTORs with more substantial pro-cessing unit shared among multiple disks is likely to be more effec-tive than an IDISK/Active Disk setup. It may be possible to trimthe shared-nothing DBMS to contain only the functionality prof-itable for offloading but coming up with this and other softwarearchitecture is an open research problem.
3 Projection Methodology
In this section, we outline the methodology that we use to assessthe effectiveness of the SmartSTOR architecture and the relativemerits of the various hardware and software organizations, partic-ularly, SD (single disk), MD (multiple disk), SR (single-relationoffloading) and MR (multiple-relation offloading). There havebeen some recent work on evaluating the performance of ActiveDisks [1, 2, 18, 22] but these have concentrated on image process-ing applications and basic database operations. Because decisionsupport workloads represent an increasing fraction of the commer-cial workload [4] and are growing so rapidly as to be pushing thelimits of current system designs [24, 25], we focus primarily onprojecting how well they will perform on a SmartSTOR architec-ture. Our projection is based on the Transaction Processing Perfor-
mance Council Benchmark D (TPC-D) [21], which is the industrystandard benchmark for decision support. A brief description of thebenchmark is provided in Appendix A. Readers who are interestedin the characteristics of the benchmark are referred to [12], whichcontains a comprehensive analysis of the benchmark characteris-tics and how they compare with those of real production databaseworkloads.
TPC-D version 2, which is substantially different from version1, has been approved and must be used by vendors starting Febru-ary 16, 1999. This report is based on version 1 since all the pub-lished results are of this version. As soon as enough TPC-D ver-sion 2 results are published, we plan to do a follow-up study to seewhether the same trends are observed with the new version. Be-cause both the hardware and software technologies are advancingrapidly, we decide to look at the more recent results, specificallythose that were published between July 1998 and January 1999.We omit the very recent results because we believe that these veryrecent setups have been so fine-tuned for running the benchmarkthat attempting to lump them in with the other results would bemeaningless.
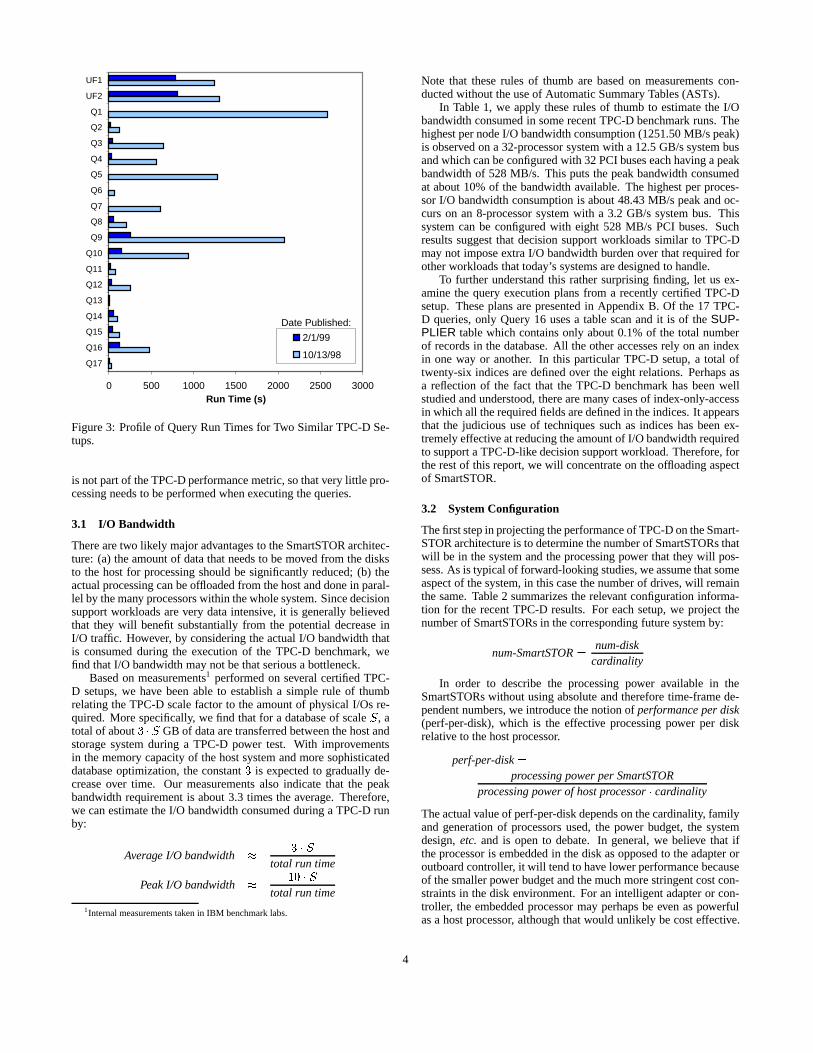
For instance, Figure 3 compares the query executions times fortwo similar benchmark setups that were published in October 1998and February 1999. Note that in the February 1999 run, the 17queries have been sped up so dramatically that the two update func-tions (UF1 and UF2) clearly dominate the run time. We believe thatsuch behavior results from the aggressive use of Automatic Sum-mary Tables (ASTs) which are auxiliary tables that contain partiallyaggregated data. When selecting the query execution plan, the op-timizer will attempt to match queries to the ASTs and perform onlythe necessary final aggregation. In other words, ASTs enable pro-cessing to be effectively pushed to the database load phase, which
3
0 500 1000 1500 2000 2500 3000
Q17
Q16
Q15
Q14
Q13
Q12
Q11
Q10
Q9
Q8
Q7
Q6
Q5
Q4
Q3
Q2
Q1
UF2
UF1
Run Time (s)
2/1/99
10/13/98
Date Published:
Figure 3: Profile of Query Run Times for Two Similar TPC-D Se-tups.
is not part of the TPC-D performance metric, so that very little pro-cessing needs to be performed when executing the queries.
3.1 I/O Bandwidth
There are two likely major advantages to the SmartSTOR architec-ture: (a) the amount of data that needs to be moved from the disksto the host for processing should be significantly reduced; (b) theactual processing can be offloaded from the host and done in paral-lel by the many processors within the whole system. Since decisionsupport workloads are very data intensive, it is generally believedthat they will benefit substantially from the potential decrease inI/O traffic. However, by considering the actual I/O bandwidth thatis consumed during the execution of the TPC-D benchmark, wefind that I/O bandwidth may not be that serious a bottleneck.
Based on measurements1 performed on several certified TPC-D setups, we have been able to establish a simple rule of thumbrelating the TPC-D scale factor to the amount of physical I/Os re-quired. More specifically, we find that for a database of scaleS, atotal of about3 � S GB of data are transferred between the host andstorage system during a TPC-D power test. With improvementsin the memory capacity of the host system and more sophisticateddatabase optimization, the constant3 is expected to gradually de-crease over time. Our measurements also indicate that the peakbandwidth requirement is about 3.3 times the average. Therefore,we can estimate the I/O bandwidth consumed during a TPC-D runby:
Average I/O bandwidth � 3 � Stotal run time
Peak I/O bandwidth � 10 � Stotal run time
1Internal measurements taken in IBM benchmark labs.
Note that these rules of thumb are based on measurements con-ducted without the use of Automatic Summary Tables (ASTs).
In Table 1, we apply these rules of thumb to estimate the I/Obandwidth consumed in some recent TPC-D benchmark runs. Thehighest per node I/O bandwidth consumption (1251.50 MB/s peak)is observed on a 32-processor system with a 12.5 GB/s system busand which can be configured with 32 PCI buses each having a peakbandwidth of 528 MB/s. This puts the peak bandwidth consumedat about 10% of the bandwidth available. The highest per proces-sor I/O bandwidth consumption is about 48.43 MB/s peak and oc-curs on an 8-processor system with a 3.2 GB/s system bus. Thissystem can be configured with eight 528 MB/s PCI buses. Suchresults suggest that decision support workloads similar to TPC-Dmay not impose extra I/O bandwidth burden over that required forother workloads that today’s systems are designed to handle.
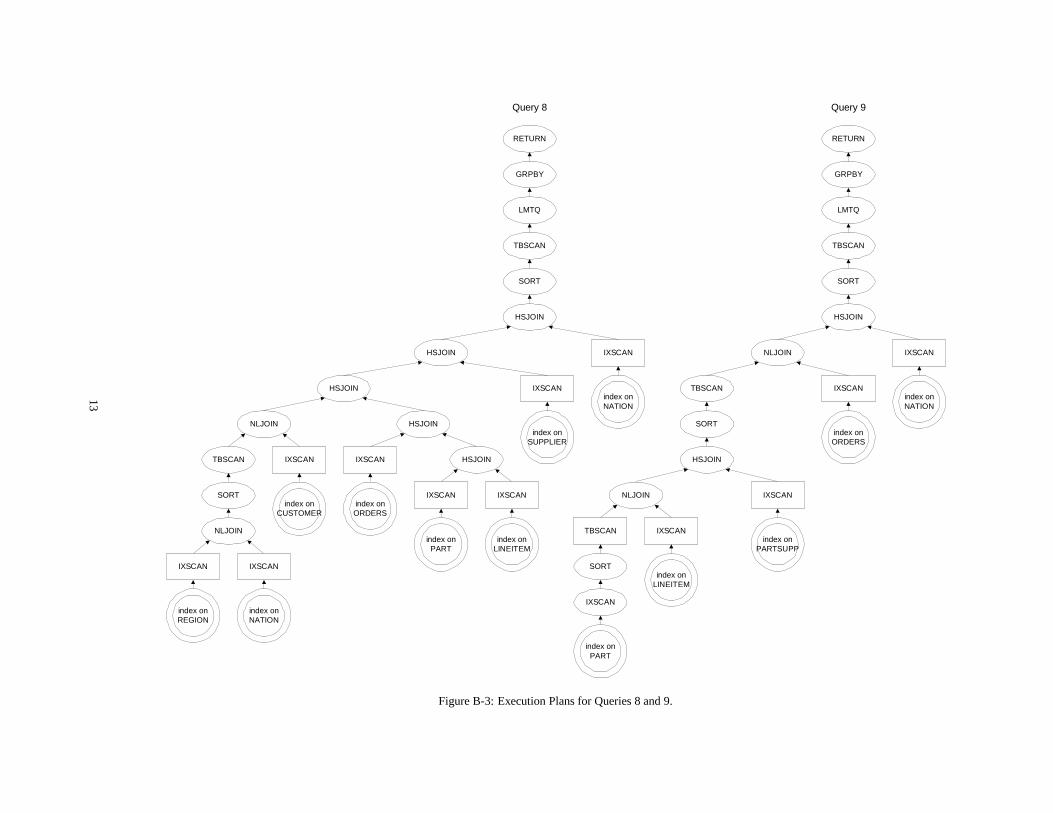
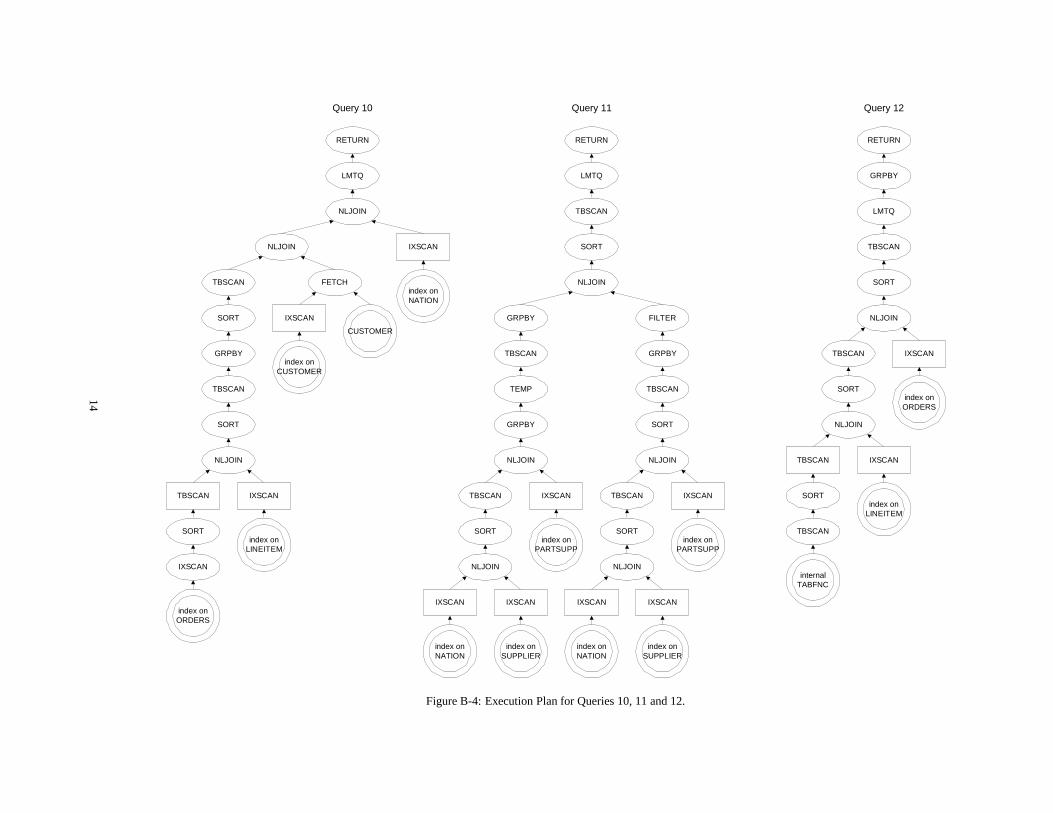
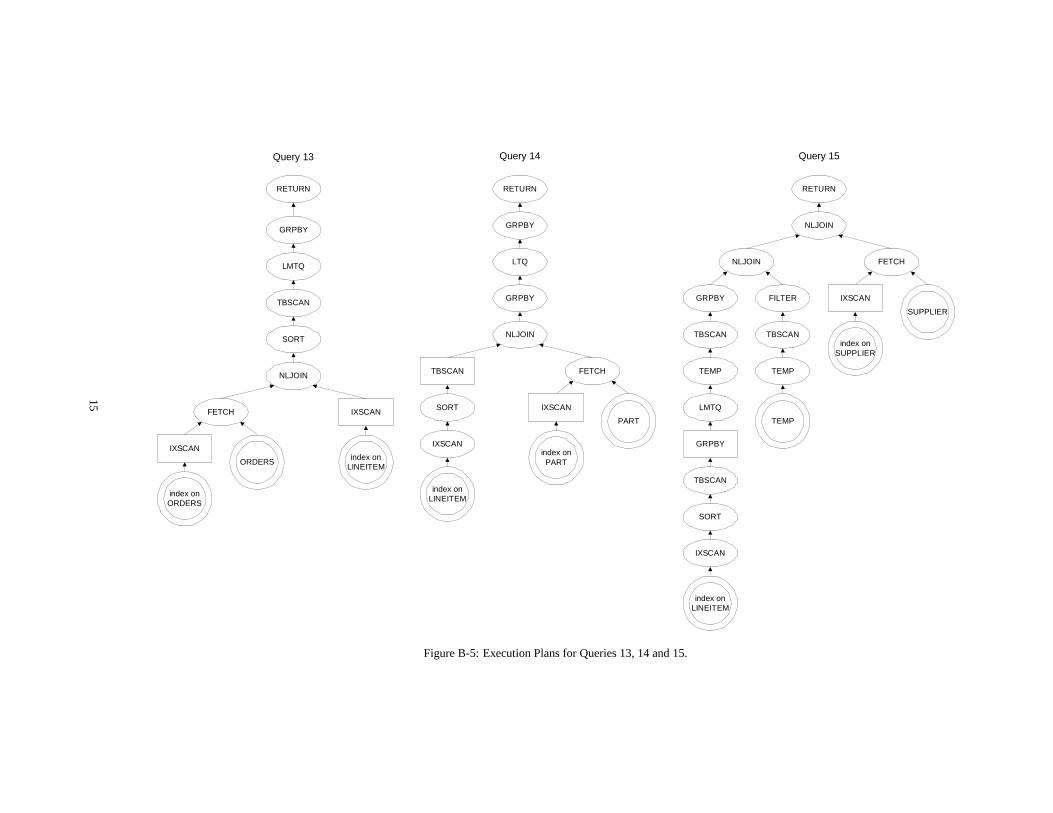
To further understand this rather surprising finding, let us ex-amine the query execution plans from a recently certified TPC-Dsetup. These plans are presented in Appendix B. Of the 17 TPC-D queries, only Query 16 uses a table scan and it is of theSUP-PLIER table which contains only about 0.1% of the total numberof records in the database. All the other accesses rely on an indexin one way or another. In this particular TPC-D setup, a total oftwenty-six indices are defined over the eight relations. Perhaps asa reflection of the fact that the TPC-D benchmark has been wellstudied and understood, there are many cases of index-only-accessin which all the required fields are defined in the indices. It appearsthat the judicious use of techniques such as indices has been ex-tremely effective at reducing the amount of I/O bandwidth requiredto support a TPC-D-like decision support workload. Therefore, forthe rest of this report, we will concentrate on the offloading aspectof SmartSTOR.
3.2 System Configuration
The first step in projecting the performance of TPC-D on the Smart-STOR architecture is to determine the number of SmartSTORs thatwill be in the system and the processing power that they will pos-sess. As is typical of forward-looking studies, we assume that someaspect of the system, in this case the number of drives, will remainthe same. Table 2 summarizes the relevant configuration informa-tion for the recent TPC-D results. For each setup, we project thenumber of SmartSTORs in the corresponding future system by:
num-SmartSTOR=num-disk
cardinality
In order to describe the processing power available in theSmartSTORs without using absolute and therefore time-frame de-pendent numbers, we introduce the notion ofperformance per disk(perf-per-disk), which is the effective processing power per diskrelative to the host processor.
perf-per-disk=processing power per SmartSTOR
processing power of host processor� cardinality
The actual value of perf-per-disk depends on the cardinality, familyand generation of processors used, the power budget, the systemdesign,etc. and is open to debate. In general, we believe that ifthe processor is embedded in the disk as opposed to the adapter oroutboard controller, it will tend to have lower performance becauseof the smaller power budget and the much more stringent cost con-straints in the disk environment. For an intelligent adapter or con-troller, the embedded processor may perhaps be even as powerfulas a host processor, although that would unlikely be cost effective.
Table 3: Percent of Work that can be Offloaded by SR.
5
In either case, the embedded processor is likely to be used also fortasks, some of which are real-time, that are previously performedin special-purpose hardware. Since it is premature to specify pre-cise values for perf-per-disk, we perform sensitivity analysis on theparameter in this paper.
3.3 SR Performance
Recent work has shown that single-relation operations such as SQLselect and aggregation can be very effectively offloaded to an Ac-tive Disk [1]. However, a typical decision support query involvesa lot more than just single-relation operations. In most cases, theresults of the single-relation operations are combined through joinsto create new derived relations that are further operated on. There-fore, determining the actual fraction of work that can be offloadedby SR, and thereby the potential overall speedup, is non-trivial.
Our method for determining the fraction of work that can beoffloaded by SR is to analyze the query execution plans. The re-sults presented in this paper are based on the query execution plansfrom two recently certified TPC-D setups. The fraction of process-ing that can be offloaded depends very much on the query execu-tion plans selected by the query optimizer. In order to understandthe possible range of values, we consider both a shared-everythingand a shared-nothing DBMS. System 1 is a Symmetric Multipro-cessor System (SMP) running IBM’s DB2/UDB [14], a shared-everything DBMS, while System 2 is a cluster-based system run-ning the shared-nothing IBM DB2/EEE [15].
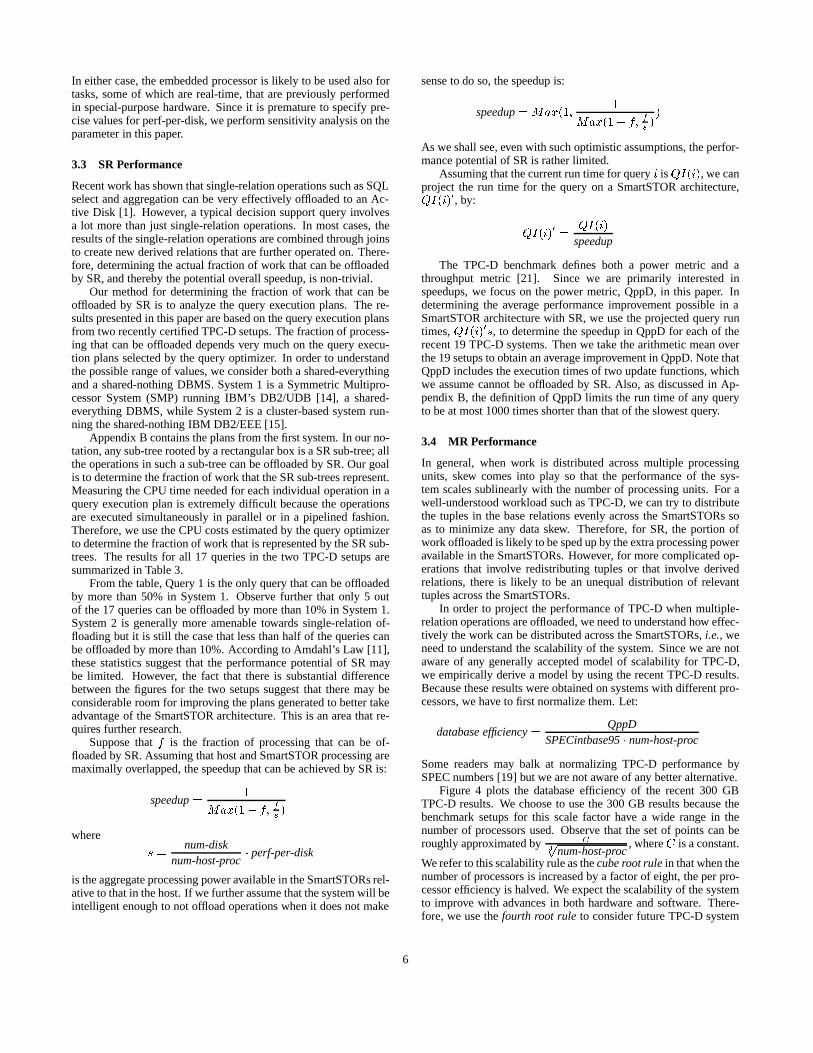
Appendix B contains the plans from the first system. In our no-tation, any sub-tree rooted by a rectangular box is a SR sub-tree; allthe operations in such a sub-tree can be offloaded by SR. Our goalis to determine the fraction of work that the SR sub-trees represent.Measuring the CPU time needed for each individual operation in aquery execution plan is extremely difficult because the operationsare executed simultaneously in parallel or in a pipelined fashion.Therefore, we use the CPU costs estimated by the query optimizerto determine the fraction of work that is represented by the SR sub-trees. The results for all 17 queries in the two TPC-D setups aresummarized in Table 3.
From the table, Query 1 is the only query that can be offloadedby more than 50% in System 1. Observe further that only 5 outof the 17 queries can be offloaded by more than 10% in System 1.System 2 is generally more amenable towards single-relation of-floading but it is still the case that less than half of the queries canbe offloaded by more than 10%. According to Amdahl’s Law [11],these statistics suggest that the performance potential of SR maybe limited. However, the fact that there is substantial differencebetween the figures for the two setups suggest that there may beconsiderable room for improving the plans generated to better takeadvantage of the SmartSTOR architecture. This is an area that re-quires further research.
Suppose thatf is the fraction of processing that can be of-floaded by SR. Assuming that host and SmartSTOR processing aremaximally overlapped, the speedup that can be achieved by SR is:
speedup=1
Max(1� f; fs)
where
s =num-disk
num-host-proc� perf-per-disk
is the aggregate processing power available in the SmartSTORs rel-ative to that in the host. If we further assume that the system will beintelligent enough to not offload operations when it does not make
sense to do so, the speedup is:
speedup= Max(1;1
Max(1� f; fs))
As we shall see, even with such optimistic assumptions, the perfor-mance potential of SR is rather limited.
Assuming that the current run time for queryi isQI(i), we canproject the run time for the query on a SmartSTOR architecture,QI(i)0, by:
QI(i)0 =QI(i)
speedup
The TPC-D benchmark defines both a power metric and athroughput metric [21]. Since we are primarily interested inspeedups, we focus on the power metric, QppD, in this paper. Indetermining the average performance improvement possible in aSmartSTOR architecture with SR, we use the projected query runtimes,QI(i)0s, to determine the speedup in QppD for each of therecent 19 TPC-D systems. Then we take the arithmetic mean overthe 19 setups to obtain an average improvement in QppD. Note thatQppD includes the execution times of two update functions, whichwe assume cannot be offloaded by SR. Also, as discussed in Ap-pendix B, the definition of QppD limits the run time of any queryto be at most 1000 times shorter than that of the slowest query.
3.4 MR Performance
In general, when work is distributed across multiple processingunits, skew comes into play so that the performance of the sys-tem scales sublinearly with the number of processing units. For awell-understood workload such as TPC-D, we can try to distributethe tuples in the base relations evenly across the SmartSTORs soas to minimize any data skew. Therefore, for SR, the portion ofwork offloaded is likely to be sped up by the extra processing poweravailable in the SmartSTORs. However, for more complicated op-erations that involve redistributing tuples or that involve derivedrelations, there is likely to be an unequal distribution of relevanttuples across the SmartSTORs.
In order to project the performance of TPC-D when multiple-relation operations are offloaded, we need to understand how effec-tively the work can be distributed across the SmartSTORs,i.e.,weneed to understand the scalability of the system. Since we are notaware of any generally accepted model of scalability for TPC-D,we empirically derive a model by using the recent TPC-D results.Because these results were obtained on systems with different pro-cessors, we have to first normalize them. Let:
database efficiency=QppD
SPECintbase95� num-host-proc
Some readers may balk at normalizing TPC-D performance bySPEC numbers [19] but we are not aware of any better alternative.
Figure 4 plots the database efficiency of the recent 300 GBTPC-D results. We choose to use the 300 GB results because thebenchmark setups for this scale factor have a wide range in thenumber of processors used. Observe that the set of points can beroughly approximated by C
3p
num-host-proc, whereC is a constant.
We refer to this scalability rule as thecube root rulein that when thenumber of processors is increased by a factor of eight, the per pro-cessor efficiency is halved. We expect the scalability of the systemto improve with advances in both hardware and software. There-fore, we use thefourth root ruleto consider future TPC-D system
6
Recent 300 GB Results
y = 36x-0.32
R2 = 0.84
0
5
10
15
20
25
30
0 20 40 60 80 100 120
Number of Processors
DB
Eff
icie
ncy
Figure 4: Scalability of TPC-D Systems.
scalability. With the fourth root rule, the per processor efficiency ishalved when the number of processors is increased by a factor of16. Note that real workloads are unlikely to be as well understoodand tuned as the TPC-D benchmark and the processing will tend tobe less well distributed. In other words, real workloads will prob-ably scale more poorly with the number of processors. Therefore,we also consider thesquare root rule.
Using these scalability rules, we can establish a relationshipbetween QppD and the number of processors and their processingpower.
(2 for the square root rule,3 for the cube root rule,4 for the fourth root rule.
In a SmartSTOR environment,
QppD
= C � SPECintbase95SmartSTOR�num-SmartSTOR1�
1
n
= C � perf-per-disk� cardinality � SPECintbase95host�num-SmartSTOR1�
1
n
Therefore,
QppD improvement=
perf-per-disk� cardinality ��
num-SmartSTORnum-host-proc
�1�1
n
Using this result, the improvement in QppD can be projectedfor each of the 19 recent TPC-D systems. As in the case for SR, we
take the arithmetic mean over the 19 setups to obtain the averageprojected improvement in QppD.
4 Analysis of Performance Results
Based on the steps outlined in the previous section, we can analyti-cally derive the improvement in QppD for the various hardware andsoftware alternatives. The results are summarized in Figure 5. ForMR, we plot the projected range of speedup with the square, cubeand fourth root scalability rules. The textured (bricked) regions inthe figure are bounded by the potential speedup with the squareand cube root rules. For SR, we plot the range of speedup givenby the two sets of offloading fractions discussed in Section 3.2 andpresented in Figure 3. Note that the figure makes no cost state-ment. This is deliberate since accurate cost information are gen-erally closely guarded and in any case, are very technology andtimeframe-dependent. Given a set of cost estimates, Figure 3 canbe used to determine whether SmartSTOR is a cost-effective ap-proach and if so, the configuration that should be used.
Recall from our scalability model that for MR, TPC-D perfor-mance tends to scale rather sublinearly with the number of proces-sors used. This shows up in Figure 5 in that for the same perf-per-disk, MR4D is projected to have a performance advantage overMR2D and an even bigger advantage over MRSD. However, MDis limited by the fact that there are no arbitrarily powerful proces-sors. A natural question to ponder at this juncture is how doesIDISK/Active Disk compare with an intelligent adapter or con-troller? IDISK/Active Disk is conceptually identical to an intel-ligent adapter or controller of cardinality 1 with the exception thatit is likely to have a lower perf-per-disk. As discussed earlier, theexact value of perf-per-disk is arguable but with the much morestringent power and cost constraints in the disk environment, aswell as the fact that the processor may have to handle tasks pre-viously performed in special-purpose hardware, we believe that avalue of 1
4may be reasonable. For comparison, this ratio of pro-
cessing power is about equivalent to that between a 200 MHz IntelPentium MMX and a 575 MHz Compaq Alpha 21264 (based onSPECintbase95). In this case, the projected improvement in QppDranges from 1.16 to 1.39 for SR and from 0.95 to 1.88 for MR.
As a rough guide, an interesting value of perf-per-disk for anoutboard controller may be:
perf-per-disk=0:8
cardinality
Based on this, the projected speedup in QppD for cardinalities of 1,2 and 4 with multiple-relation offloading ranges from 3.05 to 6.02,from 2.15 to 3.58 and from 1.52 to 2.13 respectively. For single-relation offloading, the corresponding ranges are 1.20-1.59, 1.17-1.48 and 1.15-1.35. These results suggest that the performancepotential of MR is clearly superior to that of SR. An importantpoint to note here is that among all published TPC-D results so far,the largest number of processors used is only 192 while the largestnumber of disks used is over 1,500. If embedding intelligence instorage is an unavoidable architectural trend, we have to focus onimproving the scalability of parallel software systems to effectivelytake advantage of the large number of processors that will be in thesystem.
5 Conclusions
In this report, we have proposed a general Smart Storage (Smart-STOR) architecture in which general purpose processing can beperformed by a processing unit that is shared among one or more
7
0
1
2
3
4
5
6
7
8
0.1 0.2 0.3 0.4 0.5 0.6 0.7 0.8 0.9 1
Pro
ject
ed Im
pro
vem
ent
in Q
pp
D
MR4D
0
1
2
3
4
5
6
7
8
0.1 0.2 0.3 0.4 0.5 0.6 0.7 0.8 0.9 1
MR2D
0
1
2
3
4
5
6
7
8
0.1 0.2 0.3 0.4 0.5 0.6 0.7 0.8 0.9 1
SR
MRSD
4¥
3¥
2¥
Effective Processing Power Per Disk (Relative to Host Processor)
Figure 5: Projected Improvement in TPC-D Performance. To reduce clutter, we use MRSD, MR2D and MR4D to denote multiple-relationoffloading on SmartSTORs of cardinality 1, 2 and 4 respectively.
disks. In order to understand the performance potential of theSmartSTOR architecture for decision support workloads, as wellas the various hardware and software tradeoffs, we projected theperformance of the industry-standard decision support benchmark,TPC-D, on various SmartSTOR-based systems. In particular, weperformed measurements on several recently certified TPC-D sys-tems to estimate the I/O bandwidth required for supporting suchworkloads. We also examined the query execution plans from tworecent TPC-D systems to determine the amount of processing thatcan potentially be offloaded to the SmartSTORs. In addition, weanalyzed recent TPC-D performance figures to empirically estab-lish a scalability rule that can be used to project the effectivenessof distributing query execution among a large number of Smart-STORs.
The SmartSTOR architecture provides two key performanceadvantages, namely a reduction in I/O movement between the hostand I/O subsystem, and the ability to offload some of the work fromthe host processor to the processing units in the SmartSTORs. Theanalysis performed in this paper suggests that I/O bandwidth maynot be that serious a bottleneck for TPC-D. Therefore the main ad-vantage of using SmartSTORs for workloads similar to TPC-D ap-pears to be the ability to offload some of the processing from thehost. By analyzing recent TPC-D results, we find that the perfor-mance of decision support systems scales rather sublinearly withthe number of processors used. Therefore, our results indicate thatthere is a definite advantage in using fewer but more powerful pro-cessors. In view of this and the arguments presented in the paper,we believe that intelligent adapters or controllers that share a sub-stantial processing unit among multiple disks may be an interestingarchitecture. As for software architecture, our evaluation showsthat the offloading of database operations that involve multiple re-lations is far more promising that the offloading of operations thatinvolve only a single relation. In either case, if embedding intel-ligence in storage is an inevitable architectural trend, we have todevelop parallel software systems that are more scalable so as to
effectively take advantage of the large number of processing unitsthat will be in the system.
Acknowledgments
We would like to thank Guy Lohman for providing the query exe-cution plans used in this study. We would also like to thank JosephHellerstein, Kimberly Keeton, Bruce Lindsay and Jai Menon forreviewing early versions of this paper.
References
[1] A. Acharya, M. Uysal, and J. Saltz, “Active disks:Programming model, algorithms and evaluation,” inProc.Eighth Intl Conf. on Architectural Support for ProgrammingLanguages and Operating Systems.
[2] A. Acharya, M. Uysal, and J. Saltz, “Structure andperformance of decision support algorithms on active disks,”Technical Report TRCS98-28, Computer ScienceDepartment, University of California, Santa Barbara., Nov.2, 1998.
[3] L. Adams and M. Ou, “Processor integration in a diskcontroller: Embedding a RISC processor in a complex ASICto reduce cost and improve performance,”IEEE Micro,vol. 17, no. 4, pp. 44–48, July/Aug. 1997.
[4] P. Bernstein, “Database Technology: What’s Coming Next?”Keynote speech atFourth Symposium on High PerformanceComputer Architecture, Feb. 1998.
[5] A. Brown, D. Oppenheimer, K. Keeton, R. Thomas,J. Kubiatowicz, and D. A. Patterson, “ISTORE: Introspectivestorage for data-intensive network services,” Technical
[6] P. M. Chen, E. K. Lee, G. A. Gibson, R. H. Katz, and D. A.Patterson, “RAID: high-performance, reliable secondarystorage,”ACM Computing Surveys, vol. 26, no. 2,pp. 145–185, June 1994.
[7] D. J. DeWitt and P. B. Hawthorn, “A performance evaluationof database machine architectures,” inProc. 7th Intl Conf.Very Large Data Bases, Sept. 1981.
[8] D. J. DeWitt, S. Ghandeharizadeh, D. A. Schneider,A. Bricker, H. i Hsiao, and R. Rasmusen, “The gammadatabase machine project,”IEEE Transactions on Knowledgeand Data Engineering, vol. 2, no. 1, pp. 44–62, Mar. 1990.
[9] J. Gosling and H. McGilton, “The JavaTM languageenvironment a white paper,” May 1996.http://java.sun.com/docs/white/langenv.
[10] J. Gray, “Put EVERYTHING in the storage device.” Talk atNASD Workshop on Storage Embedded Computing, June1998. http://www.nsic.org/nasd/1998-jun/gray.pdf.
[11] J. L. Hennessy and D. A. Patterson,Computer Architecture AQuantitative Approach. Morgan Kaufmann Publishers, Inc.San Francisco, CA, second ed., 1996.
[12] W. W. Hsu, A. J. Smith, and H. C. Young, “I/Ocharacteristics of production database workloads and theTPC benchmarks - a comparative analysis at the logicallevel,” 1999. In preparation.
[13] A. R. Hurson, L. L. Miller, and S. H. Pakzad,ParallelArchitectures for Database Systems. CS Press Tutorial, 1989.
[14] IBM Corporation,DB2 UDB V5 Administration Guide.1997.
[15] IBM Corporation,IBM DB2 Universal Database ExtendedEnterprse Edition for UNIX Quick Beginnings Version 5.1998.
[16] K. Keeton, D. Patterson, and J. Hellerstein, “A case forintelligent disks (IDISKs),”SIGMOD Record (ACM SpecialInterest Group on Management of Data), vol. 27, no. 3,pp. 42–52, 1998.
[17] R. A. Lorie, J.-J. Daudenarde, J. W. Stamos, and H. C.Young, “Exploiting database parallelism in amessage-passing multiprocessor,”IBM Journal of Researchand Development, vol. 35, no. 5/6, pp. 681–695, Sept./Nov.1991.
[18] E. Riedel, G. A. Gibson, and C. Faloutsos, “Active storagefor large-scale data mining and multimedia,” inProc. 24thIntl Conf. Very Large Data Bases, pp. 62–73, Aug. 1998.
[19] Standard Performance Evaluation Corporation, “SPECCPU95 benchmarks,” Aug. 1995.http://www.spec.org/osg/cpu95.
[20] Sun Microsystems, “JiniTM technology architecturaloverview,” Jan. 1999.http://www.sun.com/jini/whitepapers/architecture.html.
[21] Transaction Processing Performance Council,TPCBenchmarkTM D Standard Specification Revision 1.3.1.Dec. 1997.
[22] M. Uysal, A. Acharya, and J. Saltz, “An evaluation ofarchitectural alternatives for rapidly growing datasets:Active disks, clusters, SMPs,” Technical Report TRCS98-27,Computer Science Department, University of California,Santa Barbara., Nov. 2, 1998.
[23] R. Wahbe, S. Lucco, T. E. Anderson, and S. L. Graham,“Efficient software-based fault isolation,” inProc. 14th ACMSymposium on Operating Systems Principles, pp. 203–216,1993.
[24] R. Winter and K. Auerbach, “Giants walk the earth: the 1997VLDB survey,” Database Programming and Design, vol. 10,no. 9, Sept. 1997.
[25] R. Winter and K. Auerbach, “The big time: the 1998 VLDBsurvey,”Database Programming and Design, vol. 11, no. 8,Aug. 1998.
Appendix A
The Transaction Processing Performance Council Benchmark D(TPC-D) [21] is a decision support benchmark that models the anal-ysis end of the business environment where trends are analyzed andrefined to support sound business decisions. It consists of 8 rela-tions, 17 read-only queries and 2 update functions. The 17 read-only queries have different complexities, varying from single tableaggregation (e.g.,Query 1) to 8-way join (e.g.,Query 2).
Eightscale factors(SF) are defined – 1, 10, 30, 100, 300, 1,000,3,000, and 10,000. The scale factor is approximately the logicaldatabase size measured in GBs. Each benchmark configurationmay define different indices. With index and database storage over-head (e.g.,free space), the actual database size may be much biggerthan the raw database size defined by the benchmark. Only resultsmeasured against the same database size are comparable.
TPC-D introduces two performance metrics and a singleprice-performance metric. They are the TPC-Dpower metric(QppD@Size), TPC-Dthroughput metric(QthD@Size) and TPC-D price/performance metric(Price-per-QphD@Size). The powermetric is defined as follows:
QppD@Size=3600
19
p(RI(1) � RI(2) � ::: � RI(17) � UI(1) � UI(2))
� SF
where
� RI(i) = MAX(QI(i), 1
1000MAXQI).
� QI(i) is the run time, in seconds, of queryQi during the powertest.
� MAXQI = MAX(QI(1), QI(2), ..., QI(17)).
� UI(j) is the run time, in seconds, of update functionUFj dur-ing the power test.
� Size is the database size chosen for the measurement and SF,the corresponding scale factor.
The power test runs one query at a time in the order defined bythe benchmark. The 3600 translates QppD to a query per hourmeasurement. Since QppD is a geometric mean of query rates,each query or update function has an equal weight. If the perfor-mance of any query or update function is improved by a factor of2, the QppD@Size measurement will be increased by about 3.7%.
9
If a system’s execution time scales linearly with SF, QppD at anydatabase size will be the same.
In the throughput test, one or more query streams are run con-currently on the system. The throughput metric is defined as fol-lows:
QthD@Size=S � 17 � 3600
Ts� SF
where
� S is the number of query streams used in the throughput test.
� Ts is the interval, in seconds, between when the query streamsare started and when the last query stream completes.
� Size is the same as in the definition of QppD.
Notice that QthD@Size is based on the arithmetic mean of thequery execution times. Thus queries with longer execution timeshave more weight in the metric.
The TPC-D power metric and the TPC-D throughput metric arecombined to form a composite query-per-hour rating, QphD@Size,which is the geometric mean of QppD@Size and QthD@Size. Fi-nally, the price/performance metric is defined as:
Price-per-QphD@Size=$
QphD@Size
Appendix B
In this appendix, we show the query execution plans of all 17 TPC-D read-only queries from a recently certified TPC-D result on anSMP system. In each execution plan, sub-trees rooted by rectan-gular boxes are SR sub-trees; all operations in a SR sub-tree aresingle-base-relation operations that can be offloaded by SR. Eachquery execution plan tree is rooted by areturnoperation, which re-turns the qualified tuples to the application. We use a double-circlefor tables and indices. These include base tables, base indices, andoptimizer generated subqueries and table functions. The legend isas follows:
� AST: automatic summary tableASTs are auxiliary tables that contain partially aggregateddata.
� FETCH: table scan through index
� FILTER: predicate evaluationThis is for the predicates that are not pushed down to thescans.
� [IX jTB]SCAN: [indexjtable] scanIXSCAN is different from FETCH in that the former is anindex-only scan,i.e.,the corresponding table does not have tobe read to get the needed fields.
� L[M]TQ: local [merge] table queueTable queue is a mechanism to exchange data among oper-ations. The plans are from an SMP system, thus, all tablequeues are local table queues. Regular LTQ collects data inany order while LMTQ collects data in a specific order.
� GRPBY: group by
� RETURN: return to host
� SORT: sort
10
RETURN
LMTQ
TBSCAN
SORT
HSJOIN
NLJOIN NLJOIN
TBSCAN FETCH
index onREGION
index onNATION
SORT
NLJOIN
SUPPLIER
IXSCAN
IXSCAN IXSCAN
index onSUPPLIER
IXSCANNLJOIN
GRPBYIXSCAN
NLJOIN
IXSCAN
index onPARTSUPP
index onNATION
index onPART
NLJOIN
IXSCANNLJOIN
index onSUPPLIER
IXSCANIXSCAN
index onPARTSUPP
index onREGION
GRPBY
LMTQ
SORT
TBSCAN
RETURN
TBSCAN
sub queryon
LINEITEM
Query 1 Query 2
RETURN
LMTQ
TBSCAN
SORT
GRPBY
TBSCAN
SORT
NLJOIN
IXSCANTBSCAN
index onLINEITEM
SORT
NLJOIN
IXSCAN IXSCAN
index onCUSTOMER
index onORDERS
Query 3
Figure B-1: Execution Plans for Queries 1, 2 and 3.
11
RETURN
TBSCAN
SORT
GRPBY
LMTQ
TBSCAN
SORT
HSJOIN
IXSCANNLJOIN
index onSUPPLIER
IXSCANTBSCAN
index onLINEITEM
SORT
HSJOIN
IXSCAN NLJOIN
index onORDERS
IXSCANTBSCAN
index onCUSTOMER
SORT
NLJOIN
IXSCAN IXSCAN
index onREGION
index onNATION
RETURN
GRPBY
LTQ
GRPBY
FETCH
sub queryon
LINEITEM
IXSCAN
RID indexon
LINEITEM
Query 5 Query 6
RETURN
GRPBY
LMTQ
TBSCAN
SORT
NLJOIN
IXSCANTBSCAN
SORT
IXSCAN
index onLINEITEM
index onORDERS
Query 4
RETURN
GRPBY
LMTQ
TBSCAN
SORT
HSJOIN
IXSCANNLJOIN
index onSUPPLIER
IXSCAN
index onORDERS
TBSCAN
SORT
NLJOIN
IXSCANNLJOIN
index onCUSTOMER
IXSCAN IXSCAN
index onNATION
index onNATION
Query 7
Figure B-2: Execution Plans for Queries 4, 5, 6 and 7.
12
RETURN
GRPBY
LMTQ
TBSCAN
SORT
HSJOIN
IXSCAN
index onNATION
HSJOIN
IXSCANHSJOIN
index onSUPPLIER
NLJOIN HSJOIN
HSJOINIXSCAN
index onORDERS
IXSCAN
index onCUSTOMER
TBSCAN
SORT
NLJOIN
IXSCAN IXSCAN
index onLINEITEM
index onPART
IXSCAN IXSCAN
index onREGION
index onNATION
Query 8
RETURN
GRPBY
LMTQ
TBSCAN
SORT
HSJOIN
IXSCANNLJOIN
IXSCANTBSCAN
SORT
HSJOIN
NLJOIN IXSCAN
IXSCANTBSCAN
SORT
IXSCAN
index onPART
index onLINEITEM
index onPARTSUPP
index onORDERS
index onNATION
Query 9
Figure B-3: Execution Plans for Queries 8 and 9.
13
Query 10 Query 12
RETURN
LMTQ
NLJOIN
NLJOIN IXSCAN
FETCHTBSCAN
IXSCAN
CUSTOMER
index onCUSTOMER
SORT
GRPBY
TBSCAN
SORT
NLJOIN
IXSCANTBSCAN
SORT
IXSCAN
index onNATION
index onORDERS
index onLINEITEM
RETURN
LMTQ
TBSCAN
SORT
NLJOIN
GRPBY FILTER
GRPBY
TBSCAN
SORT
NLJOIN
TBSCAN
TEMP
GRPBY
NLJOIN
IXSCANTBSCANIXSCANTBSCAN
SORT
NLJOIN
SORT
NLJOIN
IXSCAN IXSCAN IXSCAN IXSCAN
index onNATION
index onSUPPLIER
index onNATION
index onPARTSUPP
index onPARTSUPP
index onSUPPLIER
RETURN
GRPBY
LMTQ
TBSCAN
SORT
NLJOIN
IXSCANTBSCAN
SORT
NLJOIN
IXSCANTBSCAN
SORT
TBSCAN
index onLINEITEM
internalTABFNC
index onORDERS
Query 11
Figure B-4: Execution Plan for Queries 10, 11 and 12.
14
Query 13
RETURN
GRPBY
LMTQ
TBSCAN
SORT
NLJOIN
IXSCANFETCH
IXSCANindex on
LINEITEMORDERS
index onORDERS
RETURN
GRPBY
LTQ
GRPBY
NLJOIN
FETCHTBSCAN
IXSCAN
PART
index onPART
SORT
IXSCAN
index onLINEITEM
Query 14
RETURN
NLJOIN
FETCHNLJOIN
IXSCAN
SUPPLIER
index onSUPPLIER
FILTER
TBSCAN
TEMP
TEMP
GRPBY
TBSCAN
TEMP
LMTQ
GRPBY
TBSCAN
SORT
IXSCAN
index onLINEITEM
Query 15
Figure B-5: Execution Plans for Queries 13, 14 and 15.
15
RETURN
TBSCAN
SORT
GRPBY
LMTQ
GRPBY
TBSCAN
SORT
NLJOIN
IXSCANTBSCAN
SORT
NLJOIN
TBSCAM
SORT
TBSCANIXSCANTBSCAN
internalTABFNC
index onPART
SUPPLIER
index onPARTSUPP
RETURN
GRPBY
LTQ
GRPBY
NLJOIN
IXSCANNLJOIN
GRPBYIXSCAN
IXSCANindex onPART
index onLINEITEM
index onLINEITEM
Query 16 Query 17
Figure B-6: Execution Plans for Queries 16 and 17.


![INDEX.* [digitalassets.lib.berkeley.edu]digitalassets.lib.berkeley.edu/anthpubs/ucb/text/ucp008-009.pdf · Keruk, 277, 283, 294, 311, 336, 337, 358. Kimul Chehenish, 103. Kish, 102,](https://static.documents.pub/doc/80x56/5cc16c2188c99315158c0e6a/index-keruk-277-283-294-311-336-337-358-kimul-chehenish-103.jpg)


