6. FINANCIAL GUIDELINES FOR PREVIOUS YEARS .............................................................. 15
Assumptions
Page | 2
1. BACKGROUND An important facet of the financial planner’s work is to make a variety of projections (retirement needs and retirement income, insurance needs, children’s education funding needs, etc.). In making projections, financial planners are bound by method, rather than results. The purpose of this document is to map out the assumptions to use in the preparation of these projections.
The Guidelines are intended as a guide and are appropriate for making long-term (10+ years) financial projections that are free from the potential biases of financial planners. Predicting the direction the economy will take and how financial markets will evolve is a difficult exercise requiring the integration of a large number of variables and highly sophisticated valuation models. To protect themselves and their clients, financial planners are encouraged to rely on these Guidelines.
Financial planners should develop sensitivity analyses to illustrate and assess the impact of changes in assumptions on clients’ financial positions. This is particularly important when client goals may be at risk.
a) Updating and useful life of the Guidelines
The Guidelines are updated annually. Although some of the assumptions set out in these Guidelines may change from time to time, this does not mean that projections based on previously published assumptions are no longer valid. In fact, projections are considered valid at the time of preparation.
b) Use of the Guidelines
The use of the Guidelines is strongly encouraged to promote trust and confidence in the financial planner’s projections, given their objectivity and basis in reliable sources.
That said, a financial planner is in the best position to understand their clients’ unique circumstances. Because every client situation is different, assumptions that vary from the Guidelines may be used. Assumptions may also differ from the Guidelines based on local market peculiarities. As an example, projections of education costs, which tend to be impacted by local market differences, may justify using an inflation rate that differs from the Guidelines. Projections of salary increases may justify an inflation rate that differs from the Guidelines, where clients give good reason for the change.
Assumptions
Page | 3
c) Compliance with the Guidelines
In all cases, assumptions used should be documented, with sound rationale, and clearly communicated to clients. The use of the Guidelines can be disclosed using a statement such as the following:
• Projection prepared using the IQPF and FP Canada Standards Council Projection
Assumption Guidelines. • Analysis prepared using the IQPF and FP Canada Standards Council Projection
Assumption Guidelines. • Study prepared using the IQPF and FP Canada Standards Council Projection
Assumption Guidelines. • Calculation made using the IQPF and FP Canada Standards Council Projection
Assumption Guidelines.
d) Deviation margins
Where appropriate, financial planners may deviate within plus or minus 0.5% from the rate of return assumptions and continue to be in compliance with the Guidelines.
In making a judgement call around whether to deviate 0.5% up or down, financial planners may consider the following factors:
• The impact of a variation in return on the expected lifestyle of clients. As an
example, it would not be prudent to increase return assumptions to “force” a projection that secures a client’s goal.
• The propensity of clients to buy high and sell low, thereby reducing their long-term rates of return. Where the propensity is high, one may consider reducing the expected rate of return on their portfolio.1
• The degree to which clients rely on professional financial advice in managing their investment portfolio, including regular rebalancing of their portfolio, which may increase their long-term rates of return.2
Please note that the deviation margins relate to the rate of return guidelines only, not to the inflation rate guidelines. Any deviation in excess of 0.5% in either direction of the guidelines should be reasonable and supportable.
e) Effective date of the Guidelines
The Guidelines for 2019 are effective as at April 30, 2019.
1 Dalbar. (2014). 2014 DALBAR QAIB Highlights Futility of Investor Education [Press release]. Retrieved from https://globenewswire.com/news- release/2014/04/09/625908/10076149/en/2014-DALBAR-QAIB-Highlights-Futility-of-Investor-Education.html. 2 Masters, S. J. (2003). Rebalancing. The Journal of Portfolio Management,29(3), 52-57.
The Guidelines were established using a variety of reliable and publicly available data sources. They do not represent the individual opinions of the members of the Projection Assumption Guideline Committee, IQPF or FP Canada Standards Council.
Using numerous sources of data also eliminates the potential bias that may be created by relying on any single source.
The Addendum to the 2019 Projection Assumption Guidelines provides links to sources, data and calculations used in the development of the Guidelines. The Addendum is provided for transparency and replicability of the Guidelines by financial planners and firms. Note that FP Canada Standards Council and IQPF distributed a long-term expectations survey to source data previously obtained through the Willis Towers Watson Annual Canadian Investment Perspectives Survey, which was last completed in 2016. FP Canada and IQPF thank all participants, including AON, Hexavest, IG Wealth Management, Desjardins, Normandin Beaudry, Optimum, PWL Capital Inc., WDS Investment Management, WisdomTree Asset Management, and all other contributors.
b) Aim of stability
The fact that the Quebec Pension Plan and Canada Pension Plan actuarial reports are updated every three years ensures the Guidelines will remain stable.
As well, to ensure stability from year to year and more closely reflect the underlying data,
the Guidelines will continue to be rounded to the nearest 0.1%,3 as has been done since 2015 when it was changed from rounding to the nearest 0.25%. c) Limitations
The Guidelines cover the main asset classes―short-term assets, Canadian fixed income, Canadian equities, foreign developed market equities (including U.S. equities and Europe, Australia and Far East equities) and emerging market equities.
3 By rounding to the nearest .25%, a 3.10% result would generate a guideline of 3.00%, while a result of 3.15% would generate a result of 3.25%. By rounding to the nearest .1%, a 3.10% result would maintain the guideline of 3.10%, while a result of 3.15% would generate a guideline of 3.20%.
Guidelines are not provided for other asset classes, including global bonds, U.S. equities, small-capitalization equities, value and growth equities, because they are not addressed in the CPP and QPP actuarial valuation reports. The guideline for foreign developed equities may be used as a proxy for U.S. equities.
Similarly, guidelines are not provided for changes in the real estate market for the following reasons:
• Separate guidelines would have been required for residential, commercial and
industrial buildings. • A regional index would also have been necessary (the real estate market
behaves differently in Montréal, Québec City, Toronto and Vancouver).
When making assumptions around real estate growth, it is important to consider an appropriate starting valuation for the property and use an inflation-based assumption that is suitable based on the local market context.
Guidelines are not provided for exchange rates since the net long-term effect of changes in exchange rates is generally nil. Financial planners should develop sensitivity analysis to illustrate and assess the potential ramifications of changes in exchange rates. Clients who may require income in a foreign currency may wish to maintain assets in that foreign currency to avoid foreign exchange rate risk.
It is also important to note that the Guidelines do not contemplate personal risk profiles. Since an individual’s risk profile or change in risk profile may have consequences at least as significant as or more significant than the rate of return guidelines used in developing financial projections, sound risk assessments are critical.
Assumptions
Page | 6
3. ASSUMPTIONS SUBJECT TO THE GUIDELINES Two types of assumptions are subject to guidelines: financial assumptions (inflation, changes in the year's maximum pensionable earnings [YMPE or MPE], long-term returns on short-term investments, fixed-income securities, Canadian equities, foreign developed-market equities and emerging-market equities, and borrowing rates) and demographic assumptions (life expectancy). a) Inflation
The inflation assumption is central to the preparation of medium- and long-term projections. The inflation assumption is made by combining the inflation assumptions from the following sources (each weighted at 25%):
• the average of the inflation assumptions for 30 years (2017 to 2046) used in the
most recent Quebec Pension Plan (QPP) actuarial report4 • the average of the inflation assumptions for 30 years (2017 to 2046) used in the
most recent Canada Pension Plan (CPP) actuarial report5 • Result of the 2019 FP Canada/IQPF survey of investment professionals. The reduced
average was used where the highest and lowest value were removed. • current Bank of Canada target inflation rate
The result of this calculation is rounded to the nearest 0.10%.
A discussion was held about the use of separate inflation rates for older individuals or high
earners. Two studies by Radu Chiru of Statistics Canada6 demonstrate that there are small differences in inflation for these two groups of Canadians as compared to others, but these differences are not deemed to be material.
i. Wage increases
The inflation assumption can be used to project wage increases by adding 1.00% to reflect productivity gains, merit and advancement.7
It may be appropriate to deviate from the guidelines where a client reasonably expects higher or lower wage increases for the foreseeable future. As an example, where a client is reaching the end of his or her career or is in a position with no real chance of advancement, the financial planner may consider a wage increase equal to or less than inflation.
4 December 31, 2015 QPP actuarial report, published fall 2016. 5 December 31, 2015 CPP actuarial report, published September 2016. 6 Is Inflation Higher for Seniors? (2005) Catalogue no. 11-621-MWE2005027 and Does Inflation Vary with Income? (2005) Catalogue no. 11-621- MWE2005030. 7 In the most recent QPP and CPP actuarial reports, a final margin of 1.10% between wage increases and inflation was applied
Assumptions
Page | 7
ii. Year’s maximum pensionable earnings (YMPE)
The year's maximum pensionable earnings (YMPE) is based on average increases in salaries. Therefore, the inflation assumption plus 1.00% should be used.
b) Nominal returns (before fees)
Rate of return assumptions have been established for short-term investments (91-day T-bills), Canadian fixed- income securities, Canadian equities, foreign developed market equities and emerging market equities. These assumptions represent gross nominal returns (including inflation).
The guidelines were set by combining assumptions from the following sources (each weighted at 25%):
• the average of the assumptions for 30 years (2017 to 2046) used in the most recent
QPP actuarial report • the average of the assumptions for 30 years (2017 to 2046) used in the most recent
CPP actuarial report
• Result of the 2019 FP Canada/IQPF survey of investment professionals. The reduced average was used where the highest and lowest value were removed.
• historic returns over the 50 years ending the previous December 31st (adjusted for inflation)
The historical component is based on the DEX 91-day T-bill index, the DEX Universe Bond™ (Canadian bonds) index, the S&P/TSX (Canadian equities) index, the S&P 500 Composite Index (U.S. equities) and the MSCI EAFE (Europe, Australia, Far East) index.
For the sake of consistency, the aforementioned indices expressed in real returns (returns reduced by the total CPI inflation index as published by the Bank of Canada) are increased by the future inflation assumption (before rounding).
The following considerations are also of note:
i. Short-term
The guideline of 3.0% for short-term investments represents a long-term assumption of short-term returns. As an example, consider the long-term return for a mutual fund holding 5.0% of its assets in short-term investments. Over the long term, these assets would be expected to generate an annual return equal to 3.0%.
For shorter term financial projections (less than 10 years), financial planners may use actual rates of return on fixed term investments held to maturity.
ii. Fixed-income securities
The fixed-income assumptions used in the most recent QPP and CPP actuarial reports have been adjusted to account for the opportunity of the QPP and CPP to buy and hold fixed-
Assumptions
Page | 8
income securities for significantly longer than the typical holding period of individuals. A margin of 0.75% is therefore deducted from the QPP and CPP actuarial assumptions to convert the long-term fixed-income assumptions into a more relevant fixed-income assumption for individual financial planning. The projected fixed-income rate of return can also be applied to preferred share holdings. Please note that this is not an opinion regarding the volatility of preferred shares versus fixed-income securities and that preferred shares can have different characteristics that can impact their pricing.
Furthermore, the historical average return of fixed-income securities has been reduced by a further 0.556% to remove the net price appreciation that has occurred annually over the last 50 years to account for the current and expected lower interest rate environment (see Addendum for a more detailed explanation).
iii. Canadian equities
For investments in Canadian equities, a safety margin of 0.50% is deducted from the result obtained by
weighting the different data sources to compensate for the variability of the long-term returns. The adjustment aligns with the outcome of a Monte Carlo analysis that approximates the probability of future Canadian equity returns by running 300,000 trial runs, called simulations. Financial planners who run Monte Carlo analyses may add back the 0.50%.8
iv. Foreign equities
Foreign equities consist of U.S., Europe, Australia, Far East and emerging market equities. Like for Canadian equities, a safety margin of 0.50% is deducted from the result obtained by weighting the different data sources to compensate for the variability of the long-term returns.
The guideline can be used as a proxy for U.S. equities. No separate guideline is provided for U.S. equities for the following reasons:
• CPP and QPP do not distinguish U.S. equities from foreign developed equities
in their reports, however the reports indicate that U.S. equities are a part of their investment portfolio
• Result of the 2019 FP Canada/IQPF survey of investment professionals. The reduced average was used where the highest and lowest value were removed. The value used is the average between MSCI EAFE index and S&P 500 US index.
Note, however, the historical returns used to develop the guideline for foreign developed equities include the MSCI EAFE Index Foreign Equities (Developed) and the S&P 500 Composite Index for U.S. equities.
8 Dupras, M. (2004, November). Retraite et Monte Carlo. La Cible, 12(4), 6-8.
Assumptions
Page | 9
v. Type of equity return
In a non-registered investment account, projections must take account of income taxes. For significant sums, it might be appropriate to divide the return into two categories: dividends and capital gains. Historically, from 25% to 50% of overall equity returns has been made up of dividends. It therefore seems reasonable to assume that 33% of the overall equity return will be made up of dividends and that the rest will be capital gains.9
vi. Equity risk premiums
Since risk taking must be rewarded, equity returns are developed by adding an equity risk premium to the long-term bond returns. Not surprisingly, historical equity risk premiums have decreased over time due to several non-repeatable factors (mainly diversification and globalization) and are almost identical for Canadian and foreign developed markets at 2.5% and 2.8% respectively. The equity risk premium for emerging market equities is expected to be 3.5%, reflecting the additional risk inherent with investments in emerging countries. It is important to note that the world economy has become increasingly financially integrated. Countries, financial institutions and businesses have become increasingly large, with a more sophisticated and interconnected range of activities. When one country experiences a financial crisis, it quickly propagates among others.
vii. Blend of forecasting and backcasting
The Guidelines consider both expected future economic behaviour based on assumptions provided in the QPP and CPP actuarial analyses and the 2019 FP Canada/IQPF survey, as well as historical market performance. Projecting the future by relying solely on historical returns would suggest an expectation that the future will mirror the past. This is not the expectation. In addition to increasingly greater globalization, demographic changes, including labour participation rates and dependency ratios, are predicted to have a significant impact on the economy going forward. Therefore, a sole reliance on historical returns to project the future would have major limitations.1011
c) Considerations concerning fees12
The investment management fees paid by clients must be subtracted to obtain the net return. Depending on the type of asset management clients use (mutual funds, pooled funds, advisor managed account, etc.), these fees can easily range from 0.5% to 2.5%. When a client's portfolio is made up of a wide variety of mutual funds with different management expense ratios, an average fee ratio per asset class may be used. All fees, paid directly or indirectly,
9 Projection Assumption Standards Committee analysis completed using the S&P/TSX total return index 10 Foot, D. K. & Stoffman, D. (1996). Boom, Bust & Echo: How to profit from the coming demographic shift. Toronto: Macfarlane, Walter & Ross. 11 Vettese, F. (2015). The Road to Retirement. The Essential Retirement Guide: A Contrarian's Perspective. New Jersey: John Wiley & Sons. 12 Lussier, J. (2013). Successful Investing Is a Process: Structuring Efficient Portfolios for Outperformance. New Jersey: John Wiley & Sons.
Assumptions
Page | 10
that impact potential return, must be considered in the calculation.13 Transparency around fees is important, in terms of the amount of fees charged (direct or indirect), the impact of fees on investment performance and the value the financial planner provides in exchange.
d) Borrowing rate
A great number of factors influence a client's borrowing rate, such as the type of loan and the client's credit history. However, consider the following relationships:
• There is a very strong correlation between the target overnight rate and the 91-day T-
bill rate. • The bank rate is set by adding 0.25% to the target overnight rate. • The prime rate is set by adding 1.75% to the bank rate.
For an individual with an average credit rating, the borrowing rate assumption is equal to the return assumption for 91-day T-bills plus 2.00%. While recent borrowing rates have been relatively low, the Guidelines are forward looking and reflect expectations over the longer term. Primarily, the borrowing rate assumption was provided to help illustrate the potential impact of a borrowing to invest strategy over the long-term. That is, while current short-term borrowing rates are low by historical standards, borrowing rates can change and need to be appropriately accounted for in projections. It is prudent professional practice to consider the potential for borrowing rates to increase for purposes of assessing the relative benefits and risks associated with leveraging. It is also sensible to use a long-term borrowing rate assumption when projecting the impact of debt on a client’s financial position over the longer term. Actual borrowing costs may be more logically used for short-term projections.
e) Life expectancy
There are several different mortality tables, each based on a specific target group. The following factors are examples of target group characteristics:
• gender • smoker or non-smoker status • place of residence (e.g., province, country) • evidence of good health (for life insurance pricing) • wealth14 • being retired
The 2014 Canadian Pensioners’ Mortality Table15 may be used as the basis for assuming an individual’s life expectancy. While the table reflects the average probability of survival for a
13 Examples of these fees may include, but are not limited to, management expense ratio, advisory fees, custodian fees, trailing fees, commissions and transaction costs 14 Statistics Canada. Table 102-0122 - Health-adjusted life expectancy, at birth and at age 65, by sex and income, Canada and provinces, occasional (2005-2007), CANSIM table (102-0121). (accessed:2013) 15 2014 Canadian Institute of Actuaries Canadian Pensioners’ Mortality Report.
subset of the Canadian population (i.e. Canadian pensioners), it can be appropriately used to represent the life expectancy of the full Canadian population, given its bias toward longer life expectancies provides a more conservative approach to developing projections.
Projection Period
It is recommended to assume a projection period for clients where the probability of outliving their capital is no more than 25%. Forecasting a longer projection period offers protection from future improvements in mortality and accounts for the greatest financial risk to an individual: longevity risk. It is also recommended that the greatest mortality age be used that corresponds to the client’s circumstances, unless there is substantial information suggesting an adjustment should be made. This recommendation aligns with the expected growth in the number of centenarians in Canada.16 Financial planners are encouraged to develop sensitivity analyses related to mortality (e.g. +/- 5 years), given the dramatic effects that may result when the projection period is changed by a relatively small number of years.
Probability of Survival
10% 15% 20% 25% 30% 35% 40% 45% 50%
Current Age M F M/F M F M/F M F M/F M F M/F M F M/F M F M/F M F M/F M F M/F M F M/F
Based on the table, a 70-year old would have a 25% chance of living to at least age 94 for a man and at least age 96 for a woman (25% column); by comparison, a 70-year old would have a 10% chance of living to at least age 97 for a man and age 99 for a woman (10% column). A 70 year-old couple would have a 25% chance that one of the members of the couple will live to at least age 97 and a 10% chance that one of the members of the couple will live to at least age 100. Again, to be prudent, it is recommended that financial planners select a projection period where the probability of survival is no more than 25% (25% column).
With the example of the 70 year-old male/female couple, a projection period of 27 years (to age 97) could be used with the 25% probability that one of them may outlive their capital. It is important to remember that this table is intended to represent the average probability of survival for the entire population. People who are more financially comfortable and who have shown evidence of good health may find their life expectancy more toward the left end of the chart (the 10% survival group).
It is interesting to note that hereditary factors are not significant in predicting life
expectancy.17 In contrast, the use of tobacco has a significant impact on life expectancy. A Statistics Canada publication from 200118 concludes that a 45-year-old smoker will survive 20% to 25% fewer years, depending on sex, than a non-smoker of the same age. This could be taken into consideration by using the 30% column in the above table for smokers and the 10% to 25% columns for non-smokers.
It is also interesting to observe that as advancements in medical science occur, those who are younger today may have the opportunity to benefit from these advancements for a longer period than those who are older today. These effects can be seen in the 50% column in Probability of Survival table above by the initial decline in life expectancy as current age increases (e.g. a 30-year-old today has a higher life expectancy than their 60-year-old parent). This decline in life expectancy reverses at around age 80 because those who have already reached an older age today are more likely to continue to benefit from increased longevity.
17 Wilhelmsen, L., Svärdsudd, K., Eriksson, H., Rosengren, A., Hansson, P. O., Welin, C., ... & Welin, L. (2011). Factors associated with reaching 90 years of age: a study of men born in 1913 in Gothenburg, Sweden. Journal of internal medicine, 269(4), 441-451. 18 http://www.statcan.gc.ca/daily-quotidien/010622/dq010622a-eng.htm
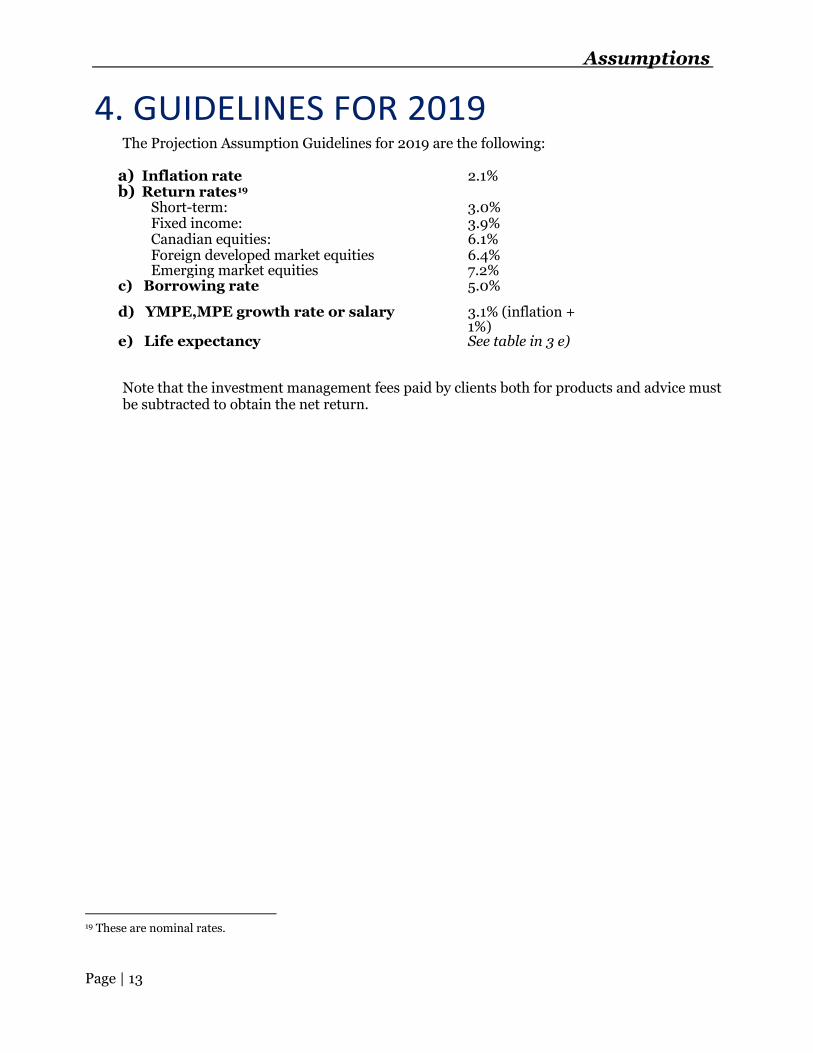
4. GUIDELINES FOR 2019 The Projection Assumption Guidelines for 2019 are the following:
a) Inflation rate b) Return rates19
2.1%
Short-term: 3.0% Fixed income: 3.9% Canadian equities: 6.1% Foreign developed market equities 6.4% Emerging market equities 7.2%
c) Borrowing rate 5.0%
d) YMPE,MPE growth rate or salary 3.1% (inflation + 1%)
e) Life expectancy See table in 3 e)
Note that the investment management fees paid by clients both for products and advice must be subtracted to obtain the net return.
19 These are nominal rates.
Assumptions
Page | 14
5. SAMPLE APPLICATION By way of example, for a projection prepared in 2019 for diversified portfolios broken down based on different scenarios, where the fees are 1.25% annually, we could use the following return assumptions:
Portfolio return assumptions based on asset allocation Investor profile: Conservative Balanced Aggressive
All
ocat
ion
Short-term: 5% 5% 5% Fixed income: 70% 45% 20% Canadian equities: 25% 40% 35% Foreign developed market equities
0 10% 25%
Emerging market equities 0 0 15% Gross return before fees 4.41% 4.99% 5.75% Assumed fees 1.25% 1.25% 1.25% Net return after fees 3.16% 3.74% 4.50%
These assumptions also depend on the investor’s profile not changing over the years. If a client’s investor profile is likely to change, it might be preferable to consider using an “average target allocation”.
It is important to note that actual net portfolio returns will depend on actual product and portfolio related fees.
Assumptions
Page | 15
6. FINANCIAL GUIDELINES FOR PREVIOUS YEARS The following table lists the financial guidelines for previous years along with their effective dates (the current guidelines are shown for comparison purposes):