PROLOGIS HERCULES PIPELINE REMOVAL BIOLOGICAL ASSESSMENT AND ESSENTIAL FISH HABITAT EVALUATION Prepared for Hercules LLC (Prologis) Pier 1, Bay 1 San Francisco, CA 94111 Prepared by 327 Jersey Street San Francisco, CA 94114 & Andy Jahn PhD JUNE 2013
Transcript
PROLOGIS
HERCULES PIPELINE REMOVAL
BIOLOGICAL ASSESSMENT
AND
ESSENTIAL FISH HABITAT EVALUATION
Prepared for
Hercules LLC (Prologis) Pier 1, Bay 1
San Francisco, CA 94111
Prepared by
327 Jersey Street
San Francisco, CA 94114
&
Andy Jahn PhD
JUNE 2013
Table of Contents
Prologis Hercules Pipeline Removal June 2013 Biological Assessment i
1 INTRODUCTION ...................................................................................................................................... 1 1.1 Project Description .............................................................................................................................. 1 1.2 Construction Methods ........................................................................................................................ 3 1.2.1 Shore‐side portion of the pipeline removal ................................................................................. 4 1.2.2 Pipeline Removal in the Bay ......................................................................................................... 6
1.3 Project Construction Schedule and Equipment to be Used ................................................................ 8
2 AVOIDANCE AND MINIMIZATION MEASURES ...................................................................................... 10
4 LISTED SPECIES AND RESOURCES OF CONCERN POTENTIALY IN THE STUDY AREA ............................. 25 4.1 Green sturgeon Southern DPS (Acipenser medirostris): Status: federal threatened (FT) .......... 25 Presence during Project activities ....................................................................................................... 26 Encounter rates at Project site ........................................................................................................... 26
4.2 Salmonids (2 species, 4 ESUs) ..................................................................................................... 27 Presence of Salmonids during Project Activities ................................................................................. 29 Encounter Rates at Project Site .......................................................................................................... 29
4.3 Longfin smelt (Spirinchus thaleichthys): Status: ST. ................................................................... 30 Presence during Project activities ....................................................................................................... 33 Encounter Rates at Project Site .......................................................................................................... 33
4.4 Delta Smelt (Hypomesus transpacificus). Status: SE, FT. ............................................................ 33 Presence during Project activities. ...................................................................................................... 34
4.5 EFH Species ................................................................................................................................. 35 4.6 Habitats of Particular Concern (HAPC) ....................................................................................... 36 Eelgrass (Zostera marina) Beds ........................................................................................................... 36 Native Olympia oyster (Ostrea conchaphila) Beds ............................................................................. 36
5 ANALYSIS OF EFFECTS ........................................................................................................................... 37 5.1 Resuspension of Sediments from Removal of Pipeline .............................................................. 37 Suspended sediment effects on fish ................................................................................................... 39
5.2 Potential impacts to benthic habitat ................................................................................................ 40
Prologis Hercules Pipeline Removal June 2013 Biological Assessment ii
List of Tables
Table 3‐1 Hercules Pipeline Sediment Grain Size, Total Solids, and TOC Table 3‐2 Hercules Pipeline Sediment Metals Concentrations (mg/kg, dry wt.) Table 3‐3 Hercules Pipeline Sediment PAH Concentrations (µg/kg dry wt) Table 3‐4 Hercules Pipeline Sediment Organochlorine Pesticide Concentrations (µg/kg dry wt) Table 3‐5 Hercules Pipeline Sediment PCB Congener Concentrations (µg/kg dry wt) Table 3‐7 Effects of HP‐Comp Sediment Elturiate on Americamysis bahia Table 4‐1 Total CDFW midwater trawl captures of Chinook salmon in San Pablo Bay, 1980‐2011 Table 4‐2 Managed Fish Species in San Pablo Bay under the Magnuson‐Stevens Act Table 5‐1 Response of Marine Species to a Certain Concentration of Suspended Sediments
List of Figures
Figure 1‐1 Vicinity Map and Project Location Figure 3‐1 Sediment Sampling Stations Figure 4‐1 CDFW Bay Study Stations Figure 4‐2 Cumulative Bay Study midwater trawl Chinook captures by Month (Jahn 2011a) Figure 4‐3 Annual average (June‐October) CPUE of longfin smelt in San Pablo Bay otter trawl samples vs.
January‐June X2 Figure 4‐4 Summertime catch rate of longfin smelt during the modern era vs. X2
Appendices
A – Sampling and Analysis Results Report B – Longfin smelt data analysis details
List of Acronyms
Prologis Hercules Pipeline Removal June 2013 Biological Assessment iii
BA Biological Assessment
COC contaminants of concern
CDFG California Department of Fish and Game (former CDFW name)
CDFW California Department of Fish and Wildlife
cm centimeters
cy cubic yards
DPS distinct population segment
EFH Essential Fish Habitat
ESA Endangered Species Act
ESU evolutionarily significant unit
ft feet
ft/sec feet per second
ha hectares
IEP Interagency Ecological Program
km2 square kilometers
kg kilograms
m meters
m3 cubic meters
mm millimeters
µg/kg micrograms per kilogram
mg/L milligrams per Liter
MLLW Mean Lower Low Water
MSFCMA Magnuson‐Stevens Fishery Conservation and Management Act
NMFS National Oceanic and Atmospheric Administration National Marine Fisheries
Service
RWQCB Regional Water Quality Control Board
SFA Sustainable Fisheries Act
SLC State Lands Commission
TSS total suspended solid
USACE U.S. Army Corps of Engineers
USEPA U.S. Environmental Protection Agency
USFWS U.S. Fish and Wildlife Service
WQC water quality criteria
YOY young‐of‐the‐year
Prologis Hercules Pipeline Removal June 2013 Biological Assessment 1
1 INTRODUCTION
This Biological Assessment (BA) has been prepared on behalf of Hercules LLC (Prologis) for the proposed
removal of an abandoned waste water pipeline offshore of the city of Hercules (Project). The Project
and its potential effects to threatened and endangered species are described and evaluated in this BA.
The species of concern are under the purview of the National Oceanic and Atmospheric Administration
National Marine Fisheries Service (NMFS) and the U.S. Fish and Wildlife Service (USFWS) under Section 7
of the Federal Endangered Species Act (FESA), and for Essential Fish Habitat (EFH) under the Magnuson‐
Stevens Fishery Conservation and Management Act (MSFCMA). This BA also addresses the potential for
“take” of state listed species under the California Endangered Species Act (CESA) (Cal Fish and Game
Code sec. 2080 et. seq.).
The BA concludes that the removal activities are not likely to adversely affect individuals of the southern
distinct population segment (DPS) green sturgeon, Sacramento River winter‐run Chinook, Central Valley
spring‐run Chinook, Central valley steelhead, or Central California Coast steelhead evolutionarily
significant units (ESUs), Longfin smelt, and Delta smelt. In addition, proposed pipeline removal activities
are not expected to degrade EFH in the San Francisco Bay.
This analysis also concludes that, due to the temporary nature of the Project, the Project will not cause a
“take” (as defined under CESA) of any state listed species.
1.1 Project Description
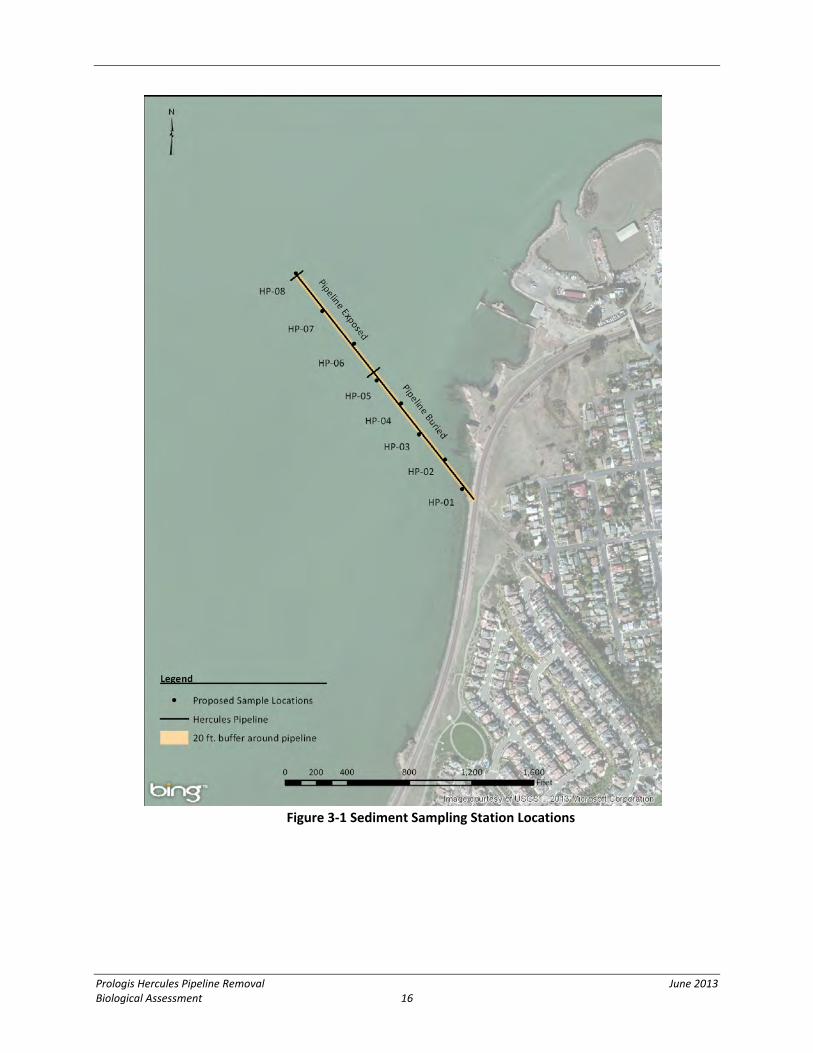
Prologis proposes to remove an 8 inch steel wastewater outfall pipeline located in Hercules (Figure 1‐1).
The pipeline extends approximately 2,000 ft into the San Pablo Bay (Bay). The wastewater outfall
pipeline is buried approximately 1,200 feet from the shoreline in varying depths of sediment, and the
remainder of the pipeline rests on the sediment surface.
The pipeline was originally associated with Sequoia Refining (Sequoia), a subsidiary of Gulf Oil. The
pipeline was originally built in 1966 for the Sequoia Petroleum Refinery (Refinery), and operated for 31
years until ceasing operations in 1997. The Refinery was built on a 200 acre parcel of vacant industrial
land adjacent to San Pablo Bay in Hercules, CA. Because of draft limitations (shallow mudline
elevations) near shore, oil deliveries were received through a free‐standing marine oil terminal (MOT),
about ¾ mile out in the Bay. The oil was then transported to shore through pipelines buried under the
Bay. Sequoia also installed the 8 inch wastewater outfall pipeline which shares a portion of the oil
pipeline trench. The wastewater outfall pipeline is buried in varying depths of sediment for
Prologis Hercules Pipeline Removal June 2013 Biological Assessment 2
Figure 1‐1 Vicinity Map and Project Location
Prologis Hercules Pipeline Removal June 2013 Biological Assessment 3
approximately 1,200 feet from the shoreline and the remainder of the pipeline rests on the sediment
surface. The MOT and pipelines are situated on land leased from the California State Lands Commission
(SLC).
Sequoia sold the refinery in 1976 to Pacific Refining (PRC), a subsidiary of Coastal Corporation (Coastal).
(PRC is now known as Coscol Petroleum, a subsidiary of El Paso Natural Gas now owned by Kinder
Morgan Inc.) In the mid‐1990s, Coastal decided to sell the Refinery, and Catellus, through a joint
venture known as Hercules LLC (HLLC). HLLC purchased the site in 1997 for redevelopment as a
residential project. In a series of transactions over the years, Catellus became the sole partner in HLLC,
an interest subsequently acquired by Prologis.
PRC retained ownership of and responsibility for the MOT, its pipelines, and the associated SLC lease.
During the summer of 2010, PRC contractors demolished the MOT and abandoned its associated
petroleum lines. SLC agreed that the petroleum pipelines could be cut below the mudline, grouted in,
and abandoned in place. The PRC project complied with the California Environmental Quality Act (CEQA)
through a Mitigated Negative Declaration (MND) with SLC as the lead agency (SCH #2009032085 File
Ref: W30068‐13; PRC 3414.1 CSLC MND #750).
The land‐based portion of the Refinery was decommissioned, dismantled, remediated, and redeveloped
for housing, commercial use, and open space. The site remediation plan included groundwater
extraction and treatment for which the Refinery wastewater outfall pipeline was essential, so PRC’s SLC
lease was bifurcated, and the portion on which the wastewater pipeline is located was assigned to
HLLC/Prologis. HLLC site remediation was completed in 2001, and the wastewater pipeline has been out
of service since that time. The overall redevelopment project was substantially completed in 2006.
The HLLC/Prologis Lease No. PRC 7985.1 expires on August 31, 2017. At the termination of lease, the
Lessee is obligated to remove all improvements (pipeline) and return the premises to conditions existing
prior to construction. In order to meet the obligations of the lease, Prologis will be removing the
pipeline.
1.2 Construction Methods
In‐water construction activities and best management practices are based on design information
provided by the Project Sponsor, and typical construction practices in San Francisco Bay. All in‐water
construction will be conducted in compliance with regulatory permits, including scheduling of work
during appropriate seasons to minimize or avoid effects on sensitive biological resources. The following
sections detail the proposed methods for removing the pipeline. Additional details, with any deviations
to prescribed methods detailed in this application, will be provided to the regulatory agencies after the
Prologis Hercules Pipeline Removal June 2013 Biological Assessment 4
construction bid is awarded and prior to initiation of construction. Detailed work plans will be provided
for review and approval prior to any construction.
1.2.1 Shore‐side portion of the pipeline removal
The shore‐side work will be conducted first. The onshore work to abandon the pipeline in place
would occur where the rip rap is located on the embankment portion of the Union Pacific Railroad
Right of Way (UPRR ROW) where the rip rap would be temporarily relocated to expose the pipeline.
Disturbance is not anticipated to the surface of Victoria By The Bay Park, the existing or planned Bay
Trail sections, or the Union Pacific Railroad train tracks and immediate right‐of‐way. The work in the
Bay would remove the pipeline buried beneath the Bay muds and transport it to a permitted and
appropriate recycling or disposal facility.
The 160‐foot‐long section of the pipeline is located on land. When the remediation on the refinery
site was completed, the pipeline was cut and capped with a steel flange which was welded in place,
and the location was backfilled. From the point at which the line is capped underground inside the
park, it continues toward the Bay and crosses through a steel sleeve beneath the Union Pacific
Railroad tracks, and extends beneath shoreline rip rap and under the mudline at which point it
extends approximately 2,000 feet bayward ending at the diffusers.
The 160‐foot‐long shore‐side portion of the project pipeline would be abandoned in place. Work
would occur from the water over an approximately 5‐day period, using a 4‐step process, as follows:
(1) a small area of rip rap (10 feet length x 10 feet width x 5 feet deep) between the railroad tracks
and the Bay would be removed to expose the pipeline, (2) the exposed section of pipeline on the
west side of the railroad tracks would be cut at or near the mudline and where the pipeline turns
east horizontally near the top of the embankment to cross beneath the railroad tracks, and the cut
section removed, (3) the wastewater pipeline and the casing below the railroad tracks extending to
the line's end in the Victoria By The Bay Park would be grouted and left in place, and (4) the rip rap
would be replaced along the shoreline. Best management practices (BMPs) would be employed to
prevent sediment, grout or other construction materials from entering the Bay as a result of
activities associated with abandoning the pipeline segment in place.
The shore‐side work would be done from the water. A tug boat would position a crane barge (a
shallow draft barge with a crane) close to the shore during high tide, and the barge would remain in
place for the duration of the shore‐side work. The barge would be mobilized to the work location
from the contractor’s shore‐based marine facility. A crew boat would ferry key personnel to and
from the barge. The barge would be located close to the shore, and personnel would also access the
land via a gangway from the barge. The barge would have a five to seven person crew and the
Prologis Hercules Pipeline Removal June 2013 Biological Assessment 5
tugboat would have a two person crew. When feasible, the barge would use spuds to secure its
position. The spuds will minimize anchoring and disturbance to the surrounding sediments. To
remove shoreline riprap and expose the final segment of pipeline, the shallow draft barge would
remain in place to conduct construction activities. During low tides the barge may rest on the
sediment surface until the rising tide. In addition to using a crew boat, personnel would be
transported to the barge by means of a gangway from the shore which would further reduce
disturbance to bottom sediments. The gangway would be hauled onto the barge every night for
security purposes (i.e., to prevent unauthorized access). A tug boat, working skiff, or a crew boat
would bring in materials and personnel to the barge as needed. Trips would be minimized and vessel
speeds in this area would be limited to no‐wake to minimize the disturbance to fish in the
immediate vicinity.
The shore‐side work would occur in 10 hour shifts from approximately 7:00AM‐5:00PM during the
weekdays to comply with the City noise ordinance unless extended work hours are approved by the
City. There would be no work at night or any lights or noise from the barge once the work has shut
down each day, other than safety‐related lighting required to comply with United States Coast
Guard regulations.
Rip Rap Removal
The crane on the crane barge would be used to access the rip rap area on the Bay (west) side of
the railroad tracks. The crane would use a clam shell bucket to temporarily remove the rip rap,
stockpile it atop other rip rap, and, after completion of the grouting, replace the rip rap. The
volume of rock to be relocated would be approximately 20 cubic yards (10 feet length x 10 feet
width x 5 feet deep). Authorization would be obtained from UPRR before the start of work.
Wastewater Pipeline Cut and Removal
Once the wastewater pipeline is exposed by removal of the rip rap on top of it, it will be cut at or
near the mudline and near the top of the embankment. The pipe would be cut using an oxy‐
acetylene torch. The pipe would be cut by an approximately 3‐4 person crew as needed to safely
complete the work. The estimated duration of the work is one day. This work would occur within
the UPRR ROW.
The cut section(s) would be lifted out and placed on the barge for transport to the Contractor’s
shore based facility where it would be loaded onto a truck for transport to a recycling and/or
disposal facility.
Prologis Hercules Pipeline Removal June 2013 Biological Assessment 6
Wastewater Pipeline Left in Place
The remaining pipeline between the top of the embankment and the end of the pipe beneath the
park would be grouted, capped, and left in place. Both the wastewater pipeline and the casing
surrounding the pipeline will be grouted. The grouting operation would be based on the barge.
Support activities would also be primarily located on the barge. The pipeline would be grouted by
inserting a tremie pipe horizontally into the line at its western terminus. Grout would then be
pumped into the wastewater pipeline, working from the capped eastern terminus back to the
western end of the pipeline. After completion, the western end of the pipeline would be capped.
The only land‐based activities that would be required to conduct this work would consist of having
several workers present to insert the tremie pipe into the remnant wastewater pipe. Grouting of
the pipeline is expected to take less than one day.
A Grout Management Plan and BMPs would be employed so that no grout or other materials are
discharged into the Bay. All grouting equipment would be staged on the deck of the barge inside
spill guards. Watertight portable tanks would be used to contain and transport washout water.
Tremie methods would be used to place all grout so that placement can be monitored and
controlled. Grout hoses and fittings would be in new or like‐new condition, and would be visually
inspected prior to use. Grout mix would be pre‐mixed in super sacks and stored on the barge. Any
spills of dry mix would be cleaned up with shovel and broom (i.e., no water would be used).
Secondary containment would be used under Tremie hose connections. Any debris or excess
grouting material would be removed from the site and recycled or disposed of at an appropriate
facility.
Rip Rap Replacement
Upon completion of the onshore pipeline removal and grouting, the stockpiled rip rap rock would
be placed back into position with the clamshell bucket. It is anticipated that the clean stockpiled
rip rap would be sufficient to cover the area, and no import of new rip rap is proposed. The rip rap
would be placed to cover the cut and capped end of the wastewater pipeline and result in a
shoreline similar to existing conditions.
1.2.2 Pipeline Removal in the Bay
A barge (a derrick barge) and a tug boat would be used to remove the wastewater pipeline, diffuser,
and the three steel plates that have been used to secure the pipeline near the diffuser. The barge
would have a five to seven person crew plus 3 divers when necessary and the tugboat would have a
two person crew. The barge would be equipped with two spuds and four anchors which would be
controlled by deck‐mounted winches. The spuds and anchors would be deployed to minimize the
Prologis Hercules Pipeline Removal June 2013 Biological Assessment 7
disturbance of sediment (e.g. not dragging anchors along the seafloor). Only spuds would be used,
unless currents and/or wind require the use of anchors; depending on the need to move or hold
position, both spuds and anchor(s) could be utilized simultaneously. The anchors would be deployed
and recovered with the use of a tugboat. All these operations are typical of marine industry
standards in the San Francisco Bay area.
Pipeline removal would begin at the western end (diffusers) of the pipeline, approximately 2,000
feet offshore. Divers would attach straps and lines to the end of the pipeline, and a barge‐mounted
winch would lift the pipeline to the surface. The lifting operation would be conducted at a slow rate
so that the small amount of sediment over the submerged portions of the pipeline would resettle
with minimal disruption. No dredging or water‐jetting of the Bay floor is planned in connection with
the removal process. In shallower depths the barge would sit on the bottom during low tides. The
footprint of the area potentially affected by the removal of the pipeline is the extent of the pipeline
and approximately 10 feet on either side of the pipeline (approximately 40,000 square feet/0.92
acres).
The pipeline would be slowly winched in to lift the pipeline up through the sediment and water onto
the barge. Because the pipeline is approximately 8 inches in diameter and the surrounding sediment
is soft and loose (not significantly consolidated), the pipeline would be expected to move readily
through the sediment to the surface. As the pipeline moves through the mud, the sediment would
fall in on the void below. Sediment would only be resuspended at the point where the pipeline is
pulled above the top of the sediment into the water. It is anticipated that only the top foot of the
sediment would be disturbed as the pipeline is lifted and turbidity would be minimal at the point of
extraction.
The turbidity would occur temporarily as each section of the pipeline is raised. Approximately
150‐200 feet of pipeline would be removed each day. The work would occur in 10 hour shifts from
approximately 7:00AM‐5:00PM during the weekdays. Pipeline removal in the Bay is expected to
require approximately 2 to 3 weeks. Work during the daylight hours without the use of lights will
minimize the disturbance to fish and other animals in the project work area. There would be no
work at night or any lights or noise from the vessel once the work has shut down each day, other
than navigational safety lighting required by United States Coast Guard regulations.
The wastewater pipeline would be pulled onto the barge where divers and barge personnel would
secure the pipe to be cut. The recovered pipe length for each segment that is pulled up would be
determined by the final contracted barge capacity but is anticipated to be no more than
approximately 50 feet in length. Once the pipeline has been extracted and placed on the barge, the
Prologis Hercules Pipeline Removal June 2013 Biological Assessment 8
divers and platform personnel would secure the pipeline so that it can be cut. The pipeline would be
cut with oxy‐acetylene torches or mechanical shears. The cut portions of the pipeline would be
stored on the barge. The procedure would continue shoreward with lifting pipeline, attaching it to
the barge and cutting sections. The Project would minimize sediment disturbance and total
suspended solids by keeping all equipment out of the water, and slowly lifting the pipeline from the
sediment and through the water column. Due to the shallow water depth near shore, the last
portion of the pipeline may be pulled from the shore toward the barge.
Once sufficient sections of pipeline are lifted and cut, the barge would transport the sections to the
contractor’s shore‐based marine facility (the contractor’s permanent base of operations). The barge
would have the capacity to accumulate and then transport 20 50‐foot sections. The entire project
would therefore require two barge trips to haul the cut sections to the contractor’s shore‐based
facility. The pipeline sections and any debris would be offloaded from the barge, the coatings would
be removed as necessary, and the pipe sections would be loaded onto trucks for recycling and/or
proper disposal. Any pre‐recycling or pre‐disposal testing of the pipeline required by the
recycling/disposal facility would occur once the pipeline is on the barge or onshore at the
contractor’s shore‐based facility. The pipeline would be recycled and/or disposed of, as appropriate,
based on the type and condition of the pipe and coating.
A crew boat would ferry personnel to and from the barge. A tug boat would bring in a secondary
barge and materials as needed. Trips would be minimized and vessel speeds in this area would be
limited to no‐wake in order to minimize disturbance to fish in the immediate vicinity.
1.3 Project Construction Schedule and Equipment to be Used
The entire project is expected to be completed over an approximately three‐week period. Project‐
related activities would be performed between the hours of 7:00 am to 5:00 pm on weekdays,
unless extended work hours are approved by the City.
Prior to commencement of the proposed Project. All construction in the water would be conducted
in compliance with regulatory permits, including scheduling of work during appropriate
seasons/construction windows to minimize or avoid effects on sensitive biological resources. Work
would be conducted within the environmental windows between June 1 and October 31 to avoid
impacts to listed species. All staging, fueling, and maintenance would be conducted on the barge in
compliance with US Coast Guard (USCG) regulations.
Equipment that would be required to implement the project would consist of the following:
Prologis Hercules Pipeline Removal June 2013 Biological Assessment 9
A derrick barge only during the offshore pipeline work equipped with two spuds and four
anchors (spuds and anchors are controlled by deck‐mounted winches) and electrical generator;
A crane barge only during the onshore pipeline work equipped with a crane and clamshell
4.3 Longfin smelt (Spirinchus thaleichthys): Status: ST.
The United States Fish and Wildlife Service (USFWS 2012) stated "The U.S. Fish and Wildlife Service has
found that the San Francisco Bay‐Delta Distinct Population Segment (DPS) of longfin smelt warrants
protection under the Endangered Species Act. However, the Service is precluded at this time from
proposing to add the species to the Federal List of Threatened and Endangered Species by the need to
address other higher priority listing actions."
CDFW (CDFG 2009) summed up San Francisco Bay longfin smelt biology as follows:
Longfin smelt are pelagic, estuarine fish which range from Monterey Bay northward to Hinchinbrook Island, Prince William Sound Alaska. In California, they have been commonly collected from San Francisco Bay, Eel River, Humboldt Bay and Klamath River. Presently, the only California collections made in the 1990s have been from the Klamath River and San
Prologis Hercules Pipeline Removal June 2013 Biological Assessment 31
Figure 4‐2. Cumultive Bay Study midwater trawl chinook captures by month (from Jahn 2011a)
Francisco Bay. Longfin smelt reach a maximum size of about 150 mm TL. Longfin smelt comprise a small portion of the "whitebait" fishery in San Francisco Bay and have no sport fishery value.
Maturity is reached toward the end of their second year. As they mature in the fall, adults found throughout San Francisco Bay migrate to brackish or freshwater in Suisun Bay, Montezuma Slough, and the lower reaches of the Sacramento and San Joaquin Rivers. Spawning probably takes place in freshwater.
In April and May, juveniles are believed to migrate downstream to San Pablo Bay; juvenile longfin smelt are collected throughout the Bay during the late spring, summer and fall , and occasionally venture into the Gulf of the Farallons. Juveniles tend to inhabit the middle and lower portions of the water column.
Longfin smelt is well‐sampled by several programs run by the California Department of Fish and Wildlife
(formerly CDFG), in particular the Bay Study, which provided data for the analyses presented below and
in Appendix B. Annual abundance of longfin smelt is increased in wet years (as indicated by smaller
values of X2; see Jassby et al. 2005), a relationship shown in Figure 4‐3. In recent years, X2 (the distance
upstream from the Golden gate at which the bottom salinity averages 2 PSU over a tidal cycle) is
Prologis Hercules Pipeline Removal June 2013 Biological Assessment 32
managed such that large landward movements of the brackish habitat generally do not occur (Feyrer et
al. 2007).
Figure 4‐3. Annual average (June through October) CPUE of longfin smelt in San Pablo Bay otter trawl samples vs. January through June X2 ( averaged data from http://www.water.ca.gov/dayflow/docs/)
The decline in abundance of longfin smelt in the past decade is well‐documented (Jassby et al. 2005,
CDFG 2009 and references therein) and is the reason for the State and incipient federal listings of the
species. USFWS (2012) stated, "The combined effects of reduced freshwater flows, the invasive overbite
clam (reduced levels of phytoplankton and zooplankton that are important to the Bay‐ Delta food web),
and high ammonium concentrations act to significantly reduce habitat suitability for longfin smelt." We
note here that none of these major threats apply to San Pablo Bay, although the movement of smelt
into San Pablo Bay is certainly augmented by high river flows in some years, affecting local abundance
even during the recent period of low abundance (Figure 4‐4).
Prologis Hercules Pipeline Removal June 2013 Biological Assessment 33
Figure 4‐4. Summertime catch rate of longfin smelt during the modern era vs. X2
Presence during Project activities
Unless the Project is performed in a wet year, then the expected San Pablo Bay capture rate of
smelt would be expected to be <10 fish per hectare (Figure 4‐4; the average summer catch for
all the years shown in the figure is 16 fish per Ha). The mean June‐October catch rate from
2001‐2011 at station 319, near the proposed Project site, was <4 fish/Ha. The catch rate is not
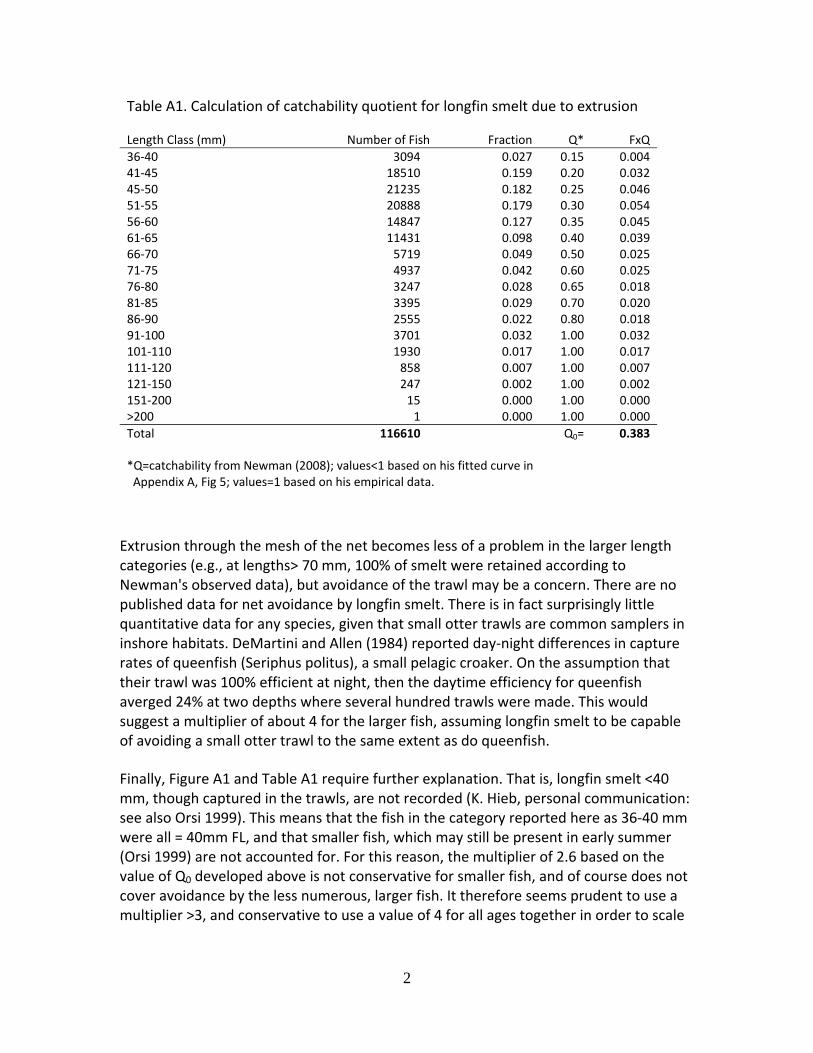
abundance per se, because small fish can escape through the meshes of the net and older fish
may avoid the net. As developed in Appendix A, a conservative estimate is that true longfin
smelt abundance is roughly 4 times the standardized catch rate.
Encounter Rates at Project Site
Longfin smelt may be present within the footprint of the proposed construction activities.
4.4 Delta Smelt (Hypomesus transpacificus). Status: SE, FT.
Delta smelt is a small, annual osmerid that has declined in recent decades, such that it was listed as
threatened under both federal and state Endangered Species Acts in 1993 and elevated to State
Endangered status in 2010. This smelt is a low‐salinity specialist endemic to the San Francisco estuary.
Prologis Hercules Pipeline Removal June 2013 Biological Assessment 34
Bennet (2005) reported that >90% of all delta smelt captured were taken at salinities <6 psu. This
salinity restriction included virtually all juveniles taken in the IEP Summer Tow Net samples.
While the historic range of delta smelt extends to western San Pablo Bay and even to Berkeley, Merz et
al. (2011) show a more contracted distribution in recent years. They wrote,"Outside the [lower
Sacramento River downstream to Suisun Marsh], the cache Slough and Ship Channel was the only region
that yielded high catches of delta smelt relative to other regions across multiple life stages for years
1995‐2009." The highest annual average frequency of capture for any life stage in eastern San Pablo Bay
was 3.6% (for juvenile delta smelt in the Summer Tow Net surveys). However, Merz et al. chose a time
period that covers part of two distinct eras in delta smelt abundance: post‐drought and POD (pelagic
organism decline; Sommer et al. 2007). In the POD period, i.e., since 2001, the CDFW/IEP Bay Study
trawl program has captured only a single delta smelt in the midwater trawl and none in the otter trawl.
Presence during Project activities.
Unless 2014 is an exceedingly wet year, delta smelt will not likely occur in San Pablo Bay during
the proposed activity.
Prologis Hercules Pipeline Removal June 2013 Biological Assessment 35
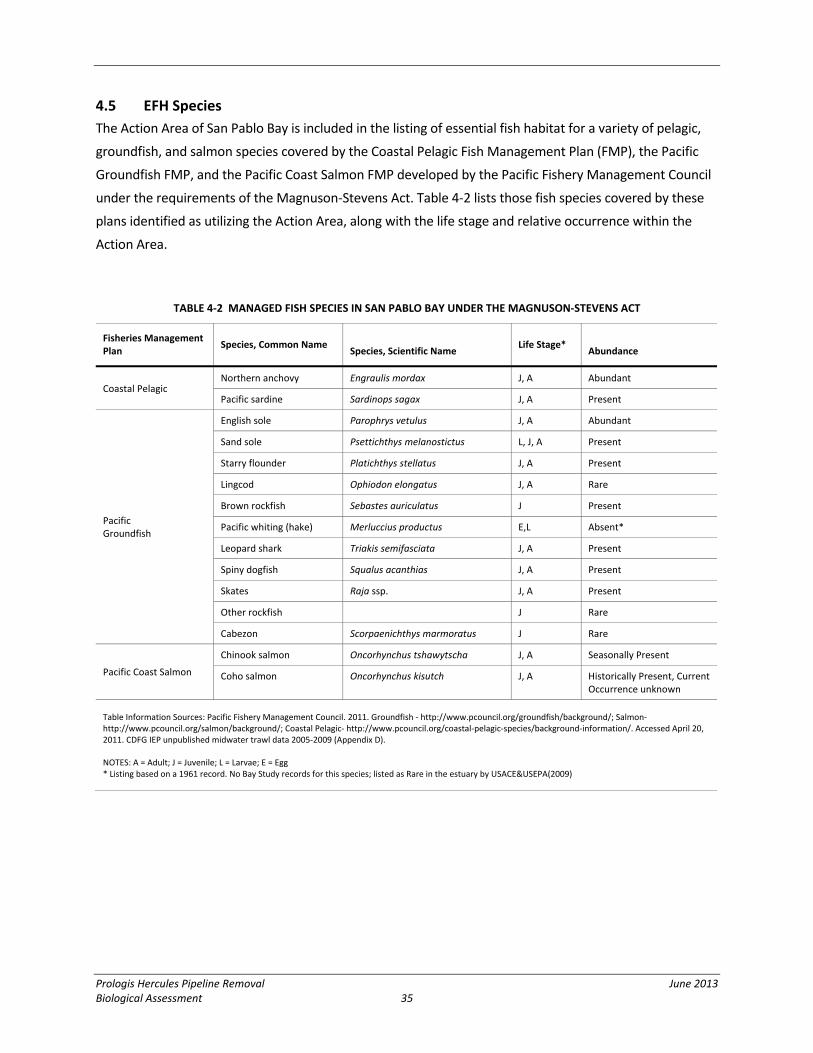
4.5 EFH Species
The Action Area of San Pablo Bay is included in the listing of essential fish habitat for a variety of pelagic,
groundfish, and salmon species covered by the Coastal Pelagic Fish Management Plan (FMP), the Pacific
Groundfish FMP, and the Pacific Coast Salmon FMP developed by the Pacific Fishery Management Council
under the requirements of the Magnuson‐Stevens Act. Table 4‐2 lists those fish species covered by these
plans identified as utilizing the Action Area, along with the life stage and relative occurrence within the
Action Area.
TABLE 4‐2 MANAGED FISH SPECIES IN SAN PABLO BAY UNDER THE MAGNUSON‐STEVENS ACT
Fisheries Management Plan
Species, Common Name Species, Scientific Name
Life Stage* Abundance
Coastal Pelagic Northern anchovy Engraulis mordax J, A Abundant
Pacific sardine Sardinops sagax J, A Present
Pacific Groundfish
English sole Parophrys vetulus J, A Abundant
Sand sole Psettichthys melanostictus L, J, A Present
Starry flounder Platichthys stellatus J, A Present
Chinook salmon Oncorhynchus tshawytscha J, A Seasonally Present
Coho salmon Oncorhynchus kisutch J, A Historically Present, Current Occurrence unknown
Table Information Sources: Pacific Fishery Management Council. 2011. Groundfish ‐ http://www.pcouncil.org/groundfish/background/; Salmon‐ http://www.pcouncil.org/salmon/background/; Coastal Pelagic‐ http://www.pcouncil.org/coastal‐pelagic‐species/background‐information/. Accessed April 20, 2011. CDFG IEP unpublished midwater trawl data 2005‐2009 (Appendix D). NOTES: A = Adult; J = Juvenile; L = Larvae; E = Egg * Listing based on a 1961 record. No Bay Study records for this species; listed as Rare in the estuary by USACE&USEPA(2009)
Prologis Hercules Pipeline Removal June 2013 Biological Assessment 36
4.6 Habitats of Particular Concern (HAPC)
Eelgrass (Zostera marina) Beds
Although eelgrass has been reported in some years in eastern San Pablo Bay (Boyer and Wyllie‐
Echeverria 2010), there are no existing or predicted eelgrass beds in the
project area (Merkel and Associates 2005).
Native Olympia oyster (Ostrea conchaphila) Beds
Zabin et al. (2010) suggested that the Project site is unlikely to support native oyster, because, "Sites in
San Pablo Bay and northward appear subject to periodic die offs due to seasonal low salinity events."
Prologis Hercules Pipeline Removal June 2013 Biological Assessment 37
5 ANALYSIS OF EFFECTS
5.1 Resuspension of Sediments from Removal of Pipeline
As stated in the Section 1, the proposed Action would require the removal of the pipeline and riprap on
the shoreline which would be replaced after the final segment of pipeline is removed and the landward
section is sealed. Removal of the pipeline and riprap would result in short‐term disturbance of bottom
sediments and resuspension of sediments. Disturbed or resuspended sediments could increase the
exposure of chemical concentrations to aquatic receptors in the localized area and could result in
adverse water quality and biological effects.
Temporary resuspension of sediments in the water column can lower levels of dissolved oxygen and
possibly release chemicals present in the sediments into the water column. The concentration of
suspended sediments will vary based on the production rate of removal and duration of the
construction activity, and would depend also on the methods used, the quality of equipment, and care
of the operator. In all cases, increased turbidity levels would be relatively short‐lived and generally
confined to within a few hundred feet of the activity depending on current velocity, tidal cycle and wind.
After initially high levels of resupsended sediment, sediments would disperse and background levels
would be restored within hours of disturbance.
The potential effects of suspended sediment within the water column on fish include gill lacerations (at
very high and prolonged exposures), increased “coughing” behavior, decreased feeding success, and
avoidance behaviors (Wilber and Clarke 2001). Removal of the pipeline has the potential to resuspend
sediment in the immediate vicinity of extraction of the pipeline. The maximum volume of sediment
disturbed by this operation would consist of the volume of sediment within a 50ft section of pipeline, a
1ft radius and a 2ft depth surrounding the portion of pipeline being pulled above the mudline surface.
This volume equates to approximately 3.7 cubic yards per 50 ft section if all the sediment above and
surrounding the 8inch pipeline were dispersed into the water column during extraction. In total, to
remove the 2,000 ft of pipeline approximately 40 – 50 ft sections will be removed which equates to 148
cubic yards of sediment potentially being disturbed. It should be noted that this is a worst case scenario
as approximately 800 ft of the pipeline is on the surface of the mud and not submerged. Futhermore, it
is unlikely that the entire volume of sediment would be dispersed. As stated in Section 1 the pipeline is
only 8 inches in diameter and the surrounding sediment is not significantly consolidated, it will move
through the mud to the surface. As it traverses through the mud, the sediment will fall in upon the void
below. Sediment would only be resuspended at the point where the pipeline is pulled above the
Prologis Hercules Pipeline Removal June 2013 Biological Assessment 38
mudline into the water. It is anticipated that only a small percentage of the total volume would be
resuspened at the point of extraction.
In comparison, even a small dredging Project would disturb upwards of 5,000 cubic yards per day. In
addition, the sediment plumes that may be caused by the sections of pipeline removed are expected to
be extremely small in area and short in duration. Based on studies of recent projects by the USACE, it is
estimated that any potential impact due to resuspended sediments would be limited to a distance up
and down current of approximately 100 feet (USACE, 2004). Recent studies by the San Francisco Estuary
Institute (SFEI, September 2008) determined that the short term effects of dredging on sensitive fish
species due to dredging activities would be minor. Considering that the volume of sediment being
disturbed by removal of the pipeline would be a significantly smaller fraction (order of magnitude) of
that disturbed by even a small scale dredging operation, it can be assumed that the water quality
impacts of pipeline removal would be smaller still and well below the threshold of concern.
Resuspended sediment levels caused by natural phenomena such as floods, storms, large tides, and
winds are often higher and of longer duration than those caused by dredging, especially in lakes and
bays. Previous studies have demonstrated that marine organisms are accustomed to sediment
resuspension levels greater than those generated by dredging (Stern and Stickle 1978, Parr et al. 1998,
Environment Canada 1994, Pennekamp et al. 1996, Herbich 2000) or even the pipeline removal.
Resuspended sediment concentrations within San Francisco Bay have been reported between 100‐200
mg/L due to tidal influence alone (Buchanan and Schoellhamer 1996; Schoellhamer 1996). As stated
above, normal circulation and strong currents along the waterfront rapidly circulate and disperse water
temporarily affected by construction activities. Turbidity plumes would disperse within a matter of
hours, and the particulate concentrations would be diluted to levels that would pose no major threat to
water quality or aquatic wildlife.
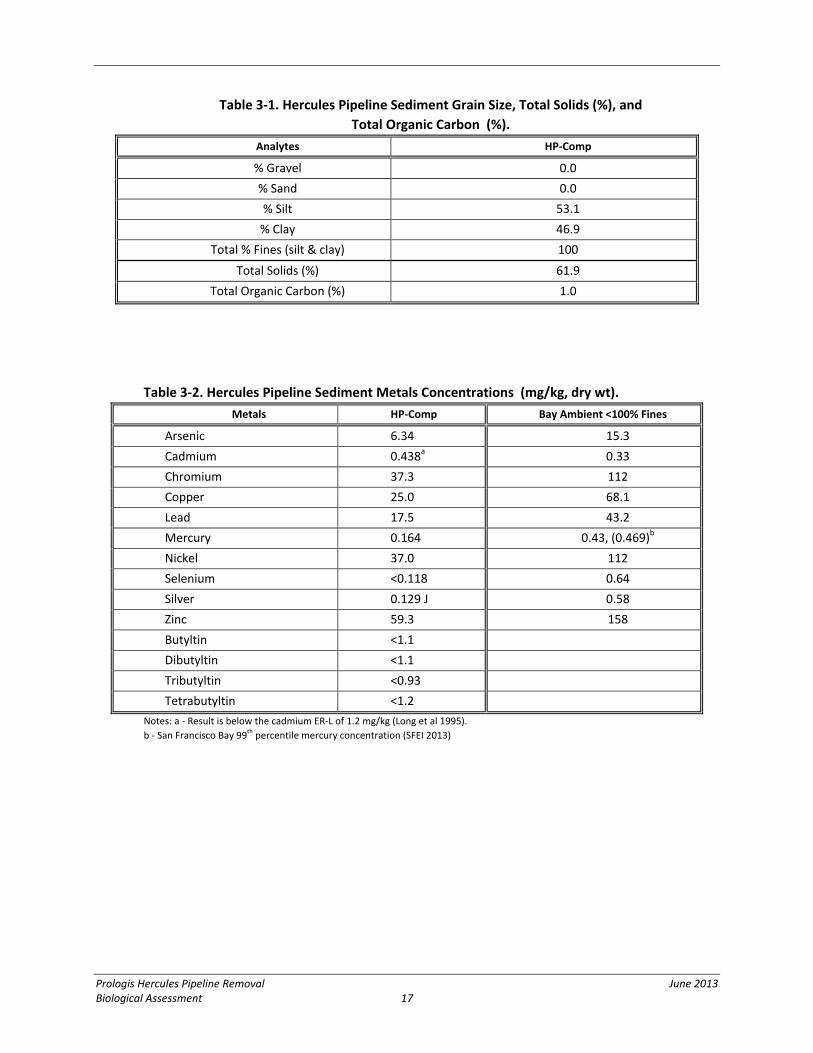
The chemistry from sediment characterization of these sediments indicates that metal concentrations
were similar to or below San Francisco Bay (SF Bay) background levels (SFRWQCB 1998). While the
cadmium level was slightly above SF Bay background levels, it was below the cadmium Effects Range‐
Low (ER‐L) of 1.2 mg/kg (Long et al 1995) and is unlikely to cause an adverse biological effect. Organotins
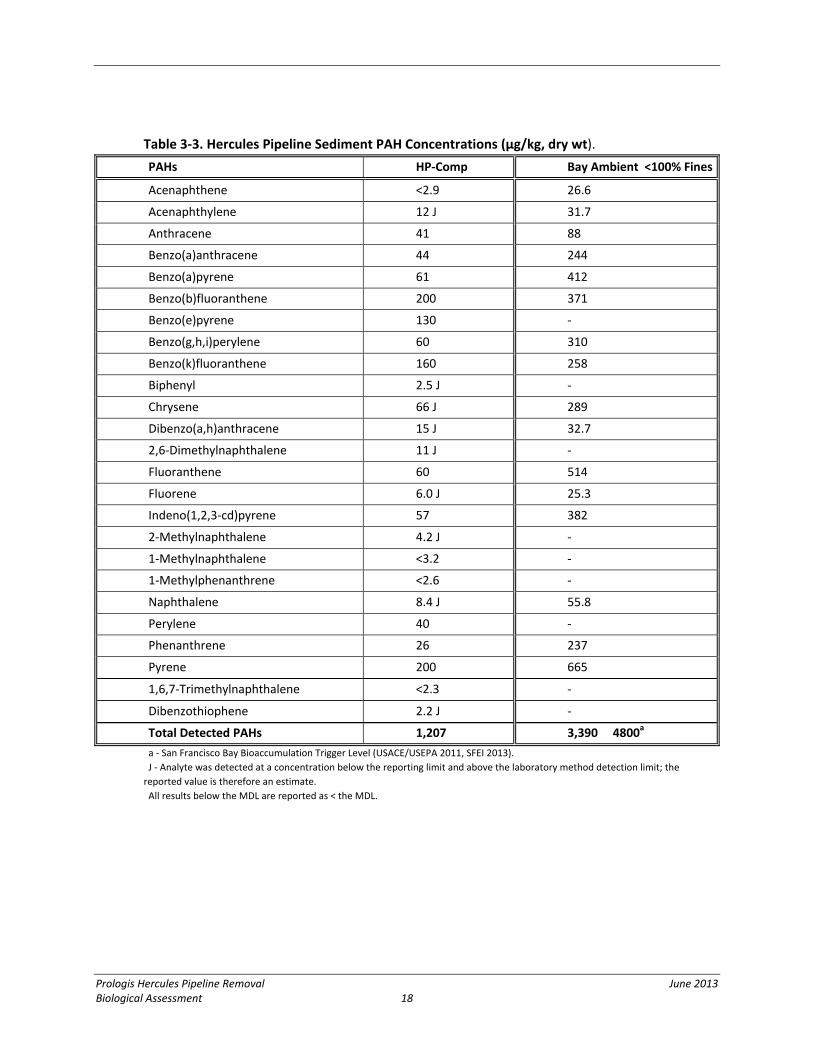
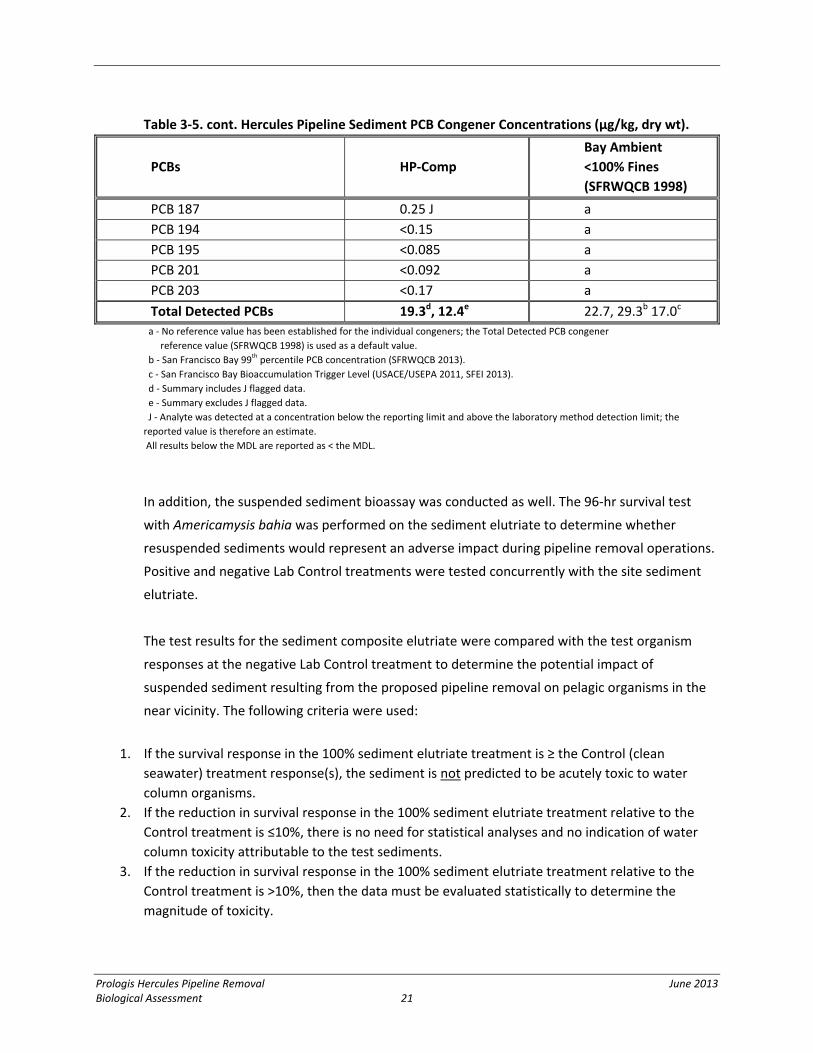
and organochlorine pesticides were below their respective MDLs. Total PAHs, total PCBs, and total DDTs
were reported at 1,207 µg/kg, 19.3 µg/kg and 0 µg/kg, respectively; each was below SF Bay background
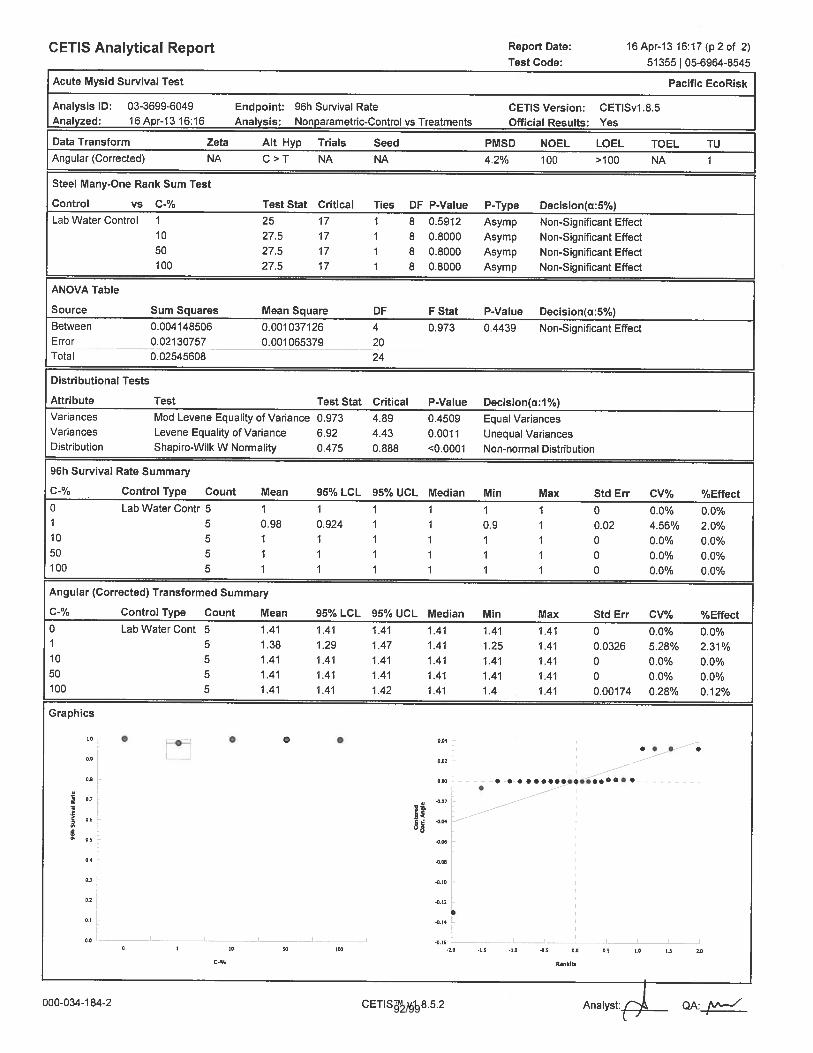
levels (SFRWQCB 1998). In addition, a suspended sediment bioassay was performed on the Project site
sediment which did not exhibit toxicity. Based on these results, sediments that may be displaced or
resuspended during the removal of the Hercules pipeline would not represent an adverse environmental
impact to species in the immediate or general vicinity of operations.
Prologis Hercules Pipeline Removal June 2013 Biological Assessment 39
Suspended sediment effects on fish
In order to evaluate the potential biological effects of resuspended sediments on the physiology
of marine organisms, many different laboratory studies have attempted to determine the levels
of suspended sediments that cause impacts. Peddicord and McFarland (1978) found that most
of the fish and invertebrates studied could withstand levels of resuspended sediments of up to
250 to 400mg/L for a period of about 9 to 10 days without effect. Table 5‐1 presents results
from typical studies that have been conducted at which effects are noted. A more extensive
table is available in Clarke and Wilber (2000).
Table 5‐1Response of Marine Species to a Certain Concentration Level of Suspended Sediments
Study Species Concentration
(mg/L) Response
Chiasson 1993 Rainbow Smelt Osmerus Mordax
10 Increased swimming behavior
Peddicord and McFarland 1978
Most fish and invertebrate
250‐400 No effect
Auld and Shubel 1978 American Shad
larvae 500 32% mortality after 4 days of exposure
Sherk et al. 1974 and 1975 White Perch 650 Elevated hematocrit levels after 5 days of
exposure.
Sherk et al. 1974 and 1975 Striped Bass 1,500 Elevated hematocrit levels after 14 days
of exposure
Nightingale and Simenstad 2001
Fish 4,000 Exhibits of erosion at gill filament tips
McFarland and Peddicord 1980
Shiner Perch 6,000 50% mortality
Ross 1982 Chinook Salmon
smolts 11,000 50% mortality after 96 hours of exposure
As presented in Section 4 encounter rates for listed species will be minimal. Green sturgeon,
salmonids, longfin smelt, and delta smelt in the estuary commonly encounter areas of increased
turbidity due to storm flow runoff events, wind and wave action, and benthic foraging activities
of other aquatic organisms. Fish may be expected to avoid areas of high turbidity (e.g., see Berg
and Northcote 1985) and return when concentrations of suspended solids are lower. Moreover,
as emphasized by Wilber and Clarke (2001), the short duration of expected encounters with the
Project are an important aspect that minimize any expected effects of sediment suspension. The
minor and localized areas of turbidity associated with this Project’s construction is not expected
to result in harm or injury, or behavioral responses that impair migration, foraging, or make
listed fish more susceptible to predation. If green sturgeon, salmonids, longfin smelt or delta
Prologis Hercules Pipeline Removal June 2013 Biological Assessment 40
smelt temporarily relocate from areas of increased turbidity, areas of similar value are available
in San Pablo Bay adjacent to the work site which offer habitat of equal or better value for
displaced individuals. Adjacent habitat areas also provide adequate carrying capacity to support
individuals that are temporarily displaced during the Project’s construction activities. Even if
they encounter potentially resupended sediments it is unlikely that the duration and exposure
would be significant to cause adverse impacts.
5.2 Potential impacts to benthic habitat
As stated previously the benthic habitat of the area where the pipeline will be removed as well
as where the barge may ground during extreme low tides will be temporarily disturbed by these
activities. These activities may result in physical displacement, habitat disturbance, and short‐
term temporary loss of foraging area for special‐status fish such as, green sturgeon, salmonids,
longfin smelt, and delta smelt and Fishery Management Plan managed groundfish. Potential
total short‐term habitat loss for these activities is estimated at less than 0.93 acres which
includes the length of the pipeline, a 20 ft buffer surrounding the pipeline, the barge, and riprap
area.
Altering benthic habitat and associated infaunal and epifaunal communities can result in the loss
or reduction of suitability as fish foraging habitat, especially for sensitive species including
salmon, steelhead, green sturgeon, and groundfish. Following pipeline removal and replacement
of rip rap on the shoreline, the deposition of fine sand‐mud sediments, comparable to pre‐
removal conditions, would begin almost immediately and the benthic community inhabiting
those sediments is expected to recover to pre‐Project composition and abundances within a few
months to up to two years, depending on when dredging occurs and other ecological factors
affecting recolonization (Newell et. al. 1998). Based on the very small area of San Pablo Bay
affected, the temporary time period over which the habitat would be unavailable for use by
sensitive species, and the overall temporary nature of the loss, the potential loss of seafloor
habitat from the action is expected to be undetectable.
Prologis Hercules Pipeline Removal June 2013 Biological Assessment 41
6 EFFECTS DETERMINATION
The analysis presented herein shows that removal of an 8 inch wastewater pipeline is not likely to adversely
affect green sturgeon, individuals of the Sacramento River winter‐run chinook, Central Valley spring‐run
chinook, Central Valley steelhead, or Central California Coast steelhead ESUs, longfin smelt, or delta smelt.
In addition, it is concluded that the proposed Project will not result in the “take” of CESA listed species.
Based on the best available data relative to species presence, sensitive fish species as detailed in Section
4 are not anticipated to be present in significant numbers at the site. Slight increases in suspended
sediment levels due to pipeline removal are not likely to occur or persist at levels that are significantly
different from background levels in the water column. Fish generally react by avoiding areas of high
turbidity and return when concentrations of suspended solids are lower. The areas of turbidity
associated with this Project’s construction are not expected to result in harm or injury, or behavioral
responses that impair migration, foraging, or make green sturgeon, salmonids, longfin smelt, or delta
smelt more susceptible to predation. Adjacent habitat areas also provide adequate carrying capacity to
support individuals that are temporarily displaced during construction activities that may cause
increases in turbidity.
The few individual fish that could potentially be present during construction activities would not likely
be significantly affected by turbidity, and visibility for foraging activities would not likely be impaired to a
significant degree. In addition, as described above, the quality of sediment is good, in that the sediment
does not exceed Bay Ambient and other effects based criteria. Elutriate bioassays indicated that
resuspended sediments would not contribute to any toxicity to aquatic organisms by a potential
sediment plume. Green sturgeon, sensitive salmonid species, and longfin smelt, though possibly present
in small numbers, would not likely be affected by exposure to sediments during removal activities. Delta
smelt will not likely occur in the Project area during construction activities. In addition, based on the
very small area of San Pablo Bay affected, the temporary time period over which the habitat would be
unavailable for use by sensitive species, and the overall temporary nature of the loss, the potential loss
of seafloor habitat from the action is expected to be undetectable.
Prologis Hercules Pipeline Removal June 2013 Biological Assessment 42
7 ESSENTIAL FISH HABITAT EVALUATION
The entire San Francisco Bay has been designated by NOAA Fisheries as an EFH for coastal pelagics,
Pacific groundfish, and Pacific coast salmon. Within the Project Site soft bottom benthos and the
water column comprise the aquatic habitat potentially affected. Coastal pelagic fish species may
use the water column in the vicinity of Project activities, as may Pacific coast salmon (albeit briefly,
during migration through the Bay). Pacific groundfish may use the benthic habitat in the Project
vicinity. The Project Site is not a unique area for supporting preferential habitat and after the
pipeline is removed benthic assemblages will quickly re‐establish and cycle normally.
7.1 Analysis of Effects on EFH
The specific elements of the pipeline removal Project that could impact groundfish, pelagic, and
salmonid species EFH, and the impact mechanisms that avoid and minimize impacts are identified
below.
Potential effects to EFH from removing the pipeline and removing and replacing shoreline rip rap
include temporary displacement of benthic and intertidal habitat, which could potentially affect
foraging and prey availability. During removal activities, some sediment will become suspended
plumes and dissipate rapidly. These plumes could limit the vision of pelagic fish.
Although some EFH is likely to be disturbed during removal activities, these activities will be of short
duration, and temporary in nature. The time duration for removal of the pipeline is three weeks.
Benthic species (fish prey) maybe disturbed during these activities, possibly causing fish to
temporarily move from the area. As stated previously this would be for a short duration and
temporary in nature. Benthic successional stages follow predictable sequences after any major
seafloor perturbation and re‐colonize rapidly. The Project site represents approximately 0.93 acres
which represents a negligible percentage within San Pablo Bay. Therefore, removal activities are not
likely to have a significant adverse effect on benthic species.
As stated previously, the temporary effects from suspended sediments due to removing the pipeline
are not likely to adversely affect EFH species within the area. Also as discussed above, sediments
were characterized and results support that sediment is not likely to cause environmental impacts.
7.2 EFH Assessment
Pursuant to the MSFCMA and the SFA, an EFH evaluation has been completed and concludes that
the proposed action will not adversely affect EFH. Potential impacts from the proposed Project on
groundfish habitat, coastal pelagic habitat, and salmonid habitat would be from resuspension of
Prologis Hercules Pipeline Removal June 2013 Biological Assessment 43
sediment and disturbance of benthic habitat, which will be temporary and localized and is not
expected to impact primary productivity and food resources for groundfish. Therefore, it is
concluded that the proposed Project will not adversely affect EFH.
7.3 Conclusions and Determinations of Effect
Due to the temporary nature of the Project and the implementation of conservation measures
(Section 2) to reduce impacts to marine resources; it is concluded that the Project will not adversely
affect EFH for groundfish, coastal pelagic, and salmonid species.
8 REFERENCES
Baxter, R. 1999. Osmeridae. pp. 179‐215 In Orsi, J. (ed.) Report on the 1980‐1995 Fish, Shrimp, and crab
Sampling in the San Francisco Estuary, California. CDFG Tech. Rept. 63, November 1999. Benfield, M. C. AND T. J. Minello. 1996. Relative effects of turbidity and light intensity on reactive
distance and feeding of an estuarine fish. Environmental Biology of Fishes 46:211–216. Bennet, W. 2005. Critical Assessment of the Delta Smelt Population! in the San Francisco Estuary,
California. San Francisco Estuary Watershed Science. 3(2), 2005. Boyer, K. and S. Wyllie‐Echeverria. 2010. Eelgrass Conservation and Restoration in San Francisco Bay:
Opportunities and Constraints. Final REpoirt for the San Francisco Bay Subtidal Habitat Goals Project. 19 November 2010.
Berg, L. and T. Northcote. 1985. Changes in territorial, gil‐flaring, and feeding behavior in juvenile coho
salmon (Oncorhynchus kisutch) following short‐term pulses of suspended sediment. Can. J. Fish. Aq. Sci. 42:1410‐1417.
Brandes, P. L. and J. S. McLain. 2001. Juvenile chinook salmon abundance, distribution, and survival in
the Sacramento‐San Joaquin Estuary. Fish Bulletin 179:39‐138 Buchanan, P. A. and D. H. Schoellhamer. 1996. Summary of Suspended‐Solids Concentration Data, San
Francisco Bay, California, Water Year 1995. U.S. Geological Survey Open‐File Report 96‐591, Sacramento, California.
Buchanan and Ganju, 2005. Summary of Suspended‐Sediment Concentration Data, San Francisco Bay, California Water Year 2003: U.S. Geological Survey Data Series 113, 46p.
Buchanan and Ganju, 2006. Summary of Suspended‐Sediment Concentration Data, San Francisco Bay,
California Water Year 2004: U.S. Geological Survey Data Series 226, 49p. Busby, P.J., T.C. Wainwright, G.J. Bryant, L.J. Lierheimer, R.S. Waples, F.W. Waknitz, and I.V.
Lagomarsino, 1996. NOAA‐NWFSC Tech Memo‐27: Status Review of West Coast Steelhead. California Department of Fish and Game (CDFG). 2000‐2007. Interagency Ecological Program for San
Francisco Estuary. Monthly Mid‐water and Otter‐trawl survey data for San Francisco Estuary. CDFG 2009. A Status Review of the Longfin Smelt in California. Report to the Fish and Game
Commission. 23 January 2009. Conomos, T.J. 1979. Properties and circulation of San Francisco Bay waters. in T. J.Conomos, ed. San
Francisco Bay: The Urbanized Estuary. Pacific Division, Amer. Assoc. Advance. Sci., San Francisco, Calif.
Conomos, T.J., Smith, R.E., and Gartner, J.W., 1985, Environmental setting of San Francisco Bay:
Hydrobiologia, v. 129, p. 1‐12.
Cyrus, D. P. and S. J. M. Blaber. 1987. The Influence of Turbidity on Juvenile Marine Fishes in Estuaries,
Part 2. Laboratory Studies, Comparisons with Field Data, and Conclusions. Journal of Experimental Marine Biology and Ecology 109:71–91.
Feyrer, F., M. Nobriga, T. Sommer. 2007. Multidecadal trends for three declining fish species: habitat
patterns and mechanisms in the San Francisco Estuary, California, USA. Canadian Journal of Fisheries and Aquatic Sciences 64:723‐734.
Ford, M. J. 2004. Conservation Units and Preserving Diversity. pp. 338‐357 In A.P. Hendry and S. C.
Stearns (eds) Evolution Illuminated: salmon and their relatives. Oxford Univ. Press Goals Project. 1999. Baylands Ecosystem Habitat Goals. A report of habitat recommendations prepared
by the San Francisco Bay Area Wetlands Ecosystem Goals Project. First Reprint June 2000, U. S. EPA, San Francisco.
Grant, J. and B. Thorpe. 1991. Effects of Suspended Sediment on Growth, Respiration, and Excretion of
the Soft‐Shelled Clam (Mya arenaria). Canadian Journal of Fisheries and Aquatic Sciences 48:1285–1292.
Gregory, R. S. and T. G. Northcote. 1993. Surface, Planktonic, and Benthic Foraging by Juvenile Chinook
Salmon (Oncorhynchus tshawytscha) in Turbid Laboratory Conditions. Canadian Journal of Fisheries and Aquatic Sciences 50:233–240.
Gregory, R. S. 1993. Effect of Turbidity on the Predator Avoidance Behavior of Juvenile Chinook Salmon
(Oncorhynchus tshawytscha). Canadian Journal of Fisheries and Aquatic Sciences 50:241–246. Harvey, B. 2011. Length‐at‐Date Criteria to Classify Juvenile Chinook Salmon in the California Central
Valley: Development and Implementation History. IEP Newsletter 24(3): 26‐36. Hayes, D., P‐Y Wu. 2001. Simple Approach to TSS Source Strength Estimates. Proc. of Western Dredging
Association, WEDA XXI. Houston, TX. 25‐27 June 2001. Hayes, D.F., T. Borrowman, and T. Welp. 2000. Near‐Field Turbidity Observations During Boston Harbor
Bucket Comparison Study. Proceedings of WEDA XX. Providence, RI. June 2000. Hayes, D., T. McLellan, C. Truitt. 1988. Demonstrations of Innovative and Conversional Dredging
Equipment at Calumet Harbor, Illinois. Paper EL‐88‐1, U.S. Army Engineer Waterways Experiment Station, Vicksburg, MS.
Hayes, D.F., R.M. Engler. 1986. Environmental Effects of Dredging. Technical Notes, U.S. Army Engineer
Waterways Experiment Station, Vicksburg, MS. Healy, M. C. 1991. Life History of Chinook Salmon. In Groot, C. and Margolis, L. (eds) Pacific Salmon Life
Histories. UBC Press.
Hearn, A. R., E. D. Chapman, A. P. Klimley, P. E. LaCivita, and W. N. Brostoff. 2010. Salmonid smolt outmigration and distribution in the San Francisco Estuary 2010. Interim Draft Report, University of California Davis and US Army Corp of Engineers. 90p.
Herbich. 2000. Handbook of Dredging Engineering, 2nd Ed. New York: McGraw‐Hill. Herbich, J.B., S.B. Brahme. 1991. Literature Review and Technical Evaluation of Sediment Resuspension
During Dredging. Contract Report HL‐91‐1, Prepared for the Department of the Army, Washington, DC: U.S. Army Corps of Engineers.
Huntington, K. M. and D. C. Miller. 1989. Effects of Suspended Sediment, Hypoxia, and Hyperoxia on
Larval Mercenaria mercenaria (Linnaeus 1758). Journal of Shellfish Research 8:37‐42. Israel, J. A., M. Blumberg, J. Cordes, and B. May. 2004. Geographic patterns of genetic differentiation
among western U.S. collections of North American green sturgeon (Acipenser medirostris). North Amer. Journ. Fish. Man. 24:922‐931.
Israel, J. A., K. J. Bando, E. C. Anderson, and B. May. 2009. Polyploid microsatellite data reveal stock
complexity among estuarine North American green sturgeon (Acipenser medirostris). Can. J. Fish. Aquat. Sci. 66: 1491–1504.
Ivanov, V.N., T.G. Usenko, and A.V. Parkhomenko. 1976 effect of Hydrogen Sulfide on the Survival Rate
of Eggs and Embryonal Mitoses of the Black Sea Turbot Hydrobiol.J. 12(2):60‐62 Jahn, A. 2004. On the presence/absence of listed salmonid ESUs in Central San Francisco Bay. Port of
Oakland white paper, March 2004 draft. Jahn, A. 2011 a. Young Salmonid Out‐Migration through San Francisco Bay with Special Focus on their
Presence at the San Francisco Waterfront. with Anchor QEA, L.P. for Port of San Francisco. May 2011.
Jahn, A. 2011b. An Alternative Technique to Quantify the Incidental Take of Listed Anadromous Fishes at
the Federal and State Water Export Facilities in the San Francisco BayDelta Estuary. Kier and Associates for National Marine Fisheries Service central Valley Office. July 2011.
Jassby, A. D., W. J. Kimmerer, S. G. Monismith, C. Armor,J. E. Cloern, T. M. Powell, J. R. Schubel, and T. J.
Vendlinski. 1995. Isohaline position as a habitat indicator for estuarine populations. Ecological Applications 5:272–289.
Technical Notes Collection, TN DOER‐E6, U.S. Army Engineer Research and Development Center, Vicksburg, MS.
Johnson, R. R., F. W. Fisher, and D. D. Weigand. 1992. Use of growth data to determine the spatial and
temporal distribution of four runs of juvenile chinook salmon in the Sacramento River, California. Report N. AFF.‐FRO‐92‐15. U. S. Fish and Wildlife Service, Red Bluff, CA.
Killam. D. 2009.Chinook Salmon Populations for the Upper Sacramento River Basin in 2008. SRSSAP Technical Report No. 09‐1
Kiorbe, T., F. Mohlenberg, O. Nohr. 1981. Effect of Suspended Bottom Material on Growth and
Energetics in Mytilus edulis. Marine Biology 61:283‐288. Kjelson, M. A., P. F. Raquel, and F. W. Fisher. 1982. Life history of fall‐run juvenile chinook salmon,
Oncorhynchus tshawytscha, in the Sacramento‐San Joaquin estuary, California. In: V. S. Kennedy (ed.) Estuarine Comparisons. Academic Press.
Knoph, M.B., and K. Thorud 1996 Toxicity of Ammonia to Atlantic Salmon (Salmo salar L.) in Seawater‐
Effects on Plasma Osmolality, Ion, Ammonia, Urea and Glucose Levels and Reference Source: Comp.Biochem.Physiol.A 113(4):375‐381
LFR. 2004. Framework for Assessment of Potential Effects of Dredging on Sensitive Fish Species in
San Francisco Bay. Prepared for U. S. Army Corps of Engineers, San Francisco Division. August,
2004.
Lindley, S. T. et al. 2007. Framework for Assessing Viability of Threatened and Endangered Chinook
Salmon and Steelhead in The Sacramento‐San Joaquin Basin.San Francisco Estuary and Watershed Science, 5(1).
J.C., and Klimley, A.P. 2008. Marine migration of North American green sturgeon. Trans. Am. Fish. Soc. 137(1): 182–194.
Long, E. R., D. D. MacDonald, S. L. Smith, and F. D. Calder. 1995. Incidence of Adverse Biological Effects
within Ranges of Chemical Concentrations in Marine and Estuarine Sediments. Environ. Manage. 19(1):81‐97.
MacFarlane, R. B., & Norton, E. 2002. Physiological ecology of juvenile chinook salmon (Oncorhynchus
tshawytscha) at the southern end of their distribution, the San Francisco Estuary and Gulf of the Farallones, California. Fishery Bulletin 100: 244‐257.
Martin, C. D., P. D. Gaines and R. R. Johnson. 2001. Estimating the abundance of Sacramento River
juvenile chinook salmon with comparisons to adult escapement. Red Bluff Research Pumping Plant Report Series, Volume 5. U. S. Fish and Wildlife Service, Red Bluff, CA.
MBC Applied Environmental Sciences (MBC). November 2000. Turbidity Issues in Relationship to
Dredging. Port of Los Angeles. McEwan, D. 2001. Central Valley Steelhead. In: Brown, RL, Editor. Contributions to the biology of Central
Valley salmonids, Fish Bulletin 179. Fish Bulletin 179.1.California Department of Fish and Game. p. 1‐44.
McKee, Ganju, Schoelhamer, 2006. Estimates of suspended sediment entering San Francisco Bay from the Sacramento and San Joaquin Delta, San Francisco Bay California. Journal of Hydrology 323, pages 325‐352.
Merkel, K.W. and Associates. 2005. Baywide eelgrass (Zostera marina L.) inventory in San Francisco Bay:
Eelgrass bed characteristics and predictive eelgrass model. Report prepared for the State of California Department of Transportation in cooperation with NOAA Fisheries.
Merz,. J. E., S. Hamilton, P. S. Bergman, and B. Cavallo. 2011. Spatial perspective for delta smelt: a
summary of contemporary survey data. California Fish and Game 97:164‐189. Miller and Kaplan. 2001. Petition to list the North American Green Sturgeon (Acipenser medirostris) as
an endangered or threatened species under the Endangered Species Act. Prepared by the Environmental Protection Information Center, Center for Biological Diversity, and Waterkeepers Northern California.
Moore, P. G. 1978. Inorganic Particulate Suspensions in the Sea and Their Effects on Marine animals.
Oceanography and Marine Biology Annual Review 15:225–363. Myers, J.M., R.G. Kope, et al. 1998. Status review of chinook salmon from Washington, Idaho, Oregon,
and California. Seattle, National Marine Fisheries Service/ Northwest Fisheries Science Center. Moyle, P. B., R. M. Yoshiyama, J. E. Williams, and E. D. Wikramanayake, 1995. Fish Species of Special
Concern in California. Second edition. Final report to California Department of Fish and Game, contract 2128IF.
Moyle, P. B., 2002. Inland Fishes of California. University of California Press, Berkeley, California Newman, K. 2008. Sample design‐based methodology for estimating delta smelt abundance. San
Francisco Estuary Watershed Science. October 2008. Newell, R.C.; Seiderer, L.J., and Hitchcock, D.R., 1998. The impact of dredging works in coastal waters: A
review of the sensitivity to disturbance and subsequent recovery of biological resources on the seabed. Oceanography and Marine Biology, 36, 127‐178.
Nightingale, B., and C. Simenstad. 2001. Overwater structures: Marine issues. Aquatic Habitat
Guidelines: An integrated approach to marine, freshwater, and riparian habitat protection and restoration. Prepared for Washington Department of Fish and Wildlife, Washington Department of Ecology and Washington State Department of Transportation by University of Washington, Seattle, Washington.
NOAA (National Oceanic and Atmospheric Administration) Fisheries. 2005a. Endangered and Threatened
Species; Designation of Critical Habitat for Seven Evolutionarily Significant Units of Pacific Salmon and Steelhead in California; Final Rule. 50 CFR Part 226 Vol. 70 (170): 52488 52627. National Oceanic and Atmospheric Administration’s National Marine Fisheries Service.
NOAA Fisheries. 2005b. Green Sturgeon (Acipenser medirostris) Status Review Update. Biological Review Team Santa Cruz Laboratory Southwest Fisheries Science Center NOAA Fisheries February 2005.
NOAA (National Oceanic and Atmospheric Administration). 2007. Report on the Subtidal Habitats and
Associated Biological Taxa in San Francisco Bay. August. NOAA (National Oceanic and Atmospheric Administration) Fisheries, 2009. Endangered and Threatened
Wildlife and Plants: Final Rulemaking to Designate Critical Habitat for the Threatened Southern Distinct Population Segment of North American Green Sturgeon; Final Rule. 50 CFR Part 226. Federal Register (Volume 74, Number 195): 52300 52351. National Oceanic and Atmospheric Administration, National Marine Fisheries Service. URL: http://www.epa.gov/fedrgstr/EPA‐SPECIES/2009/October/Day‐09/e24067.htm. October 9, 2009.
Olberding Environmental, Inc. 2008. Steelhead Trout, Chinook Salmon, and Green Sturgeon Biological
Assessment for the Pacific Refining Company Marine Terminal Deconstruction and Pipeline Project, Southeastern San Pablo Bay, Contra Costa, CA. Prepared for Pacific Refining Company. October 2008. 34 64 pp.
Orsi, J. (ed). 1999. Report on the 1980‐1995 Fish, Shrimp, and crab Sampling in the San Francisco
Estuary, California. Calif. Dept. Fish and Game Technical Report 63, November 1999. Pacific Ecorisk. 2012. Sediment Characterization Sampling and Analysis Plan (SAP) for the Removal of a
Wastewater Outfall Pipeline Located in Hercules, CA. Prepared for Boudreau Associates LLC. Pacific Ecorisk. 2013. Data Report ‐ Characterization of the Sediment for the Removal of a Wastewater
Outfall Pipeline Located in Hercules, CA: Sampling and Analysis Results. Prepared for Boudreau Associates LLC.
Parr, W., S.J. Clarke, P. Van Dijk, N. Morgan. 1998. Turbidity in English and Welsh Tidal Waters. WRC
Report No. CO 4301, Report for English Nature, WRC Medmenham, Bucks. Peddicord, R. K., and McFarland, V. A. (1978). "Effects of suspended dredged material on aquatic
animals," Technical Report D‐78‐29, U.S. Army Engineer Waterways Experiment Station, Vicksburg, MS., NTIS No. AD A058 489. http://el.erdc.usace.army.mil/elpubs/pdf/trd78‐29.pdf
Pennekamp, J.G.S., R.J.C. Eskamp, W.F Rosenbrand, A. Mullie, G.L. Wessel, T. Arts, I.K. Decibel. 1996.
Turbidity Caused by Dredging; Viewed in Perspective. Terra et Aqua 64:10‐17. Pennekamp, J.G.S., M.P. Quaak. 1990. Impact on the Environment of Turbidity Caused by Dredging.
Terra et Aqua 42:10‐20. Poucher, S. 1986, Memo to D.J.Hansen, U.S. EPA. Results of Acute Toxicity Tests Conducted with
Ammonia at ERL, Narragansett. Rosenfield, J. A. and Baxter, R. D. 2007 Population Dynamics and Distribution Patterns of Longfin Smelt
in the San Francisco Estuary. Transactions of the American Fisheries Society. 136 (6): 1577‐1592.
SFRWQCB (1998) Ambient concentrations of toxic chemicals in San Francisco Bay Sediments: Draft Staff Report. San Francisco Regional Water Quality Lab Control Board, Oakland, CA.
Schoellhamer, D. H. 1996. Factors Affecting Suspended‐Solids Concentrations in South San Francisco
Bay, California. Journal of Geophysical Research 101:12087–12095. Schoelhamer, D. 2002. Variability of suspended sediment concentration at tidal to annual time scales in
San Francisco Bay, USA. Continental Shelf Research 22:1857‐1866. Servizi, J. A. and D. W. Martens. 1992. Sublethal Responses of Coho Salmon (Oncorhynchus kisutch) to
Suspended Sediments. Canadian Journal of Fisheries and Aquatic Sciences 49:1389–1395. Servizi, J. A. 1990. Sublethal Effects of Dredged Sediments on Juvenile Salmon. Proc. of the Workshop on
the Effects of Dredging on Anadromous Pacific Coast Fishes. C. A. Simenstad, ed. Washington Sea Grant Program, Seattle 57–63.
SFEI (San Francisco Estuary Institute), 2008. Effects of Short‐term Water Quality Impacts Due to
Dredging and Disposal on Sensitive Fish Species in San Francisco Bay. SFEI Contribution 560. San Francisco Estuary Institute, Oakland, California. http://www.sfei.org/node/1407
Stern, E.M., W.B. Stickle. 1978. Effects if Turbidity and Suspended Material in Aquatic Environments;
Literature Review. Technical Report D‐78‐21, U.S. Army Engineer Waterways Experiment Station, CE, Vicksburg, MS.
Sommer, T. and many others. 2007. The Collapse of Pelagic Fishes in the Upper San Francisco Estuary.
Fisheries 32:270‐277. available at http://www.water.ca.gov/iep/docs/pod/sommers_fish.pdf Thackston, E.L. and M.R. Palermo. 2000. Improved Methods for Correlating Turbidity and Suspended
Solids for Monitoring. DOER Technical Notes Collection, ERDC TN‐DOER‐E8, U.S. Army Engineer Research and Development Center, Vicksburg, MS.
U.S. Environmental Protection Agency/ U.S. Army Corps of Engineers (USEPA/USACE). 1998. Evaluation
of dredged material proposed for discharge in waters of the U.S. testing manual ‐ inland testing manual. U.S. Environmental Protection Agency/U.S. Army Corps of Engineers. EPA‐823‐B‐94‐002. U.S. Environmental Protection Agency, Office of Water (4305).
U.S. Army Corps of Engineers (USACE) et al. 2001. PN 01‐01. Guidelines for implementing the inland
testing manual in the San Francisco Bay region. Prepared by U.S. Army Corps of Engineers, San Francisco District; U.S. Environmental Protection Agency, Region IX; San Francisco Bay Conservation and Development Commission; and San Francisco Bay Regional Water Quality Control Board, California State Lands Commission. San Francisco, CA.
U.S. Army Corps of Engineers (USACE). 2004. PORT OF OAKLAND ‐ Outer Harbor Maintenance Dredging
Operations Spatial Characterization of Suspended Sediment Plumes During Dredging Operations Through Acoustic Monitoring. Prepared by MEC Analytical Systems, Inc. and U.S. Army Engineer Research and Development Center Dredging Operations Technical Support Program (EM‐D) 3909 Halls Ferry Road Vicksburg, Mississippi 39180.
USACE and USEPA. 2009. Programmatic Essential Fish Habitat (EFH) Assessment for the Long‐Term
Management Strategy for the Placement of Dredged Material in theSan Francisco Bay Region. United States Army Corps of Engineers and the United States Environmental Protection Agency, July 2009.
USEPA/USACE (2011) DMMO Agreement on Programmatic EFH Conservation Measures for Maintenance
Dredging Conducted Under LTMS Program (Tracking Number 2009/06769). USFWS 1988. The Ecology of the soft bottom benthos of San Francisco Bay: A Community Profile.
Biological Report 85(7.19) September 1988. USFWS 2008. Endangered and Threatened Wildlife and Plants; 12‐month Finding on a Petition to List the
San Francisco Bay‐Delta Population of the Longfin Smelt as Endangered or Threatened USFWS. 2012. Longfin Smelt 12‐month Finding.
http://www.fws.gov/sfbaydelta/species/longfin_smelt.cfm, posted October 2012. Ward, P. D., T. R. McReynolds, and C. E. Garman. 2002. Butte and Big Chico Creeks Spring‐Run Chinook
Salmon, Oncorhynchus tshawytcha, Life History Investigation 2000‐2001. Inland Fisheries Administrative Report, California Department of Fish and Game. R. L. Dixon, ed.
Waples, R. S. 1991. Definition of "Species" Under the Endangered Species Act: Application to Pacific Salmon. NOAA Technical Memorandum NMFS F/NWC‐194.
Wilber, D.H. and D.G. Clark. 2001. Biological effects of suspended sediments: A review of suspended
sediment impacts on fish and shellfish with relation to dredging activities in Estuaries. N. Amer. J. Fish. Man. 21: 855‐875.
Williams, J. G. 2006. Central Valley Salmon: A Perspective on Chinook and Steelhead in the Central Valley
of California. San Francisco Estuary and Watershed Science, 4(3). Williams, J. G. 2012. Juvenile Chinook Salmon (Oncorhynchus tshawytscha) in and Around the San
Francisco Estuary. San Francisco Estuary and Watershed Science, 10(3). Zabin, C. J., S. Attoe, E. Grosholz, and C. Coleman‐Hubert. 2010. Shellfish Conservation and Restoration
in San Francisco Bay: Opportunities and ConstraintsFinal Report for the Subtidal Habitat Goals Committee. U. C. Davis, 29 April 2010.
APPENDIX A Sampling and Analysis Results Report
1/99
DATA REPORT
Characterization of the Sediment for the Removal of a Wastewater Outfall Pipeline Located in Hercules, CA:
Sampling and Analysis Results
Prepared for
Boudreau Associates LLC 327 Jersey Street
San Francisco, CA 94114
Prepared by
Pacific EcoRisk
2250 Cordelia Road Fairfield, CA 94534
April 2013
2/99
Pacific EcoRisk Environmental Consulting and Testing
i
Table of Contents Page
1. INTRODUCTION ...................................................................................................................... 1 1.1 Objectives of the Sediment Investigation ............................................................................. 1 1.2 Organization of this Document ............................................................................................ 1
3.1 Homogenization and Compositing of Sediments ............................................................... 10 3.2 Shipping of Sediment Samples to the Analytical Laboratories .......................................... 10
Pacific EcoRisk Environmental Consulting and Testing
ii
Appendices Appendix A Sampling Field Logs and Data Sheets Appendix B Results of the Sediment Conventional and Chemical Analyses: Laboratory
Data Reports Submitted by Calscience Appendix C Test Data and Summary of Statistics for the Evaluation of the Toxicity of the
Hercules Pipeline Sediment Elutriate to Mysids (Americamysis bahia) Appendix D Test Data and Summary of Statistics for the Reference Toxicant Evaluation
of the Mysid, Americamysis bahia Appendix E Bioassay Standard Test Conditions
4/99
Pacific EcoRisk Environmental Consulting and Testing
iii
List of Figures Page
Figure 1-1. Location Map #1: Wastewater Outfall Pipeline Located in Hercules, CA .................. 2 Figure 1-2. Location Map #2: Wastewater Outfall Pipeline Located in Hercules, CA .................. 3 Figure 1-3. Vicinity Map #1: Wastewater Outfall Pipeline Located in Hercules, CA ................... 4 Figure 1-4. Vicinity Map #2: Wastewater Outfall Pipeline Located in Hercules, CA ................... 5 Figure 2-1. Wastewater Outfall Pipeline Sample Locations #1 ...................................................... 8 Figure 2-2. Wastewater Outfall Pipeline Sample Locations #2 ...................................................... 9
Pacific EcoRisk Environmental Consulting and Testing
iv
List of Acronyms
ASTM American Society for Testing and Materials Bay San Francisco Bay BCDC Bay Conservation and Development Commission Calscience Calscience Environmental Laboratories, Inc. COC Chain-of-custody CV Coefficient of variation DMMO Dredged Material Management Office DU Dredge unit EC50 50% Effect Concentration ESC Elutriate Suitability Concentrations GPS Global positioning system HLLC Hercules LLC HDPE High density polyethylene ITM Inland Testing Manual LC/LCSD Laboratory Control/Laboratory Control Spike Duplicate LC50 50% Lethality Concentration MET Modified elutriate test MDL Method detection limit mg/Kg Milligram per kilogram mg/L Milligram per liter MLLW Mean lower low water MOT Marine Oil Terminal MRL Method reporting limits PAH Polycyclic aromatic hydrocarbons PCB Polychlorinated biphenyls PER Pacific EcoRisk, Inc. PRC Pacific Refining Co. Prologis Prologis L.P. QA/QC Quality assurance/quality control RL Reporting limit RPD Relative percent difference SFRWQCB San Francisco Regional Water Quality Control Board SLC State Lands Commission
6/99
Pacific EcoRisk Environmental Consulting and Testing
v
SOP Standard operating procedures SUAD Suitable for unconfined aquatic disposal TOC Total organic carbon TSS Total suspended solids USACE U.S. Army Corps of Engineers USEPA U.S. Environmental Protection Agency WQO Water quality objectives
7/99
Pacific EcoRisk Environmental Consulting and Testing
1
1. INTRODUCTION Prologis L.P. (Prologis) seeks authorization to remove an existing 8-inch wastewater outfall pipeline from leased property located in Hercules, CA (Figure 1-1 through 1-4). On behalf of Prologis, Boudreau Associates has contracted Pacific EcoRisk (PER) to perform sediment characterization in the vicinity of the pipeline to support pipeline removal activities. This sampling and testing program was performed in support of CEQA analysis and permitting to assess sediment quality and potential impacts related to removing the pipeline due to sediment resuspension. In order to assess whether resuspended sediments will represent an adverse impact during pipe removal operations and per the approved Sampling and Analysis Plan (PER 2013), field personnel collected sediment cores approximately 1 foot below the estimated pipeline depth or refusal along the length of the buried portion of the pipeline. In areas where the pipeline is exposed, surface samples were collected using a Van-Veen sampler. A composite sample comprising equal portions of the sediment cores and surface sediment samples was then submitted for chemical and biological analysis as per the SAP (PER 2013). The remainder of the composite sample was archived for subsequent analysis, if needed. This Data Report has been prepared to provide the required characterization of these sediments. 1.1 Objectives of the Sediment Investigation The purpose of this sampling and testing was to evaluate sediments in the vicinity of the pipeline (Figure 1-4) to determine whether resuspended sediments will represent an adverse impact during pipe removal operations. The procedures for sediment sample collection, sample processing and preparation, physical and chemical analyses, biological testing and data analyses were presented in a previously approved Sampling and Analysis Plan (PER 2013). The specific objectives of the SAP scope-of-work were as follows:
• Collect sediment core and sediment surface samples from within the designated sampling areas following field protocol detailed in the SAP (PER 2013); and
• Conduct chemical and biological analyses of the collected sediments to determine whether resuspended sediment will represent an adverse impact during pipe removal operations.
1.2 Organization of this Document Sample collection and handling procedures are discussed in Sections 2 and 3. Results of chemical analyses and biological toxicity testing are provided in Sections 4 and 5. Section 6 discusses quality control and Section 7 presents whether resuspended sediments will represent an adverse impact during pipe removal operations.
8/99
Pacific EcoRisk Environmental Consulting and Testing
2
Figure 1-1. Location Map #1: Wastewater Outfall Pipeline Located in
Hercules, CA
9/99
Pacific EcoRisk Environmental Consulting and Testing
3
Figure 1-2. Location Map #2: Wastewater Outfall Pipeline Located in
Hercules, CA
10/99
Pacific EcoRisk Environmental Consulting and Testing
4
Figure 1-3. Vicinity Map #1: Wastewater Outfall Pipeline Located in
Hercules, CA
11/99
Pacific EcoRisk Environmental Consulting and Testing
5
Figure 1-4. Vicinity Map #2: Wastewater Outfall Pipeline Located in
Hercules, CA
12/99
Pacific EcoRisk Environmental Consulting and Testing
6
2. FIELD SEDIMENT SAMPLE COLLECTION All sediments were collected in accordance with guidelines and procedures outlined in the SAP (PER 2013). All sediment sampling field activities at the wastewater outfall pipeline were performed on March 25 and 28, 2013 under the direction of Mr. Jeffrey Cotsifas of Pacific EcoRisk. PER provided the sampling vessel, on-board positioning system, and sampling equipment. PER also provided additional Field Scientists to assist in sediment collection. Eight samples were collected from the wastewater outfall pipeline area (Figure 2-1). Field personnel collected sediment cores approximately 1 foot below the estimated pipeline depth or refusal along the length of the buried portion of the pipeline. In areas where the pipeline is exposed, sediment surface samples were collected using a Van-Veen sampler. Final sample site positions were determined with a differential global positioning system (GPS). Table 2-1 lists station identifiers, GPS coordinates for all core locations, mudline elevations, and core penetration depths for all stations. All sediment samples were maintained on ice until transported to the PER testing lab for processing. Upon receipt at PER, all samples were logged in and placed in cold storage at ≤4°C in the dark until needed. Field log sheets are presented in Appendix A. There were no unusual circumstances encountered during the fieldwork, and no major deviations from the SAP (PER 2013).
13/99
Pacific EcoRisk Environmental Consulting and Testing
7
Table 2-1. Locations of Sampling Stations and Core Depths Achieved.
Pacific EcoRisk Environmental Consulting and Testing
10
3. SAMPLE PROCESSING 3.1 Homogenization and Compositing of Sediments Homogenization and compositing of individual sediment samples were performed at the PER laboratory facility in Fairfield, CA. The sediment from each individual sediment sample was individually homogenized in a stainless-steel bowl. A 500-mL sub-sample of the homogenized sediment from each individual sediment sample was archived to allow for additional chemical analyses, if necessary; archived samples were stored frozen at -20 ± 10˚C for up to one [1] year after sample collection. Proportionate amounts of the homogenized sediment from each of the Hercules pipeline individual sediment samples were composited and homogenized within a stainless steel container to form the “HP-Comp” composite sediment. A sub-sample of the HP-Comp sample was frozen for archival storage as described above. Samples of the composited sediments were submitted for chemical and conventional analyses and toxicity testing. All sediment was processed following procedures outlined in the SAP (PER 2013), with no deviations. 3.2 Shipping of Sediment Samples to the Analytical Laboratories Prior to shipping to the analytical laboratory, sample containers were wrapped in bubble wrap and securely packed inside a cooler with ice packs or crushed ice. A temperature blank was included in each cooler. The original signed chain-of-custody (COC) forms were placed in a sealed plastic bag and taped to the inside lid of the cooler. Appropriate packaging tape was wrapped completely around the cooler. A This Side Up arrow label was attached on each side of the cooler, a Glass-Handle with Care label was attached to the top of the cooler, and the cooler was sealed with custody seals on both the front and the back lid seams. Sediment samples were shipped by overnight delivery. The sub-contracting analytical laboratories are not to dispose of any samples for this project unless notified by PER in writing. 3.2.1 Chain-of-Custody (COC) Protocol COC procedures were followed for all samples throughout the collection, handling, and analyses activities. The Sampling and Analysis Project Manager, or a designee, was responsible for all sample tracking and COC procedures. This person was responsible for final sample inventory, maintenance of sample custody documentation, and completion of COC forms prior to transferring samples to the analytical laboratory. A COC form accompanied each cooler of samples to the respective analytical laboratories. Each custodian of the samples signed the COC form; copies of the COC forms are retained in the project file.
17/99
Pacific EcoRisk Environmental Consulting and Testing
11
4. ANALYTICAL CHEMISTRY RESULTS The sediment samples were analyzed by Calscience for the conventional and chemical parameters specified in the SAP (PER 2013). Conventional parameters included total organic carbon (TOC), total solids, and grain size. Chemical analyses included trace metals, polychlorinated biphenyls (PCBs), polycyclic aromatic hydrocarbons (PAHs), chlorinated pesticides, and butyltins. The results of these analyses are presented in Section 4.1; the full Data Reports are provided in Appendix B. Sediment physical and chemical characteristics provide information about chemicals of concern present in the sediment and their potential bioavailability, and about non-chemical factors that could affect toxicity. The results of the physical and chemical analyses of the sediments were compared to Bay Ambient sediment concentrations (SFRWQCB 1998). Analytical results are summarized in Tables 4-1 through 4-6. 4.1 HP-Comp Composite Analytical Chemistry Results The “HP-Comp” site sediment was ~61.9% total solids, and was 100% fines (silts and clays). TOC levels were moderate (1.0%). All of the metal analytes for the HP-Comp sediments were generally similar to or below San Francisco Bay (SF Bay) background levels (SFRWQCB 1998). While the cadmium level was slightly above SF Bay background levels, it was below the cadmium Effects Range-Low (ER-L) of 1.2 mg/kg (Long et al 1995) and is unlikely to cause an adverse biological effect. Organotins and organochlorine pesticides were below their respective MDLs. Total PAHs, total PCBs, and total DDTs were reported at 1,207 µg/kg, 19.3 µg/kg and 0 µg/kg, respectively; each was below SF Bay background levels (SFRWQCB 1998).
18/99
Pacific EcoRisk Environmental Consulting and Testing
12
Table 4-1. Hercules Pipeline Sediment Grain Size, Total Solids (%), and Total Organic Carbon (%).
Dibenzothiophene 2.2 J - Total Detected PAHs 1207 3390, 4800a
a - San Francisco Bay Bioaccumulation Trigger Level (USACE/USEPA 2011, SFEI 2013). J - Analyte was detected at a concentration below the reporting limit and above the laboratory method detection
limit; the reported value is therefore an estimate. All results below the MDL are reported as < the MDL.
20/99
Pacific EcoRisk Environmental Consulting and Testing
Trans-nonachlor <0.47 - Toxaphene <10 - 2,4’-DDD <0.55 see total DDT 4,4’-DDD <0.51 see total DDT 2,4’-DDE <0.49 see total DDT 4,4’-DDE <0.48 see total DDT 2,4’-DDT <0.49 see total DDT 4,4’-DDT <0.54 see total DDT
Total Detected DDT 0 7.0, 50a a - San Francisco Bay Bioaccumulation Trigger Level (USACE/USEPA 2011, SFEI 2013). J - Analyte was detected at a concentration below the reporting limit and above the laboratory method detection
limit; the reported value is therefore an estimate. All results below the MDL are reported as < the MDL.
21/99
Pacific EcoRisk Environmental Consulting and Testing
(SFRWQCB 1998) PCB 008 <0.14 a PCB 018 <0.25 a PCB 028 <0.16 a PCB 031 <0.19 a PCB 033 <0.18 a PCB 044 0.33 J a PCB 049 0.61 J a PCB 052 0.73 J a PCB 056 <0.22 a PCB 060 <0.17 a PCB 066 0.31 J a PCB 070 0.50 J a PCB 074 <0.15 a PCB 087 0.41 J a PCB 095 1.3 a PCB 097 0.70 J a PCB 099 0.81 a PCB 101 1.9 a PCB 105 0.56 J a PCB 110 1.7 a PCB 118 1.6 a PCB 128 0.53 J a PCB 132 <0.27 a
PCB 138/158 2.0 a PCB 141 0.31 J a PCB 149 1.2 a PCB 151 0.25 J a PCB 153 1.9 a PCB 156 0.32 J a PCB 170 0.33 J a PCB 174 0.27 J a PCB 177 <0.20 a PCB 180 0.44 J a PCB 183 <0.18 a
22/99
Pacific EcoRisk Environmental Consulting and Testing
(SFRWQCB 1998) PCB 187 0.25 J a PCB 194 <0.15 a PCB 195 <0.085 a PCB 201 <0.092 a PCB 203 <0.17 a
Total Detected PCBs 19.3d, 12.4e 22.7, 29.3b 17.0c a - No reference value has been established for the individual congeners; the Total Detected PCB congener reference value (SFRWQCB 1998) is used as a default value. b - San Francisco Bay 99th percentile PCB concentration (SFRWQCB 2013). c - San Francisco Bay Bioaccumulation Trigger Level (USACE/USEPA 2011, SFEI 2013). d - Summary includes J flagged data. e - Summary excludes J flagged data. J - Analyte was detected at a concentration below the reporting limit and above the laboratory method detection
limit; the reported value is therefore an estimate. All results below the MDL are reported as < the MDL.
23/99
Pacific EcoRisk Environmental Consulting and Testing
17
5. BIOLOGICAL TESTING RESULTS
A 96-hr mysid survival test with the mysid shrimp Americamysis bahia was performed for the site composite sample. These tests were performed following appropriate protocols as outlined in the SAP (PER 2013). Test data and summaries of the statistical analyses for the bioassay results are provided in Appendices C and D. Summaries of test conditions and test acceptability criteria are provided in Appendix E. 5.1 Sediment Porewater Characterization Prior to the initiation of the sediment tests, the sediments were removed from refrigerated storage, and each sample was re-homogenized in a large stainless steel bowl. Aliquots of the re-homogenized composite sediments were centrifuged at 2,500 g for 15 minutes; the resulting supernatant porewaters were carefully collected and analyzed for ammonia analysis (Table 5-1).
Table 5-1. Sediment Porewater Initial Water Ammonia Levels. Sample ID pH Total Ammonia (mg/L N) Total Sulfide (mg/L) HP-Comp 7.70 4.34 0.103
5.2 Water Column (Sediment Elutriate) Toxicity Testing The 96-hr survival test with A. bahia was performed on the sediment elutriate to determine whether resuspended sediments would represent an adverse impact during pipe removal operations. Positive and negative Lab Control treatments were tested concurrently with the site sediment elutriate. The positive Lab Control consisted of a ‘waterborne’ reference toxicant test; the results of these tests were compared to PER’s reference toxicant test response databases to determine whether these test organisms were responding to toxic stress in a typical fashion. The negative Lab Control (and dilution media) water for this test was prepared by adjustment of Type 1 lab water (reverse-osmosis, de-ionized water) to a salinity of 25 ppt using a commercial artificial sea salt (Crystal Sea Salt®-bioassay grade). As an additional QA measure, the site water that was collected from the same area as the sediment samples, and which was mixed with the sediments to prepare the 100% elutriates, was also tested. The test results for the sediment composite elutriate were compared with the test organism responses at the negative Lab Control treatment to determine the potential impact of suspended sediment resulting from the proposed pipeline removal on pelagic organisms in the near vicinity. The following criteria were used:
1. If the survival response in the 100% sediment elutriate treatment is ≥ the Control (clean seawater) treatment response(s), the sediment is not predicted to be acutely toxic to water column organisms.
2. If the reduction in survival response in the 100% sediment elutriate treatment relative to the Control treatment is ≤10%, there is no need for statistical analyses and no indication of water column toxicity attributable to the test sediments.
24/99
Pacific EcoRisk Environmental Consulting and Testing
18
3. If the reduction in survival response in the 100% sediment elutriate treatment relative to the Control treatment is >10%, then the data must be evaluated statistically to determine the magnitude of toxicity.
5.2.1 Toxicity of Sediment Elutriates to Americamysis bahia The results of this test are summarized below in Table 5-2. There was 100% survival at the Control treatment, indicating an acceptable survival response by the test organisms; there was 98% survival in the Site Water. There were no significant reductions in survival in any of the elutriate treatments; the No Observable Effect Concentratoin (NOEC) was 100% elutriate indicating that the 100% elutriate sample was not toxic to mysids. The test data and summary of statistical analyses for these tests are attached as Appendix C.
Table 5-2. Effects of HP-Comp Sediment Elutriate on Americamysis bahia.
Test Treatment Mean % Survival Lab Control 100
1% 98 10% 100 50% 100 100% 100
Site Water 98 Survival NOEC = 100% elutriatea Survival LC50 = >100% elutriatea
a - Due to the absence of significant impairment, the LC50 could not be calculated but can be determined by inspection to be >100% elutriate.
5.2.1.1 Reference Toxicant Toxicity to Americamysis bahia - The results of this test are presented in Table 5-3. There was 90% survival in the Lab Control treatment; the LC50 value was 0.68 g/L KCl, which is consistent with the typical response range established by the reference toxicant test database for this species, indicating that these test organisms were responding to toxic stress in a typical fashion. The test data and summary of statistical analyses for this test is attached as Appendix D.
Table 5-3. Reference Toxicant Testing: Effects of KCl on Americamysis bahia. KCl Treatment (g/L) Mean % Survival
* The response at this test treatment was significantly less than the Lab Control treatment response at p < 0.05.
25/99
Pacific EcoRisk Environmental Consulting and Testing
19
6. QUALITY CONTROL REVIEW Any analyses that did not comply with the analytical laboratory QA/QC limits are presented below (also, see final analytical report in Appendix B for full case narrative). The QA/QC review entailed reviewing the contract lab Data Report(s) for sample integrity, correct methodology, and compliance with all appropriate Lab QA/QC requirements. The overall data quality assessment found that all data were usable. Appendix B contains the conventional and chemical analyses reports, which includes the contract laboratory QA/QC narrative. 6.1 Sediment Conventional and Chemical Analytical QA/QC Summary Calscience Report 13-04-0291 Metals – A trace level, below the reporting limit (RL) but above the method detection limit (MDL), of arsenic was found in the Method Blank. Also, the matrix spike (MS) recovery for lead and the matrix spike duplicate (MSD) recovery for zinc were outside the established control limits. Since the laboratory control sample (LCS) and laboratory control sample duplicate (LCSD) recoveries were within the control limits, the results were released with no further action. Organochlorine Pesticides – The relative percent differences (RPD) for 4,4’-DDT and methoxychlor and the MS recovery for methoxychlor were out of control. The results were flagged with the appropriate qualifiers and were released with no further action taken. Organotins – The MS recovery for tetrabutyltin was below the control limits. However, the results were released as is since the MSD, LCS, and LCSD recoveries were in control. PAHs – Trace levels, below the RL but above the MDL, of pyrene and 1-methylnaphthalene were found in the method blank. The MS/MSD recoveries for benzo(b)fluoranthene, benzo(k)fluoranthene, and pyrene were below the established control limits due to matrix interference. However, since the associated LCS and LCSD recoveries were in control, the results were released with no further action. The 2-fluorobiphenyl recovery was high in both samples. Since the other surrogate recoveries were in control, matrix interference is probable and so the data was released as is. 6.2 Biological Testing Quality Lab Control Summary The biological testing of the sediments incorporated standard QA/QC procedures to ensure that the test results were valid. Standard QA/QC procedures included the use of negative Lab Controls, positive Lab Controls, test replicates, and measurements of water quality during testing.
26/99
Pacific EcoRisk Environmental Consulting and Testing
20
Quality assurance procedures that were used for sediment testing are consistent with methods described in the U.S.EPA/ACOE (1998). Sediments for the bioassay testing were stored appropriately at ≤4°C and were used within the 8 week holding time period. Sediment interstitial water characteristics were within test acceptability limits at the start of the tests. The sediment elutriate was prepared using site water, Type 1 lab water (reverse-osmosis, de-ionized water) adjusted to a salinity of 25 ppt using a commercial artificial sea salt (Crystal Sea Salt®-bioassay grade) was used as the dilution medium. All measurements of routine water quality characteristics were performed as described in the PER Lab Standard Operating Procedures (SOPs). All biological testing water quality conditions were within the appropriate limits. Laboratory instruments were calibrated daily according to Lab SOPs, and calibration data were logged and initialed. Standard test conditions are presented in Appendix E. Negative Lab Control – The biological responses for all the test organisms at the negative Lab Control treatments were within acceptable limits for the sediment and sediment elutriate tests. Positive Lab Control – The reference toxicant test results were consistent with the “typical response” ranges established by the reference toxicant test database for this species, indicating that these organisms were responding to toxic stress in a typical and consistent fashion. Concentration Response Relationships - The concentration-response relationships for the sediment elutriate test and reference toxicant test was evaluated as per EPA guidelines (EPA-821-B-00-004), and were determined to be acceptable.
27/99
Pacific EcoRisk Environmental Consulting and Testing
21
7. SUMMARY The Hercules Pipeline sediments were analyzed to determine whether resuspended sediments would represent an adverse impact during pipe removal operations. Sediments will be archived for up to a year should additional site-specific analytical chemistry be required. All of the analytes for the HP-Comp sediment were generally similar to or below San Francisco Bay background levels (SFRWQCB 1998). It should be noted that cadmium was measured slightly above SF-Bay background levels; however, this concentration was below the cadmium ER-L (Long 1995) and is unlikely to cause an adverse biological effect. Additionally, the sediment elutriate test indicated that toxicity would not be expected sue to sediment resuspension during pipeline removal. Based on these results, the Hercules pipeline sediments would not represent an adverse impact during pipe removal operations.
28/99
Pacific EcoRisk Environmental Consulting and Testing
22
8. REFERENCES PER (2013) Sediment Characterization Sampling and Analysis Plan (SAP) for the Removal of a Wastewater Outfall Pipeline Located in Hercules, CA. Prepared for Boudreau Associates LLC. Prepared by Pacific EcoRisk, Fairfield, CA. Plumb RH, Jr (1981) Procedure for Handling and Chemical Analysis of Sediment and Water Samples. Technical Report U.S. EPA /CE-81-1, prepared by Great Lakes Laboratory, State University College at Buffalo, Buffalo, NY, for the U.S. Environmental Protection Agency/Corps of Army Engineer Waterways Experiment Station, Vicksburg, MS. Long, E. R., D. D. MacDonald, S. L. Smith, and F. D. Calder. 1995. Incidence of Adverse Biological Effects within Ranges of Chemical Concentrations in Marine and Estuarine Sediments. Environ. Manage. 19(1):81-97. SFRWQCB (1998) Ambient concentrations of toxic chemicals in San Francisco Bay Sediments: Draft Staff Report. San Francisco Regional Water Quality Lab Control Board, Oakland, CA. USACE (1985) Environmental Effects of Dredging: Technical Notes. US Army Engineer Waterways Experiment Station, Environmental Laboratory. Vicksburg, MS. US EPA/USACE (1995) QA/QC Guidance for Sampling and Analysis of Sediments, Water, and Tissues for Dredged Materials Evaluations. U.S. Environmental Protection Agency/U.S. Army Corps of Engineers. EPA/823/B-95/001. Office of Water. Washington, DC. EPA-823-B-95-001. April 1995. US EPA/USACE (1998) Evaluation of Dredged Material Proposed for Discharge in Waters of the U.S. – Testing Manual (Inland Testing Manual). U.S. Environmental Protection Agency/U.S. Army Corps of Engineers. EPA/823/B-94/002. Office of Water. Washington, DC 20460. USEPA/USACE (2011) DMMO Agreement on Programmatic EFH Conservation Measures for Maintenance Dredging Conducted Under LTMS Program (Tracking Number 2009/06769). US EPA (1998a) EPA Requirements for Quality Assurance Project Plans. United States Environmental Protection Agency, Quality Assurance Division, Washington, DC 20460. US EPA (1998b) EPA Guidance for Quality Assurance Project Plans. United States Environmental Protection Agency, Office of Research and Development, Washington, DC 20460. US EPA (2002) Methods for Measuring the Acute Toxicity of Effluent and Receiving Waters to Freshwater and Marine Organisms, Fifth Edition. United States Environmental Protection Agency, Office of Water, Washington, DC 20460.
29/99
Pacific EcoRisk Environmental Consulting and Testing
Appendix A
Sampling Field Logs and Data Sheets
30/99
31/99
32/99
33/99
34/99
35/99
36/99
37/99
38/99
39/99
40/99
Pacific EcoRisk Environmental Consulting and Testing
Appendix B
Results of the Sediment Conventional and Chemical Analyses: Laboratory Data Reports Submitted by
Calscience
41/99
42/99
43/99
44/99
45/99
46/99
47/99
48/99
49/99
50/99
51/99
52/99
53/99
54/99
55/99
56/99
57/99
58/99
59/99
60/99
61/99
62/99
63/99
64/99
65/99
66/99
67/99
68/99
69/99
70/99
71/99
72/99
73/99
74/99
75/99
76/99
77/99
78/99
79/99
80/99
81/99
82/99
83/99
84/99
85/99
86/99
87/99
88/99
Pacific EcoRisk Environmental Consulting and Testing
Appendix C
Test Data and Summary of Statistics for the Evaluation of the Toxicity of the Hercules Pipeline
Sediment Elutriate to Mysids (Americamysis bahia)
89/99
90/99
91/99
92/99
93/99
94/99
Pacific EcoRisk Environmental Consulting and Testing
Appendix D
Test Data and Summary of Statistics for the Reference Toxicant Evaluation of the Mysid,
Americamysis bahia
95/99
96/99
97/99
Pacific EcoRisk Environmental Consulting and Testing
Appendix E
Bioassay Standard Test Conditions
98/99
Pacific EcoRisk Environmental Consulting and Testing
E - 1
Summary of Test Conditions and Acceptability Criteria for the Mysid (Americamysis bahia) Water Column Toxicity Test.
1. Test type Static non-renewal 2. Test duration 96 hours 3. Salinity 25-30 ppt + 10 ppt 4. Temperature 20 ± 1°C 5. Light quality Ambient Laboratory 6. Light intensity 50 –100 ft c. 7. Photoperiod 16L/8D 8. Test chamber size 400 mL beaker 9. Test solution volume 200 mL 10. Renewal of seawater None 11. Age of test organisms 1-5 days; 24 hour range in age 12. # of organisms per test chamber 10 13. # of replicate chambers per concentration 5 14. # of organisms per concentration 50 15. Feeding regime daily 16. Test chamber cleaning Lab washing prior to test 17. Test chamber aeration If needed to maintain >40% saturation 18. Elutriate preparation water Site water or Clean sea water 19. Test concentrations Test sites, and Lab Control
20. Dilution series Four concentrations (1, 10, 50, 100%) and a Lab Control
21. Dilution water
Type 1 lab water (reverse-osmosis, de-ionized water) adjusted to a salinity of 25 ppt using a commercial artificial sea salt (Crystal Sea Salt®-bioassay grade)
22. Endpoints % Survival 23. Sampling holding requirements < 8 weeks 24. Sample volume required 2L 25. Test acceptability criteria ≥90% survival in the Lab Controls
99/99
APPENDIX B Longfin smelt data analysis details
1
Appendix B. Deriving a catchability factor for longfin smelt.
References cited here are listed in the main document.
Newman (2008) fit a probability‐of‐capture model for delta smelt (Hypomesus transpacificus) from experimental data based on a midwater trawl with cod‐end mesh size nominally identical to that used in the present data set. Here, the catchability curve derived by Newman is applied to longfin smelt, using CDFW Bay Study length frequency data for both trawls together for all years and months through 2008 (Figure A1 and Table A1). From Newman's Appendix A, Figure 5, a catchability quotient was estimated for each 5‐mm size increment, assuming longfin smelt escape as delta smelt do. For fish > 90 mm FL (fork length), Q was taken as 1, based on Newman's empirical data The fraction of age‐0 fish in each 5‐mm increment was calculated from the longfin smelt length frequency data. Then a weighted catchability quotient, Q0, was calculated from the sums of products of these fractions by their respective estimated Q's (Table A1). The resulting estimate is Q0=0.38, i.e., 38% of longfin smelt are retained in the cod end of the trawl under these assumptions. That is, to estimate abundance from catch data, the catch rate should be multiplied by a factor of 2.6 to account for extrusion through the mesh of the net.
Figure A1. Combined length frequency plot for longfin smelt from otter trawl and midwater trawl, CDFW Bay Study, 1980‐2008.
*Q=catchability from Newman (2008); values<1 based on his fitted curve in Appendix A, Fig 5; values=1 based on his empirical data.
Extrusion through the mesh of the net becomes less of a problem in the larger length categories (e.g., at lengths> 70 mm, 100% of smelt were retained according to Newman's observed data), but avoidance of the trawl may be a concern. There are no published data for net avoidance by longfin smelt. There is in fact surprisingly little quantitative data for any species, given that small otter trawls are common samplers in inshore habitats. DeMartini and Allen (1984) reported day‐night differences in capture rates of queenfish (Seriphus politus), a small pelagic croaker. On the assumption that their trawl was 100% efficient at night, then the daytime efficiency for queenfish averged 24% at two depths where several hundred trawls were made. This would suggest a multiplier of about 4 for the larger fish, assuming longfin smelt to be capable of avoiding a small otter trawl to the same extent as do queenfish.
Finally, Figure A1 and Table A1 require further explanation. That is, longfin smelt <40 mm, though captured in the trawls, are not recorded (K. Hieb, personal communication: see also Orsi 1999). This means that the fish in the category reported here as 36‐40 mm were all = 40mm FL, and that smaller fish, which may still be present in early summer (Orsi 1999) are not accounted for. For this reason, the multiplier of 2.6 based on the value of Q0 developed above is not conservative for smaller fish, and of course does not cover avoidance by the less numerous, larger fish. It therefore seems prudent to use a multiplier >3, and conservative to use a value of 4 for all ages together in order to scale
3
the trawl catch to an estimate of abundance for use in estimating encounter rates with the project.