Prolonged Dry Episodes over the Conterminous United States: New TendenciesEmerging during the Last 40 Years
PAVEL YA. GROISMAN
UCAR Visiting Scientist, National Climatic Data Center, Asheville, North Carolina
RICHARD W. KNIGHT
STG, Inc., Asheville, North Carolina
(Manuscript received 24 April 2007, in final form 6 September 2007)
ABSTRACT
A disproportionate increase in precipitation coming from intense rain events, in the situation of generalwarming (thus, an extension of the vegetation period with intensive transpiration), and an insignificantchange in total precipitation could lead to an increase in the frequency of a potentially serious type ofextreme events: prolonged periods without precipitation (even when the mean seasonal rainfall totalsincrease). This paper investigates whether this development is already occurring during the past severaldecades over the conterminous United States, for the same period when changes in frequency of intenseprecipitation events are being observed. Lengthy strings of “dry” days without sizeable (�1.0 mm) pre-cipitation were assessed only during the warm season (defined as a period when mean daily temperature isabove the 5°C threshold) when water is intensively used for transpiration and prolonged periods withoutsizable rainfall represent a hazard for terrestrial ecosystem’s health and agriculture. During the past fourdecades, the mean duration of prolonged dry episodes (1 month or longer in the eastern United States and2 months or longer in the southwestern United States) has significantly increased. As a consequence thereturn period of 1-month-long dry episodes over the eastern United States has reduced more than twofoldfrom 15 to 6–7 yr. The longer average duration of dry episodes has occurred during a relatively wet periodacross the country but is not observed over the northwestern United States.
1. Introduction
It has been shown that with an increase or decreaseof total precipitation, disproportionate changes occur inthe upper end of the precipitation frequency distribu-tion (Karl and Knight 1998; Groisman et al. 1999, 2001,2004; Kunkel et al. 1999; Easterling et al. 2000; Follandand Karl 2001; Semenov and Bengtsson 2002; Kunkel2003). Over the conterminous United States, this fea-ture has become prominent since circa 1970 (Soil andWater Conservation Society 2003). In particular, up-ward trends in the amount of precipitation occurring inthe upper 0.3% of daily precipitation events are statis-tically significant for the past hundred years within thecentral regions of the United States (Groisman et al.
2004). A time series of the frequency of events in theupper 0.3% averaged for these regions shows a 22%increase over the period since 1893 with all of thisincrease occurring over the last third of the twentiethcentury (Fig. 1). These upward trends are primarily awarm season phenomenon when the most intense rain-fall events typically occur.
Karl and Knight (1998) show that most (87% of thevariance nationwide for the conterminous UnitedStates) of the increase in seasonal/annual precipitationcan be ascribed to changes in the number of days withprecipitation.1 The tendencies, which emerged duringthe past 35–40 yr with a disproportional increase in
Corresponding author address: Pavel Ya. Groisman, NationalClimatic Data Center, Federal Building, 151 Patton Avenue,Asheville, NC 28801.E-mail: [email protected]
1 Karl and Knight (1998) and subsequent studies (Easterling etal. 2000; Stone et al. 2000; Groisman et al. 2004, 2005) all showthat most of the precipitation increase over the United States andCanada occurs due to an increase in the frequency of intenseprecipitation, while the frequency of days with average and lightprecipitation does not change or decreases.
precipitation coming from intense rain events (Grois-man et al. 2004, 2005), should lead to discontinuities inthe parallel increase/decrease of both total precipita-tion and precipitation frequency. For the United Statesthis discontinuity was first reported by Sun and Grois-man (2004) and for the northeastern quadrant of theconterminous United States confirmed by Groisman etal. (2005). Specifically, for the northeastern quadrant ofthe United States, they reported an increase (or nochange) in precipitation totals but a decrease in thenumber of days with precipitation. If continued, thisdecrease in precipitation frequency may lead to an in-crease in the frequency of another potentially hazard-ous type of extreme event: prolonged periods withoutprecipitation (even when the mean seasonal rainfall to-tals increase). Below we investigate whether this devel-opment is already occurring during the past several de-cades over the conterminous United States, for thesame period when we begin observing changes in fre-quency of intense precipitation events (i.e., since circa1970).
2. Methodology
a. Data
For our analyses we use the same daily precipitationdataset of the U.S. Cooperative Observer Program(COOP) stations described in Groisman et al. (2004)but updated to 2006. The National Weather Service(NWS) COOP is truly the United States’s weather and
climate observing network of, by, and for the people.More than 11 000 volunteers take observations onfarms, in urban and suburban areas, national parks, sea-shores, and mountaintops. The data are truly represen-tative of where people live, work, and play.
b. Approach
Paleoclimatic reconstructions (e.g., Herweijer et al.2007) provide a large-scale picture of drought frequen-cies during the past millennium, and in situ observa-tions (e.g., Dai et al. 2004; Andreadis et al. 2005) cannow deliver quite detailed information about the dryconditions during the past 100 years. If not driven by alarge-scale storm system, a precipitation mosaic fromsummer storms leaves numerous dry spots across thecountry (cf. http://www.drought.unl.edu/dm/monitor.html). It is not our intention to study this mosaic orindividual spectacularly dry years. Instead we focus onsystematic changes of dry conditions on the nationwidescale during the past 40 yr using only precipitation in-formation from our station network. We are looking forlarge-scale changes in the annual areal summation ofthe duration of nonrain episodes over the nation andare not very much interested in a particular pattern ofthese dry episodes. The rationale for this selective in-terest is a potential of linking these changes withchanges in global-scale processes (e.g., global warm-ing), which might affect continental dryness (Manabe etal. 1981, 2004). The GCM simulations forced by differ-ent scenarios of changes in atmospheric composition(e.g., Manabe et al. 2004; Kharin et al. 2007; McAvaneyet al. 2001) hint at the potential for significant changesin “summer” dry conditions but are not yet able toproduce a detailed picture of these changes.
c. Focus on the warm season and prolongedno-rain episodes
We know that the number of rainy days over thecountry has increased during the past 100 years and thata tendency toward opposite trends shows up in someregions during the last 35–40 yr (Karl and Knight 1998;Groisman et al. 2001, 2005). A decrease in the numberof rainy days itself does not represent an obvious haz-ard for society and ecosystems and cannot be consid-ered as an extreme event per se. However, an increasein the frequency (and length) of prolonged periodswithout sizable rainfall during the warm season whenwater is intensively used for transpiration may repre-sent a hazard for both terrestrial ecosystem health andagriculture. Therefore, we select the warm season only(here we define it as a period when mean daily tem-perature remains persistently above the 5°C threshold)
FIG. 1. Regions of the contiguous United States (hatched)where statistically significant annual increases in very heavy pre-cipitation for the 1908–2002 period were reported by Groismanet al. (2004) and very heavy precipitation (upper 0.3% of dailyrain events with a return period of 4 yr) over these regions of thecentral United States and their linear trends. Linear trends for the1893–2006 and 1967–2006 periods (solid lines) are equal to 22%per 114 yr and 27% per 40 yr, respectively, and are statisticallysignificant at the 0.05 level or higher (updated from Groisman etal. 2005).
1 MAY 2008 G R O I S M A N A N D K N I G H T 1851
Fig 1 live 4/C
and count strings of dry days defined as the days whendaily precipitation is absent or is below 1 mm. We con-sider the string as “broken” when its growth is stoppedon the day when the station daily rainfall is 1 mm orabove. The string growth is suspended (but the tallysaved) at a given day when the daily temperature oc-casionally falls below 5°C. This dry day is not counted,but the string can continue growing when temperaturerises. In other words, a brief late spring or early fall coldspell will not break the “season.” As a result of thisprocedure, for each year at each station we calculate(i) the number of days in the “warm” season, (ii) thenumber of strings with dry days, and (iii) the stringlengths (in days). Our focus is not on the short stringsbut only those that are longer than given thresholds, X.The number of days in these long strings is counted anda percentage of the warm season with thus defined pro-longed dry periods with duration of X days or longer iscalculated. The number of days above a chosen thresh-old (X ) of dry day strings is tallied. The count is thendivided by the season day length, which becomes a per-cent of the warm season length with prolonged dry daystrings. This approach gives us a chance to express inone number the severity of dry periods above the X daythreshold (later described by the notation DryX�, e.g.,Dry20�, Dry30�, Dry60�, etc.) during a specific warmseason at a given station and allows for area averagingof these quantities, first over 1° grid cells and secondover the large areas of the conterminous United Statesand, finally, to consider their trends for the past severaldecades.
d. Regional averaging routine used
We are focusing on the last few decades and are hop-ing to reveal late changes in the dry conditions on thebackground of large weather variability and geographic“noise.” Therefore, we are using area averaging so as tosuppress this noise (Groisman et al. 2005). Meteoro-logical stations are not uniformly distributed and miss-ing years are present in most of the records. Both fac-tors had to be addressed to properly represent regionalaverages of (i) the frequency and/or duration of pro-longed dry episodes, (ii) duration of the warm season(DWS), and (iii) frequency of very heavy (very light)precipitation derived from in situ observations. Area-averaged calculations presented in this paper all use thesame method. First, we selected a reference period withthe greatest availability of data to estimate the long-term mean values for each quantity studied. The periodselected was 1961–90, but the use of other referenceperiods (1951–2005 and 1967–2006) was also tested toensure that this selection does not affect our results.For each station, for each quantity (very heavy precipi-
tation, warm season duration, duration of the dry epi-sodes above X thresholds, and for the dry episode per-centage within the warm season), we determined theirclimatological mean values during the reference period.For each quantity, region, and year we calculated theanomalies from the long-term mean value of thesequantities for each station and then arithmetically av-eraged these anomalies within 1° � 1° grid cells. Theseanomalies were regionally averaged with the weightsproportional to their area. Data from the large regionsuse the regional area weights to form a national averagewhen those analyses are presented (e.g., for the warmseason duration and days with very heavy and very lightprecipitation). The long-term mean values (normalsfrom reference period years 1961–90) were area aver-aged in a similar fashion and used to restore actualregional quantity values from regional anomalies. Thisapproach emphasizes underrepresented parts of the re-gion/country because a region, even with a relativelylow percentage of grid cells with data, will receive thefull weight comparable to the region’s area relative toother regions. It also allows preservation of the regionaltime series unaffected by the changing availability ofdata with time.2
e. Interpretation of linear trend estimates
We used (in addition to the linear trend assessment)a nonparametric test to check for a monotonic changeof the time series. Once a statistically significant trendhas been discovered, we characterize it by the mean rateof change. A linear trend estimate is an essential char-acteristic in this case. We tested the presence of sys-tematic change in the time series using two standardmethods: least squares regression (Draper and Smith1966; Polyak 1996) and a nonparametric method basedon the Spearman rank order correlation (Kendall andStuart 1967). We used two-tailed tests at the 0.05 orhigher significance level (except in Table 2 where aone-tailed test was also used). We tested for auto-correlation of the detrended time series, but the residu-
2 We used this area-averaging routine during the past decadefor various climate variables (e.g., Groisman and Legates 1995;Karl and Knight 1998; Groisman et al. 2001, 2004, 2005) afterextensive testing regarding the robustness of the algorithm. Theresults of its implementation are close to those based on area-averaging procedures built on optimal interpolation and optimalaveraging with normalizing weights (Kagan 1997). “Optimal” pro-cedures (i.e., those that deliver the minimal standard error of areaaveraging) are much more computationally expensive and pre-serve their optimal properties only when specifics of the statisticalstructure of the meteorological field to be averaged are wellknown. This is not the case for many of the quantities we analyzedand, thus, we opted not to use them.
1852 J O U R N A L O F C L I M A T E VOLUME 21
als of the regional warm season duration, frequencies ofprolonged dry episodes, and very heavy precipitationwere never found to be significantly autocorrelated. Allarea averaging and trend estimation procedures are lin-ear and allow transposition: We can calculate lineartrends at each station and then area average them or wecan construct area-averaged time series of the regionalpercentage of the days with prolonged dry day stringsand then calculate the trends. We selected the latterway to present our results in this paper. Peculiarities ofprocessing the missing observations, the effects of se-lection of the X threshold, the 1-mm threshold for in-clusion of a day with “sizeable” precipitation, and thebeginning year for trend analyses are discussed in theappendix.
3. Climatology and regional partition
a. Long-term mean values of the duration of thewarm season and percentage of prolongedno-rain episodes
Figure 2 shows the long-term mean percentage ofdays with strings of different length as calculated for the1951–2005 period. The station mean values were arith-metically area averaged within 1° � 1° grid cells. If noone station within the grid cell has a single string withdry days during the entire 1951–2005 period, the gridcell was left blank. For example, the blue dots in Fig. 2a
(�0.8%) indicate that during the past 55 yr in these1° � 1° grid cells there were from one to four 30-day-long or longer, no rain strings observed. Figure 2dshows the climatology of the warm season duration(with mean daily temperatures above 5°C) for the sameperiod. These periods vary from 103 days (in the Northand in the mountainous West) to 365 days in southernFlorida and California. The duration of this period hassystematically changed during the past 100 yr withnationwide and global warming (cf. Easterling 2002;Shein 2006). While not a subject of this study, we, nev-ertheless, estimated trends in this quantity for the pastcentury (no significant trends were found) and duringthe past 40 yr.
The Upper Great Lakes region (Minnesota, Wiscon-sin, and Michigan) is a very humid region with frequentrainfall in the warm season. We observe there a verysmall percentage of month-long dry strings (only 0.5%).Therefore, we separated this region as a special entityand generally excluded it from further analyses of dryepisodes. Thereafter, we partitioned the rest of the con-tiguous United States into several regions as shown inFig. 3. In the eastern United States (the states east of95°W without Minnesota, Wisconsin, and Michigan),we looked for month-long dry strings. West of 95°W welooked for 60-day-long dry strings (in the southwesternUnited States that includes Texas, Oklahoma, NewMexico, Arizona, California, and Nevada) and for both30- and 60-day dry strings in the northwestern quadrant
FIG. 2. (a)–(c) Climatology of the mean percentage of the warm season included in the string lengths of dry days of(a) �30 days, (b) �60 days, and (c) �90 days in the strings. When no such strings have been observed during the past 55yr (1951–2005), the area is left blank. A few 1° � 1° grid cells in the western United States (e.g., in Nevada) are also leftblank due to insufficient long-term station data coverage. (d) Climatology of the warm season duration (days with meandaily temperature above 5°C) over the conterminous United States.
1 MAY 2008 G R O I S M A N A N D K N I G H T 1853
Fig 2 live 4/C
of the country that includes the Great Plains, CentralRockies, and northwestern United States. We dividedthe western United States into southern and northernparts using a well-known anticorrelation between rain-fall in the northwest and southwest of the country (e.g.,Groisman and Easterling 1994) due to variations in an-nual rainfall anomalies associated with ENSO-imposedlatitudinal variations of the winter storm tracks(Ropelewski and Halpert 1996).
Figures 2c and 2d show that the California climatestands apart from the national climate: strings of drydays 60 days and longer constitute more than 15% (ac-tually �40% on average) of days during the warm sea-son. However, consideration should be made that in thevalleys where most of the COOP stations are locatedthe warm season can last the entire year. The meanstatewide percentage of Dry90� strings in this state is28% and in some years nearly half of the warm seasonlies within these 3-month-long strings. Considering per-centages of these frequently occurring events goes
against the idea of looking at them for extremes. There-fore, in addition to assessing the frequency of Dry60�strings over the entire southwestern United States (withthe mean occurrence of dry strings of 15% during thepast 55 yr), we analyzed the abridged southwestern re-gion (without California and Nevada). Here, the meanoccurrence of such strings is more rare (7%) and itschanges, therefore, qualify for consideration as changesin extreme events.
b. The driest warm seasons during the past 99 years
The seven driest warm seasons during the past 99years over the eastern United States (since 1908) were1963, 1924, 1953, 2000, 1908, 1939, and 2001 with morethan twofold exceedance of the average regional per-centage of Dry30� episodes (Table 1). While the no-rain episode of 1963 was the most extended during thepast 99 yr, only once during this period (in 2000 and2001) did we observe a sequence of two extraordinary
FIG. 3. Station map and the regional partition selected for this study.
TABLE 1. Seven driest warm seasons during the past 99 yr over the conterminous United States. Partition was defined usingpercentages of 1-month or longer dry episodes (Dry30�) for the eastern United States and 2-month or longer dry episodes (Dry60�)within the warm season for western regions of the country.
EasternUnited States
SouthwesternUnited States
Californiaand Nevada
Arizona, New Mexico,Texas, and Oklahoma
NorthwesternUnited States
Year Dry30� (%) Year Dry60� (%) Year Dry60� (%) Year Dry60� (%) Year Dry60� (%)
dry warm seasons over the eastern United States. In thesouthwestern United States, the driest in the centurywas the warm season of 2002, which also was observedto a slightly lesser degree in the region extending fromCalifornia through Texas. Year 1969 was characterizedas a year with the most expansive no-rain episode in thenorthwestern part of the United States, including theGreat Plains. It is interesting that the instrumental sum-mer Palmer drought severity index (PDSI) (availableonline at http://www.ncdc.noaa.gov/paleo/pdsiyear.html) does not report any unusual dry conditions in thisregion. Generally, the durations of prolonged dry epi-sodes (or their percentage in the warm season) repre-sent new indices of summer dryness and are related toagricultural droughts, and, therefore, it was instructiveto compare these episodes with the most popular indi-ces that characterize droughts. PDSIs (Willeke et al.1994) accumulated in archive (NCDC 2007) were com-pared (to the extent possible) to the extreme charac-teristics of Dry30� and Dry60� indices (includingthose shown in Table 1). We found that, while in mostcases there is a reasonable correspondence, however,these indices are not congruent and may at times bequite different (e.g., in 1969 in the northwestern UnitedStates). For example, this could happen when unusuallyheavy precipitation is followed by a prolonged no-rainperiod and thereafter by another heavy rain event. Thiskind of situation would not trigger a drought conditionin some of the PDSI calculations. These situations maybe of interest in a follow-up study.
4. Results
a. The eastern United States
Changes in the percentage of the warm season occu-pied by prolonged (–one month or longer) dry periodsover the eastern United States for the past 40 yr areshown in Fig. 4. One-month-long dry intervals are in-frequent in the region and on average constitute only1.5% of the warm season duration (over Florida andLouisiana about 3%). During the past 100 years thisduration has not been substantially changed and in thefirst half of the twentieth century it was even somewhathigher than in the second half (although the differenceswere insignificant). However, the situation changedduring the past 40 yr. Figure 4 shows a systematic near-twofold (by 1.0% per 40 yr) increase in the duration ofprolonged (one month and more) no-rain episodes. Tomore clearly describe this change, let us assume thatthese no-rain episodes occur in the area with the 200-day-long warm period (e.g., Washington, D.C., area)and that the duration of dry episodes is exactly 30 days.Then a change from 1% to 2% of the duration of the
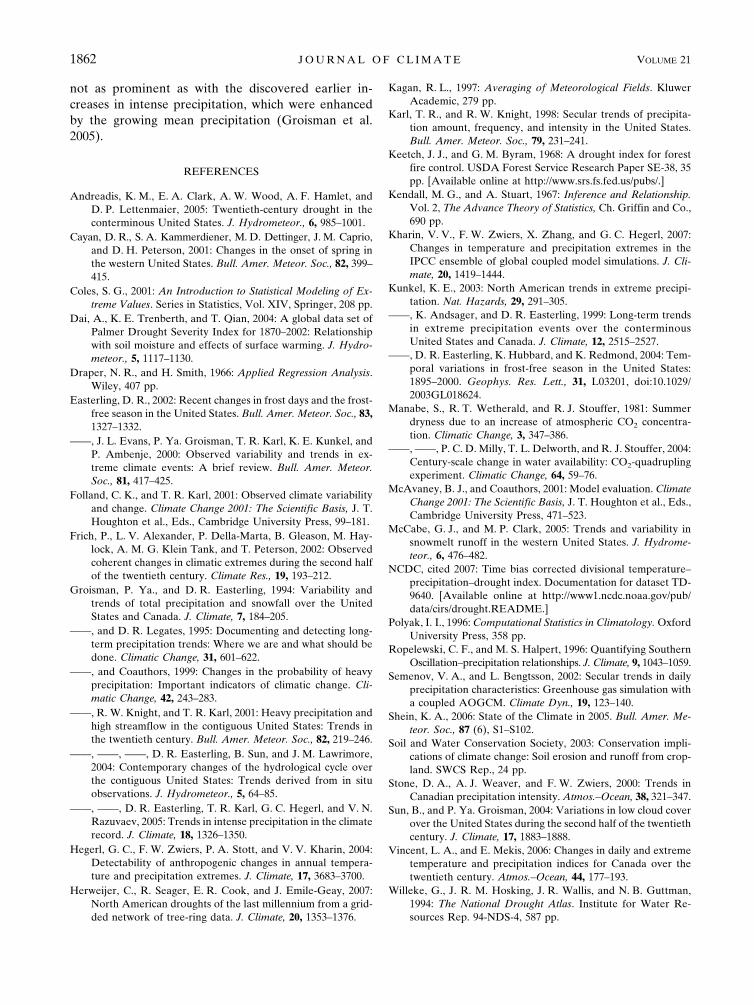
no-rain 30-day-long or longer episodes means that in-stead of a return period of 15 to 20 yr of such episodes(2–3 of them per 40 yr) we are now facing a returnperiod of 6 to 8 yr for such episodes (5–6 of them per 40yr). Our analyses show that during the past 99 yr, wehave not encountered systematic changes in the drydays frequency over the entire eastern United States,but the strings of dry days (in particular month-longstrings of dry days) became more frequent during thepast 40 yr. Furthermore, for this 40-yr period, the se-lections of the beginning of the trend as well as thestring length itself are not of crucial importance for thisconclusion (Table 2).
b. The southwestern United States
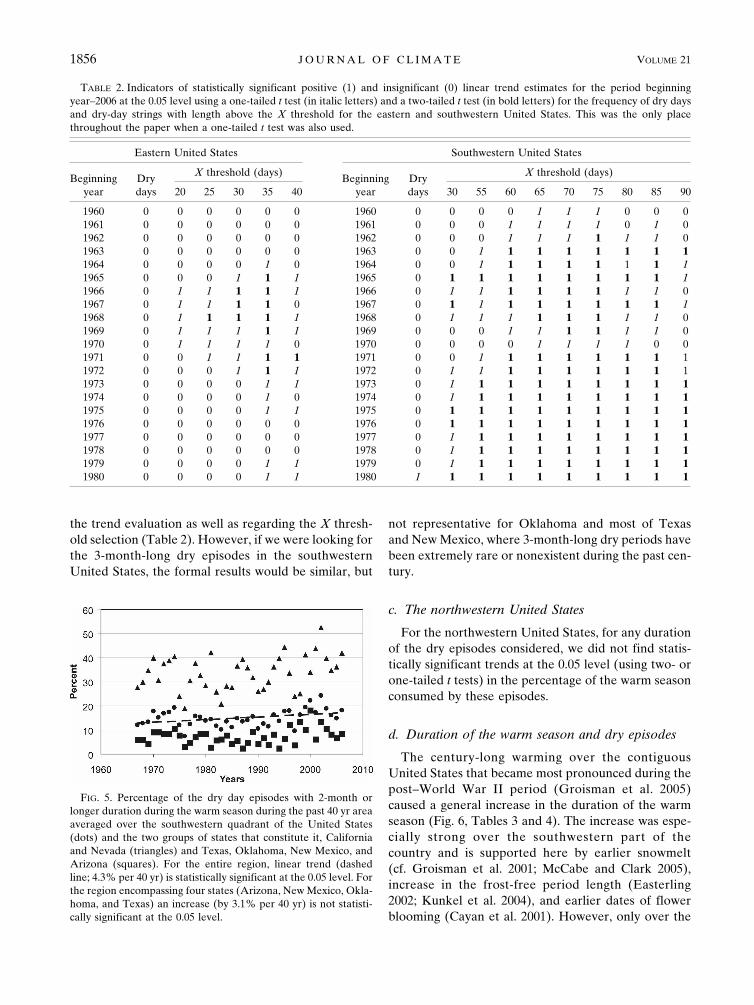
Changes in the duration (in percent of the warm sea-son) of prolonged dry periods 60 or more days withoutrain during the past 40 yr over the southwestern UnitedStates are shown in Fig. 5. The entire region was addi-tionally partitioned into two parts (i) California andNevada and (ii) Arizona, New Mexico, Oklahoma, andTexas because of very different frequencies of pro-longed dry periods (Fig. 2). Taking into account thescale of frequency of occurrence of dry episodes of thiskind, a regionwide increasing trend of 3.6% per 40 yr induration of 2-month or longer periods without rain isobserved in both parts of the southwestern UnitedStates. This change constitutes different relativechanges in California (where on average 40% of thewarm season, or approximately 100 days statewide, be-long to dry episodes 60 days or more) and Oklahoma(�1% of the warm season belonging to such episodes,which occurred on average once in 25 yr during thetwentieth century). Significance of the trends for thepast 40 yr for the southwestern United States is quiterobust regarding the change of the beginning year for
FIG. 4. Percentage of the dry day episodes with 1-month orlonger duration during the warm season during the past 40 yr areaaveraged over the eastern United States. Linear trend (dashedline; 1.1% per 40 yr) is statistically significant at the 0.05 level.
1 MAY 2008 G R O I S M A N A N D K N I G H T 1855
the trend evaluation as well as regarding the X thresh-old selection (Table 2). However, if we were looking forthe 3-month-long dry episodes in the southwesternUnited States, the formal results would be similar, but
not representative for Oklahoma and most of Texasand New Mexico, where 3-month-long dry periods havebeen extremely rare or nonexistent during the past cen-tury.
c. The northwestern United States
For the northwestern United States, for any durationof the dry episodes considered, we did not find statis-tically significant trends at the 0.05 level (using two- orone-tailed t tests) in the percentage of the warm seasonconsumed by these episodes.
d. Duration of the warm season and dry episodes
The century-long warming over the contiguousUnited States that became most pronounced during thepost–World War II period (Groisman et al. 2005)caused a general increase in the duration of the warmseason (Fig. 6, Tables 3 and 4). The increase was espe-cially strong over the southwestern part of thecountry and is supported here by earlier snowmelt(cf. Groisman et al. 2001; McCabe and Clark 2005),increase in the frost-free period length (Easterling2002; Kunkel et al. 2004), and earlier dates of flowerblooming (Cayan et al. 2001). However, only over the
FIG. 5. Percentage of the dry day episodes with 2-month orlonger duration during the warm season during the past 40 yr areaaveraged over the southwestern quadrant of the United States(dots) and the two groups of states that constitute it, Californiaand Nevada (triangles) and Texas, Oklahoma, New Mexico, andArizona (squares). For the entire region, linear trend (dashedline; 4.3% per 40 yr) is statistically significant at the 0.05 level. Forthe region encompassing four states (Arizona, New Mexico, Okla-homa, and Texas) an increase (by 3.1% per 40 yr) is not statisti-cally significant at the 0.05 level.
TABLE 2. Indicators of statistically significant positive (1) and insignificant (0) linear trend estimates for the period beginningyear–2006 at the 0.05 level using a one-tailed t test (in italic letters) and a two-tailed t test (in bold letters) for the frequency of dry daysand dry-day strings with length above the X threshold for the eastern and southwestern United States. This was the only placethroughout the paper when a one-tailed t test was also used.
southwestern United States (and nationwide) werethese increases statistically significant.3 If, instead ofconsidering the percentage of the warm season con-sumed by dry episodes, we take into account their ac-tual duration, the result will not be different. In Table 4,for 1- and 2-month durations of dry episodes during thewarm season, we present statistics for time series of theproduct of mean regional percentage of the dry seasonepisodes, mean regional duration of the warm season,and (in parentheses) direct estimates of regionally av-eraged absolute durations of such episodes.4
5. Discussion
In the above presentation, we focus on the statisticalsignificance of the results. But, how practically signifi-cant are they? Climatology (Table 4) indicates thatDry30� episodes have been quite infrequent in theeastern United States (with a return period of approxi-mately 15 yr forty years ago). But analysis of trendresults in Table 4 shows that “now” the return period ofsuch an event is reduced to 6–7 yr. At the same time,Dry30� episodes in the southwestern United Statesand especially in its westernmost parts, such as Califor-nia, occur each year several times. Therefore, a 20-dayincrease in duration of these events in California andNevada means a 15% increase of the duration of theevents that occupy more than half (55%) of the warmperiod in this part of the nation. For the southwesternUnited States, Dry60� episodes are also not rare.These episodes materialize every second year region-wide and each year in California and Nevada. The ob-served 11- to 12-day increase in duration of these epi-sodes for the Southwest consumes the entire increase inthe warm season duration and causes their return pe-riod to change from 2 yr (40 yr ago) to 1.25 yr “now”(which means every 4 of 5 years).
Contemporary GCM projections of the climatechange in various scenarios of atmospheric compositionchanges over the conterminous United States (e.g.McAvaney et al. 2001; Hegerl et al. 2004; Kharin et al.2007) show (i) a gradual increase in surface air tem-perature with the rate close to that of the NorthernHemisphere, (ii) no significant total precipitationchanges during the next several decades, and (iii) asignificant increase in intense (extreme) precipitation.
3 The Web site “Global Climate at a Glance” (http://www.ncdc.noaa.gov/gcag/gcag.html) indicates that over the entire contermi-nous United States we observe a systematic increase (e.g., Aprilthrough October) in temperatures during the past 40 yr. However,if one is considering only statistically significant results (at 0.1 or0.05 levels), these results will be restricted only to the southwest-ern corner of the United States.
4 Mean regional durations of prolonged dry periods estimateddirectly and as products of DWS � Dry30� (or Dry60�) were notexpected to be exactly the same because (i) durations of the ex-tended dry periods and of the warm period can be correlated and(ii) the day counts having different weights in these two area-averaging procedures. By area averaging the percentages of thevegetation period with prolonged dry episodes, we assignedsmaller weights to lowland and southernmost sites compared tothe mountains and northernmost sites. When area averaging ofactual duration of prolonged dry episodes is made, the sites witha longer vegetation period receive “an advantage” of both alonger vegetation period and a decline in orographic-inducedrainfall. Both approaches are legitimate. In this paper, we havechosen the first approach trying to estimate more carefully theregional percentage of time when evapotranspiration might besuppressed by prolonged dry episodes. The regional duration ofextended dry episodes estimated using the second approach is alsopresented in Table 4 in parentheses (see also section b of theappendix).
FIG. 6. Warm season duration over the conterminous UnitedStates (dots), southwestern United States (filled diamonds), andnorthwestern United States (squares). Linear trends (dashedlines) for the conterminous United States and its southwesternpart are statistically significant at the 0.05 level or above.
TABLE 3. Duration of the warm season defined as the periodwith mean daily temperatures above 5°C over the conterminousUnited States and its southwestern part. Mean values and trendestimates are presented for the 1967–2006 period. All linear trendestimates are statistically significant at the 0.05 or better levels;R 2 is the percent of time series variance described by linear trendand d is days.
Region
Meanvalue(d)
Linear trend duringthe 1967–2006 period
[d (40 yr)�1] [% (40 yr)�1] R2 (%)
ConterminousUnited States
205 5.5 2.7 10
SouthwesternUnited States
245 10.5 4.3 19
Californiaand Nevada
238 15.4 6.5 21
Texas, Oklahoma,New Mexico,and Arizona
252 8.9 3.5 10
1 MAY 2008 G R O I S M A N A N D K N I G H T 1857
All of this together could lead to higher stress on watersupply/demand during the warm season between theextreme rain events. For the northeastern quadrant ofthe United States, there are model indications (e.g.,Semenov and Bengtsson 2002; Groisman et al. 2005)that in the last decades of the twentieth century thisscenario has already materialized (both in the modelrun and in observations). Our analysis shows that dur-ing the past several decades a similar scenario was ob-served over a significant part of the country. It would beof interest (although beyond the scope of this paper) toassess the existing composite of prognostic GCM runsfor their ability to reproduce this feature of the warmseason rainfall distribution dynamics over the nation.
6. Summary
Analyzing the duration of prolonged periods withoutsizeable rainfall during the vegetation period (roughlyapproximated by the threshold �5°C) over the conter-minous United States, we found the following:
• During the past four decades the warm season dura-tion has significantly increased nationwide and overthe southwestern United States (by 3%–4%, respec-tively). The largest increase in the warm season du-ration was observed over California and Nevadawhere it comprised 15 days (or a 6.4% increase dur-ing the past 40 yr).
• During the past four decades the duration of pro-longed dry episodes has significantly increased over
the eastern and southwestern United States in abso-lute numbers (counting the number of days withinsuch dry periods) and as a percentage of the warm“vegetation” period. The changes are interesting be-cause they are observed on the background of therelatively “wet” period around the nation but do notcover the entire country. They are consistent with thenotable change in rainfall rate distribution over thecountry (increase in intense rainfall frequencies whilemean precipitation grows slower) and with modernGCM projections (and nowcast, cf. Groisman et al.2005), of a warmer climate caused by the increase ingreenhouse gases concentration in the atmosphere.
• We presented results based on observations duringthe past several decades only. When we looked forcentury-long tendencies in the quantities described inthis study, we did not see statistically significantsystematic changes toward increase/decrease of theprolonged dry episodes over both the eastern andsouthwestern United States, and the first 60 yr of thetwentieth century were even somewhat drier than thelast 40 yr (Andreadis et al. 2005). The situation issomewhat similar to discovered trends in intenserainfall frequency (Soil and Water Conservation So-ciety 2003; Groisman et al. 2005). We first con-structed the century-long time series that led us todiscover that the main (and the only) signal contain-ing systematic changes in the frequency of prolongeddry episodes is provided by the last decades of ob-servations (cf. section f of the appendix).
TABLE 4. Summary of the linear trend assessment for the conterminous United States from 1967 to 2006: duration of the warm season(DWS) percentages of 1-month or longer dry episodes (Dry30�) and 2-month or longer dry episodes (Dry60�) within the warm season,and duration of the dry episodes estimated as product of DWS � Dry30� (or Dry60�) and directly by area averaging of these durationsat individual stations (estimates are given in parentheses). Trend estimates that are statistically significant at the 0.05 level or better areshown in bold; d is days.
Region
DWS Dry30� DWS � Dry30� Dry60� DWS � Dry60�
Mean(d)
Trend[d (40yr)�1]
Mean(%)
Trend[% (40yr)�1]
Mean(d)
Trend[d (40yr)�1]
Mean(%)
Trend[% (40yr)�1]
Mean(d)
Trend[d (40yr)�1]
Eastern United States 221 4.7 1.5 1.1 3.3 2.6 0.0 — 0.0 —(3.8) (2.9) (0.1) —
Southwestern United States 245 10.5 31 5.1 76 16.1 13.9 4.3 34 12.3(79) (12.6) (38) (11.2)
California and Nevada 238 15.4 54 5.4 129 21.3 31.6 7.5 75 23.1(134) (14.7) (85) (18.7)
Northwestern United States 163 2.7 13 �1.5 21 �2.1 2.7 �1.3 4.4 �2.1(21) (�1.4) (4.7) (�1.8)
1858 J O U R N A L O F C L I M A T E VOLUME 21
• This study provides observational evidence only: itshows what has happened during the past decades.Extrapolation of trends based on empirical estimatesis not a legitimate procedure unless theoretical con-siderations support it. In the discussion, we cite someexamples of expected developments actually ob-served during the past few decades. Speaking aboutthe future, we can state only that the tendencies re-ported in this study do not contradict and (to someextent) support the contemporary GCM projectionsof ongoing climatic changes.
Acknowledgments. NOAA/Climate and GlobalChange Program (Climate Change and Detection Ele-ment) provided support for this study. The thoughtfulrecommendations of three anonymous reviewershelped us to significantly improve the manuscript.
APPENDIX
Description of Technical Details andSupplementary Experiments
This appendix contains descriptions of technical de-tails of the study as well as some justifications forchoices that we made in the design of the processingsystem. Testing different ways to handle missing dataand our decision to use a minimum precipitationthreshold are examples of the choices tested. We solidi-fied the design when it was shown that precautions andadditional testing and experiments were generally invain and did not change the results presented in thepaper.
a. Handling of missing days
A missing day (days) may create havoc in statistics ofuninterrupted strings of dry days. To mitigate this prob-lem, we selected only 4165 stations from the entire setof more than 8000 currently operational U.S. coopera-tive stations network according to the following crite-ria: both station temperature and precipitation musthave a minimum of 83% (25 yr) of nonmissing dataduring the reference period 1961–90. For precipitationwe used a very strict missing day tolerance: if the totalannual missing day count was greater than five, the yearwas not used. Thereafter, we eased this requirementand repeated our calculations keeping the station datafor each year if the total annual missing day count wasless than 20. However, in these relaxed conditions of anotable amount of missing data we allow the count pro-cessing of no-rain day duration to be suspended tem-
porarily if one missing day is encountered and there-after continue the tally until the next rain day. Thismodification allowed us to (i) substantially increase thenumber of years with valid data at the stations used inour analyses, thus reducing the noise level of the area-averaged time series, and (ii) receive practically identi-cal results when we used strict and relaxed missing daytolerance criteria. By definition, accumulated data willalways be preceded by one or more missing days in thedata file. This could cause a detrimental effect by elimi-nating many years. However, in a separate study usinga similar dataset we found that out of the 153 millionobservations checked, only 0.29% were accumulations.
b. Summary of mean duration of dry day episodesversus a percentage of dry day episodes in thewarm season
To characterize regional dry day episodes extent, wearea averaged the percentages of these episode dura-tions within the individual warm seasons (Dry30� andDry60�) and thereafter multiplied them by the region-ally averaged duration of the warm season. But, it waspossible to area-average absolute values of day countsin these episodes directly. We used both approachesand compared them (Fig. A1). The resulting time seriescorrelated extremely well with R2 � 0.98 for the easternUnited States and 0.95 for the southwestern UnitedStates. In both regions, we found only some systematicbiases that arise due to different weights of the area
FIG. A1. Southwestern United States. Dry60� episode dura-tions estimated using area-averaged absolute values of day countsin these episodes directly and using the product of area-averagedpercentage of the dry days within these episodes and the warmseason duration: R2 � 0.95. Systematic difference (bias) � 3.4 days.
1 MAY 2008 G R O I S M A N A N D K N I G H T 1859
averaging (see footnote 4). Except for this difference,the results after area averaging brought us to the sameconclusions.
c. Selection of the “sizeable rain” threshold
One of the physical reasons to ignore small dailyrainfall totals in assessment of the dry episode length isthat a small amount of rain either does not reach thesoil (stays on and evaporates from the vegetation) ordoes not replenish soil moisture. In the calculation ofthe most popular index of forest fire danger, theKeetch–Byram drought index (KBDI), the first 5 mm(0.2 in.) of each rain event are ignored and do not affectthe KBDI values (Keetch and Byram 1968). However,there also exists an “observational” reason to skip thedaily “drizzle totals”: throughout the history of manynational networks these totals are not observed consis-tently. This was observed first at the Norwegian net-work, when letters of appreciation sent by the NationalMeteorological Service to observers caused a doublingof the number of 0.1-mm precipitation reports nation-wide (Groisman et al. 1999). In the countries whereaccuracy of observations was changed throughout time(e.g., Russia and Canada), the lowest “nonzero” pre-cipitation amounts might be assigned to “traces” or tomeasurable amounts depending upon changes of thegauge resolution and/or observational practice (Stoneet al. 2000; Groisman et al. 1999). Ignoring this mattermay lead to “discoveries” of nationwide “statisticallysignificant” trends in each part of the country in fre-quency of precipitation that are not real but are a resultof switching—let’s say from British to metric rainfallreporting (e.g., Frich et al. 2002; Vincent and Mekis
2006). During the past 100 years, the U.S. cooperativenetwork has measured precipitation with the samegauges, 8-in. nonrecording rain gauges with an accuracyof (and increments in) observations equal to 0.01 inch(0.254 mm). However, even this network was impactedthroughout time because the percentage of ignoredsmall precipitation events changed with time (Fig. A2).This figure presents the nationally averaged counts ofprecipitation events between 0 and 0.5 mm and be-tween 0.5 and 1 mm during the past 99 yr (since thebeginning year when we are comfortable presentingsuch averages, 1908). It shows that the reporting of thelowest nonzero precipitation (0.01 in. � 0.254 mm) hasnever been stable during the entire twentieth century(their number steadily grows from 6 to 13 yr�1). Fur-thermore, the reporting of the next nonzero increments(0.02 and 0.03 in.) stabilized only after 1948, when thefirst digital archives were introduced, but prior to theseyears they were also reported less frequently. Duringthe 1961–90 period on average, there were 88 days withnonzero precipitation nationwide and �19 of them(22%) reported from 0.01 to 0.03 in. of precipitation. Inthe beginning of the twentieth century, these numberswere close to 11 days and 100 years later exceed the20-days threshold, that is, nearly doubled. Therefore,when focusing on the changes in precipitation fre-quency, we (as in Groisman et al. 1999) selected 1 mmas a safe threshold to start our data analyses.
d. Experiments with different X thresholds andbeginning year of the trend estimates
There were no magic numbers, for example, 30 and60 days, when we selected X thresholds to present theresults for strings of days without sizeable rain. There-fore, we varied X values in broad boundaries. Also, weselected 40 yr (instead of 37, which is the start year1970) just for convenience of rounding. But, we alsotested the robustness of our results against these arbi-trary choices. Table 2 presents the summary of thesetests and shows that an exact selection of X and/or thebeginning year for the linear trend calculations is not soimportant for the statements about increases in dura-tion of prolonged dry episodes during the past severaldecades over the eastern and southwestern UnitedStates to hold. There are quite broad windows of Xthresholds and “beginning” years when the trends inthe duration are positive and statistically significantlydifferent from zero at the 0.05 level in two-tailed and/orone-tailed statistical testing. For the past 50 yr, statisti-cally significant negative trends were never encoun-tered in prolonged dry episodes over the conterminousUnited States. Table 2 also shows that the trends in
FIG. A2. Mean number of days with nonzero very light daily pre-cipitation over the conterminous United States. Days with non-zero daily precipitation below 0.5 mm (dots) and days with dailyprecipitation in the range of 0.5 and 1 mm (filled diamonds).
1860 J O U R N A L O F C L I M A T E VOLUME 21
counts of dry days have never been statistically signif-icant at the 0.05 level during the past 50 yr for bothregions, the eastern and southwestern United States, nomatter which beginning year was selected. This remainsthe case for the northwestern United States too.
e. Distribution of mean duration of dry dayepisodes above the X threshold
If the X threshold is sufficiently high and the regionwhere we are analyzing dry episodes is spatially homo-geneous, the duration of dry day episodes above the Xthreshold should be distributed according to “general-ized Pareto” distribution (Coles 2001). However, theregions that we are assessing cannot be considered as“homogeneous” (cf. Oklahoma and California orMaine and Florida) and it is difficult to select a “suffi-ciently high” X threshold in the southwestern UnitedStates. Therefore, the distribution of duration of ex-tended dry day episodes above the X threshold can(and do) behave differently. Figure A3 shows these dis-tributions for the eastern United States (30-day orlonger dry episodes) and for the southwestern UnitedStates (60-day or longer episodes). This figure showsthat, while it is extremely rare to encounter a 2-month-long no-rain episode at the stations of the easternUnited States (only 5 cases during the past 40 yr in thesample of �1400 stations), at the 750 stations of thesouthwestern United States, 4-month-long, no-rain epi-sodes number in the hundreds.
f. Assessment of century-long time series ofprolonged dry episodes
The dense network of meteorological stations acrossthe conterminous United States allowed us to constructa near-century-long time series of Dry30� and Dry60�episodes across the country for the 1908–2006 period
(not shown). Analyses of these time series clearly showthat
• on a century time scale there were no systematicchanges in the duration of these episodes,
• there were years (cf. Table 1) when the prolongedno-rain intervals were more widespread across theeastern United States prior to 1967 than in the 2000s,and
• in the southwestern and northwestern United Stateson average in the pre-1967 period Dry60� episodeswere slightly (i.e., statistically insignificant at the 0.05level) more widespread than in the past 40 yr.
But, the trend assessment of these century-long timeseries shows that (i) whichever 40-yr-long period duringthe period of instrumental observations since 1908 and(ii) whichever interval YB-2006 (where YB is a begin-ning year) is selected, only in the last periods of 40�years are there statistically significant systematicchanges within two of these regions (cf. Table 2). Willthese changes continue and, if so, what is their attribu-tion? These are legitimate questions but they should beaddressed to climate modelers. We simply show thatthey have happened and would strongly argue that thequantity that we have assessed is of real practical im-portance, its increase may result in hazardous hydro-meteorological conditions and, therefore, tendenciesrevealed in the past several decades are worthy of in-terest. We see a systematic change that coincides intime with a change in frequency of intense precipitationand with an increase in mean precipitation. It is notcontradictory with GCM projections of changes in rain-fall frequencies [e.g., Semenov and Bengtsson (2002)for the northeastern quadrant of the United States] but,because of a simultaneous increase in precipitation [7%per 100 yr across the conterminous United States(Groisman et al. 2004)], the observed tendencies are
FIG. A3. Distribution function of prolonged dry episode durations �30 (eastern United States) and �60 days(southwestern United States).
1 MAY 2008 G R O I S M A N A N D K N I G H T 1861
not as prominent as with the discovered earlier in-creases in intense precipitation, which were enhancedby the growing mean precipitation (Groisman et al.2005).
REFERENCES
Andreadis, K. M., E. A. Clark, A. W. Wood, A. F. Hamlet, andD. P. Lettenmaier, 2005: Twentieth-century drought in theconterminous United States. J. Hydrometeor., 6, 985–1001.
Cayan, D. R., S. A. Kammerdiener, M. D. Dettinger, J. M. Caprio,and D. H. Peterson, 2001: Changes in the onset of spring inthe western United States. Bull. Amer. Meteor. Soc., 82, 399–415.
Coles, S. G., 2001: An Introduction to Statistical Modeling of Ex-treme Values. Series in Statistics, Vol. XIV, Springer, 208 pp.
Dai, A., K. E. Trenberth, and T. Qian, 2004: A global data set ofPalmer Drought Severity Index for 1870–2002: Relationshipwith soil moisture and effects of surface warming. J. Hydro-meteor., 5, 1117–1130.
Draper, N. R., and H. Smith, 1966: Applied Regression Analysis.Wiley, 407 pp.
Easterling, D. R., 2002: Recent changes in frost days and the frost-free season in the United States. Bull. Amer. Meteor. Soc., 83,1327–1332.
——, J. L. Evans, P. Ya. Groisman, T. R. Karl, K. E. Kunkel, andP. Ambenje, 2000: Observed variability and trends in ex-treme climate events: A brief review. Bull. Amer. Meteor.Soc., 81, 417–425.
Folland, C. K., and T. R. Karl, 2001: Observed climate variabilityand change. Climate Change 2001: The Scientific Basis, J. T.Houghton et al., Eds., Cambridge University Press, 99–181.
Frich, P., L. V. Alexander, P. Della-Marta, B. Gleason, M. Hay-lock, A. M. G. Klein Tank, and T. Peterson, 2002: Observedcoherent changes in climatic extremes during the second halfof the twentieth century. Climate Res., 19, 193–212.
Groisman, P. Ya., and D. R. Easterling, 1994: Variability andtrends of total precipitation and snowfall over the UnitedStates and Canada. J. Climate, 7, 184–205.
——, and D. R. Legates, 1995: Documenting and detecting long-term precipitation trends: Where we are and what should bedone. Climatic Change, 31, 601–622.
——, and Coauthors, 1999: Changes in the probability of heavyprecipitation: Important indicators of climatic change. Cli-matic Change, 42, 243–283.
——, R. W. Knight, and T. R. Karl, 2001: Heavy precipitation andhigh streamflow in the contiguous United States: Trends inthe twentieth century. Bull. Amer. Meteor. Soc., 82, 219–246.
——, ——, ——, D. R. Easterling, B. Sun, and J. M. Lawrimore,2004: Contemporary changes of the hydrological cycle overthe contiguous United States: Trends derived from in situobservations. J. Hydrometeor., 5, 64–85.
——, ——, D. R. Easterling, T. R. Karl, G. C. Hegerl, and V. N.Razuvaev, 2005: Trends in intense precipitation in the climaterecord. J. Climate, 18, 1326–1350.
Hegerl, G. C., F. W. Zwiers, P. A. Stott, and V. V. Kharin, 2004:Detectability of anthropogenic changes in annual tempera-ture and precipitation extremes. J. Climate, 17, 3683–3700.
Herweijer, C., R. Seager, E. R. Cook, and J. Emile-Geay, 2007:North American droughts of the last millennium from a grid-ded network of tree-ring data. J. Climate, 20, 1353–1376.
Kagan, R. L., 1997: Averaging of Meteorological Fields. KluwerAcademic, 279 pp.
Karl, T. R., and R. W. Knight, 1998: Secular trends of precipita-tion amount, frequency, and intensity in the United States.Bull. Amer. Meteor. Soc., 79, 231–241.
Keetch, J. J., and G. M. Byram, 1968: A drought index for forestfire control. USDA Forest Service Research Paper SE-38, 35pp. [Available online at http://www.srs.fs.fed.us/pubs/.]
Kendall, M. G., and A. Stuart, 1967: Inference and Relationship.Vol. 2, The Advance Theory of Statistics, Ch. Griffin and Co.,690 pp.
Kharin, V. V., F. W. Zwiers, X. Zhang, and G. C. Hegerl, 2007:Changes in temperature and precipitation extremes in theIPCC ensemble of global coupled model simulations. J. Cli-mate, 20, 1419–1444.
Kunkel, K. E., 2003: North American trends in extreme precipi-tation. Nat. Hazards, 29, 291–305.
——, K. Andsager, and D. R. Easterling, 1999: Long-term trendsin extreme precipitation events over the conterminousUnited States and Canada. J. Climate, 12, 2515–2527.
——, D. R. Easterling, K. Hubbard, and K. Redmond, 2004: Tem-poral variations in frost-free season in the United States:1895–2000. Geophys. Res. Lett., 31, L03201, doi:10.1029/2003GL018624.
Manabe, S., R. T. Wetherald, and R. J. Stouffer, 1981: Summerdryness due to an increase of atmospheric CO2 concentra-tion. Climatic Change, 3, 347–386.
——, ——, P. C. D. Milly, T. L. Delworth, and R. J. Stouffer, 2004:Century-scale change in water availability: CO2-quadruplingexperiment. Climatic Change, 64, 59–76.
McAvaney, B. J., and Coauthors, 2001: Model evaluation. ClimateChange 2001: The Scientific Basis, J. T. Houghton et al., Eds.,Cambridge University Press, 471–523.
McCabe, G. J., and M. P. Clark, 2005: Trends and variability insnowmelt runoff in the western United States. J. Hydrome-teor., 6, 476–482.
NCDC, cited 2007: Time bias corrected divisional temperature–precipitation–drought index. Documentation for dataset TD-9640. [Available online at http://www1.ncdc.noaa.gov/pub/data/cirs/drought.README.]
Polyak, I. I., 1996: Computational Statistics in Climatology. OxfordUniversity Press, 358 pp.
Ropelewski, C. F., and M. S. Halpert, 1996: Quantifying SouthernOscillation–precipitation relationships. J. Climate, 9, 1043–1059.
Semenov, V. A., and L. Bengtsson, 2002: Secular trends in dailyprecipitation characteristics: Greenhouse gas simulation witha coupled AOGCM. Climate Dyn., 19, 123–140.
Shein, K. A., 2006: State of the Climate in 2005. Bull. Amer. Me-teor. Soc., 87 (6), S1–S102.
Soil and Water Conservation Society, 2003: Conservation impli-cations of climate change: Soil erosion and runoff from crop-land. SWCS Rep., 24 pp.
Stone, D. A., A. J. Weaver, and F. W. Zwiers, 2000: Trends inCanadian precipitation intensity. Atmos.–Ocean, 38, 321–347.
Sun, B., and P. Ya. Groisman, 2004: Variations in low cloud coverover the United States during the second half of the twentiethcentury. J. Climate, 17, 1883–1888.
Vincent, L. A., and E. Mekis, 2006: Changes in daily and extremetemperature and precipitation indices for Canada over thetwentieth century. Atmos.–Ocean, 44, 177–193.
Willeke, G., J. R. M. Hosking, J. R. Wallis, and N. B. Guttman,1994: The National Drought Atlas. Institute for Water Re-sources Rep. 94-NDS-4, 587 pp.