12


Brian GautreauSales Engineer – NGINX Inc.
NGINX Plus, Kubernetes & Prometheus Gain insights into your N+ Ingress Controller
NGINX Plus and the Ingress Controller
NGINX Plus API
Prometheus, Prometheus Exporter, Grafana
Demo
1
2
3
4
Agenda
Q&A5

NGINX Plus, Kubernetes, Prometheus and Grafana
�4
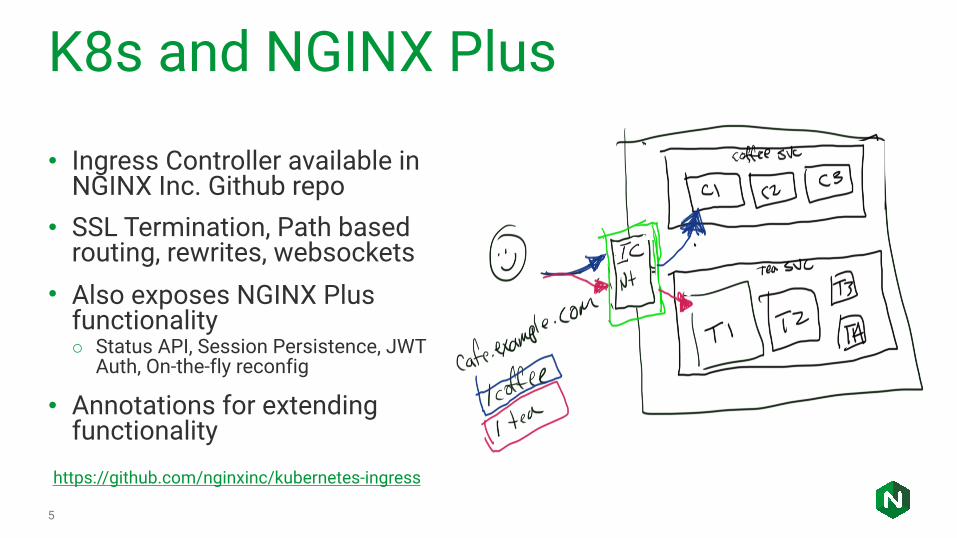
K8s and NGINX Plus
�5
• Ingress Controller available in NGINX Inc. Github repo
• SSL Termination, Path based routing, rewrites, websockets
• Also exposes NGINX Plus functionality ◦ Status API, Session Persistence, JWT
Auth, On-the-fly reconfig
• Annotations for extending functionality
https://github.com/nginxinc/kubernetes-ingress

NGINX Plus API
�6
• Over 150 metrics ◦ HTTP and Stream ◦ Server blocks ◦ Upstreams ◦ Cache Instrumentation ◦ Memory zone utilization
• Read/Write(able)
http://nginx.org/en/docs/http/ngx_http_api_module.html

Prometheus Metrics
�7
• Stores time based metrics • Easy to query, filter
and extract • Scrapes data from
instances • Aggregate multiple
sources of data
https://prometheus.io/

NGINX Prometheus Exporter
�8
• Converts the API status into Prometheus consumable data
• Written in GO • Exposes metrics such as: ◦ Status codes ◦ Connection counts ◦ Upstreams status ◦ Server zone status
• Automatic discovery with Prometheus Annotations
https://github.com/nginxinc/nginx-prometheus-exporter

Grafana Dashboards
�9
• Powerful WebUI for data accessing and visualizing datasources
• Customize dashboards for meaningful reports
• Report on NGINX uptime, health, throughput etc.
https://grafana.com/

Demo Time
�10

Q & A
�11


