63
PROMOTING BIOGAS SYSTEMS IN KENYA A Feasibility Study October 2007 Prepared on behalf of Biogas for Better Life An African Initiative Commissioned by Shell Foundation Conducted by ETC Group
PROMOTING BIOGAS SYSTEMS IN KENYA A Feasibility Study
October 2007
Prepared on behalf of Biogas for Better Life An African Initiative
Commissioned by Shell Foundation
Conducted by ETC Group

Kenya Biogas Feasibility Study Page 2
B I O G A S F O R B E T T E R L I F E , A N A F R I C A N I N I T I A T I V E
Credits and disclaimer
The feasibility study on promoting biogas systems in Kenya was commissioned and funded by the SHELL Foundation.
The feasibility study was managed by ETC UK, in collaboration with ETC Energy, ETC East Africa, and IT Power, Nairobi. The following people were directly involved in the study; Ashington Ngigi, Bell Okello, Floice Adoyo, Frank van der Vleuten, Fred Muchena, Leanne Wilson (project coordinator), Rene Magermans.
Special thanks go to all people that accepted to be interviewed as part of the study. The team also wishes to acknowledge the support as well as professional comments and guidance received from the Shell Foundation and the Biogas for a Better Life Initiative.
The views and interpretations expressed in this document are not necessarily those of the Shell Foundation, Government of Kenya or any other official organisation that has contributed to this document. The consultant team is responsible for the views expressed, as well as for all conclusions and any errors.

Table of Contents EXECUTIVE SUMMARY ............................................................................................................. 1 1. CONTEXT FOR BIOGAS SYSTEMS IN KENYA .............................................................. 3
1.1 Introduction ....................................................................................................... 3 1.2 Energy consumption and sources of energy ..................................................... 3 1.3 History of biogas in Kenya ............................................................................... 4 1.4 Policy context.................................................................................................... 5 1.5 Challenges to the use of biogas ......................................................................... 5 1.6 Study approach and rationale of selecting study sites ....................................... 7
2. INSTITUTIONAL MAPPING AND OVERVIEW OF STAKEHOLDERS ......................... 7 2.1. Institutional mapping ........................................................................................ 7 2.2 Description of key players ................................................................................ 8 2.3 SWOT of present market ................................................................................. 22
3. BIOGAS TECHNOLOGIES IN KENYA ............................................................................... 25 3.1 Types of technology ........................................................................................ 25 3.2 Technical issues – research and development ................................................ 28
4. UNDERSTANDING THE CUSTOMER ............................................................................. 29 4.1 Introduction and methodology ........................................................................ 29 4.2 Approximate size of the potential market ........................................................ 34 4.3 Factors to potentially drive biogas technology ................................................ 36
5. MARKETING AND FINANCIAL ANALYSIS ..................................................................... 38 5.1 Introduction ...................................................................................................... 38 5.2 Product-market combinations .......................................................................... 38 5.3 Prices ................................................................................................................ 40 5.4 Financing.......................................................................................................... 42 5.5 Present status of market ................................................................................... 42 5.6 Biogas marketing objectives ............................................................................ 43 5.7 Biogas marketing strategy development .......................................................... 47 5.8 Organisation of the approach ........................................................................... 48 5.9 Elaboration of capacity strategy ....................................................................... 50 5.10 Elaboration of demand strategy ..................................................................... 51 5.11 Elaboration of control strategy....................................................................... 52 5.12 Testing of Feasibility .................................................................................... 54 5.13 Economic simulation ..................................................................................... 56 5.14 Sensitivity analyses – subsidies and grants .................................................... 57 5.15 Conclusion ..................................................................................................... 58
7. CONCLUSIONS AND RECOMMENDATIONS .................................................................. 59 8. Annexes ...................................................................................................................................... 60
Annex 1: Names and Abbreviations ...................................................................... 60 Annex 2: Desk Study ............................................................................................. 60 Annex 3: District Reports ...................................................................................... 60

Kenya Biogas Feasibility Study Page 1
B I O G A S F O R B E T T E R L I F E , A N A F R I C A N I N I T I A T I V E
EXECUTIVE SUMMARY This report, commissioned by The Shell Foundation, is one of a series of country feasibility studies promoted by the “Biogas for Better Life: An African Initiative”. It analyses the opportunities and constraints on biogas development in Kenya. The study provides a history of biogas in Kenya and overviews three biogas technologies, the floating drum, fixed dome, and plastic tubular digesters. The feasibility of biogas promotion is explored in relation to existing and potential biogas consumers. Most households who have 2 or more cattle under zero grazing, or 4 or more cattle under semi zero grazing are technically eligible to benefit from biogas technology. There is technical potential for domestic biogas in at least 35 districts in Kenya. The highest potential areas are in Nyanza, Western, and Central provinces, with more limited scope in parts of Rift Valley and Eastern provinces. Wood fuel scarcity, increasing energy costs and pressure for land in the high potential districts mean that the benefits of biogas are becoming more apparent to eligible households. It is recommended that biogas promotion focus on five high potential districts – Kakemega, Kiambu, Kisii, Nakuru, and Nyandarua - that have a combined technical potential of up to 38,000 biogas units. The use of biogas can contribute towards achieving each of the Millennium Development Goals. Biogas is a unique energy technology because it offers multifunctional and simultaneous benefits in public health, agricultural productivity, environmental sustainability and economic development. There is potential to develop a biogas market in Kenya. There are several institutions currently working on biogas. The cost of installing a 16m3 fixed dome biogas system starts from €7131. The financial and institutional analysis demonstrates the relatively unattractive investment framework for individual farmers for the current product market combinations of 16m3 biogas systems, though concludes that scaling up the volumes sold per biogas company and building smaller systems will make investment more attractive. Economic growth in Kenya is being felt at the grassroots level. Due to increasing purchasing power, there is scope for biogas to become a mainstream technology. There are several financial products currently available for households wishing to invest in biogas through stable and credible institutions such as KUSCCO, and a range of microfinance institutions who are able to offer non-biogas specific financial products. Affordability, accessibility of fuel, functionality and aesthetics are the primary factors considered by people in the choice of cooking device bought and used. Biogas has been a proven technology in Kenya, promoted since the 1950s, but despite this, there is a general lack of awareness of the relevance of biogas technology at household level. Floating drum biogas systems were initially promoted in Kenya as generating high quality fertiliser, and later as an alternative energy source after the energy crises of the late 1970s (through Tunnel Technology, and the Special Energy Programme). Fixed dome systems have advantages in terms of cost (including maintenance), space, and
1 Based on the exchange rate of €1= 92 Kenyan Shillings

Kenya Biogas Feasibility Study Page 2
B I O G A S F O R B E T T E R L I F E , A N A F R I C A N I N I T I A T I V E
aesthetic appeal relative to floating drum systems. Both types of systems are proven in Kenya, though currently, there are not enough technicians trained on the construction of fixed dome biogas systems, and quality controls and after sales support are fragmented and variable. It is recommended that initially the promotion of fixed dome systems is supported. The marketing plan specifies the volume of training and support necessary to support companies to actively promote biogas in Kenya through a biogas support office. The cost of this training and support is estimated to be €378 per technician trained.

Kenya Biogas Feasibility Study Page 3
B I O G A S F O R B E T T E R L I F E , A N A F R I C A N I N I T I A T I V E
1. CONTEXT FOR BIOGAS SYSTEMS IN KENYA
1.1 Introduction Kenya’s overall national development objectives are accelerated economic growth, through increased productivity and enhanced agricultural and industrial production, thereby increasing employment opportunities, an equitable distribution of income, and reduction of poverty2. The realization of these objectives requires, amongst others, that quality energy services are available in a sustainable, cost-effective and affordable manner to people.
The level and intensity of use of commercial energy is a key indicator of economic growth and development. In Kenya, this is currently low and calls for intensified action for the development and use of energy services that are reliable, affordable, and readily available to the majority who are or want to be participants in the economy. The five major categories of energy sources in Kenya are biomass, fossil fuels, electricity, solar and wind, all of which are at different levels of exploitation. This report focuses on biogas as a multifunctional renewable energy source.
1.2 Energy consumption and sources of energy At national level, biomass (mostly wood fuel) accounts for about 68 percent of the total primary energy consumption, followed by petroleum at 22 percent, electricity at 9 percent and others at about less than 1 percent. In rural areas, the reliance on biomass is over 80 percent3. Only approximately 15 percent of Kenyans have access to grid electricity. Access to affordable modern energy services is constrained by a combination of low consumer incomes and high costs. In the rural areas where only about 4 percent of the population has access to electricity, the scattered nature of human settlements further escalates distribution costs and reduces accessibility.
The majority of Kenyans live in rural areas where traditional biomass (mainly wood fuel) has remained the leading source of energy (both for cooking, and at times for lighting). However, the potential of biomass has not been effectively utilised in the provision of modern energy for a variety of reasons. One is the failure to exploit the opportunities for transforming wastes from agricultural production and processing into locally produced modern energy. High incidence of poverty is another constraint to shift from traditional to modern biomass energy utilisation.
Continued over-dependence on unsustainable wood fuel and other forms of biomass as the primary sources of energy to meet household energy needs has contributed to uncontrolled harvesting of trees and shrubs with negative impacts on the environment (deforestation). Environmental degradation is further exacerbated by climate variability and unpredictability of rainfall patterns. In addition, continued consumption of traditional biomass fuels contributes to poor health among users due to excessive products of incomplete combustion and smoke emissions in the poorly ventilated houses common in rural areas. Biogas is an energy technology that has the potential to counteract many adverse health and environmental impacts connected
2 Economic Recovery Strategy for Wealth and Employment Creation, 2003 – 2007, Government of Kenya 2003 3 Session Paper No. 4 of 2004 on Energy, Ministry of Energy, October 2004; State of Environment Report Kenya 2004.
Land Use and Environment, NEMA, 2005

Kenya Biogas Feasibility Study Page 4
B I O G A S F O R B E T T E R L I F E , A N A F R I C A N I N I T I A T I V E
with traditional biomass energy in Kenya. The purpose of this study is to assess the feasibility of promoting biogas in Kenya.
1.3 History of biogas in Kenya Mr. Tim Hutchinson built the first biogas digester in Kenya in 1957. This provided all of the gas and fertiliser that his coffee farm needed. He found the effluent (or “sludge”) an excellent fertiliser and that its application to his coffee trees greatly improved productivity. In 1958, he started constructing biogas digesters commercially, marketing the effluent as the main product with biogas as a useful by-product.
Between 1960 and 1986, Hutchinson’s company (called Tunnel Engineering Ltd.) sold more than 130 small biogas units and 30 larger units all over the country. Hutchinson biogas digesters (some still working after fifty years) can be found in various parts of Kenya, although mainly in the so-called high productive areas (Central and Western Kenya). Mr Hutchinson is retired, though still manufactures solar water heaters, and a limited number of biogas units.
The German development organisation GTZ started promoting biogas in the middle to late 1980s in Kenya, in collaboration with the Ministry of Energy under the Special Energy Programme. In Kenya, the Special Energy Programme opted for the floating drum type, possibly because there was local steel manufacturing capacity. Approximately 400 biogas units were built under the Special Energy Programme directly, though it is likely that the training and promotional activity spurred entrepreneur masons to build on an individual basis.
Over the last fifty years, biogas technology has been promoted by national and international organisations (both Government and NGO) and they, together with trained Kenyan technicians have built hundreds of biogas digesters in the country. However, earlier evaluations showed that, unfortunately, a high proportion of digesters appear to operate below capacity, are dormant or in disuse after construction because of management, technical, socio-cultural and economic problems (Box 1).4
Box 1: Why biogas projects failed
• Poor maintenance: Digesters are built without proper explanation to users on how to care for them. In other cases people simply stop maintaining them, especially the repair of the gasholder.
• Poor dissemination strategy by promoters: Biogas demonstrations are carried out with little or no digester research and development to understand quality and end use issues.
• Poor planning and monitoring by promoters: It is important to consider why one is building a biogas digester. Both gas and fertiliser are by-products of biogas digesters. If there is no use for the fertiliser produced, then much money and work will have been spent to collect a comparatively small amount of gas. Before building, one must be sure there is enough organic material and water to “feed” the digester. Biogas digesters often fail because of shortages of water or feedstock. Remember, biogas digesters are methane gas producing fertiliser plants as well as sanitation aids. Many bags of charcoal can be bought for the money it takes to build one biogas digester.
• Poor construction or design leading to gas pressure problems: Many people have seen working biogas digesters and attempted to build their own. However, biogas digesters are not as simple as they look. They must be properly designed and constructed. If an unqualified person attempts to build a digester, he will probably run into problems. People have been trained to build biogas
4 See also Gitonga, S. 1997. Biogas promotion in Kenya. A review of experience. ITDG Publishing, London GTZ, 1999. Biogas Digest: Biogas-Country Reports. Volume 4. Project Information and Advisory Service on
Appropriate Technology (ISAT), GTZ

Kenya Biogas Feasibility Study Page 5
B I O G A S F O R B E T T E R L I F E , A N A F R I C A N I N I T I A T I V E
digesters in Kenya and interested farmers should enlist the help of the qualified biogas constructors. Farmers should also be educated on proper utilization of biogas and pros and cons of incorrect application of equipment.
• Acceptance problem: The re-charging of the digester may be seen as a dirty job and hence leads to poor ownership responsibility by users. This is especially in the case of sanitation.
Source : Adapted from Hankins, M., 1987. Renewable energy in Kenya. Motif Creative Arts Ltd., Nairobi, pp. 83.
Consequently, biogas technology has acquired a less favourable reputation and the penetration rate of biogas technology in the country remains very low. It is estimated that up to 2000 units have been installed in total, though it is impossible to estimate what percent remain in working condition due to the dispersed and sometimes uncontrolled and informal nature of installations. The majority of systems were installed in the 1980s and 1990s.
1.4 Policy context The first attempt to prepare a policy paper on energy was made in 1987, to, among other things, mitigate the adverse effects of oil importation on the domestic economy and balance of payments and the need to have a consistent policy on energy to ensure security of supply, efficient but affordable pricing and accelerated development of indigenous resources including the search for domestic fossil fuels.
New challenges associated with liberalization of the economy in the 1990s, including deteriorating balance of payments, economic stagnation, rising population, rising poverty, electricity rationing and outages, dwindling official development assistance, deforestation and the recently observed phenomenon of climate change called for a new energy sector development strategy based on prudent integrated policies consistent with broader government policies on socio-economic development.
In keeping with the Government’s Economic Recovery Strategy for Employment and Wealth Creation, the Session Paper No. 4 of 2004 on Energy was developed spelling out the Government’s aspirations towards provision of quality, adequate, sustainable, cost-effective and affordable energy services for socio-economic growth. The Session Paper points out that despite the potential benefits of biogas, the penetration rate of biogas technology is still very low and attributes this to poor management, high initial capital costs, high maintenance costs5, limited water supply and weak technical support.
The Energy Act 2006 has provisions for promotion of renewable energy, which includes biogas. However, the necessary legal and regulatory framework for biogas still needs to be put in place. Some of the biogas companies have come together to form a biogas installers network, which intends to collaborate with the Ministry of Trade and the Kenyan Bureau of Standards to develop standards and ensure that members operations conform to these standards.
1.5 Challenges to the use of biogas Biogas technology has been actively promoted in Kenya since early 1980s. However, despite this and the apparent potential, technology uptake has been slow. The study
5 According to Sessional Paper No. 4 of 2004 on Energy (page16) one of the main problems impeding high penetration of
biogas technology is “high maintenance costs”, however, from discussions with various stakeholders there seems to be a perception that financial maintenance costs for biogas are low, though labour costs may be high.

Kenya Biogas Feasibility Study Page 6
B I O G A S F O R B E T T E R L I F E , A N A F R I C A N I N I T I A T I V E
team identified several challenges facing the promotion and uptake of biogas technology. The key challenges include: • High costs of installing the systems: Installing any biogas technology in Kenya
is expensive. The market for biogas technology is limited to those who can afford other sources of modern energy such LPG. Approximate costs of LPG include €55 for a cooker, €65 for a 15kg cylinder, then €14-15 per refill plus transportation expenses which were around €1.30 per round trip in Kisii Central in a minibus taxi. A 15kg cylinder can last about a month, if used only for tea and light meals.
• Currently, there is a lack of capacity to install high volumes of biogas, creating a need to increase the number of technicians/artisans.
• Systems failures: As already indicated, there has been a high failure rate of the technology in the past. Moreover, some functional units are operating below optimal capacity, which gives the technology a bad name.
• Inadequate or lack of post installation support; Because the technology is now largely commercially driven, there is limited post installation support, especially after the expiry of the guarantee period – usually 12 months.
• Poor management and maintenance: For optimal production, a certain level of management both for the zero-grazing units and the digesters is needed. But with so many competing uses for rural farm labour, management of the digesters can suffer. Households are content to get ‘acceptable’ and not ‘optimal’ levels of production from their investments.
• Inadequate or lack of technology awareness: Many potential users of the technology are not aware of the technology, many have not even seen it, or those who have are ignorant about how it operates/works and its benefits and personal relevance to them. There is a need for a sustained awareness creation campaign to educate potential users on the uses and benefits of biogas.
• Scarce and fragmented promotional activity: Institutions promoting the technology are relatively few.
• Standards: A major issue currently facing the sector is a lack of quality control.
Often, projects and programmes see the investment costs as well as technological barriers as a major hindrance for the successful introduction of biogas technology. Local biogas companies also identify low levels of awareness and a lack of promotion, a lack of availability of both consumer and vendor finance, a shortage of technicians and skills particularly for installing smaller systems, a lack of quality control and a scarcity of good building materials. Some companies also face the following challenges:
• A lack of capacity to handle orders
• Inadequate construction equipment
• No private and often no public means of transport to potential customers combined with impassable roads.
• The presence of bedrock hinders or prevents excavation of the site.

Kenya Biogas Feasibility Study Page 7
B I O G A S F O R B E T T E R L I F E , A N A F R I C A N I N I T I A T I V E
They perceive opportunities for biogas despite the challenges. The opportunities include: increased awareness and confidence in biogas; biting woodfuel scarcity (as a result of conservation legislation); increasing awareness of ‘the killer in the house’ (indoor air pollution); because economic growth is being felt at the grassroots levels, and through better marketing. There does appear to be opportunities for developing the market for biogas by improving the marketing of the technology and supporting an indigenous market with local partners. This study aims to assess the feasibility of promoting biogas systems in Kenya.
1.6 Study approach and rationale of selecting study sites The purpose of the study is to comprehensively assess the strategic and operational feasibility of implementing a biogas promotion programme in the south-western region of Kenya. This region was identified as high technical potential for biogas in the desk study (see Annex 2). The methodology for the study included end user and stakeholder analysis, an estimation of the realistic domestic market potential for biogas, financial and economic analysis, and marketing planning.
While assessing the feasibility of biogas promotion in Kenya, the study has, amongst others, addressed the following questions:
What is the prevalence of biogas use in the country? What are the potential uses for biogas?
What are the biogas technologies in use, how were they introduced and what has been the technology uptake?
What are the technical and social issues surrounding biogas technologies? What are the socio-economic issues? What are the construction and maintenance
costs? What are the financial and/or economic benefits? Which institutions/stakeholders are involved in the promotion of the biogas?
In order to develop an understanding of biogas use and users in the country, the study conducted field visits to five high potential districts; Kiambu, Kisii, Meru area (parts of the larger Meru district), Nakuru and Vihiga.
The rationale for the selection of these districts was based upon the criteria in the desk study (see Annex 2):
2. INSTITUTIONAL MAPPING AND OVERVIEW OF STAKEHOLDERS
2.1. Institutional mapping The key actors specifically involved in biogas may be categorized into the following:
• The organisations and institutions that create an enabling environment, including government ministries and parastatal organisations;
• Individuals or organisations promoting and/or providing the technology, whereby a distinction needs to be made between organisations, often using public funding, to promote the technology on the one hand, and individuals and companies that offer the same on a commercial or partially commercial basis on the other;

Kenya Biogas Feasibility Study Page 8
B I O G A S F O R B E T T E R L I F E , A N A F R I C A N I N I T I A T I V E
• Organisations providing related services, such as financial services; and • Consumers
Box 2 provides an overview of the key players involved in the promotion of biogas.
Box 2: Listing of key players
(a) Institutions dealing with Policy and Enabling Environment. • Ministry of Energy (MoE) • Ministry of Agriculture (MoA), including Kenya Agricultural Research Institute
(KARI) • Ministry of Livestock and Fisheries Development (MoLFD) • Ministry of Environment and Natural Resources (MoENR), including Kenya Forestry
Research Institute (KEFRI) and National Environmental Management Authority (NEMA)
• Kenya Renewable Energy Association (KEREA) • GTZ Private Sector Development in Agriculture Programme which works in
collaboration with the Ministry of Agriculture
(b) Commercial Providers • Pioneer technologies Ltd • Renewable Energy Engineering Contractors (REECON) • PEMAGI
(c) Supporting Organisations • Non Governmental Organisations such as Sustainable Community Development
Services Programme (SCODE); Sustainable Agricultural Community Development Programme (SACDEP)
• Practical Action Consulting (formerly Intermediate Technology Development Group / ITDG)
• American Breeding Society
(d) Institutions offering Financial Services • Kenya Women Finance Trust (KWFT) • Faulu Kenya • Family Finance Bank • K-Rep Bank (Kenya Rural Enterprises Programme) • Agricultural Finance Corporation (AFC) • KUSCCO as the umbrella for all Savings and Credit Cooperative Organisations
(SACCOs): • Commercial Banks (Equity, Kenya Commercial Bank, Barclays Bank, Cooperative
Bank, Post Bank)
2.2 Description of key players 2.2.1. Policy and enabling environment
Ministry of Energy: The Ministry of Energy (MoE) was first established in 1979 to oversee the development and implementation of policies to ensure energy from various sources was made available to meet demand. MoE plays a largely facilitative role in energy supply, which includes taking leadership in the development of policy as well as legal and regulatory framework for the sector. In addition it has an oversight responsibility over the provision of reliable and adequate energy generation and distribution.
The Ministry has 10 Energy Centres spread around the country and has core staff complement of approximately 270, spread across three core departments -Geo-

Kenya Biogas Feasibility Study Page 9
B I O G A S F O R B E T T E R L I F E , A N A F R I C A N I N I T I A T I V E
exploration; Electric Power and Renewable Energy and three support departments- Planning, Finance and Administration (see Figure 1). The Energy Centres provide basic information and technical advice on biogas and materials needed and also conduct demonstrations. They can also refer potential customers to credible local technicians. It is estimated that through the ministry’s biogas promotion programme about 1300 biogas plants have been established, but there are no records available to verify this estimate. It is also estimated that through the ministry’s efforts about 50 biogas units are constructed every year (Mbuthi personal communication). According to MoE the technical potential for biogas is highest in the high population density areas where zero grazing is practiced (Central Kenya, Kisii, Kericho, Meru, Western Kenya etc).
The MoE’s strategic plan (2004-2009)6 has provision for conducting a national biogas survey to establish the actual status of the industry in Kenya during the financial year 2007/2008. The ministry works with other actors such as the Ministries of Agriculture, Livestock and Fisheries Development and Environment and Natural Resources. However, institutional arrangements have not been very strong.
6 Source: Government of Kenya (2004). Ministry of Energy Strategic Plan 2004-2009. Draft July 2004

Kenya Biogas Feasibility Study Page 10
Figure 1: Current Organization Structure of the Ministry of Energy
Minister
Permanent Secretary
Senior Deputy Secretary HOD Administration
Procurement
Personnel
Accounts
Assistant Minister
HOD – Renewable Energy HOD – Electric Power HOD - Planning HOD – Geo Exploration DCFO
B I O G A S F O R B E T T E R L I F E , A N A F R I C A N I N I T I A T I V E

Kenya Biogas Feasibility Study Page 11
B I O G A S F O R B E T T E R L I F E , A N A F R I C A N I N I T I A T I V E
According to a survey carried out in Nyeri District in 1997 on biogas by MoE the following was revealed (Box 3): Box 3: Some findings of a biogas survey in Nyeri in 1997
• Gas production in the established biogas units was below the expected volumes (1.7 m3 instead of 3 m3) because of management issues related to ownership and perception (status symbol).
• Farmers appreciate the biogas technology but labour constraints deterred proper management of the established biogas units.
• Corrosion of gas holders lead to leakages • There was need for supplementation with firewood for long cooking meals such as beans etc. • Surry, a byproduct is good manure and ready for application immediately it is collected from the
digester.
The challenges facing MoE in relation to promotion of biogas technology are inadequate human resources (technicians), limited financial resources allocated to the Energy Centers and weak linkages with other actors.
Ministry of Agriculture and Ministry of Livestock and Fisheries Development - The Ministry of Agriculture (MoA) and Ministry of Livestock and Fisheries Development (MoLFD) are jointly involved in provision of extension services under the auspices of the National Agriculture and Livestock Extension Programme (NALEP). As such they can jointly promote biogas technology when they are flagging technologies. The MoLFD specifically is mandated to promote livestock development and hence provision of extension services on zero grazing and biogas technology though awareness of biogas at the extension officer level varies. The MoA may also provide extension services on biogas technology through the Home Economics extension wing7.
Kenya Agricultural Research Institute (KARI) – Muguga Centre, which is mandated to carry out research in both crops and livestock, is very interested in the use and promotion of biogas technology. With its vast farm and many farmers who call in, plans are underway to set up a demonstration unit. However, there is no research work on biogas currently going on, although several researchers have conducted studies on the technology in the past.
At the request of some potential users, one researcher has designed a Plastic Tubular Unit to be installed in May at a cost of €65. This plastic is not reinforced, and not UV treated unlike the Pioneer Technology one (see section 2.2 below). The estimated cost of installing a unit €65 seems to be rather low. Secondly, it is not clear whether any tests/trials have been conducted to show that the technology as presently designed will work.
According to KARI, major issues raised on the biogas technology include high capital outlay, problems with running the technology by farmers (assumption that the work of feeding the digester is easy, the maintenance needs etc may be misplaced). Also, many users do not have adequate operational information on the technology.
7 MoA has been collaborating with GTZ in promoting biogas technology since 1980s.

Kenya Biogas Feasibility Study Page 12
2.2.2 Supporting organisations/service providers Sustainable Community Development Services Programme (SCODE) is a non-profit making Non-Governmental Organization (NGO). It was formed in 1996 and has its registered office and community training resource centre in Nakuru. SCODE works through two main programmes: • Renewable Energy Technologies: This programme focuses on the conservation and
sustainable utilization of renewable energy resources to reduce indoor pollution, enhance food security and improve family income.
• Sustainable Land Use Management: This programme aims at improving food security and income levels of small scale farmers through the adoption of low external input environment friendly technologies and approaches.
Within the two programmes SCODE is actively involved in the energy sector through its projects, namely improved cook stove project, biogas/bio-latrine project, Solar PV Project and the fireless cookers project.
The Biogas/Bio-Latrines project aims at building the capacity of local technicians in biogas and bio-latrines technology. It also aims at providing a safe and environmental friendly means of waste disposal while providing gas for fuel and converting waste into high quality fertilizer for agricultural use. The project has been training local technicians on design, construction and maintenance of biogas and bio-latrines.
Since 2004 SCODE has been involved in the Shell Foundation Breathing Space Project, which aims at reducing indoor air pollution through enterprise development and access to finance for clean domestic energy. The programme is managed locally by IT Power (EA). SCODE has worked closely with the Kenya Union of Savings and Credit Cooperative (KUSCCO) Limited to market biogas to savings and credit cooperatives (SACCOs) to encourage them to start biogas financing programmes.
SCODE is a member of the East African Energy Technology Development Network (EAETDN). EAETDN was established in 1998 and has 35 members in Kenya who work in various areas of energy development. The goal of the network is to reduce poverty among communities in East Africa through use of appropriate clean energy technologies. SCODE is the Chair and Focal Point of the EAETDN in Kenya.
Sustainable Agricultural Development Programme (SACDEP) Kenya is a local Kenyan NGO with its base in Thika and works in the rural development sector focusing on training poor resource farmers on various aspects including sustainable agriculture, livestock and renewable energy. The projects are mostly integrated rural development – livelihood focused activities.
The organisation promotes biogas energy as part of its integrated project targeting the poor in the project’s areas – basically the region around Thika District. Interest in biogas comes largely from the beneficiaries, who request for it probably after seeing neighbours with the technology. SACDEP is also interested in the technology as part of its activities to promote renewable energy technologies.
SACDEP has collaborated with SCODE to introduce the fixed dome biogas technology. SCODE helped with training of technical staff, and now SACDEP has about 15 technicians working in this and other renewable energy technologies (including solar, cookers and
B I O G A S F O R B E T T E R L I F E , A N A F R I C A N I N I T I A T I V E

Kenya Biogas Feasibility Study Page 13
stoves). The first biogas unit was constructed with the supervision of SCODE in 2002/3. Working in collaboration with GTZ, SACDEP has now installed about 10 biogas units. All the units are of 16-m3 capacity with a gas holding chamber of 3.8 m3. The project targets to install 18 units over a four-year period.
All the units are installed after participatory training sessions – through community interest groups. Groups come together and seek for training from SACDEP, are requested to contribute part of the costs (usually in kind e.g. some materials and labour). Because of the approach used – where SACDEP conducts several training sessions before work commences - the unit cost of a biogas digester is estimated at €1296. SACDEP has been giving a subsidy of €864 and the community contributes the rest. Subsidy comes in the form of technical labour, different types of cement used, rods etc. while the community provides unskilled labour.
SACDEP has also helped individuals to put up the units, with at least ten people installing units in the last two years using skilled labour from the organisation. The cost of these installations was not immediately available. According to SACDEP, interest in the technology is rising while demand is growing. However, installation is slow because most of the poor farmers take long to organise themselves and raise money for the units. Units are installed in homes where the owners have raised some money for part of the costs. Also, the group members have to agree that installation be done in a given members’ homestead. The subsidy given is not paid back as a revolving fund.
Despite the interest and rising demand, several obstacles stand in the way of the organisation to promote and install more units including:
• Costs of installing the units are high – most groups that SACDEP works with have poor members who cannot afford the full cost of the units. SACDEP does not have adequate resources to subsidize the construction of biogas units for all deserving cases.
• Because most of the group members are poor farmers, they cannot afford to have at least two dairy animals to provide adequate feed material for the digesters.
• There are several technical issues that arise in the course of bio-digester operations, which may discourage some potential users, including inadequate gas, problems with appliances, inadequate follow-up and support after installation.
SACDEP hopes to get more financial assistance to support the promotion of the technology in future.
Practical Action Consulting (PAC) is the new name for Intermediate Technology Consultants (ITC). For over 35 years the organisation has provided development consultancy services as the consulting arm of the international NGO Practical Action (formerly ITDG).
Within the energy sector, PAC works in the fields of decentralised rural electrification, renewable energy and household energy. It provides the following services among others: • Energy expertise focussed on renewable energy and energy efficiency, encompassing
technical, social, environmental and economic aspects; • Off-grid and small-scale energy technologies and experience in low-cost grid extension; • Technology research and consultancy services on technology assessment, transfer,
adaptation and development; • Feasibility studies for alternative energy;
B I O G A S F O R B E T T E R L I F E , A N A F R I C A N I N I T I A T I V E

Kenya Biogas Feasibility Study Page 14
• Practical design and implementation of energy projects and monitoring and evaluation; • Helps to improve the access of poor communities to essential basic energy services and
sustainable livelihoods; • Engages with the energy policy arena through the provision of analysis and
recommendations to government ministries and international donors on institutional, regulatory and strategy matters; and
• Provides services in countries where communities’ livelihoods are extremely vulnerable to environmental degradation and change.
PAC can be an important stakeholder in promotion of biogas in Kenya.
PEMAGI Energy Limited: PEMAGI Energy Limited is a Renewable Energy Technology (RET) enterprise committed to development and diffusion of renewable energy and waste management technologies in East Africa. It was launched in 1993 with the primary objective of carrying out business of designing, installation and maintenance of solar electric systems, biogas systems, wastewater management systems, fuel substitution and energy conservation. Energy baseline surveys and energy audits are carried out and form a basis for system design and advice to the client on energy situation. It also undertakes training programme for its clients on use, operation and post installation maintenance of systems for a long service. The company commits itself in providing advisory service after the completion of the projects. It has pioneered in the development of anaerobic wastewater treatment systems where biogas is generated from wastewater and wastewater is reclaimed and re-used.
In this sector, PEMAGI has implemented unique integrated-closed-loop wastewater management systems for clients. One of such systems is at North Kinangop Catholic Hospital. In 1996 North Kinangop Catholic Hospital was plagued by a chronic wastewater management problem after its sewerage system failed. The leaking sewage threatened to pollute the hospital grounds as well as the neighbouring Kitiri River. Due to this problem the hospital, the only one offering quality medical services to the community around risked being closed by the public health officials. Upon approach by the hospital in 1996, PEMAGI Energy Ltd designed and built an innovative wastewater treatment system, which generates biogas for cooking and the effluent is treated and used for irrigation.
The initiative has solved the wastewater management problem in an environmentally sound manner: The implemented system is now discharging safe effluent with no further risk of contaminating underground and surface water. The community downstream of the hospital is now not at risk of getting water borne diseases and the hospital gets round the year crops through irrigation. The hospital uses 300m3 of biogas every month since August 1999, which has led to conservation of 30-40 percent of firewood and reduction of indoor air pollution in the kitchen. Use of sludge in the fodder farm has eliminated the use of chemical fertilizer. This has been complete departure from the traditional practice where wastewater is treated for disposal only. This project serves as a showcase for similar size institutions faced with similar wastewater management problems. Already, a neighbouring school with 260 boarding pupils has acquired a similar system from this company and biogas is being used to cook for the students in the school.
PEMAGI has continued to play a key role in the biogas sector and is currently marketing, floating drum, fixed dome and plastic tubular technology.
B I O G A S F O R B E T T E R L I F E , A N A F R I C A N I N I T I A T I V E

Kenya Biogas Feasibility Study Page 15
Pioneer Technologies Ltd is a local company incorporated in Kenya and operated by Kenyans. It started biogas business as an offshoot of a plastic business they have been running. It ventured into biogas because of two major reasons – problems of energy especially in the rural areas, and the need to conserve forests/trees. They had also recognised the logical option of using already existing resources – cow-dung and plastics and that at least 60 percent of rural households have livestock, which can give sufficient dung to be used in production of methane.
The organisation pioneered the development of plastic tubular technology in the region, although this technology is borrowed from the East. Pioneer Technology has developed material capable of withstanding pressure from biogas including the chemical reactions that take place. Part of the experience in making plastics comes from the plastic business, which has been on for more than ten years. Development of the plastic tubular technology was initiated in August 2006.
The Plastic Tubular bio-digesters are designed for households with two to three animals although bigger ones have been installed. Capacity of the former is about 8-9 m3, with a gas holding chamber of 1-3 m3. A larger one that doubles this size has already been installed. The smaller Plastic Tubular Bio-digesters can give gas for six hours using one burner. Methane production is initially dependent on temperatures.
Currently, Pioneer Technologies Ltd receives support from Land O’lakes and has entered into research collaboration with Jomo Kenyatta University of Agriculture and Technology (JKUAT). Land O’Lakes gives financial support to the company in the production of biogas digesters. JKUAT is supposed to carry out investigations into issues arising from the use of the technology, with focus on how the technology can be improved, made more efficient etc. However, Pioneer Technologies Ltd gave the JKUAT one digester only, and so the university should acquire more digesters for any meaningful research to be done.
Pioneer Technologies Ltd has installed its bio-digester in various parts of the country including Nakuru, Meru, Kisumu, Kiambu, the coastal regions and the environs of Nairobi. The company has capacity to install up to 3,000 units a year, but there are several challenges including:
• Most households need some financial support to acquire the technology. At cost, a Plastic Tubular Bio-digester goes for €322 only. However, this excludes the cost of transport – and so areas further away from Nairobi pay more money. In Meru, users paid up to €399. The cost of the technology, though coming down is prohibitive to most farmers, although when financial and economic analyses are made, especially taking into account opportunity costs vis a vis other energy technologies, it is very likely that bio-digesters will be economical and profitable.
• Training of technicians to support the technology is costly. Not all technicians trained will work on the digesters forever, some move on. There is need for the technology to be supported by some form of extension. Regular visits to households that have installed it are critical for longevity, good use and success of the technology.
• Many people are not aware of the existence of the technology, or if aware, do not have adequate information on how the technology actually works. This is a hindrance to large-scale adoption.
B I O G A S F O R B E T T E R L I F E , A N A F R I C A N I N I T I A T I V E

Kenya Biogas Feasibility Study Page 16
• At times, the technology fails because of unmet expectations. Even the Plastic Tubular Bio-digester has some technical problems – and these need to be sorted out. Without a reliable back-up support, small problems can lead potential users to shun away from it. But companies like Pioneer Technology Ltd cannot afford to have an extension/back-up support team because it already charges very low figures to install a unit.
• Users need to be trained, and this is quite costly. This is where organisations like Land O’Lakes come in.
• There are many research needs on the technology.
Pioneer Technologies Ltd has trained 7 technicians to support the technology and at least 300 or so units have been installed country wide and despite small problems, all are now working.
Renewable Energy Engineering Contractors (REECON) was established in 1998 and registered in Kenya in 1999. It is involved in development, fabrication and installation of renewable energy systems and technologies that are environmentally friendly.
REECON has highly qualified technicians who have been involved in the biogas sector for over 15 years. They also undertake training in construction and operation of biogas plants. REECON’s work includes the following biogas plants:
• 2002 - 5 units of 16 cubic meter each for households. • 2004 - 1 unit of 50 cubic meters for a slaughterhouse. • 2004 - 1 unit of 30 cubic meters for children’s home. • 2006 - 2 units of 70 cubic meters each in Masai Mara. • 2007 - 6 units of 16 cubic meter each for households in Kisii. • 2007 - 1 unit of 91 cubic meters for a farm in Nairobi.
REECON activities with GTZ/PSDA: The German Government through GTZ together with the Government of Kenya’s Ministry of Agriculture are implementing a programme called Private Sector Development in Agriculture (PSDA). The programme looks mainly at supporting interventions in the agricultural value chain to further exploit the market chances and thus increase income for people involved in the sector.
After one year however, the programme (PSDA) realized that the waste generated from the activities in the production and processing of the agricultural products could generate extra income if properly processed.
REECON from Kenya and AKUT Partner, from Germany entered into a contract to offer consultancy services to PSDA, especially in capacity building services to Biogas plants and reed bed filters plants construction training for masons and engineers. REECON being the local company is in charge of all activities related to training and capacity building, logistical arrangements including awareness creation, identification, supervision, and monitoring of overall activities.
AKUT, the German company provides technical assistance to GTZ/REECON to support capacity building activities, especially related to advances in the biogas plant for Industrial use, engine conversion to run on biogas and elaboration of concepts for other types of waste i.e. slaughterhouses and fruit and vegetable processing factories.
B I O G A S F O R B E T T E R L I F E , A N A F R I C A N I N I T I A T I V E

Kenya Biogas Feasibility Study Page 17
The activities are being implemented as per the programme indicators of PSDA and presently limited to a small number of contracting firms and masons. The total number of masons under training is 34 from a total of 12 contracting firms.
Recently REECON is working in partnership with IT Power (EA) in the Shell Foundation Breathing Space Project. REECON has also joined SCODE in marketing and servicing biogas under the project. Under the auspices of the GTZ/PSDA, REECON recently provided biogas training to KUSCCO’s regional managers. 2.2.3 Institutions offering financial services The Kenya Union of Savings and Credit Co-operatives (KUSCCO) Limited, an umbrella union of a large number of Savings and Credit Co-operatives (SACCOs) is developing strategic alliances and best practices with locally based SACCOs as an innovative mechanism for enhanced market outreach for financing service. A key objective of such service is to provide financial services to low-income, but regular earners, currently excluded from the mainstream financial system (banks) by interfacing its own systems with those of SACCOs that already serve the target market. These services offer a commercial value to the institution as well as provide a developmental impact on the national economy.
The cooperative movement in Kenya is well established with more than 4,600 active co-operatives active across the country and out of which 1,700 co-operatives with a membership of 2.3 million are active members of KUSCCO Ltd. These numbers offer an ideal avenue to exploit a huge market from cleaner energy technologies and reduced indoor air pollution through intelligent marketing and judicious implementation by offering financing services.
KUSCCO Ltd was introduced into the Shell Foundation Breathing Space project by IT Power (EA) and has been marketing domestic energy installations including liquefied petroleum gas (LPG), solar and biogas.
Targeting clean indoor air provides an opportunity for KUSCCO Ltd to upscale its LPG and solar PV interventions to diversify into new products exhibiting a high potential for market uptake. Biogas has been chosen on the basis of the large proportion of farmers practicing zero grazing belonging to co-operatives that are members of KUSCCO Ltd. Commercial and social interests driving KUSCCO Ltd into financing cleaner energy technologies include: • Demand for modern and cleaner cooking and lighting technologies that offer financial
savings, reduce indoor air pollution and improve the health of households; • Increasing the Unions’ savings and deposits clients’ base by penetrating the middle and
low-income financial market, which is currently excluded from the banking system; • Expanding the outreach of the Union by developing business partnerships with SACCOs
and creating new ways of delivering financial and non- financial initiatives to the entire membership of the cooperative movement and the economy; and
• Increasing the availability of basic financial and non-financial initiatives to profitable SACCO economic activities especially in rural areas.
The Kenya Women Finance Trust (KWFT) is a woman led, women serving non-profit organisation which was founded in 1981 by Kenyan professional women in banking business, management and law. It was established to facilitate access to sustainable financial and non-financial services to economically active, low-income women entrepreneurs. KWFT’s vision is to maintain a sustainable and viable institution with capacity to address financial and non-
B I O G A S F O R B E T T E R L I F E , A N A F R I C A N I N I T I A T I V E
Kenya Biogas Feasibility Study Page 18
financial needs of women in the economy. Its mission is to advance and promote the direct participation of economically active women in viable businesses to improve their economic and social status.
KWFT entered into energy business through the Shell Foundation Breathing Space project, through the efforts of IT Power (EA), which introduced the concept to the organisation in 2003. KWFT started by financing LPG and solar PV. The instant success in rolling out the programme has led to mainstreaming of the loan products and now the institution is developing a market strategy for biogas loans. Entrepreneurs interested in the production of improved cook-stoves will also be targeted for funding.
KWFT has selected LPG and solar PV as front-runners for three reasons: • First, the markets for LPG and PV are more mature and the delivery infrastructure is
better developed. This makes it easier to liaise with the commercial providers on the market who already have the necessary expertise. For biogas, SCODE has already developed a track record in delivery of domestic biogas plants in the Rift Valley, the initial focus region of this project.
• Second, initial marketing by KWFT under the wider Shell Foundation Breathing Space Fund for Kenya has indicated that KWFT clients are opting for business in these two products. Much more intense sensitisation, education and training of entrepreneurs and users would have to be undertaken to introduce widespread enterprise in production of cook-stoves and biogas.
• It is relatively more difficult to standardise a financial product for biogas because of the range of variables involved in establishing a viable digester whereas with solar PV and LPG, it is relatively simple to package the loan.
KWFT wishes to work with women in the Rift Valley Province where it has over 17,000 clients, and where activities of the Breathing Space project have already commenced. KWFT expects to gradually start energy loans in other regions.
2.3 Recent developments Since the introduction of the biogas technology in Kenya various delivery mechanisms have been used. Both household and institutional biogas digesters continue to be promoted. The adoption of biogas is apparently hindered by high upfront costs.
Several international organisations have pioneered in the promotion of biogas by providing grants for the construction of the systems. Such organisations include GTZ. Largely farmers who have more than two cows and reside in areas where fuel wood is not readily available have adopted biogas. The farmers pay full cost for the materials and labour.
It is not until recently that financial organisations have agreed to finance biogas installations on a market-driven basis. This has been as a result of the Shell Foundation’s Breathing Space Project in Kenya, which was conceptualised by Mr. Ashington Ngigi in a competitive bid to Shell Foundation. Mr. Ngigi is the project coordinator. The project’s local partners are IT Power (EA), KUSCCO Ltd, KWFT and SCODE. Under this project, Shell Foundation has provided funds for capacity building and seed capital for consumer and enterprise loans. These funds are provided to KUSCCO Ltd and KWFT. In addition, the project has financed capacity upgrade of SCODE, including construction of a permanent on-site training facility.
B I O G A S F O R B E T T E R L I F E , A N A F R I C A N I N I T I A T I V E
Kenya Biogas Feasibility Study Page 19
B I O G A S F O R B E T T E R L I F E , A N A F R I C A N I N I T I A T I V E
In the case of KUSCCO Ltd, member SACCOs borrowed funds to lend on to their members for purposes of purchasing digesters. KUSCCO selects the technical service providers (in this case SCODE and REECON) and monitors the loans.
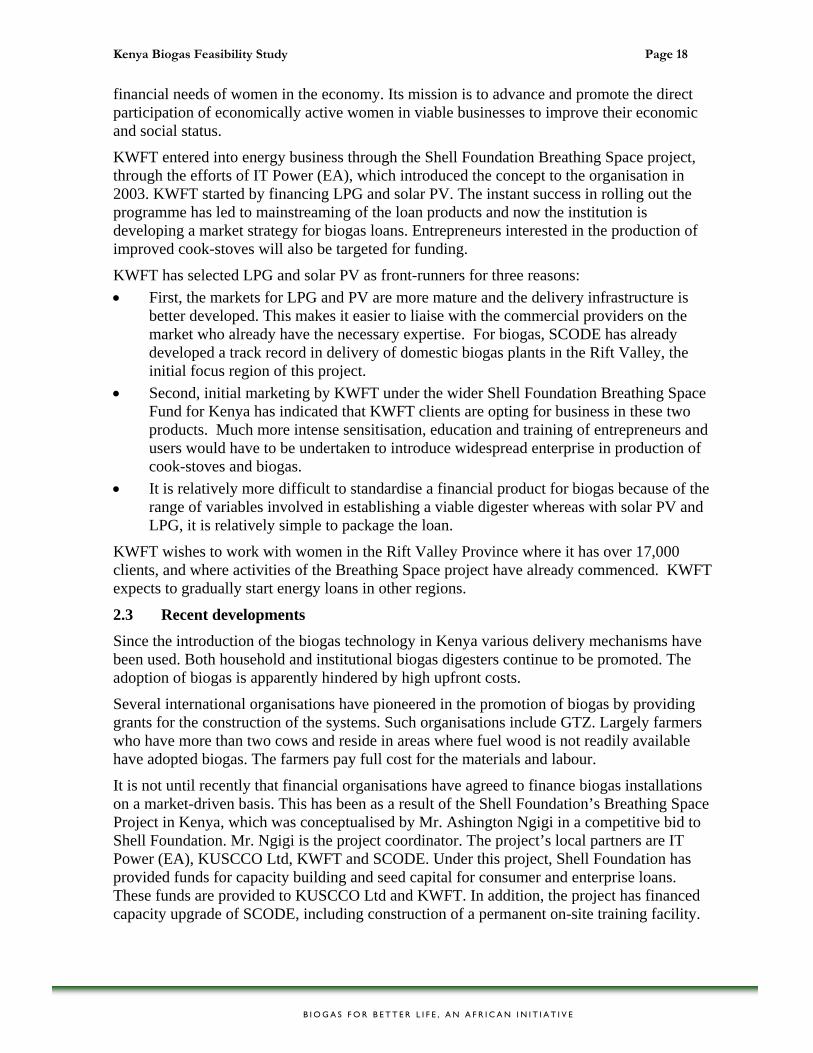
In the case of KWFT, women entrepreneurs who are customers of KWFT receive loans from the micro-financier to purchase LPG, solar PV as well as business loans to establish enterprises in these products. For both programmes, IT Power (EA) provides the technical monitoring and overall project guidance. 2.4 Present organization of the market Promotion of technology is done by government, NGOs and selected private companies selling directly to the end-users. There are several operating models simultaneously present. To present a variety of the different operating models of the market, we distinguish how functions of supply, finance, promotion/sales, and technical service have been arranged by presenting the actors that operate on national/regional/local level. Pioneering companies - Pioneer “Kanyutu” Mr Kanyutu operates a biogas business in Kiambu district already since 1978. All systems are sold in the commercial market on cash basis. He works with floating drum technology, where the floating drum is fabricated at his engineering workshop in Nairobi. Other commercial companies such as PEMAGI generally operate in the same way. Fig.2 Operating model Kanyutu Level of operation Business model
National
Kiambu District
BiogasTechnicians
Villages
End-user
Metal workshopNairobi
Kanyutu biogaspioneer
end-users
Orders
€
installation
hardware/€
metal drum

Kenya Biogas Feasibility Study Page 20
SCODE The NGO SCODE operates in Nakuru district and is currently the leading installer of biogas systems in Kenya with 200 installed systems. Most systems have been installed cash, but SCODE has also developed a structure with an internal revolving fund, with seed money from 3 donors. Fig. 3. Operating model SCODE
National 1 Community Development Trust Fund (EC): 3 pilots2 Dutch Embassy Fund (NL): 12 installations3 ASHDEN Fund (UK) Project: 10 installations
NakuruDistrict
Villages BiogasTechnicians
End-user
SCODE
End users
revolvingfund
biogastechnicians
project officers
€
Orders
€
installation installation
€ training
Kiegoi Tea Sacco project In 2002-2003, Energy for Sustainable Development Africa (ESDA) has implemented a biogas project which included a financing channel through the Kiegoi Sacco. All orders and transactions were channelled by ESDA to REECON who in turn supported biogas technicians to implement.
B I O G A S F O R B E T T E R L I F E , A N A F R I C A N I N I T I A T I V E
Kenya Biogas Feasibility Study Page 21
Fig. 4. Operating model Kiegoi Tea Sacco project
Level of operation Business model
National
District
BiogasTechnicians
Villages
End-user end-users
Ashden trust project hosted by Energy for Sustainable Development
Kiegoi TeaSACCO
Partner company(REECON)
order€
installation
€€
training €
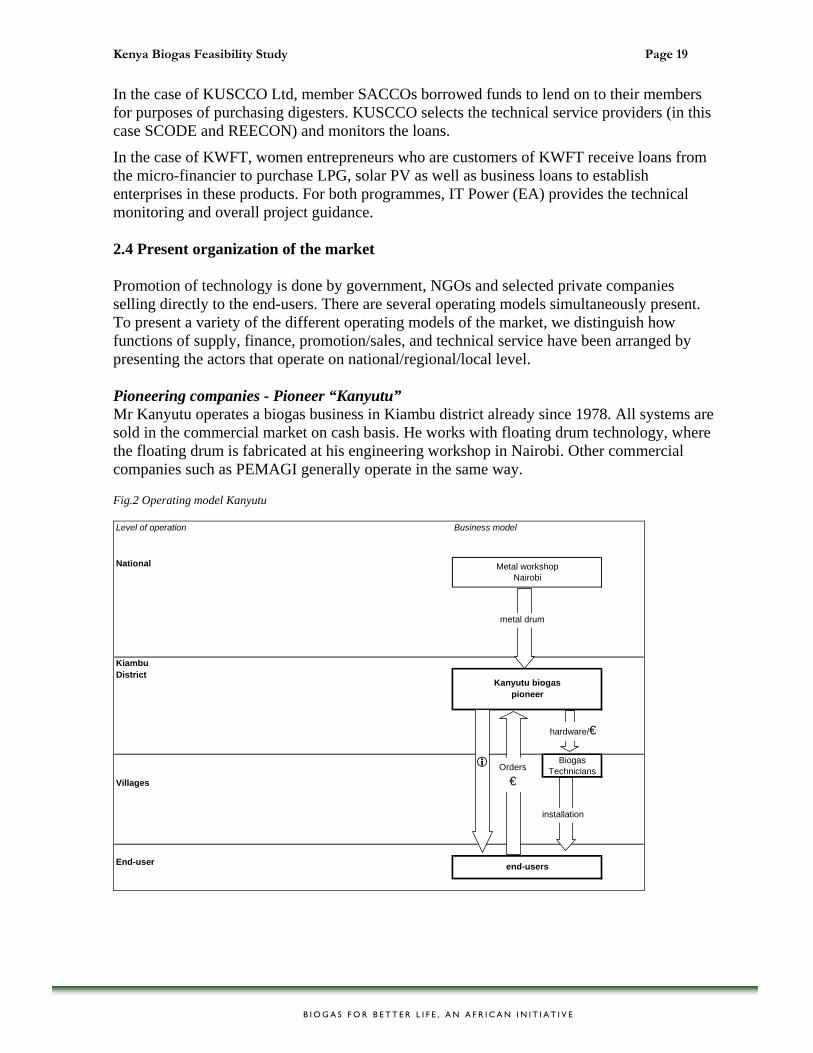
Breathing space project In the business model for biogas under the Breathing Space project, MFIs (the KUSSCO umbrella organisation of Kenyan SACCOs, and KWFT) are supported to promote loans for biogas systems. The biogas systems are installed by technicians managed and trained by partner companies SCODE and REECON. IT Power also has the responsibility to check on the quality of the systems. Fig. 5. Operating model Shell Foundation breathing space project Level of operation Business model
National
District
SACCOs BiogasTechnicians
Villages
End-user
Partner companies(SCODE & REECON)
ShellFoundation breathing space project hosted by IT Power
end-users
Banks/MFIs(Kuscco & KWFT)
order€
installation
€€
training €
order €
€
check oninstallations
B I O G A S F O R B E T T E R L I F E , A N A F R I C A N I N I T I A T I V E

Kenya Biogas Feasibility Study Page 22
GTZ project The PSDA Programme of GTZ in Kenya implements a similar system, but mostly focusing on larger, institutional systems, in which there is no component of cooperation with Banks and MFIs. Apart from the support to market development, GTZ supports the development of a market framework, including coordination between government agencies and the development of technical standards. Fig. 6. Operating model GTZ project
Level of operation Business model
National
District
BiogasTechnicians
Villages
End-user
PSDA project by GTZ
end-users
Partner companies
installation
€
training €
2.5 SWOT of present market The biogas market in Kenya is still largely a market driven by projects and a few companies with their networks of technicians. Prices are high; volumes and market growth are low. SWOT presentation: STRENGTH
• Favourable technology biogas actors: o enthusiastic pioneers o some technicians trained o track record SCODE o track record partners GTZ
• Favourable finance sector: o Saccos, cooperatives o FI and MFIs
• Favourable support sector o Extension services
OPPORTUNITY • Favourable regions:
o with large number of cattle o with zero grazing widely spread o with sufficient water
• Coordination between extension services • Revived interest donor community in biogas • Untrained masons available • Increasing fuel price • Starting product differentiation
B I O G A S F O R B E T T E R L I F E , A N A F R I C A N I N I T I A T I V E
Kenya Biogas Feasibility Study Page 23
WEAKNESS • Product
o low quality tubular product o few smaller systems (<16m3) o low quality burners
• Price:
o high price of construction materials
• Promotion: o awareness biogas with public o coordination ministries o focus institutional
• Place: o few companies commercially
active in biogas
THREAT • bad name because of technology break down
o complaints on tubular technology o complaints from project approach
• weather and climate change o irregular water supply o more droughts
• External and internal market distortions o price fluctuations in construction
materials because of rehabilitation in Sudan
o subsidies on biogas instead of training and technical support
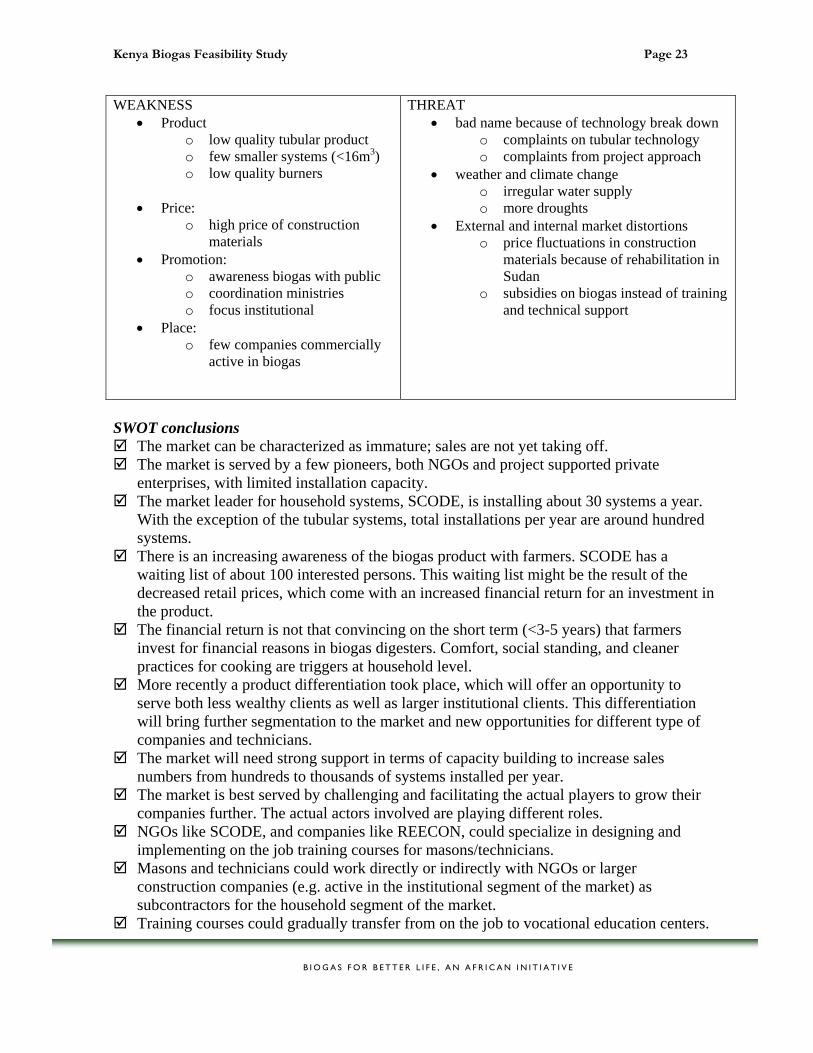
SWOT conclusions
The market can be characterized as immature; sales are not yet taking off. The market is served by a few pioneers, both NGOs and project supported private
enterprises, with limited installation capacity. The market leader for household systems, SCODE, is installing about 30 systems a year.
With the exception of the tubular systems, total installations per year are around hundred systems.
There is an increasing awareness of the biogas product with farmers. SCODE has a waiting list of about 100 interested persons. This waiting list might be the result of the decreased retail prices, which come with an increased financial return for an investment in the product.
The financial return is not that convincing on the short term (<3-5 years) that farmers invest for financial reasons in biogas digesters. Comfort, social standing, and cleaner practices for cooking are triggers at household level.
More recently a product differentiation took place, which will offer an opportunity to serve both less wealthy clients as well as larger institutional clients. This differentiation will bring further segmentation to the market and new opportunities for different type of companies and technicians.
The market will need strong support in terms of capacity building to increase sales numbers from hundreds to thousands of systems installed per year.
The market is best served by challenging and facilitating the actual players to grow their companies further. The actual actors involved are playing different roles.
NGOs like SCODE, and companies like REECON, could specialize in designing and implementing on the job training courses for masons/technicians.
Masons and technicians could work directly or indirectly with NGOs or larger construction companies (e.g. active in the institutional segment of the market) as subcontractors for the household segment of the market.
Training courses could gradually transfer from on the job to vocational education centers.
B I O G A S F O R B E T T E R L I F E , A N A F R I C A N I N I T I A T I V E

Kenya Biogas Feasibility Study Page 24
B I O G A S F O R B E T T E R L I F E , A N A F R I C A N I N I T I A T I V E
Government agencies could continue to promote and support proven technologies at fairs, demonstration farms and demonstration centers and actively refer customers to regional private sector players.

Kenya Biogas Feasibility Study Page 25
B I O G A S F O R B E T T E R L I F E , A N A F R I C A N I N I T I A T I V E
3. BIOGAS TECHNOLOGIES IN KENYA
3.1 Types of technology Current products offered in the pioneering biogas market in Kenya include three main types of biogas technologies: floating drum, fixed dome, and tubular reactors as illustrated below. Table 1. Three biogas reactor technologies on the market Technologies 1. Floating drum reactor 2. Fixed dome reactor 3. Tubular reactor Appearance
Retail selling price for 16 m3
€1188-1403 €648-1296 €399 (for 9m3)
Experience Introduced in 1950s Introduced in 1990s Introduced in 2006 Promoters Tunnel technologies
Mr Kanyutu GTZ-SEP
SCODE PEMAGI REECON GTZ PSDA
Pioneer technologies
Prevalence >1000 300-800 150-200
3.1.1 Floating drum technology The key feature of this technology is the drum that floats depending on the amount of gas in the digester. As methanisation takes place and more gas is released, the drum is pushed up, indicating a rise in the amount of gas. When the gas is used up, the drum sinks. This provides a useful visual indicator of how much gas is available to households. Several models of the floating drum technology have been made and used in Kenya. Most of these were designed and fabricated by Tim Hutchinson of Tunnel Technologies and later by GTZ and the Special Energy Programme.
Costs of building/installing the floating drum type obviously depend upon the size and model. Floating drum digesters need some maintenance depending on how well they are managed. In Meru District, owners do routine maintenance every four years (typical maintenance costs average €33-43 per service). Maintenance involves cleaning, painting and fixing leaks. Appliances such as burners and lamps may be maintained more frequently because corrosion takes place.
The lifespan of these digesters vary widely, and is dependent upon the quality of materials used in construction, as well as management and maintenance. High quality, well-managed digesters can last for over 40 years, though there are some floating drums in disuse – largely because of poor management/maintenance. On the average, it is safe to say that floating drum
Kenya Biogas Feasibility Study Page 26
digesters, if built with high quality materials and well managed, can give service of 30 years providing cooking gas, lighting and fertiliser.
Some important issues about the floating drum include: Field visits indicated that most people who own digesters were happy with them,
although there were examples of broken down technology (Meru Report in Annex 2). Fabrication and installation of floating drum digesters requires technicians who are well
trained and fairly experienced but there are no records on the number of technicians who can fabricate and install the floating drum digesters. In addition, there is no official inventory on the number of floating drum digesters in the country.
Tunnel technologies have come up with kits that one can self-install, with instructions to guide the installation that significantly reduces costs. In addition, the wide variety of models ensures that there is scope for selecting technologies more suited to individual situations. However, this requires pre-existing technical knowledge to self-build.
Maintenance depends largely on the model. However, all models need to be repainted every few years to ensure that the metal parts are protected from corrosion. With proper management, the unit can last for 30 years or more.
Costs vary significantly among the dealers and models. Typically, costs range from €1188 for simple systems to €1403 for more advanced types.
Because most of the units are large, they require regular feeding with cow dung. All the cow dung put in is recovered as mature sludge, ready for farm use.
It was noted that for the success of the technology, there is need for extension support as well as awareness campaigns.
3.1.2 Fixed dome This type of digester was first introduced to Kenya through Tanzania. Whereas the principles of methanisation remain the same, the key difference with this type of digester is that it is built on or more usually under ground level, with only the plumbing, inlet and outlets visible.
There are several models of this digester; dome shaped and flat shaped being the most common. The digester comes in several sizes, ranging from 9 m3 to over 100 m3. Estimates indicate that between 300 and 800 have been installed in the country during the last 6-10 years but there is no official inventory.
Installation costs vary significantly because of the mode of service delivery. Records from SCODE indicate that on average, it would take about 14-16 days to install a digester and another 2-3 weeks for methanisation to take place for adequate gas to be produced. A key issue following the installation of these digesters is getting enough dung to start the process. Depending on the number of animals and also mode of production (zero grazing to semi zero grazing), the time required to fill the digester can vary.
Three main contractors – SCODE, PEMAGI and REECON, are promoting fixed dome digesters. Between these organisations, it is estimated that at least 30-40 technicians have been trained who work for the organisations as well as in their own private capacity.
B I O G A S F O R B E T T E R L I F E , A N A F R I C A N I N I T I A T I V E

Kenya Biogas Feasibility Study Page 27
Some important issues about the fixed dome include: Feeding of the fixed dome can be made as simple as possible, reducing the labour
burden significantly. This depends on factors such as the design of the inlet, location and design of the grazing units.
The gas storage chamber depends on the size of the digesters, but most actors agree that pressure from the fixed dome is usually higher compared with pressure from floating drum digesters.
As with the floating drum, most owners use the gas for cooking, usually light foods to stews, but not maize and beans. Fewer households use the biogas for absolutely all the cooking, however, they can adequately feed 8 people on a daily basis, and up to at least 14 when they have visitors. Some households are able to use the gas for lighting as well.
Costs of installing the technology varied greatly among the service providers, areas of operation and mode of installation. On average, one needs between €713 and €1296 to install the 16 m3 digester.
Building and installation of this unit requires great skill, and some have developed technical problems because of poor workmanship and installation by unqualified persons. The unit requires that the water trap and other fittings be checked regularly for leaks. Also, water condensing in along the fittings, and at times in the cookers, can be an issue, but the inlet pipes can easily be modified with several water traps to ameliorate this problem and help identify leakages.
Biogas cookers are available locally, and Jua Kali artisans have been able to fabricate new ones or modify LPG stoves to use biogas which is much cheaper. However, there is little or no quality control on biogas appliances.
3.1.3 Plastic tubular digesters It is theoretically possible to use a plastic tube for methanisation and produce gas sufficient for cooking. However, success rates have been low. In 2006 a Kenyan company that was involved in making plastics ventured into the plastic tubular digester sector. The company, Pioneer Technologies has improved on the plastic digester to make UV treated, pressure resistant tubular digesters of between 9 m3 and 18 m3.
According to the Chief Executive Officer of Pioneer Technologies, the plastic tubular digester was introduced in 2006 and since then, about 200 units have been installed countrywide. The technology looks simple to install and use but has complex technical considerations during installation, use and maintenance.
At least four of the five tubes visited had some technical/operational problems, which were easily sorted out, but point to the need to review the technology. The digester seems to suffer from effects of variable temperature, and there is a possibility that the heat catalyses some reactions that produce other volatile gases as well as methane.
The minimum retail price for the 9m3 digester is €313, but with costs associated for installation the prices averages €399. The tube is rather fragile and needs some form of protection, and possibly insulation against the cold in Meru, which increases the costs of installation.
It is estimated that the tube can last for between 15 and 20 years, but there is no empirical evidence to support this yet in the Kenyan context. There has been a level of research and
B I O G A S F O R B E T T E R L I F E , A N A F R I C A N I N I T I A T I V E

Kenya Biogas Feasibility Study Page 28
development into making digesters from other plastic materials by Kentainers – a plastic tank company – but these have not yet penetrated the market significantly. Table 2: Comparisons among the different biogas digesters
\ Type of biogas digester Issues Floating drum -16m3 Fixed Dome - 16m3 Plastic Tubular
Digester 9 m3 Average cost of installation (€)
1188-1403 712-1426 399
Ease of use/operation Easy Very easy Easy Perception A bit dirty, but good Very good On trial Efficiency Needs time Needs time Works faster Ease of installation Simple to Complex Very complex Simple Durability At least 30 years At least 30 years 15 years (est) Contractors needed to install 2-3 4-6 1 Technical problems reported Some Very few?? Quite a few Extension/technical support Limited Some A little Minimum cattle/TLU needed 3-4 2-4 2 Maintenance Every 3-4 years Minimal (only
feeding digester) Unknown
Numbers installed >1000 300-800 150 – 200
Observations and discussions indicate an increasing acceptance of the fixed dome, but with the recent entry of the plastic tubular digester, interest in biogas is expected to show varied dynamics of household preferences. Because of the existing diversity of technology and skill sets, it is not realistic to suppose that only one type of technology will be built in the future. It is imperative that the relative merits and disadvantages of each technology be widely and readily available, and presented in a transparent and uniform manner so that customers can make their own informed decision on which system suits their needs best.
3.2 Technical issues – research and development Whereas most actors and consumers of biogas technology are unanimous on its significance in providing affordable renewable energy, and other benefits like fertiliser, many raised several technical and social issues that need further research and action. However, we recommend that because the current market for biogas is immature, innovation should initially be focused upon marketing and communication based upon the existing robust technology that is proven in the Kenyan context (at the moment this only includes fixed dome and floating drum technology). Research and development issues will be important for future development and improvement of the technology. Key research and development issues for the future include: A re-examination of the efficiency of the technologies. The low cost plastic tubular
digester appears promising, but fieldwork indicates that there are several technical issues that need to be resolved;
Improving appliances, e.g. the quality of burners Ways of storing/using excess gas produced; Exploring the possible ways of packaging biogas sludge as a fertiliser; Research into the relative merits of sludge from the digesters on different crops for
sustainable land management;
B I O G A S F O R B E T T E R L I F E , A N A F R I C A N I N I T I A T I V E

Kenya Biogas Feasibility Study Page 29
B I O G A S F O R B E T T E R L I F E , A N A F R I C A N I N I T I A T I V E
Ways of reducing the fabrication costs; Exploration with the manufacturers of plastic tanks to promote moulds for (hardened
and/or flexible) underground digesters to replace the bricks and cement Consideration of the most effective communications for promotion of the technology
and emerging socio-economic (including gender) dynamics with the introduction of the technology; and
In summary, there is scope for research and development in biogas technology development, once the market and marketing for biogas is more strongly developed. 4. UNDERSTANDING THE CUSTOMER
4.1 Introduction and methodology For a market-based approach to biogas it is important to understand the customer. Because biogas technology uptake has so far been slow, it is important to know what the main factors are (or have been) for people to install or not to install biogas digesters. The initial target group of customers for biogas will be people who already have zero grazing or semi zero grazing cattle. Figure 7: Number of households practising zero (with 2 or more) or semi zero (with 3 or more cattle) grazing in Kenya8
8 Map generated by Felix ter Heege, 2006, based on ILRI data.

Kenya Biogas Feasibility Study Page 30
We held focus group discussions with 106 people and semi-structured interviews with 40 people over 5 districts who already owned zero grazing units, and 15 of whom already owned or had recently installed a biogas digester. In all but one case, the interviews were supplemented with rapid rural appraisal techniques to build a profile of a typical target group. Interviews and focus groups were facilitated by MoLFD extension officers, MoE biogas technicians, and SCODE. The fieldwork generated a substantial amount of relevant qualitative data, but can not be considered as a representative sample of the population at a district or national level. The semi structured interviews and focus group discussions were based upon a checklist that covered the household division of labour and general farm management, investigated the current supply chains that are reaching customers, and energy demand. To ascertain the household division of labour, we asked questions regarding the size and composition of families; how a typical day is structured and the division of tasks and responsibilities (including household staff); and about the ownership, access and decision making in regard to resources such as livestock, water, fodder, crop and livestock production. The current supply chains reaching potential customers was investigated during the interviews by asking questions about the processes people undertook to build their houses, zero grazing units, and other high cost commodity purchases, which included length of time taken to construct/purchase, financing channels, and after sales service. This was quantified during focus group discussions. People were asked under what circumstances would they apply for credit, or would consider applying for credit. We also asked how we would go about building a zero grazing unit in their district and where they could go to get more information about biogas. To gain an understanding of energy demand, we asked which types of fuels were used, and the advantages and disadvantages of each fuel. We asked them to estimate the daily and/or weekly quantities and prices of fuels used, including time and money spent in collecting fuel (from the purchasing outlet). We also asked which activities required energy and which fuels were used for what purpose. In addition to the checklist, a participatory wealth ranking was carried out in the focus group discussions to help us identify what criteria people themselves use to describe others as ‘well off’, middle income, or poor (see Table 3). The detailed district reports are contained in Annex 3. Table 3: wealth rankings from Kisii, Nakuru and Vihiga Rich (well off) Middle (better off) Poor Permanent houses, Grade cows(6-10) Growing of tea (2-3ha), Enough land for cultivation e.g. maize (5-10ha) Cars, TV’s, Videos, Radio. Their children go to private schools.
Semi permanent houses. Local cows (2-3). Land for cultivation (2-2 ½ ha). Small scale tea farming (½ha). Children go to school. No balanced diet meal.
Small grass thatched houses (2). Not enough land (1ha). No cows. Cash crops. Strain even if education is free. Lack of enough food.
B I O G A S F O R B E T T E R L I F E , A N A F R I C A N I N I T I A T I V E

Kenya Biogas Feasibility Study Page 31
Own schools, private clinics, Businessmen, Eat three balanced meals a day. They have labourers. Good (expensive) clothes. Electricity, solar Commercial plots
Radios, T.V, Solar, Small businesses
Idlers. Rags (clothing). No bedding. No radio. Negative attitude to development issues.
Electricity. Permanent houses. Piped water. Cash crops. Zero grazing units. Vehicles. Rental houses. Wholesale businesses. Over two acres tea production. Livestock – over two dairy cows.
Small scale farming- 1 acre. Small enterprises – kiosk. Zebu cows and or crosses. Semi permanent houses.
Labourers, idlers. The vulnerable. Widows, orphans. Have small grass thatched houses. Small land sizes less than ¼ acre. Low education.
Over 2 acres of land Permanent house Owns a car Take children to boarding schools/high cost schools Earn over €540 Over 5 dairy cows Has numerous assets Surplus food Employs over ten workers Has 1-3 children
1-2 acres of land Semi permanent house 2 – 5 dairy cows Can afford to pay secondary level school fees Can afford daily bread throughout the year Earns over €216 Has 4-6 children
Thatched house Less than 0.5 acres of land Only one or two meals a day Not able to feed family throughout the year No regular income Earns less than €1 a day 1-2 zebu cows Can not afford medical care Cannot pay secondary school fees Large family size-over 8 children
Big permanent houses (mansions) Over ten acres of land Over 10 dairy cows 2 or more mini buses Has a lorry Has a tractor Children learn in high cost schools (academies) Has surplus food can afford balanced diet
Permanent house 2 –5 dairy animals Able to take children to boarding school Can pay for medical care 1-3 acres of land Is assured of his next meal
1-0.5 acres of land 2-5 zebu cows Grass Thatched house or semi permanent Able to take children to public day schools Can afford health care in public hospitals Next meal not assured
Owns a car Land over ten acres
Have good health Can afford three meals a day
Labourers Can not afford three meals a
B I O G A S F O R B E T T E R L I F E , A N A F R I C A N I N I T I A T I V E

Kenya Biogas Feasibility Study Page 32
B I O G A S F O R B E T T E R L I F E , A N A F R I C A N I N I T I A T I V E
Over 5 dairy cows Owns a television set Owns a tractor Permanent house Electricity or Solar system Children attend high cost boarding schools Do not need a bursary for school fees
Have permanent houses Can afford to pay secondary boarding school fees Their children learn in academies Salaried Have 2-4 dairy cows Land-2-5 acres Practice modern agricultural practises e.g. applying fertilizer in the fields
day Can not afford to buy fertilizer Get food aid Cannot afford to pay secondary school fees for their children Have less than one acre of land
4.2 General findings
Districts where the technology has been adopted all have significant numbers of dairy cattle.
Figure 8: Division level dairy cattle density9
All households that have installed biogas own some dairy cattle and the number of dairy animals owned varied from 2 upwards. Typically, Friesian was the most common dairy cows although Ayrshire and crossbreeds were also common. Many people had erected zero grazing units of varying standards, but almost half of those visited practiced semi-zero grazing. The main problems or challenges to fully zero grazing are inadequate access to fodder (Napier grass) and shortages of water – either seasonal shortages as in the case of Nakuru, or transporting water to the unit if they didn’t have their own borehole. Based on field data,
9 ILRI, 2003

Kenya Biogas Feasibility Study Page 33
B I O G A S F O R B E T T E R L I F E , A N A F R I C A N I N I T I A T I V E
typical monthly expenditures on energy (excluding electricity) ranged from €10 to €20 per month depending on the types of fuel purchased.
The two main reasons behind purchase of biogas, were that either the technology was promoted in the area, and taken up by those who felt it was a prestigious item to have and use (e.g. Kisii, Meru) or that people who had seen the technology elsewhere decided to go for it when they settled in new environs with new challenges including access to energy (Nakuru). In some districts (Kiambu and Nakuru), the technology was initially introduced through partial funding from some NGOs operating in the area (e.g. SACDEP) to members of organised community groups.
Most households that had installed biogas digesters were in the well off to better off wealth category. For example, they had permanent buildings, practised zero grazing and they all had either a salary from formal employment or ran their own businesses, and had desire to better their lives with practical technologies). Family sizes ranged from around 4 to 8 persons. They had high levels exposure to alternative energy technologies such as solar PV, and were members of formal and informal development oriented groups. These affiliations like cooperative societies have dynamic people who can provide leadership, and seek for better and more efficient technologies for their members e.g. Lanet Sacco in Nakuru. Many of the innovators/early adopters were role models or held high status within their communities. In most cases the stated benefits of a digester were associated with its obvious use for cooking, and fertiliser and in some colder places (such as Meru district) also for lighting.
Most households who participated in the interviews and focus group discussions were also in the well off to better off wealth categories, and therefore had reasonable purchasing power. However, there was a demonstrated reluctance to use credit finance to enable investments, for example, only 4 people out of 47 took out a loan to enable them to build their zero grazing unit and only 4 people used savings. The costs for building a zero grazing unit (from 1975 to 2007) ranged from €11 for a semi-permanent unit, to €1079 for a permanent concrete structure. Sale of farm produces, including livestock, and income from salaries or businesses were by far the most common sources of finance to build zero grazing units. In contrast to biogas, which is a one off build, zero grazing units can be built gradually, for example, by increasing the number of units when you can afford to do so. Table 4 indicates the means of purchase based on focus group discussions with 65 people.
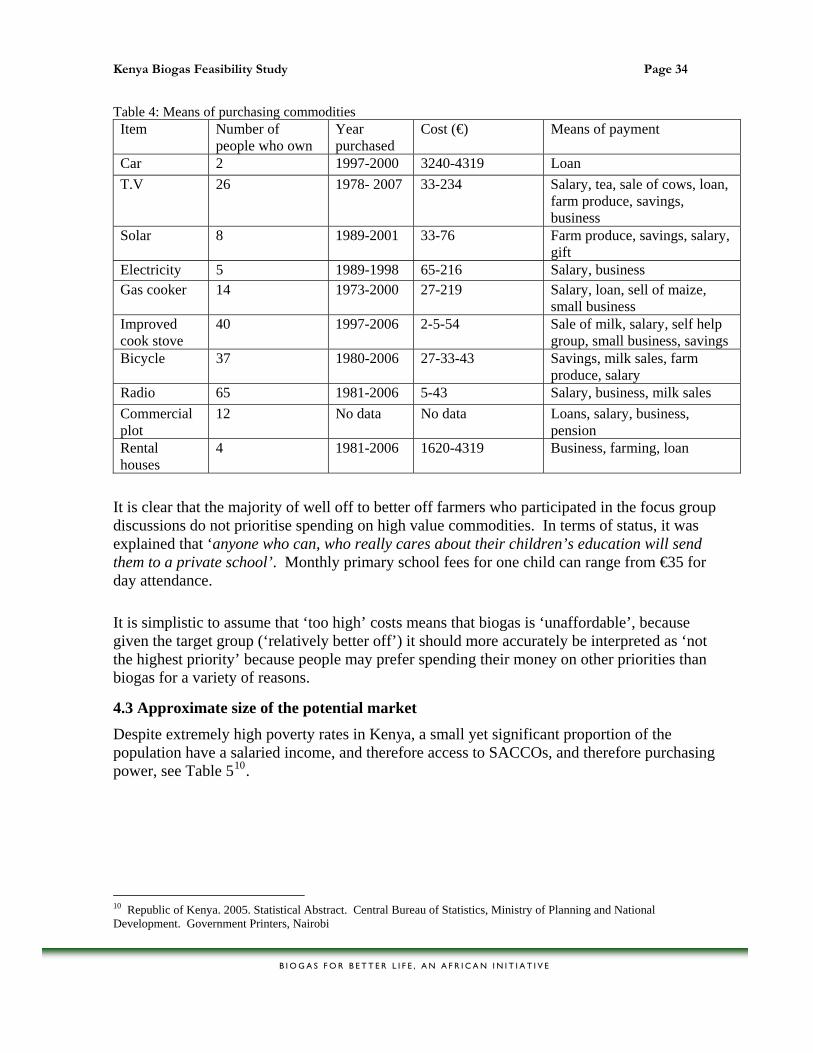
Kenya Biogas Feasibility Study Page 34
Table 4: Means of purchasing commodities Item Number of
people who own Year purchased
Cost (€) Means of payment
Car 2 1997-2000 3240-4319 Loan T.V 26 1978- 2007 33-234 Salary, tea, sale of cows, loan,
farm produce, savings, business
Solar 8 1989-2001 33-76 Farm produce, savings, salary, gift
Electricity 5 1989-1998 65-216 Salary, business Gas cooker 14 1973-2000 27-219 Salary, loan, sell of maize,
small business Improved cook stove
40 1997-2006 2-5-54 Sale of milk, salary, self help group, small business, savings
Bicycle 37 1980-2006 27-33-43 Savings, milk sales, farm produce, salary
Radio 65 1981-2006 5-43 Salary, business, milk sales Commercial plot
12 No data No data Loans, salary, business, pension
Rental houses
4 1981-2006 1620-4319 Business, farming, loan
It is clear that the majority of well off to better off farmers who participated in the focus group discussions do not prioritise spending on high value commodities. In terms of status, it was explained that ‘anyone who can, who really cares about their children’s education will send them to a private school’. Monthly primary school fees for one child can range from €35 for day attendance. It is simplistic to assume that ‘too high’ costs means that biogas is ‘unaffordable’, because given the target group (‘relatively better off’) it should more accurately be interpreted as ‘not the highest priority’ because people may prefer spending their money on other priorities than biogas for a variety of reasons.
4.3 Approximate size of the potential market
Despite extremely high poverty rates in Kenya, a small yet significant proportion of the population have a salaried income, and therefore access to SACCOs, and therefore purchasing power, see Table 510.
10 Republic of Kenya. 2005. Statistical Abstract. Central Bureau of Statistics, Ministry of Planning and National Development. Government Printers, Nairobi
B I O G A S F O R B E T T E R L I F E , A N A F R I C A N I N I T I A T I V E

Kenya Biogas Feasibility Study Page 35
B I O G A S F O R B E T T E R L I F E , A N A F R I C A N I N I T I A T I V E
Table 5: Data on employment and total earnings per district (2004)
District No of people in wage employment
earnings per district (million shillings
2004 2005 2004 2005 Kisii 32456 33455 9881.4 11904.8 Meru 53150 54547 13126.7 15852.1 Nakuru 98373 100644 23383 27058.1 Vihiga (Kakamega) 62183 63516 17934.4 22202.1 Nyandarua 20132 20746 6302.4 7505.7 Kiambu 111943 115321 26496.7 30963.6 Based on district population sizes given in the District Development Reports (see Annex 2), it is obvious that only a fraction of the total population are engaged in formal employment. However, the total number of people who have an income from dairying and cash crops as well as those who are self employed will likely increase the total amount of people who have access to a regular income and finance. Table 6 shows the number of people who earn more than €270 in district urban centres11. Table 6: Income distribution in selected urban centres
District Town Total wage employment in urban centers
Number of People earning more than €270 per month
2004 2005 2004 2005 Kisii 10635 11053 4538 (42%) 4744 (43%) Meru 4293 4516 1643 (38%) 1730 (38%) Nakuru 44247 46378 13597 (31%) 14250 (31%) Vihiga (Kakamega) 7328 7770 3184 (43%) 3378 (43%) Nyahururu 4959 5184 2242 (45%) 2344 (45%)
At first glance, this indicates that only a small proportion of the total population have access to an income that would permit them to consider investing in biogas. However, this must also be considered in light of international and national migrant remittance channels that are excluded from this presentation of income distribution in rural areas and may alter the financial constraints of rural households12.
Theoretically, any household that has at least two head of grade or grade crossbreed cattle, that can yield sufficient collectable dung, can have biogas, provided there is also access to water. As such the potential is, compared with the existing stock of biogas digesters, enormous. Based on the characteristics of availability of (at least 2 grade) cows and levels of formal employment in the districts (which is a proxy indicator for having access to credit), the
11 Republic of Kenya. 2005. Statistical Abstract. Central Bureau of Statistics, Ministry of Planning and National Development. Government Printers, Nairobi 12 In 2004, Kenyans living and working abroad formally remitted US$464 million. This figure excludes remittances sent through informal channels. Source: Ngunjiri, P. February 22 2006. Remittances Dwarf Aid, Investment in Kenya. The East African Standard, Nairobi

Kenya Biogas Feasibility Study Page 36
B I O G A S F O R B E T T E R L I F E , A N A F R I C A N I N I T I A T I V E
total theoretical potential could be 38,000 units in Kiambu, Kisii, Meru, Nakuru, Nyahururu and Kakemega/Vihiga (one tenth of the people who are in formal employment). Given that there are approximately 750,000 cattle within these districts, it is safe to assume that one tenth of the population who are formally employed will own at least 2 grade or high quality crossbreed cows. The number of people working in urban centres who earn more than €270 per month (see Table 6) also supports this theoretical potential, as does selected district level data.
Table 7: Selected district level socio-economic data13
There are 71 districts in Kenya, and biogas will be technically possible in at least 35 districts. Biogas will be environmentally feasible in most of Nyanza, Western and Central Provinces, and in a small number of districts in Rift Valley and Eastern. Assuming that 4923 units are feasible per district, the total theoretical potential could be roughly estimated as 172,312 biogas units though the actual potential will be smaller, as not all households that are ‘technically eligible’ will indeed adopt the technology.
4.4 Factors to potentially drive biogas technology Many existing biogas consumers believe that investing in biogas is sensible. The technology is relatively convenient and time saving, especially compared to the long search for firewood or charcoal, and the costs of running it do not significantly change with weather patterns, whereas costs of fuelwood increase during the rainy periods. Many potential biogas consumers are superficially aware of the benefits of the technology, but actual investments in biogas remain relatively minor. In real terms, the cost of a 16m3 floating drum has already reduced significantly. Presently, the price is about €1296, which is, in nominal terms the same as the price in the 1980s. Hence, in real value, the price has more than halved, while opportunities for financing have greatly 13 Based on District Development Reports for the period 2002-2008
District Kakamega Nakuru Kisii Central Nyandarua Total no. of Households 125901 327,797 100,315 104,401 Average Household Size 4.8 4 5.1 4.6 Average farm size (Small Scale) 0.7 ha 2.5 Acres - 3.05 ha Average farm size (Large Scale) - 1100 Acres - 100 Ha Population Working in Livestock sector 75% 17% 70% 57% No. of households with electricity connection 18,885 25,346 13,500 10,000 % of Households using firewood 95% 72.40% 85% 99% No of VIP Latrines 1,500 140,296 70,225 -

Kenya Biogas Feasibility Study Page 37
improved. The cost of the 16m3 fixed dome system starts from as little as €713 following negotiations with contractors under the Breathing Space project. During the fieldwork, many people indicated that they would be hesitant to consider taking a commercial loan to construct a digester, and that they would prefer to finance an investment such as biogas either through the SACCO system or through group savings.
There is generally a low awareness about biogas in Kenya. Though most people interviewed had heard about biogas, for example, knowing that there was a biogas system in a local school, they were not aware that biogas technology could be relevant to them personally.
Because biogas has been typically promoted by only around a dozen organisations, the marketing of KUSCCO to SACCO members creates a greater confidence in the technology because of the ‘new faces’ (people who have local credibility) who are now involved.
Owners and potential owners of biogas units are unanimous that sources of energy available in the market are expensive (charcoal and electricity), unreliable (electricity), or cumbersome and not practical in many situations (firewood; LPG in remote rural areas). Although the costs of other fuels are not expensive in direct comparison to investing in biogas, the need to explore renewable energy sources like biogas is becoming increasingly apparent.
As experience with biogas technology has improved, the costs have come down. Many potential users are now coming to grips with new ways of accessing affordable loans including group revolving funds, cooperative loans and loan guarantees. Although there may be financing problems, it should also be kept in mind that biogas technology has been historically linked to projects, and therefore interviewees may be tempted to over-emphasise the financial aspect, in the hope to gain benefits such as subsidies.
B I O G A S F O R B E T T E R L I F E , A N A F R I C A N I N I T I A T I V E

Kenya Biogas Feasibility Study Page 38
B I O G A S F O R B E T T E R L I F E , A N A F R I C A N I N I T I A T I V E
5. MARKETING AND FINANCIAL ANALYSIS
5.1 Introduction The presented marketing and financial analysis builds upon fieldwork as well as data collection by ETC UK and ETC East Africa ltd presented in earlier chapters. The marketing and financial analysis builds on rural energy project organizational planning tools developed in the EASE network, managed by ETC Energy14. Furthermore, the consultants have developed a spreadsheet tool for financial analysis and evaluation of renewable energy investments. ETC energy and its partners are interested to further develop, prepare and implement the program, making use of the business development support experiences and tools developed in the EASE network.
5.2 Product-market combinations Current products offered in the pioneering biogas market in Kenya include three main types of biogas technologies: floating drum, fixed dome, and tubular reactors. The fixed dome is the most popular product in the biogas market in Kenya due to its lower cost, lower maintenance cost, preferred aesthetics and space savings. The plastic tubular reactor is seen as a product that is not technically proven and still entails significant technical problems. The Vacvina hybrid reactor design from Vietnam has not been found on the Kenyan market. The further marketing and financial analysis is therefore based upon the fixed dome reactor. Digester sizes The fixed dome digester is currently offered in different sizes. Table 8. Digester sizes Size/ Characteristics Price Market Fixed dome 16 m3 €1188-1403 Innovative farmers Fixed dome 8-10-12-16 m3 €421-475-572-1188 Innovative Saccos members,
clients of KUSCCO The dominant product on the market is the 16m3 fixed dome digester. Smaller sized products have been more recently introduced in the market Understanding the “traditional market” for the 16m3 reactor The dominant product market combinations were fixed or floating dome systems of about 16m3 with prices of about €1296 for innovative farmers. Richer farmers that have been targeted by projects have installed these products.
14 www.ease-web.org

Kenya Biogas Feasibility Study Page 39
When analysing the investment cost, and calculating the expected fuel savings, it can be found that with the 16m3 reactors, the FIRR is marginal (see figure 7): only in year 7 will the net cash flows become positive. The time value analysis shows less than 10 percent FIRR after ten years. There is a negative FIRR for the first three years which is seen as the maximum time frame for household investments. It is estimated that an FIRR of 30 percent is needed to positively influence such a decision. Figure 9. FIRR for 16m3 reactors
-15%
-10%
-5%
0%
5%
10%
1 2 3 4 5 6 7 8 9 10
YEARS
FIR
R
Assumptions: Investment: €1296 Savings: €16/month Maintenance: zero /month Payback : 7 years Type of savings: Firewood, charcoal, kerosene, LPG
A comparative calculation with the investment in a cow (€270) would generate a much higher FIRR (>50 percent) within 3 years. Most households operating a 16m3 were able to buy the systems cash, although the early systems were mainly acquired with some kind of financial support from donor projects. Generally, the customer for a 16m3 digester is seen as a household that is well-off. The household values cleanliness, aesthetics, and ease of use and advanced appearance of cooking on gas. The current market for the 16m3 product can be seen as an innovator market driven by non-financial factors in their decision to adopt a biogas reactor. Understanding the market innovation for the 8m3 – 16m3 reactors In 2005, the Shell Foundation supported the “Breathing Space” project started with two installers (SCODE and RECON) and with KUSCCO, the umbrella organization of Kenyan SACCOs to explore the possibility to differentiate product sizes and test new market product combinations. This is a relatively new scheme in the biogas market of Kenya. These smaller products are now targeting middle class SACCO members with cows. Down-scaling the product size makes it more attractive for less wealthy farmers to buy systems on a cash basis. SACCOS can access credit from KUSCCO and SACCO members can use the credit to purchase digesters.
B I O G A S F O R B E T T E R L I F E , A N A F R I C A N I N I T I A T I V E

Kenya Biogas Feasibility Study Page 40
Figure 10. FIRR for 8m3 reactors
-15%
-5%
5%
15%
25%
1 2 3 4 5 6 7 8 9 10
YEARS
FIR
R
Assumptions: Investment : €421 Savings : €11/month Maintenance: zero /month Payback : <4 years Type of savings: Firewood, charcoal, kerosene, LPG
Smaller products costed in Figure 10, give a better return than larger products as well as faster pay back period. Figure 11. FIRR for 16m3 reactors
-10%-5%0%5%
10%15%20%25%30%
1 2 3 4 5 6 7 8 9 10
YEARS
FIR
R
Assumptions: Investment : €1188 Savings : €16/month Maintenance : zero/month Payback : <4 years Type of savings: Firewood, charcoal, kerosene, LPG
In both smaller and larger systems’ FIRR improves considerably with lower retail prices. Results are sensitive for price fluctuations of the fuels which are replaced. A doubling of the savings in fuel will almost double the FIRR for 16m3 and more than double the FIRR for 8 m3 systems. Smaller systems become increasingly attractive for farmers, especially in places where fuel wood becomes more expensive. 5.3 Prices Prices on the Kenyan market In 2007 the following prices for both smaller (8 m3 -16m3) and larger (16m3 – 124m3) sized systems of fixed dome technology are offered by SCODE, REECON, and through GTZ partners for respectively domestic and institutional uses. Figure 12 Retail prices for different ranges of biogas digesters Retail prices (USD) fixed dome (domestic, SCODE) Retail prices (USD) fixed dome (Institutional, GTZ)
B I O G A S F O R B E T T E R L I F E , A N A F R I C A N I N I T I A T I V E
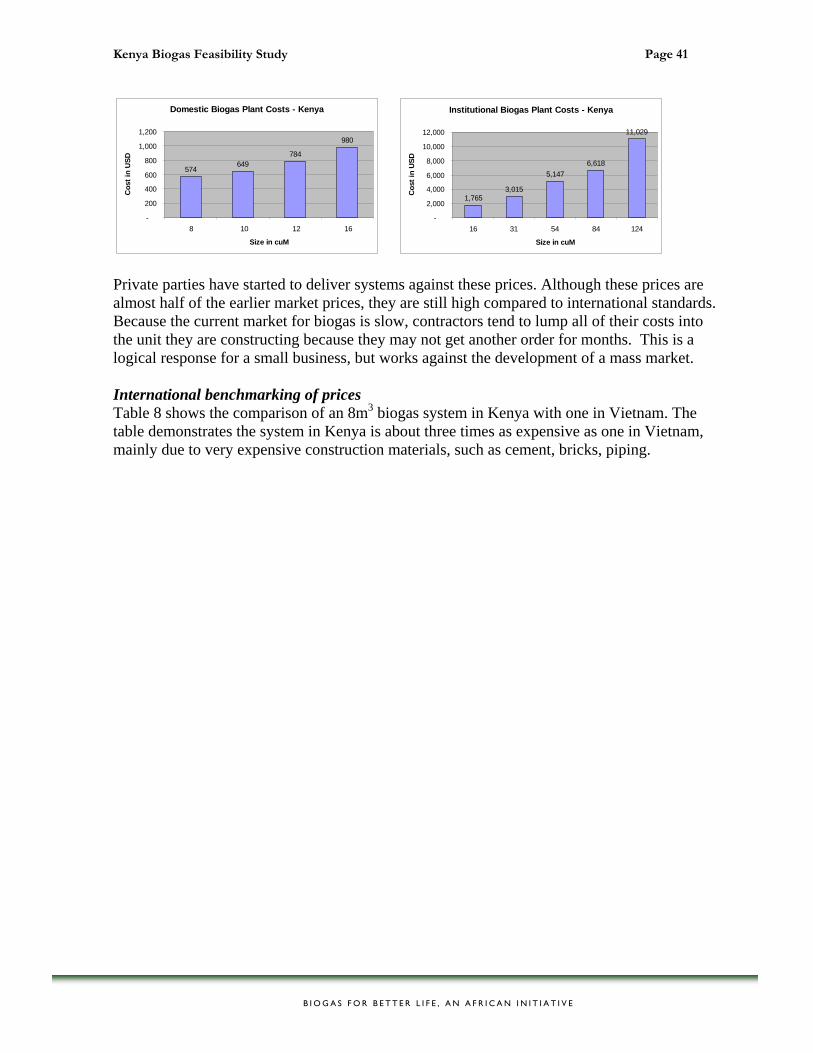
Kenya Biogas Feasibility Study Page 41
B I O G A S F O R B E T T E R L I F E , A N A F R I C A N I N I T I A T I V E
Domestic Biogas Plant Costs - Kenya
574649
784
980
-
200
400
600
800
1,000
1,200
8 10 12 16
Size in cuM
Cos
t in
USD
Institutional Biogas Plant Costs - Kenya
1,7653,015
5,1476,618
11,029
-
2,000
4,000
6,000
8,000
10,000
12,000
16 31 54 84 124
Size in cuM
Cos
t in
USD
Private parties have started to deliver systems against these prices. Although these prices are almost half of the earlier market prices, they are still high compared to international standards. Because the current market for biogas is slow, contractors tend to lump all of their costs into the unit they are constructing because they may not get another order for months. This is a logical response for a small business, but works against the development of a mass market. International benchmarking of prices Table 8 shows the comparison of an 8m3 biogas system in Kenya with one in Vietnam. The table demonstrates the system in Kenya is about three times as expensive as one in Vietnam, mainly due to very expensive construction materials, such as cement, bricks, piping.

Kenya Biogas Feasibility Study Page 42
B I O G A S F O R B E T T E R L I F E , A N A F R I C A N I N I T I A T I V E
Table 9. Construction cost for 8m3 biogas system with international benchmark Kenya Vietnam Cement 90 30 Bricks 103 27 Other materials 136 20 Unskilled labour 43 27 Skilled Labour 43 38 Total €415 €142
The price of 8m3 biogas system in Vietnam is €142, which is less than half the cost of a similar system in Kenya at €415. The price of a similar system in Nepal is €242, or less than 60 percent of a system in Kenya. In Uganda, the Nepalese 8m3 model is estimated to cost €723 and the CAMARTEC design, which is most commonly found, cost €55715. While the prices for biogas reactors have come down considerably in the Breathing Space Project, this still reveals a significant opportunity for further cost savings. Imagining all materials would be imported in a sea container from Vietnam, against 50 percent (!) shipping costs, at 25 percent import duties and 18 percent VAT, then material cost could go down by 50 percent and the mentioned price would come down by 40 percent to €253.
5.4 Financing Most biogas products are offered against the full price to end-users, though some grant support and/or financing facilitated by donor projects. Consumers themselves are able to provide finance through informal saving groups (“merry-go-round”) or more formal saving groups (SACCOs). Under the Breathing Space project, KUSCCO the umbrella organization of the SACCOs, made finance arrangements on behalf of its members between installers and SACCOs. Some micro finance and banks are becoming interested in offering credit facilities to consumers for pre-financing biogas installations. During the normal running time of an end-user credit (max 3 yrs), the FIRR of the system is lower than the interest rate on the credit. Therefore we expect that richer farmers will allocate a possible credit to other investment opportunities than biogas. For the poorer farmer, a reluctance to take on a credit may make credits less interesting. Despite this, experience in the Kenyan biogas market has shown that working with micro credit organizations is possible, especially in terms of the marketing and demand mobilization potential.
5.5 Present status of market 15 Winrock International. 2007. Draft Report on the feasibility for a national household biogas commercialization programme in Uganda. Based on exchange rate of US$1 = €0.7234

Kenya Biogas Feasibility Study Page 43
B I O G A S F O R B E T T E R L I F E , A N A F R I C A N I N I T I A T I V E
The market for biogas digesters is far from mature and fully commercial providers are few and relatively small. So far no single installer in Kenya has installed more than 200 systems over the last decade. However the provider of the tubular systems claims to have reached these numbers in one year. In total there are about a dozen companies active on a project base in biogas in Kenya, compared to over sixty in Nepal. Total numbers installed for all technologies are estimated between 1500 and 2000 systems over a time period of fifty years, the majority of which was built starting in the eighties and nineties. These volumes are low compared to 140,000 systems installed in Nepal between 1992 and 2005. Furthermore, one single company in Nepal can install 2000 systems a year.
5.6 Biogas marketing objectives 5.6.1 Approach to setting objectives This section assesses the feasibility of scaling up the volumes in the biogas market in Kenya as part of the African initiative “Biogas for a Better Life”, by building on real end-user demand and the experiences and the capacities of the biogas companies and technicians in Kenya. The biogas for Kenya marketing plan aims to develop and test a plan how to go from the current stage of the market to a “massive presence”16 of biogas plants in Kenya. The essential elements in this planning are:
- The assumption of a continuing exponential growth of the market of 60 percent per year. The market growth rate is exponential instead of s-curve shaped, since we assume that over the period of 10 years continuous innovation should develop new product-market combinations as a timely response to the current dominating product-market combinations saturation. For sensitivity analysis, growth curves were also calculated using 50 percent and 70 percent growth per year.
- The assumption that one biogas technician can install 20 systems per year. This
element is very important in order to assure that technical capacity growth is in tune with market growth and does not become a bottleneck.
- The assumption that one biogas installation company can employ 4 technicians, and
therefore has a capacity of 80 systems per year (and that larger companies can be considered as consisting of several sub-companies consisting of 4 technicians and managers/back-office). This element is very important to show how a sector must grow under an ambitious biogas programme.
In a simple spreadsheet this leads to the following contrasting offensive and defensive scenarios: 16 Massive presence has not been numerically defined, apart from an order of magnitude indication of 50 000 to 100 000 systems.

Kenya Biogas Feasibility Study Page 44
Table 10: Offensive scenario Defensive scenario Objective 25000 syst/tech tech/compannual growth 60% 20.00 4.00
Year Annual sales Total installed Technicians Companies
1 364 19 5 2 582 30 8 3 931 47 12 4 1,490 75 19 5 2,384 5,751 120 30 6 3,815 191 48 7 6,104 306 77 8 9,766 489 123 9 15,625 782 196
10 25,000 66,060 1,250 313
Objective 15000 syst/tech tech/compAnnual growth 60% 20 4
Year Annual sales Total installed Technicians Companies
1 218 11 3 2 349 18 5 3 559 28 7 4 894 45 12 5 1.431 3.451 72 18 6 2.289 115 29 7 3.662 184 46 8 5.859 293 74 9 9.375 469 118
10 15.000 39.636 750 188 In the following paragraphs these objectives are further elaborated in operational objectives for marketing planning. 5.6.2 Objective – offensive scenario The offensive objective of the biogas marketing plan would be “to increase the performance of the biogas market in Kenya in order to reach an annual sales volume of 25 000 biogas plants in 10 years time (leading to an approximate installed base of 65 000 units by that time – less than half of the market potential as indicated by the consumer research - and 6000 units in the first 5 years)”. Figure 13 Growth curves to reach 25000 sales per year for 60 percent growth (bandwidth 50 percent to 70 percent)
B I O G A S F O R B E T T E R L I F E , A N A F R I C A N I N I T I A T I V E

Kenya Biogas Feasibility Study Page 45
B I O G A S F O R B E T T E R L I F E , A N A F R I C A N I N I T I A T I V E
To reach this objective goals include:
- [Capacity] Developing in the first 5 years a sector of at least 30 competing companies and 120 technicians, capable and fully involved in supplying domestic market biogas systems; after 10 years this should grow to 1250 technicians in over 300 companies.
- [Demand] Developing sufficiently large awareness and market demand to be able to
sell 65 000 biogas plants in 10 years time, an 6000 units in the first 5 years; developing supporting cooperation with microfinance organisations and SACCOs to support demand creation;
- [Control] Designing a quality control mechanism to assure that the end-users of biogas
systems: o Are capable and willing to manage the biogas plants o Get products that are technically reliable o Can access after sales service and technical support from their biogas suppliers
and biogas technicians based within 30km radius from where they live.
Annual sales (offensive scenario)
0
5000
10000
15000
20000
25000
30000
1 2 3 4 5 6 7 8 9 10Year
Cumulative installations (offensive scenario)
0100002000030000400005000060000700008000090000
100000
1 2 3 4 5 6 7 8 9 10Year
Number of technicians (offensive scenario)
0200400600800
100012001400160018002000
1 2 3 4 5 6 7 8 9 10Year
Number of companies (offensive scenario)
050
100150200250300350400450500
1 2 3 4 5 6 7 8 9 10Year

Kenya Biogas Feasibility Study Page 46
B I O G A S F O R B E T T E R L I F E , A N A F R I C A N I N I T I A T I V E
5.6.3 Objective – defensive scenario The objective of the defensive scenario would be “to increase the performance of the biogas market in Kenya in order to reach an annual sales volume of 15 000 biogas plants in 10 years time (leading to an approximate installed base of 40 000 units by that time – less than a third of the market potential as indicated by the consumer research - and 2000 units in the first 5 years)”. Figure 14 Growth curves to reach 15000 sales per year for 60 percent growth (bandwidth 50 percent to 70 percent)
To reach this objective goals include:
- [Capacity] Developing in the first 5 years a sector of at least 18 competing companies and 72 technicians, capable and fully involved in supplying domestic market biogas systems; after ten years this should grow to 190 companies and 750 technicians.
- [Demand] Developing sufficiently large awareness and market demand to be able to
sell 40 000 biogas plants in 10 years time, an 3500 units in the first 5 years; developing supporting cooperation with microfinance organisations and SACCOs to support demand creation;
Annual sales (defensive scenario)
0
5000
10000
15000
20000
25000
30000
1 2 3 4 5 6 7 8 9 10
Year
Cumulative installations (defensive scenario)
0100002000030000400005000060000700008000090000
100000
1 2 3 4 5 6 7 8 9 10Year
Number of technicians (defensive scenario)
0200400600800
100012001400160018002000
1 2 3 4 5 6 7 8 9 10Year
Number of companies (defensive scenario)
050
100150200250300350400450500
1 2 3 4 5 6 7 8 9 10Year

Kenya Biogas Feasibility Study Page 47
- [Control] Designing a quality control mechanism to assure that the end-users of biogas systems:
o Are capable and willing to manage the biogas plants o Get products that are technically reliable o Can access after sales service and technical support from their biogas suppliers
and biogas technicians based within 30km radius from where they live.
5.7 Biogas marketing strategy development The basic approach for the marketing plan is to opt for a phased approach: Phase 0. The project will need an inception phase during which the project organisation
is built and the operational strategies and financing are put into place to start working.
Phase 1. In the first 5 years, we propose to focus on developing a mature market based
on the present product-market combinations in 5 priority districts (Kiambu, Nyrandarua, Nakuru, Kakamega, Kisii Central). These areas are sufficiently densely populated, with sufficient water, and relatively high numbers of zero grazing units.
After the 5 years, the market for the present product-market combinations is
expected to become saturated, if sales are according to the objectives. Critical aspects: Critical aspects for this first phase will be:
Proven product: It is essential that the first phase of the biogas marketing strategy starts from proven products, with high quality standard (including but not necessarily limited to fixed dome type). Innovation is first of all needed in sales, not in technology. Innovation in new technological products is needed but will not be dominant in this stage.
Technical training: The availability and capacity of biogas technicians needs to be a priority from the start;
Competition: In each district, a critical mass of (more than 1) competing biogas companies and technicians must be developed.
Focus on sales: The biogas companies (and technicians) have to design an effective marketing and sales strategy. Selling the high quality of the initial products (fixed dome of standard sizes) is very important. Clear sales targets are needed.
Phase 2. In the second phase, the success in the priority districts would then be
replicated in other districts in the country. At the same time, market saturation in the first 5 districts will be addressed by introducing new product market combinations, which are currently difficult to predict.
Critical aspects: Critical aspects for this phase will be:
B I O G A S F O R B E T T E R L I F E , A N A F R I C A N I N I T I A T I V E

Kenya Biogas Feasibility Study Page 48
B I O G A S F O R B E T T E R L I F E , A N A F R I C A N I N I T I A T I V E
Innovation: Expand to new product-market combinations to overcome market saturation. Innovation and diversity will be essential.
Geographical expansion: Expand yearly to another 3-5 districts with sufficient potential for biogas.
Quality control: Develop a self-regulated quality control mechanism for biogas plants. An output standard for technical performance of biogas plants should be adopted (preferably by KBS and a sector organisation), and the sector should implement a labelling and branding approach for high quality installations.
Phase 1 has been elaborated in terms of activities and budget. Phase 2 has not yet been elaborated.
5.8 Organisation of the approach The marketing plan is to be centred around the entrepreneurial activities of biogas companies in the districts and their network of technicians in the district and/or the villages. The key thrust of the marketing plan is that a rapidly growing number of biogas companies on the district level are needed and that they need to be involved and supported in their efforts to develop their respective market to its full potential. These biogas companies are fundamentally linked to a growing number of biogas technicians on the village level. The present baseline in which market development of biogas is limited to the capacity of one or two commercial suppliers and a few project based activities (where project offices cooperate with a handful of project oriented biogas suppliers on a market scale of at best a hundred systems per year) should be transformed into a market mechanism of many biogas companies eager and capable to serve thousands of customers per year. By putting these companies (operating essentially on the district level) in the centre of the approach, the present market barriers can be tackled in the most effective way by reputable actors, working in their natural role, driven by logical market forces of sales turnover, cost control and competition. This is demonstrated in the following organogram.
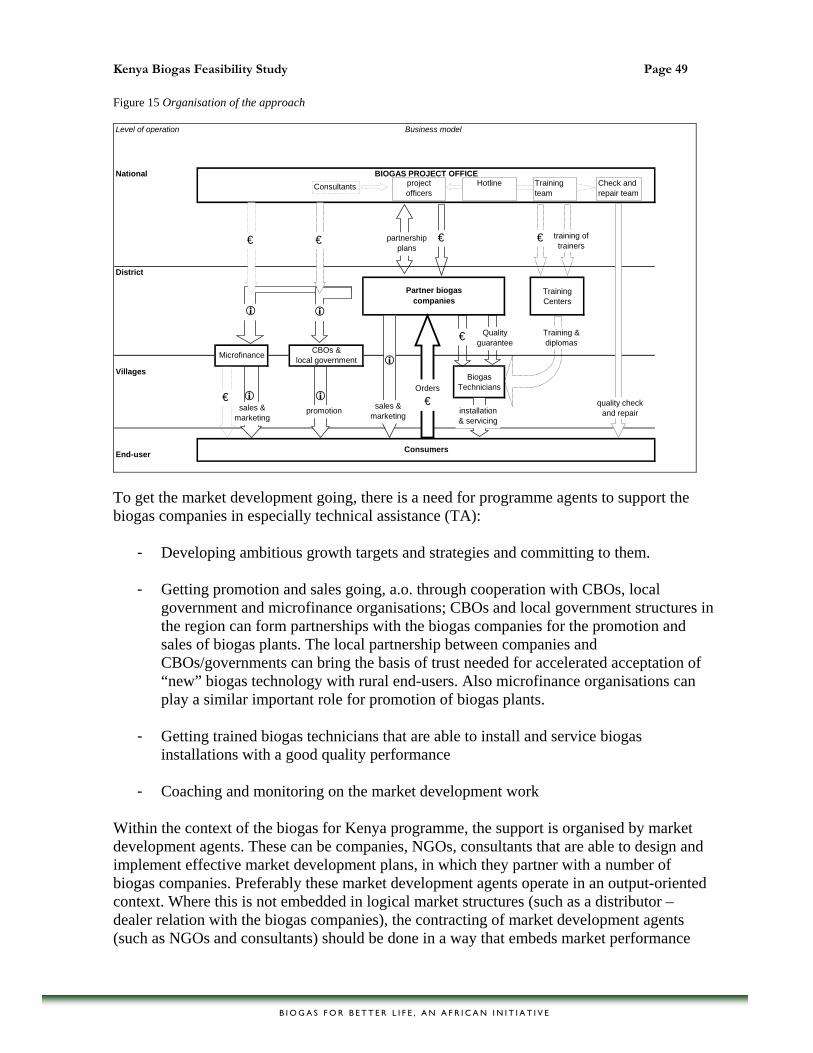
Kenya Biogas Feasibility Study Page 49
B I O G A S F O R B E T T E R L I F E , A N A F R I C A N I N I T I A T I V E
Figure 15 Organisation of the approach Level of operation Business model
National
District
Training Centers
Villages BiogasTechnicians
End-user
CBOs &local government
Consumers
Partner biogascompanies
Microfinance
BIOGAS PROJECT OFFICE
partnershipplans
€
Orders
€installation& servicing
€ Qualityguarantee
Training &diplomas
€
€
€€
Check andrepair team
project officers
Consultants
training of trainers
quality check and repair
Hotline Trainingteam
sales & marketing
sales & marketing
promotion
To get the market development going, there is a need for programme agents to support the biogas companies in especially technical assistance (TA):
- Developing ambitious growth targets and strategies and committing to them. - Getting promotion and sales going, a.o. through cooperation with CBOs, local
government and microfinance organisations; CBOs and local government structures in the region can form partnerships with the biogas companies for the promotion and sales of biogas plants. The local partnership between companies and CBOs/governments can bring the basis of trust needed for accelerated acceptation of “new” biogas technology with rural end-users. Also microfinance organisations can play a similar important role for promotion of biogas plants.
- Getting trained biogas technicians that are able to install and service biogas
installations with a good quality performance - Coaching and monitoring on the market development work
Within the context of the biogas for Kenya programme, the support is organised by market development agents. These can be companies, NGOs, consultants that are able to design and implement effective market development plans, in which they partner with a number of biogas companies. Preferably these market development agents operate in an output-oriented context. Where this is not embedded in logical market structures (such as a distributor – dealer relation with the biogas companies), the contracting of market development agents (such as NGOs and consultants) should be done in a way that embeds market performance

Kenya Biogas Feasibility Study Page 50
objectives in their payment. This could be done through a combination of payment for coaching, marketing, and training, which is linked to the turnover of their supported market, in combination with open competition between market development agents. As part of the programme, training centres in the district are included for technical training of the biogas technicians. This could then develop from incidental technical trainings to integration of biogas construction in the curricula of technical schools. Finally, the structure of competing market development agents and biogas companies, supported based on their performance, clearly demands an auditing role that verifies the existence and quality of reported installations, and that is capable to provide the appropriate feedback from their findings to the market development agents and biogas companies. The programme activities are essentially non-governmental and market driven, but clearly in line with and supported by national government policy to enhance the role of the private sector. Local government may play an important role in promoting biogas systems in the villages, in cooperation with the partner companies.
5.9 Elaboration of capacity strategy Objective The offensive objective is to develop in the first 5 years a sector of at least 30 competing companies and 120 technicians, capable and fully involved in supplying domestic market biogas systems; after 10 years this should grow to 1250 technicians in over 300 companies. The defensive objective would be to get 18 companies, 72 technicians in the first 5 years. Programme elements for first phase
When What Who Year1-2
Select partner companies and technicians in 5 priority districts. Develop partnership feeling and trust with these companies (based on long term vision), design joint marketing plan with each of the partner companies and provide continuous capacity building support and coaching on implementation. Financial support companies in ppp-format (cost-sharing) for marketing, institutional development, etc. Essential will be to build the marketing plans on natural roles for all actors involved. Candidate companies include: - SCODE/spin off company Nakuru - Baraka Energy Renewable Kisii - Reecon Ngong - Equator Fuel Stoves Nanyuki
Biogas project office Consultant
B I O G A S F O R B E T T E R L I F E , A N A F R I C A N I N I T I A T I V E

Kenya Biogas Feasibility Study Page 51
Year 3-4
Analyse bottlenecks in marketing plans, analyse market saturation effects. Modify marketing plans for existing product-market combinations. Develop new marketing plans for new product-market combinations. Special attention to be given to lower cost biogas systems and marketing plans including a dedicated end-user financing component (notably through “cheque-off” systems) .
Biogas project office Consultants (ETC-Energy/Integral/…)
Year1 Design biogas technical training programme for Kenya, including (1) technician training, (2) end-user training.
Technical training support (ETC-TTP, …) SCODE, REECON
Year1-2 Implement biogas technical training programme in dedicated technical trainings Candidate training centres are: - SCODE Nakuru
Technical training support (ETC-TTP, …) SCODE, REECON
Year 3-4 Integrate biogas technical training programme in vocational training institutes in the priority districts Candidate vocational training institutes are: - Nakuru - … Kisii -… etc.
Technical training support (ETC-TTP, …) SCODE, REECON
Year 4
Prepare for expansion to other districts. Special attention should be given to replication (1) by partner companies opening up branches in other districts, and (2) by spontaneous initiatives copying the work of partner companies.
Biogas project office
Year1-4
Monitoring and knowledge management to identify and share success and fail factors, toolboxes, and skill sets.
Biogas project office
5.10 Elaboration of demand strategy Objective Under the offensive objective, annual sales of biogas plants are targeted to develop to 25 000 systems in 10 years time. This will lead to total installations of 65 000 plants after 10 years, and about 6 000 in the first 5 years. In the defensive scenario, the target will be 15 000 annual sales volume. Leading to 40 000 installed systems after 10 years and 3 500 after 5 years.
B I O G A S F O R B E T T E R L I F E , A N A F R I C A N I N I T I A T I V E

Kenya Biogas Feasibility Study Page 52
To reach this, a major effort is needed in marketing and sales. If we assume that a maximum of 25 percent of the potential customers to whom the product has been marketed actually buy a biogas plants, then the marketing and sales campaign needs to reach up to 24 000 (respectively 14 000) households in the first 5 years. Programme elements for first phase
When What Who Year 1
Design and implement awareness campaigns on (1) national level and (2) in the priority districts. Involve in these campaigns as much as possible actors that will play a role in the marketing plans in these districts.
Biogas project office Partner companies
Year 1-4
Develop and implement with partner companies a realistic marketing and sales campaign through their own channels;
Biogas project office Consultant
Year 1-4
Design and implement special sales promotion “actions” (such as “early bird” discounts, demonstration/promotion sites, etc). As much as possible integrate these in the marketing plans of the partner companies.
Biogas project office Partner companies
Year 2-4
Develop cooperation with community based organisations, micro finance organisations, and local government to promote biogas systems to their constituencies, and where feasible have them function as sales front-offices.
Partner companies Biogas project office Consultant
Year 3-4
Where appropriate and supportive for demand creation develop biogas oriented micro finance systems.
Biogas project office
Year 1-4
Monitor sales and take measures in case sales are too slow Biogas project office
5.11 Elaboration of control strategy Objective The objective of this project component is to design a quality control mechanism that assures that the end-users of biogas systems:
- Are capable and willing to manage the biogas plants - Get products that are technically reliable - Can access after sales service and technical support from their biogas suppliers and
biogas technicians based within 30km radius from where they live. For this, there are two main directions:
B I O G A S F O R B E T T E R L I F E , A N A F R I C A N I N I T I A T I V E
Kenya Biogas Feasibility Study Page 53
1. externally plan and control the quality control: in a longer term project, the quality control can be embedded in the project office as responsibility, for instance by providing:
o A subsidy on biogas systems to the companies, if the companies abide by certain design, installation, and after-sales service standards.
o A control team, actively checking on all systems and proposing measures against companies delivering substandard systems.
This direction is complex to implement and difficult to make sustainable, since essentially the project takes responsibility for output quality. Also the extra financial flows may make it difficult and expensive to manage, bringing the risk that this component would dominate the project.
2. take quality control as starting point in the market design (by assuring companies and
technicians are based within the mobility range of the end-users) and as essential component in the partnerships with the private companies, leaving the private companies responsible for quality control, for instance by a combination of:
o Annual certification of biogas technicians that have gone through the training/education successfully and deliver systems without complaints (for instance three levels senior technician / qualified technician / apprentice).
o Design a complaint structure, including a national biogas hotline. This direction is more natural but critically depends on a culture of sufficient transparency and open communication in the field, which needs to respect the quality control capability of the biogas companies.
When What Who Year 1 Design output based quality standards for biogas systems,
including end-terms for biogas technicians training Biogas project office Technical training support (ETC-TTP, …)
Year 1 Design quality control mechanism, as much as possible together with partner companies
Biogas project office Partner companies
Year 1-4
Design, implement and monitor a complaint handling procedure, including a national call-centre for customer support
Biogas project office Consultants
Year 1-4
(Possibly) Implement repair strategy for non functional biogas plants; repair non-functional biogas plants in target districts for discounted price (working together with biogas companies and technicians)
Biogas project office
Year 1-4
(Possibly) Implement a quality control subsidy strategy
Biogas project office
Year 1-4
Assure availability of spare parts in shops within 30 km from the end-users and proper information to the end-users where spare parts can be obtained and how to file a complaint.
Biogas project office Partner companies
B I O G A S F O R B E T T E R L I F E , A N A F R I C A N I N I T I A T I V E
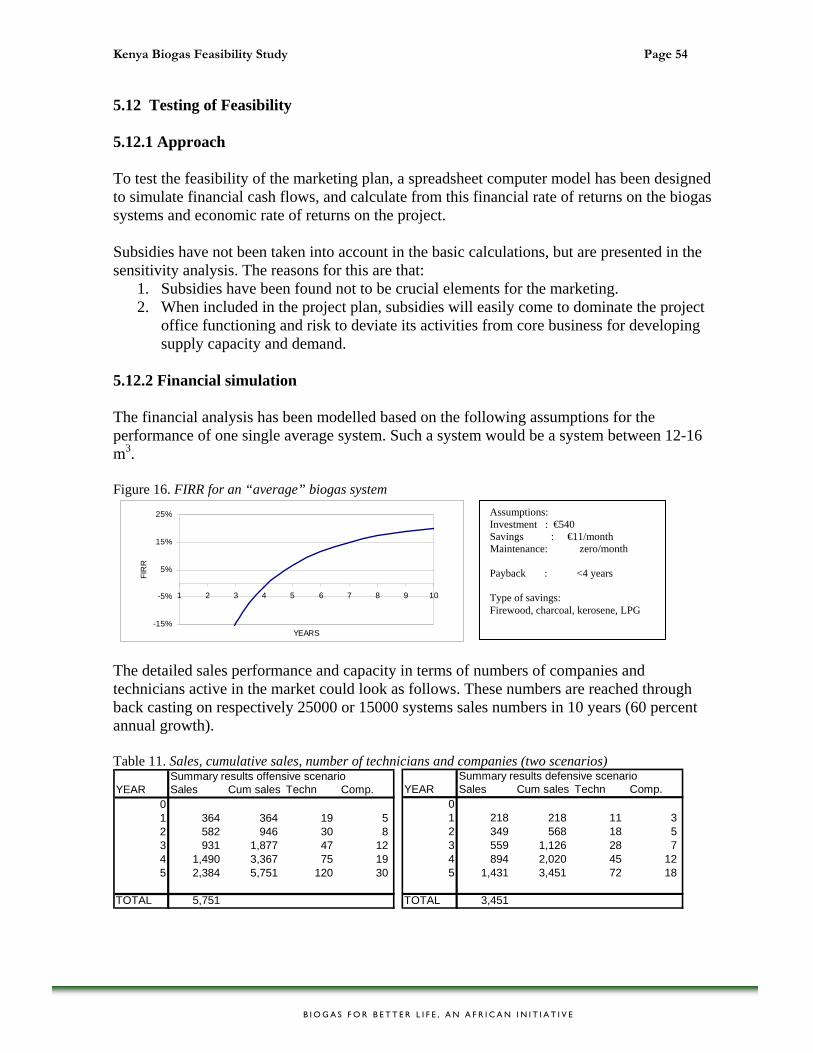
Kenya Biogas Feasibility Study Page 54
5.12 Testing of Feasibility 5.12.1 Approach To test the feasibility of the marketing plan, a spreadsheet computer model has been designed to simulate financial cash flows, and calculate from this financial rate of returns on the biogas systems and economic rate of returns on the project. Subsidies have not been taken into account in the basic calculations, but are presented in the sensitivity analysis. The reasons for this are that:
1. Subsidies have been found not to be crucial elements for the marketing. 2. When included in the project plan, subsidies will easily come to dominate the project
office functioning and risk to deviate its activities from core business for developing supply capacity and demand.
5.12.2 Financial simulation The financial analysis has been modelled based on the following assumptions for the performance of one single average system. Such a system would be a system between 12-16 m3. Figure 16. FIRR for an “average” biogas system
Assumptions: Investment : €540 Savings : €11/month Maintenance: zero/month Payback : <4 years Type of savings: Firewood, charcoal, kerosene, LPG
-15%
-5%
5%
15%
25%
1 2 3 4 5 6 7 8 9 10
YEARS
FIR
R
The detailed sales performance and capacity in terms of numbers of companies and technicians active in the market could look as follows. These numbers are reached through back casting on respectively 25000 or 15000 systems sales numbers in 10 years (60 percent annual growth). Table 11. Sales, cumulative sales, number of technicians and companies (two scenarios)
Summary results offensive scenarioYEAR Sales Cum sales Techn Comp.
01 364 364 19 5 2 582 946 30 8 3 931 1,877 47 12 4 1,490 3,367 75 19 5 2,384 5,751 120 30
TOTAL 5,751
Summary results defensive scenarioYEAR Sales Cum sales Techn Comp.
01 218 218 11 3 2 349 568 18 5 3 559 1,126 28 7 4 894 2,020 45 12 5 1,431 3,451 72 18
TOTAL 3,451
B I O G A S F O R B E T T E R L I F E , A N A F R I C A N I N I T I A T I V E

Kenya Biogas Feasibility Study Page 55
In reality the programme could start in five areas, three on the road from Nairobi to Nakuru, and two in more west wards directions. These areas are sufficiently densely populated, with sufficient water and relevant numbers of zero grazing. Table 12 Population, livestock and estimated number of farmers with livestock District/Division Population Families Livestock Numbers farmers with livestock
Kiambu 744,010 148,802 144,004 36,001 Nyandarua (Kinagop) 432,107 86,421 279,239 69,810 Nakuru 1,187,039 237,408 333,785 83,446 Kakamega 603,422 120,684 158,259 39,565 Kisii 491,786 98,357 107,071 26,768
Totals 3,458,364 691,673 1,022,358 255,590 In these areas live over half a million families with more than a million heads of livestock. With an average of 4 animals (high estimation), at least a quarter million people have livestock. In the first phase it must be feasible to serve this area without reaching a saturation point in the first 5 years. Based on the assumptions that each company with four technicians will sell and install the above numbers of digesters, it is possible to model the total sales of all companies. We have presented the companies total sales numbers and related them to start up costs and running costs of the program in figure 15. The total costs are indicated as percentage of total sales. Table 13. Total company sales versus biogas support program costs (two scenarios) EURO Summary Costs offensive scenario EUROComp Sales start up Mgt & Mon. Promotion Training TOTAL
94,655 94,655 202,560 - 202,560 101,280 7,194 311,034 324,096 - 210,662 81,024 4,165 295,851 518,554 - 219,089 64,819 6,437 290,345 829,686 - 227,853 51,855 10,601 290,309
1,327,498 - 236,967 41,484 17,038 295,489
3,202,394 94,655 1,097,131 340,463 45,434 1,577,683% of Sales 3% 34% 11% 1% 49%
EURO Summary Costs defensive scenario EUROComp Sales start up Mgt & Mon. Promotion Training TOTAL
94,655 94,655 121,536 121,536 60,768 4,165 186,469 194,458 126,397 48,614 2,650 177,662 311,132 131,453 38,892 3,786 174,131 497,812 136,712 31,113 6,437 174,261 796,499 142,180 24,891 10,223 177,293
1,921,436 94,655 658,278 204,278 27,261 984,472 % of Sales 5% 34% 11% 1% 51%
Program costs have been modelled as percentage of the anticipated sales numbers. Management and Monitoring costs start one on one with turnover of sales. This figure will gradually improve over the years with a reduction of 35 percent annually. The promotion will start with a budget of 50 percent of the anticipated turnover amount, reducing every year with 50 percent in percentage of anticipated turnover. Training cost is anticipated to be US$500 or €378 EUR per technician trained. Figure 17 Visual presentation of Program Costs and Market Sales (two scenarios)
B I O G A S F O R B E T T E R L I F E , A N A F R I C A N I N I T I A T I V E

Kenya Biogas Feasibility Study Page 56
Program Costs & Market Sales (offensive)
-200.000400.000600.000800.000
1.000.0001.200.0001.400.000
0 1 2 3 4 5Years
EU
R
Yearly Market Sales
Yearly ProgramCosts
Program Costs & Market Sales (defensive)
0
200000
400000
600000
800000
1000000
0 1 2 3 4 5Years
EUR
Yearly Market SalesYearly Program Costts
5.13 Economic simulation The economic analysis has been modelled based on the following assumptions for the performance of one single average system. Such a system would be a system between 12-16 m3. Figure 18 EIRR for an “average” biogas plant
-15%
-5%
5%
15%
25%
35%
1 2 3 4 5 6 7 8 9 10
YEARS
EIR
R
Assumptions: Investment: €540 Savings: €11/month Maintenance : 0 /month CO2/system : 5 ton/year;10 USD/ton 3.400 KES/year Payback : 3 years Type of savings: Firewood, charcoal, kerosene, LPG
B I O G A S F O R B E T T E R L I F E , A N A F R I C A N I N I T I A T I V E

Kenya Biogas Feasibility Study Page 57
For reasons of simplicity, pragmatism and transparency we have chosen to only quantify CO2 as additional income in cash flow and IRR calculations at system level from the economic point of view. In combination with the above estimated offensive and defensive roll out scenario’s this will give a positive economic internal rate of return in about 7 years climbing to about 10 percent in ten years and about 20 percent in twenty years. Figure 19 EIRR for the program (two scenarios)
-5%
0%
5%
10%
15%
20%
25%
0 2 4 6 8 10 12 14 16 18 20
Years
EIR
R
OffensiveDefensive
5.14 Sensitivity analyses – subsidies and grants If we include subsidy for end users the performance of a system from both financial and economic perspective will further improve. Figure 20 FIRR for an “average” biogas plant (25 percent and 50 percent subsidy)
FIRR
-15%
-5%
5%
15%
25%
35%
45%
1 2 3 4 5 6 7 8 9 10
YEARS
FIR
R
25% subsidy
50% subsidy
Obviously, the program costs will also increase accordingly for the two scenarios. Table 13. Biogas company sales versus biogas support program costs with subsidy (two scenarios) EURO Program TOTALComp Sales offensive scenario 25% 50% +25% sub +50% sub
94,655 94,655 94,655 202,560 311,034 50,640 101,280 361,674 412,314 324,096 295,851 81,024 162,048 376,875 457,899 518,554 290,345 129,638 259,277 419,983 549,622 829,686 290,309 207,422 414,843 497,731 705,152
1,327,498 295,489 331,874 663,749 627,363 959,238
3,202,394 1,577,683 800,598 1,601,197 2,378,281 3,178,880 % of Sales 49% 25% 50% 74% 99%
Subsidy TOTAL with subsidy
EURO Program TOTALComp Sales defensive scenario 25% 50% +25% sub +50% sub
94,655 94,655 94,655 121,536 186,469 30,384 60,768 216,853 247,237 194,458 177,662 48,614 97,229 226,277 274,891 311,132 174,131 77,783 155,566 251,914 329,697 497,812 174,261 124,453 248,906 298,714 423,167 796,499 177,293 199,125 398,249 376,418 575,543
1,921,436 984,472 480,359 960,718 1,464,831 1,945,190 % of Sales 51% 25% 50% 76% 101%
Subsidy TOTAL with subsidy
B I O G A S F O R B E T T E R L I F E , A N A F R I C A N I N I T I A T I V E

Kenya Biogas Feasibility Study Page 58
B I O G A S F O R B E T T E R L I F E , A N A F R I C A N I N I T I A T I V E
However, the control costs to administer the subsidy would substantially increase the total costs in a way which is difficult to predict. Subsidies might detract attention from the actual priorities to further build installation capacity and promote segmentation of the market. Therefore economic return of the whole program might decrease. For example with a 25 percent handling cost, the EIRR of the program over 10 years would go down to 6 percent (over 20 years 16 percent). Finance is available in Western Kenya. However, it is access to finance that might be a limiting factor for a number of farmers to buy a system. It is obvious that the cash flow performance will improve for these farmers when they can defer payments to the future. However the level of interest will at the end of the day determine if the total cash flow and thus the FIRR will be influenced positively. End-users might be reluctant to enter into (further) financial obligations or might have other priorities to use possible credit sources for. Given the strong competition of banks and micro finance institutions, and the eagerness of some players to develop new and sometimes unsecured finance products, it might be interesting to explore co-operation of promotion activities with the financial sector. KUSCCO and SACCOs have already entered the biogas segment of their market. Some banks and micro finance institutions are interested to explore this opportunity when biogas gets more attention from the public.
5.15 Conclusion Start up costs of the support program are about €100k, with further annual expenditures of about €300k resulting in about €1.6 million in the offensive scenario. In a defensive scenario, total costs will end up to be around € 1 million. The finance costs for this program will be approximately € 275 per installation or less than 50 percent of the commercial sales value. Both the offensive and defensive scenarios are financially and economically feasible based on the assumptions made. The main challenge to the feasibility of the program lies in following the growth curves in terms of sales, and especially the number of involved companies and trained technicians. The potential seems to exist in Kenya, a growth rate of 60 percent seems feasible. It will be up to the program to deliver. Strong attention for subsidies and finance to leverage the outcome of the program might defer the attention of the actual and perhaps new actors away from developing effective cooperation with high numbers of local private sector players and capacity building.

Kenya Biogas Feasibility Study Page 59
B I O G A S F O R B E T T E R L I F E , A N A F R I C A N I N I T I A T I V E
7. CONCLUSIONS AND RECOMMENDATIONS The team has presented a market oriented program to support a biogas market in Western Kenya. The team recommends implementing this market oriented program in 3 phases: an inception phase (phase 0), a start up phase (phase 1) in a limited area for a period of five years, and an expansion phase (phase 2) to new areas in other districts. The team recommends starting phase 1 from five regional hubs in Kiambu, Nyrandarua, Nakuru, Kakemega, Kisii, to build and expand on actual commercial practices of the private sector. The strategy of the proposed program is to focus on product differentiation (both smaller and larger systems) and consequent market segmentation. The team recommends making use of the fixed dome as most popular and proven technology. The team also recommends close monitoring of new product innovations on their performances and possible application in new market segments. A key element in the product definition is to look critically at cost of material which seems exceptionally high in Kenya. The team concluded that an objective of the program to install 6000 systems in five years with 30 companies and 120 technicians in 5 districts in Western Kenya is feasible given the assumptions. The financing plan for such a program requires a total budget of about € 1.6 million, corresponding with technical support component of about € 275 per system installed. The team recommends not to include subsidies for end users at this stage (except for possibly promotional “early bird” discounts) and to explore the possibilities of the market forces to further expand the installation capacity with local entrepreneurs and increase the awareness of end-users to realise the above numbers.
Kenya Biogas Feasibility Study Page 60
B I O G A S F O R B E T T E R L I F E , A N A F R I C A N I N I T I A T I V E
8. Annexes
Annex 1: Names and Abbreviations
Annex 2: Desk Study
Annex 3: District Reports These will be sent as separate files.


