Policy Research Working Paper 6257 Promoting Handwashing Behavior in Peru e Effect of Large-Scale Mass-Media and Community Level Interventions Sebastian Galiani Paul Gertler Alexandra Orsola-Vidal e World Bank Sustainable Development Network Water and Sanitation Program November 2012 Impact Evaluation Series No. 74 WPS6257 Public Disclosure Authorized Public Disclosure Authorized Public Disclosure Authorized Public Disclosure Authorized
Transcript
Policy Research Working Paper 6257
Promoting Handwashing Behavior in Peru
The Effect of Large-Scale Mass-Media and Community Level Interventions
Sebastian Galiani Paul Gertler
Alexandra Orsola-Vidal
The World BankSustainable Development NetworkWater and Sanitation ProgramNovember 2012
Impact Evaluation Series No. 74
WPS6257P
ublic
Dis
clos
ure
Aut
horiz
edP
ublic
Dis
clos
ure
Aut
horiz
edP
ublic
Dis
clos
ure
Aut
horiz
edP
ublic
Dis
clos
ure
Aut
horiz
ed
Produced by the Research Support Team
Abstract
The Impact Evaluation Series has been established in recognition of the importance of impact evaluation studies for World Bank operations and for development in general. The series serves as a vehicle for the dissemination of findings of those studies. Papers in this series are part of the Bank’s Policy Research Working Paper Series. The papers carry the names of the authors and should be cited accordingly. The findings, interpretations, and conclusions expressed in this paper are entirely those of the authors. They do not necessarily represent the views of the International Bank for Reconstruction and Development/World Bank and its affiliated organizations, or those of the Executive Directors of the World Bank or the governments they represent.
Policy Research Working Paper 6257
This paper analyzes a randomized experiment that uses novel strategies to promote handwashing with soap at critical times in Peru. It evaluates a large-scale intervention that includes a mass media provincial campaign and a district-level community component. The analysis finds that the mass media intervention alone had no significant effect on exposure to the handwashing promotion campaign messages, and therefore no effect on handwashing knowledge or handwashing behavior. In contrast, the community-level intervention, a more comprehensive intervention that included several community and school activities in addition to the
This paper is a product of the Water and Sanitation Program (WSP), Sustainable Development Network. WSP is a multi-donor partnership created in 1978 and administered by the World Bank to support poor people in obtaining affordable, safe, and sustainable access to water and sanitation services. It is part of a larger effort by the World Bank to provide open access to its research and make a contribution to development policy discussions around the world. Policy Research Working Papers are also posted on the Web at http://econ.worldbank.org. For more information, please email Sebastian Galiani at [email protected] or Alexandra Orsola-Vidal at [email protected].
communications campaign, was successful in reaching the target audience with handwashing promotion messages and in improving the knowledge of the treated population on appropriate handwashing behavior. Those improvements translated into higher self-reported and observed handwashing with soap at critical junctures. However, no significant improvements in the health of children under the age of five were observed. The results are consistent with earlier literature, which indicates that substantively changing behavior to improve health is a complex task requiring intensive and more personalized interventions.
Promoting Handwashing Behavior in Peru: The Effect of Large-Scale Mass-Media and Community Level Interventions†
1 University of Maryland. 2 University of California, Berkeley. 3 World Bank, WSP. † This trial is registered, number NCT01465204. Sebastian Galiani is Professor of Economics at the University of Maryland and Alexandra Orsola-Vidal is Senior Impact Evaluation Specialist at the World Bank. They served as country investigators for the Peru Global Scaling Up Handwashing Project impact evaluation. This evaluation is part of a cross-country study led by Bertha Briceño (in its early stages led by Jack Molyneaux) together with Alexandra Orsola-Vidal and Claire Chase. Professor Paul Gertler has provided guidance and advice throughout the project. Global advisors also include Sebastian Galiani, Jack Colford, Ben Arnold, Pavani Ram, Lia Fernald, and Patricia Kariger. The authors are grateful to Rocio Florez, the project task team leader in Peru, Glenn Pearce-Oroz, Regional Team Leader for WSP-Latin America and Caribbean region, and to Eduardo Perez, overall task team leader. We also thank Nicolas Ajzenman, Andres Drenik, Laura Jaitman and María Lucía Yanguas for their excellent research assistance. Generous financial support was provided by the Bill and Melinda Gates Foundation.
2
1 Introduction Hygiene is essential to the public health mission of reducing the transmission and
consequences of disease. The two leading causes of childhood mortality worldwide are
diarrheal disease and acute respiratory infections,4 accounting for two-thirds of the deaths of
children under age five.5 Both of these categories of illness are closely associated with
inadequate hygiene. In addition, chronic parasitic infections and diarrhea can lead to anemia,
which further hinders children’s development.6 The provision of safe water and sanitation,
and improved hygienic behaviors more generally, has the potential to alleviate the proximate
causes of these illnesses and thereby improve health.7
Medical evidence suggests that the hands are the main transmitters of diarrhea and
respiratory infections. As such, they constitute disease vectors carrying respiratory
microorganisms and fecal material into the domestic environment of the susceptible child.8
Health experts recommend handwashing with soap as a critical action in protecting public
health because it is a mainstay in infection control.9 Yet, rates of handwashing with soap at
critical times remain low throughout the world, even when both soap and water are
available.10 In a sample of developing countries, the observed rates of handwashing with soap
4 Thirty-five percent of these deaths are due to diarrheal disease and 32 percent are due to acute respiratory infections. It was estimated that 21 percent of deaths in the 42 countries with the highest mortality are due to pneumonia (Black et al. 2003). 5 WHO 2002. 6 Curtis and Cairncross 2003. 7 See, for example, Esrey et al. 1991 and Galiani et al. 2005. 8 Hendley et al. 1973, WHO 2003. 9 Most parasites live and breed in feces and are transmitted to humans when ingested or through the hands. Parasitic infestations pose serious threats to young children and are a cause of child mortality (World Bank 2005). Among those who survive, parasitic infestations are associated with diarrhea and micronutrient malnutrition, which often leads to iron-deficiency anemia, protein-energy malnutrition, and enlargement of the liver and spleen (see, among others, Anderson and May 1991; and Hesham et al. 2004). Currently, anemia, which leads to slow cognitive development, is a widespread global health problem (see, among others, Nokes et al. 1992, and Pollit 1990). In addition, some respiratory tract infections, including the SARS-causing corona virus, are transmitted via the fecal-oral route or simply on hands (World Bank 2005). Hence, adequate handwashing is a primary barrier to the transmission of enteric pathogens, as hands can be cleansed of viruses and bacteria by washing with soap (Curtis and Cairncross 2003), (Faix 1987; Ansari et al. 1989; Luby et al. 2001; Gibson et al. 2002; Montville et al. 2002; Larson et al. 2003). 10 Scott et al. 2003.
3
range between 0 and 34 percent after defecation and 3 and 37 percent after cleaning up a
child.11
This paper focuses on handwashing promotion intervention, which attempts to improve child
health by changing this key hygiene-related behavior rather than by implementing large and
costly infrastructure investments in water supply or sanitation. In particular, we analyze the
Global Scaling Up Handwashing Project in Peru, a large-scale intervention that aims to
generate and sustain handwashing with soap behavior at critical junctures among mothers,
caregivers, and children up to 12 years old in rural households. By trying to change the
underlying factors that determine handwashing behavior (such as knowledge, beliefs, and
accessibility of soap and water) among the target population, which is expected to result in
improved handwashing behavior, the program tries to disrupt the causal chain that links poor
hygiene with parasitic and microbiological disease transmission and thus ill health in children.
Thereby, the study focuses on the following relevant outcomes: exposure to the intervention,
changes in determinants of handwashing behavior (knowledge, beliefs, and access
to/placement of soap and water), handwashing behavior (self-reported and observed),
environmental contamination, and child health. To measure these behaviors and outcomes,
we combined different quantitative and qualitative data collection techniques, including
detailed questionnaires, structured observations, microbiological analysis of samples of
children’s stools, capillary blood, and drinking water collected in the field, and
anthropometric measures performed by health experts.
The Global Scaling Up Handwashing Project in Peru intervention consisted of two main
components:
• a province-level mass media campaign; and
• a more comprehensive district-level community treatment that included, in addition to
the media campaign, training of community agents; capacity building of mothers,
caregivers, and children; and the inclusion of handwashing promotion as part of
primary school curricula.
11 World Bank 2005.
4
The project also included supportive activities such as partnership building and policy reform
that aimed to create an enabling environment capable of inducing and sustaining appropriate
handwashing behavior. This study does not evaluate these enabling environment activities,
but focuses exclusively on the effect of the mass media campaign and community treatment.
The results of this evaluation show that the mass media intervention alone was not effective in
reaching the targeted population with the handwashing messages and therefore failed to
improve knowledge and beliefs of mothers and caregivers regarding appropriate
handwashing, or to generate a behavior change that could improve child health. However, the
district-level interventions also analyzed in this paper proved to be effective in reaching
the targeted audience with handwashing promotional messages. The community-level
treated group was 19.4 percent more likely to report having received the intervention
messages through at least one communication channel than the control group.
Handwashing campaigns and promotional events at the community level and one-to-one
activities seemed to have successfully transmitted the importance of handwashing with soap.
Not only did the message reach the treated population, but it also improved caregivers’
knowledge about the best way to wash hands by 6 percent, and increased the availability of
soap and water in the household by 8.4 percent. These improvements led to a statistically
significant increase in self-reported and observed handwashing with soap before food contact
as compared to the control groups. However, this behavior change did not translate into better
child health. No significant impact was found on parasite and bacterial prevalence in stools
and drinking water (respectively), which is consistent with the fact that there were no
treatment effects on diarrhea, nutrition, or anemia.
These results are consistent with previous studies in the literature of randomized
handwashing promotion campaigns, which typically find that handwashing does reduce
diarrhea in children under five years old, but those campaigns usually require intensive and
controlled interventions. For example, Ejemot et al.12 reviewed 14 randomized trials,
concluding that handwashing programs resulted in a 39 percent reduction in diarrhea
12 Ejemot et al. 2009.
5
episodes in children residing in institutions in high-income countries and a 32 percent
reduction in such episodes in children living in communities in low- or middle-income
countries. The authors suggest that the significant reduction is comparable to the effect of
providing clean water in low-income areas. However, the community or institutional
interventions studied required a high cost of monitoring and implementing and hence these
authors (Ejemot et al. (2009)) conclude that larger scale and less demanding pilots should be
performed in developing countries. Luby et al.13 also showed that handwashing with soap
reduces the incidence of acute respiratory tract infections, as well diarrhea, as a result of
implementing an intensive and small-scale community-level intervention.14
Others have studied school-level interventions. Bowen et al.15 evaluated a school program in
China, in which 87 Chinese schools were randomized to a handwashing program that
included training for teachers, in-class sessions, encouraging handwashing at school, and a
pack for the children’s families that included soap; or to an expanded intervention
(handwashing program, soap for school sinks, and peer hygiene monitors).16 They found that
13 Luby et al. 2005. 14Luby et al. (2005) studied the causal impact of handwashing with soap in child health through a randomized control trial in Pakistan. Fieldworkers visited households weekly for a year to encourage handwashing with soap by residents and to record symptoms in all households. The authors found that children younger than 5 in households that received soap and handwashing promotion had a 50 percent lower incidence of pneumonia, and children younger than 15 had a 53 percent lower incidence of diarrhea than the children in control households. 15 Bowen et al. 2007. 16 Bowen et al. (2007) evaluated the Procter & Gamble’s Safeguard promotion program. Teachers presented the program to first-grade children during a single 40-minute classroom session. Children were instructed in handwashing behavior and asked to wash their hands before meals and after using the toilet. The program included a single two-hour training session for each first-grade teacher by Procter & Gamble staff and provision of a teacher’s pack, animated videotape for classroom use, and a take-home pack for each student. The teacher’s pack contained a guidebook outlining five handwashing steps (wet hands, lather fingers, lather palms and backs of hands, rinse, and dry with a clean towel) and basic information about infectious disease transmission. It also contained five posters describing handwashing procedures and five wall charts designed for classroom hygiene competitions. The student take-home pack included a hygiene board game, a parents’ booklet about handwashing, and a 50-gram bar of Safeguard soap. Although no significant differences in symptoms were found among in-class illnesses, absence incidence decreased in 44 percent for the standard intervention and in 42 percent for the extended treatment. The decrease in days absent was statistically significant only for the extended treatment (decrease of 52 percent). Syndrome-specific absence incidence also differed between groups: students in the standard intervention group were less likely than control students to be absent due to fever and students in the expanded intervention group were less likely to be absent due to headaches or stomachaches than the control students.
6
the expanded intervention significantly reduced syndrome-specific absence incidence
(absence due to stomachaches or headaches).
To the best of our knowledge, the studies that so far have found handwashing programs to
have significant effects on child health have focused on interventions that impose controlled
conditions in small populations over short time periods. These studies are akin to efficacy
trials in drug development, which evaluate the impact of a specific intervention under ideal
conditions. In most published handwashing studies, the participants are visited each week
over a period of months. This style of intense promotion can cause important behavior
changes that we would not necessarily expect under non-study conditions where interaction
with handwashing promoters is less frequent. Thus, although intensive handwashing
interventions have proven effective in reducing diarrhea and acute lower respiratory
infections (ALRIs), it has not been proven that similar results could be obtained if those
interventions were implemented at scale. This paper, however, studies the effectiveness of a
national handwashing campaign to learn the impacts of large-scale handwashing
interventions in a real-world context.
Thus, this paper is the first to assess the effect of a large-scale handwashing intervention on a
wide range of health indicators. Furthermore, to the best of our knowledge, we are also the
first to study other intermediate outcomes, such as the campaigns’ effectiveness and behavior
change, which provides important insights on the full theoretical causal chain of disease
transmission and ill health.17
The rest of the paper is organized as follows. Section 2 details the program components. In
section 3 we explain the experimental design. Section 4 describes relevant issues
concerning the data and sampling procedure and presents some descriptive statistics.
Section 5 describes the results of the baseline balance checks and provides an analysis of
the panel sample attrition. Section 6 describes the methodological framework. In section 7
we show and interpret the main results of the interventions. Section 8 concludes.
17See Cattaneo et al. (2009) for another example of a study of the causal path of an intervention on child health. In this case, the authors studied the effect of improving the floor of houses with cement.
7
2 Background and Description of the Program In response to the preventable threats posed by poor sanitation and hygiene, the Water and
Sanitation Program (WSP) launched two large-scale projects in December 2006—the Global
Scaling Up Handwashing Project and the Global Scaling Up Rural Sanitation Project—to
improve child health and welfare outcomes of rural households around the world. These
projects were implemented by local, regional, and national governments, with technical
support from WSP.
The Global Scaling Up Handwashing Project implemented in Peru, Vietnam, Tanzania, and
Senegal, borrowed from commercial and social marketing to promote better hygiene.
Communication campaigns and messages developed for this project were designed and
strategically delivered across multiple integrated channels and in various settings in order to
“surround” target audiences with handwashing promotion. Formative research conducted
during 2007 with mothers and caregivers revealed that soap was not available for
handwashing in most households in Peru, that there was a common belief that washing hands
with water was sufficient, and that people did not know the critical times to wash hands with
soap. In fact, the results of the structured observations in the baseline showed that soap was
used in only 16 percent of the events in which it would have been necessary, that 20 percent of
people were observed to wash their hands after fecal contact,18 and that 25 percent of people
washed their hands before eating.19 Thus, the programs studied had sufficient scope to
improve the hygiene habits of the treated households. These rates of soap use are lower than
the observed rates in more developed peri-urban areas (47 percent after cleaning up a child in
Northern England20) and higher than the rates observed in poorer countries (10 percent after
cleaning up a child in Nigeria, 3 percent after defecation in Ghana, or 1 percent in after toilet
use in urban Burkina Faso21).
18Fecal contact includes defecation, toileting of any kind, and cleaning a child who has defecated. 19At the baseline, structured observations of handwashing behavior were conducted in Peru as part of this study, in a subsample of 159 households (see Galiani and Orsola-Vidal 2010). 20 Curtis et al. 2003. 21 World Bank 2005.
8
In Peru, the Global Scaling Up Handwashing project was a national intervention implemented
in a total of approximately 800 districts randomly selected (in 104 provinces). The project’s
primary target audience consisted of mothers of reproductive age (15 to 49 years), caregivers
of children under five years old, and children up to 12 years old. The project’s main objective
was to improve handwashing behavior among the target audience in order to better the
health of children under five. Children under five are the most susceptible to serious
consequences from diarrhea and respiratory infection. These infections are usually
transferred from dirty hands to food or water sources, or by direct contact with the mouth.
Diarrheal disease and respiratory infection among children under five can be prevented by
their mothers/caregivers washing their hands with soap at critical times, such as before
feeding a child, cooking, or eating, and after using the toilet or changing a child.
The intervention comprised two main components that were delivered at different
administrative levels: a mass media plus direct consumer contact treatment at province level,
and a community treatment at the district level. The activities included under each component
of the project are as follows.
2.1 Province-Level Intervention: Mass Media plus Direct Consumer Contact Treatment
A mass media plus direct consumer contact (DCC) communication campaign was
implemented at the provincial level. Because research conducted before project implantation
revealed that most people did not use soap when washing hands and that many mothers and
caregivers thought using soap was not necessary, the communication strategy focused on the
issue of nonuse. The campaign emphasized the importance of the availability and use of soap
for handwashing, and the need to wash hands with soap immediately before cooking or
eating and after fecal contact (going to the bathroom and changing a baby).
The mass media plus DCC campaign targeted mothers, caregivers, and children, and the main
communication channel was broadcast radio. Radio spots, lasting between 30 and 50 seconds
each, were aired from five to nine times daily during the months of September to December
9
2009, April to June 2010, and August to November 2010.22 The campaign also included print
materials such as posters with reminders of key junctures in which to wash hands with
soap, comic books, and brochures featuring a superhero cartoon character (Super Jaboncin)
created especially for the campaign. Additionally, promotional events such as street
parades, games, and local theater performances were conducted in public spaces, where Super
Jaboncin came to life to promote handwashing and the use of soap. The jingles developed for
the radio spots were used as the events’ background music, ensuring that the target audience
received the same messages from multiple channels. On average, the events lasted from two to
three hours and had audiences of 100 to 1,000 women and children.
2.2 District-Level Intervention: Community Treatment
The community (or community and school) intervention was conducted at the district level
and consisted of:
• a mass-media plus DCC campaign;
• training of trainers of community-based agents of change such as teachers, medical
professionals, and community leaders;
• capacity building and provision of educational handwashing sessions for mothers,
caregivers, and children; and
• handwashing curricula in select primary schools.
With all these activities, the community intervention aimed to achieve an integral and
sustainable change through different actors and channels.
The communications campaign included broadcast radio advertisements with the same
messages and frequencies described in the province-level treatment, and print materials such
as posters with reminders of key junctures in which to wash hands with soap. It also included
print materials featuring Super Jaboncin, the superhero cartoon character developed for the
campaign. As part of the communications strategy, the community activities were
intentionally tied to the handwashing promotional events. The events took place in different
22 According to the baseline survey held for this study, 79 percent of the households had a radio, CD, or cassette player (see Appendix 1 for more information on household assets).
10
venues in the district and the audience might have been different each time or some people
might have attended several events.
In addition to the communication campaign, the community treatment included handwashing
education sessions with groups of mothers, caregivers, and children. During these
handwashing sessions, community-based agents, trained for such a purpose, demonstrated
how to properly wash hands with soap, explained the critical junctures in which we must
wash our hands with soap, and provided information on the extent to which improved
handwashing behavior impacts infant health and welfare. The specialists in charge of
conducting the handwashing promotional sessions included schoolteachers, health promoters,
and local leaders who were trained as part of the community treatment to play a mediating
role in influencing mothers’, caregivers’, and children’s handwashing behavior.
In the districts that received the community treatment, a school-level treatment was delivered
to the main primary schools in each district. In these schools, handwashing behavior was
introduced as part of the school curricula. The activities included designating a place in the
classroom for soap, performing regular handwashing practices in groups each day, weekly
handwashing promotion classes, and other children’s activities such as singing songs and
drawing posters. This school component of the community intervention tried to transmit the
handwashing message to households of children attending the treated schools by including
handwashing education in their formal studies.
These components were implemented by national, regional, and local governments. The
Water and Sanitation Program (WSP) provided technical assistance, but the intervention was
mainly conducted by public and private partners who integrated these activities into the
governments’ ongoing projects.23
23The Global Scaling Up Handwashing Project also included additional activities that were not evaluated as part of this study. These activities involved partnership building between public and private agents, capacity building of government entities, and policy reforms. These activities aimed to create an enabling environment that facilitated and sustained handwashing behavior with soap. These activities were assessed separately and the results published in a different study (Favin 2011).
11
3 Evaluation Study Design Estimating the causal relationship between the treatment and the outcomes of interest
requires the construction of an accurate counterfactual—that is, a comparison group that
shows what would have happened to the treatment group in the absence of the
intervention. To account for factors external to the intervention, counterfactuals are
created using comparison groups (control) that are equivalent to the treatment group on
every dimension (observed and unobserved) but the treatment. Because a good
counterfactual approximates what would have happened to the treatment group in the
absence of the treatment, any differences in the average outcome measurements of the
treatment and control groups following the implementation can be understood as the
causal effect of the intervention. The randomization process, by which a random selection
of communities receives the treatment and the remaining serve as controls, generates an
appropriate counterfactual for the purposes of the impact evaluation.
Thus, to assess the causal impact of each of the project components on a set of relevant
variables, we conducted a controlled randomized trial comprising the province-level
treatment as well as the district-level intervention, taking into consideration the general
community treatment and its school component.
12
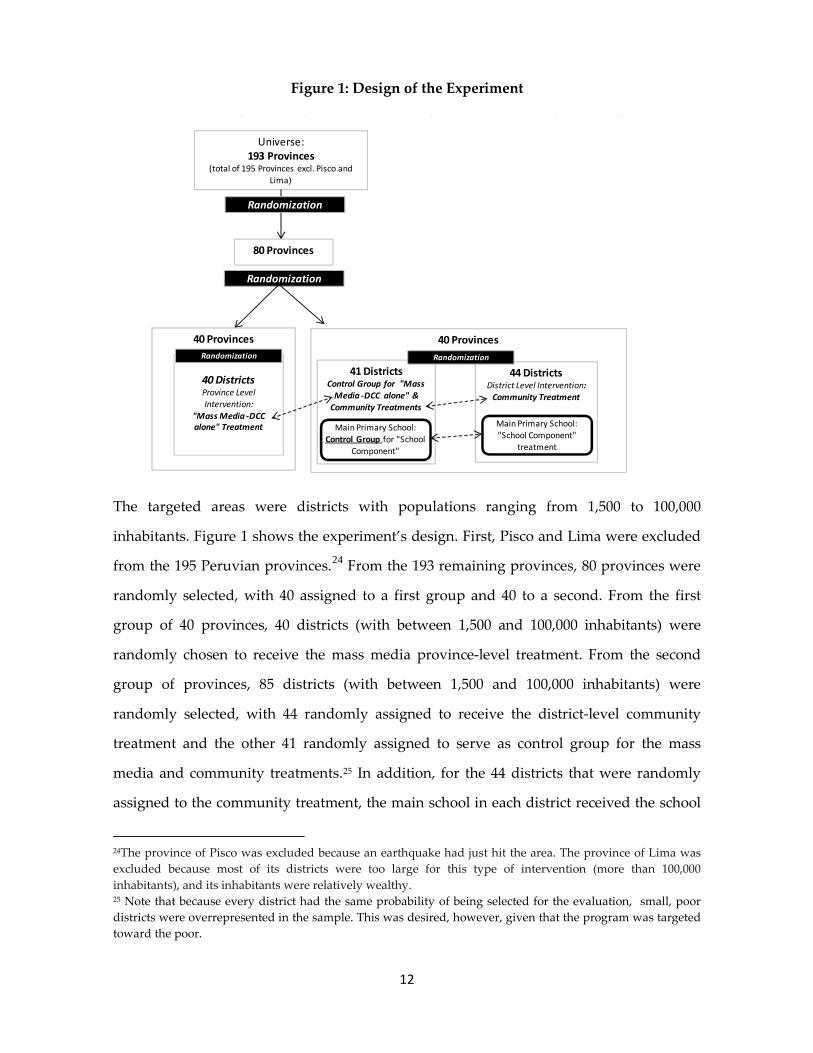
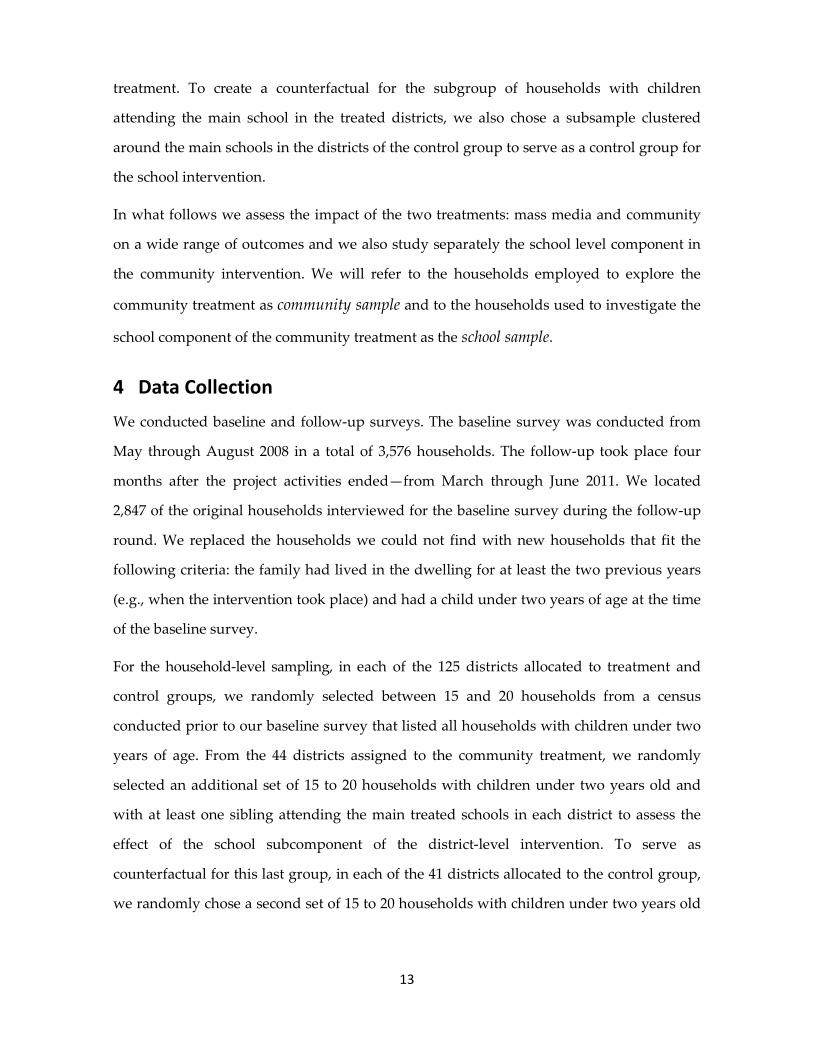
Figure 1: Design of the Experiment
The targeted areas were districts with populations ranging from 1,500 to 100,000
inhabitants. Figure 1 shows the experiment’s design. First, Pisco and Lima were excluded
from the 195 Peruvian provinces.24 From the 193 remaining provinces, 80 provinces were
randomly selected, with 40 assigned to a first group and 40 to a second. From the first
group of 40 provinces, 40 districts (with between 1,500 and 100,000 inhabitants) were
randomly chosen to receive the mass media province-level treatment. From the second
group of provinces, 85 districts (with between 1,500 and 100,000 inhabitants) were
randomly selected, with 44 randomly assigned to receive the district-level community
treatment and the other 41 randomly assigned to serve as control group for the mass
media and community treatments.25 In addition, for the 44 districts that were randomly
assigned to the community treatment, the main school in each district received the school
24The province of Pisco was excluded because an earthquake had just hit the area. The province of Lima was excluded because most of its districts were too large for this type of intervention (more than 100,000 inhabitants), and its inhabitants were relatively wealthy. 25 Note that because every district had the same probability of being selected for the evaluation, small, poor districts were overrepresented in the sample. This was desired, however, given that the program was targeted toward the poor.
Universe: 193 Provinces
(total of 195 Provinces excl. Pisco and Lima)
Randomization
80 Provinces
Randomization
40 Provinces
40 DistrictsProvince Level Intervention:
"Mass Media -DCC alone" Treatment
Randomization
40 Provinces
41 DistrictsControl Group for "Mass
Media -DCC alone" & Community Treatments
44 DistrictsDistrict Level Intervention:
Community Treatment
Randomization
Main Primary School: Control Group for "School
Component"
Main Primary School: "School Component"
treatment
13
treatment. To create a counterfactual for the subgroup of households with children
attending the main school in the treated districts, we also chose a subsample clustered
around the main schools in the districts of the control group to serve as a control group for
the school intervention.
In what follows we assess the impact of the two treatments: mass media and community
on a wide range of outcomes and we also study separately the school level component in
the community intervention. We will refer to the households employed to explore the
community treatment as community sample and to the households used to investigate the
school component of the community treatment as the school sample.
4 Data Collection We conducted baseline and follow-up surveys. The baseline survey was conducted from
May through August 2008 in a total of 3,576 households. The follow-up took place four
months after the project activities ended—from March through June 2011. We located
2,847 of the original households interviewed for the baseline survey during the follow-up
round. We replaced the households we could not find with new households that fit the
following criteria: the family had lived in the dwelling for at least the two previous years
(e.g., when the intervention took place) and had a child under two years of age at the time
of the baseline survey.
For the household-level sampling, in each of the 125 districts allocated to treatment and
control groups, we randomly selected between 15 and 20 households from a census
conducted prior to our baseline survey that listed all households with children under two
years of age. From the 44 districts assigned to the community treatment, we randomly
selected an additional set of 15 to 20 households with children under two years old and
with at least one sibling attending the main treated schools in each district to assess the
effect of the school subcomponent of the district-level intervention. To serve as
counterfactual for this last group, in each of the 41 districts allocated to the control group,
we randomly chose a second set of 15 to 20 households with children under two years old
14
and with at least one sibling attending a school similar to the main treated school in the
treatment districts.
Imasen, a local survey firm, conducted data collection together with a local institution
specializing in nutrition (Instituto de Investigation Nutritional). The surveys were performed
by more than a dozen teams, each consisting of a field supervisor, anthropometric and
biometric technicians, household enumerators, and an observer for structured
observations. All field team members received extensive training and followed
standardized protocols supervised by the project’s investigators to ensure accurate and
consistent data collection.
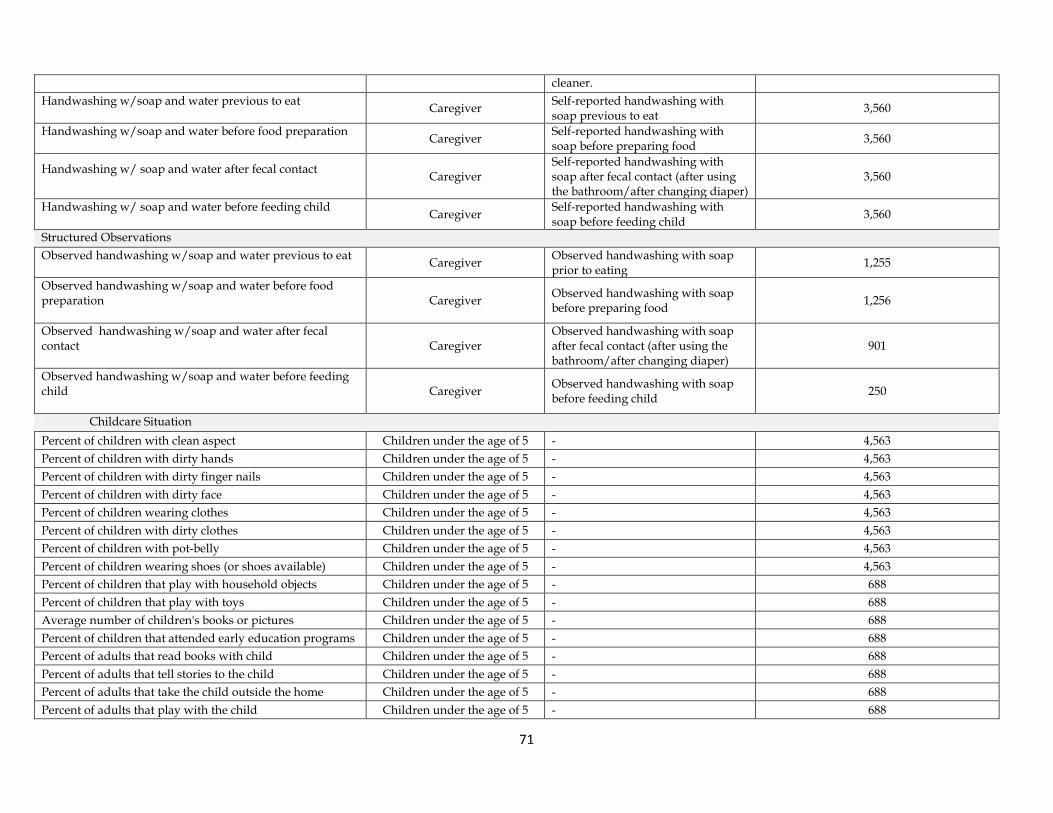
4.1 Variables of Interest and Measurement
Data were collected on a wide range of variables and from different sources. First, a
comprehensive household survey inquired about dwelling characteristics, household
assets, education, income, labor outcomes, water sources, sanitation, and toilet and
handwashing facilities, among other relevant variables (see Appendix 1 for the complete
list). Also included were questions on exposure to handwashing campaigns, determinants
for handwashing behavior—handwashing knowledge, beliefs, and access to and
placement of soap and water—and caregiver self-reported handwashing behavior. To
complement the handwashing behavior module, structured observations, during which
the family’s handwashing behavior within the household was observed for four to five
hours, were conducted on another day following the survey. During that period, the
interviewer noted in detail any handwashing event involving adults and children during
her stay.26 In addition, to measure environmental contamination, drinking water
microbiology samples were collected inside the households at the time of the survey and
analyzed in the field using a membrane filtration technique. The samples were analyzed to
determine the presence of Escherichia coli and other types of coliforms.
To assess the household situation with regard to children, caregivers were given a detailed
questionnaire with questions about the child’s environment, maternal depression, the 26 Structured observations were only carried out for the treatment and control samples of the school treatment.
15
relationship between family and school, and child health. We were mostly interested in
symptoms directly or indirectly related to poor handwashing habits. We asked about
diarrhea and ALRI prevalence in the last 48 hours and in the last week. Both illnesses are
mainly transmitted through the hands—that is, the hands constitute disease vectors
carrying respiratory microorganisms and fecal material.27 We also performed
anthropometric measurements of children following standard international procedures,
because the synergistic relationship between malnutrition and infection is usually
exacerbated in diarrheal episodes given that children tend to eat less during episodes and
their ability to absorb nutrients is reduced.28 These measurements helped us detect the
children’s nutritional situation.
A more detailed assessment of the presence of intestinal parasitic infestations in children
was achieved by the laboratory analysis of children’s stools. Stool samples29 were also
collected during the interviews in duplicates and sent to Lima for parasitical analysis,
using quantitative eggs per gram estimates of soil transmitted helminthes, quantified
using Kato-Katz microscopy tests. We registered the prevalence of parasites and the
parasite count in stool samples of children under five years of age.
Parasitic infestations pose serious threats to young children’s health because the associated
diarrhea and micronutrient malnutrition often leads to iron-deficiency anemia.30 We
therefore also measured anemia in children between six months and five years of age.
Health specialists analyzed hemoglobin concentrations from the children’s capillary blood
using the HemoCue Hb 201 photometer, a portable device that allows for immediate and
reliable quantitative results.
27 Hendley et al. 1973; WHO 2003. 28 WHO 2003. 29 Stool samples were collected only for children under five years of age in the treatment and control groups of the school treatment. 30 See, for example, Hesham et al. 2004.
16
4.2 Descriptive Statistics
Peru is a middle-income country with an estimated per capita income of US$5,195 in 2010.31
Peru has a high human development index (HDI) score of 0.725 based on 2011 data (the index
for Latin America and the Caribbean is 0.731 and for the world is 0.682).One-third of the
population is poor (31.3 percent) and 9.8 percent is extremely poor.32 The wealthiest region of
the country is Lima, Peru’s capital city, which is excluded from this study. The mean years of
schooling for adults older than 25 is 8.9 years and is increasing over time. Most of the children
attend school (93 percent primary school and 76 percent high school) according to 2010 data.33
According to the baseline survey, the households analyzed averaged 5.3 members, with 1.4
children under age five.34 Around one-half of household heads had attained secondary
education and most (95 percent) were employed. The average monthly household income per
capita was 140 Peruvian nuevos soles (around US$ 54). The population included in the study
was poorer on average than the population of Peru, given that poverty is concentrated in the
small districts and that we sampled families with at least one child under two years old.35
Three-quarters of the households had access to improved sources of drinking water, whereas
half of the households had improved sanitation. More than 20 percent of all households had
no sanitation facilities of any type.
Handwashing with soap behavior was not prevalent among the interviewed households.
Although almost all caregivers report having washed their hands with soap at least once
during the previous 24 hours, fewer than half confirmed having done so at times of fecal
contact (46 percent of caregivers associated handwashing with soap with toilet use and 42
percent with cleaning up children). Self-reported handwashing with soap was higher at times
of cooking or food preparation (68 percent), but lower when feeding a child (34 percent).
Structured observations on the use of soap were substantially lower than self-reported rates.
31 IMF 2011. 32 INEI 2012. 33 INEI 2012. 34 For the complete list of variables analyzed, see Appendix 1. 35 Indeed, the average household in the evaluation sample is poorer than the average Peruvian household (see Galiani and Orsola-Vidal 2010).
17
Handwashing with soap was only observed in 16 percent of the events that required it. For
instance, handwashing with soap was observed in only 20 percent of fecal contact events, 25
percent of eating events, 6 percent of child feeding events, and 10 percent of food preparation
events.36
In 64 percent of the households, a handwashing facility—a designated place for
handwashing—stocked with soap and water was observed within the dwelling or the yard.
The higher the income, the closer the handwashing station was to the toilet or kitchen facility.
More than half of the caregivers (53 percent) appeared to have clean fingernails and
approximately 67 percent had clean hands or finger pads, whereas 75 percent of the children
appeared clean at the time of the interview but 47 percent had dirty fingernails. Households
with access to improved sanitation and water source presented lower counts of bacteria in
their drinking water. When accounting for income levels, there was a declining trend of
Escherichia coli (E. coli) counts with increased income37.
Parasitological analysis showed that on average, parasites were detected in 12 percent of the
stool samples collected from children under two (the most frequent were Giardia and
Blastocystis). Prevalence of parasites was lower among households with access to improved
sanitation (7 percent) and water (8 percent) than those with unimproved sanitation (18
percent) or unimproved water (25 percent). The lowest prevalence of parasites was found in
households with a handwashing station stocked with soap and water (3 percent) and highest
in those without (29 percent).
Concerning child health, 10 percent of children under the age of five were reported by their
caregivers to have had diarrhea symptoms in the previous 48 hours and 18.4 percent in the
past seven days. Prevalence of diarrhea was higher in households with unimproved sanitation
(12 percent) and lower for those with improved sanitation (8 percent); however, diarrhea
prevalence was not significantly lower in households with access to a handwashing station
37 For a subsample of 159 households, we also analyzed samples from sources other than drinking water. Households with access to improved sanitation also presented lower counts of bacteria in hand rinse and on sentinel objects. Water and caregivers’ hand rinse samples from households with a handwashing station with soap and water had lower bacteria counts (see Galiani and Orsola-Vidal 2010).
18
with soap and water nor in households with access to improved water sources, compared to
those without access. Diarrhea prevalence appeared to be uncorrelated with income, but it
varied noticeably by geographic location. On average, 4 percent of children had presented
ALRI symptoms in the previous 48 hours, and 6 percent in the previous seven days. ALRI
prevalence increased for children living in households with unimproved sanitation and those
with unimproved water sources. As with diarrhea, similar percentages of households had
presented ALRI symptoms in the previous seven days, irrespective of whether they had a
handwashing station stocked with soap and water. In addition to these, three-quarters of the
samples taken from children younger than two years old indicated the presence of anemia (the
proportion was slightly lower for households with improved sanitation).
Finally, the average child was breastfed for 12 months, although more than 60 percent of
caregivers gave their children instant formula during the first three days of life. Vitamin A was
given to 23 percent of the children and iron supplements to 22 percent. On average, children
living in dwellings without improved sanitation, an improved water source, or soap and
water at a handwashing station tended to have a lower average z-score for each
anthropometric measure included in the analysis as well as for child development indicators
(including communication, social-personal, and gross motor skills).
5 Balance and Attrition
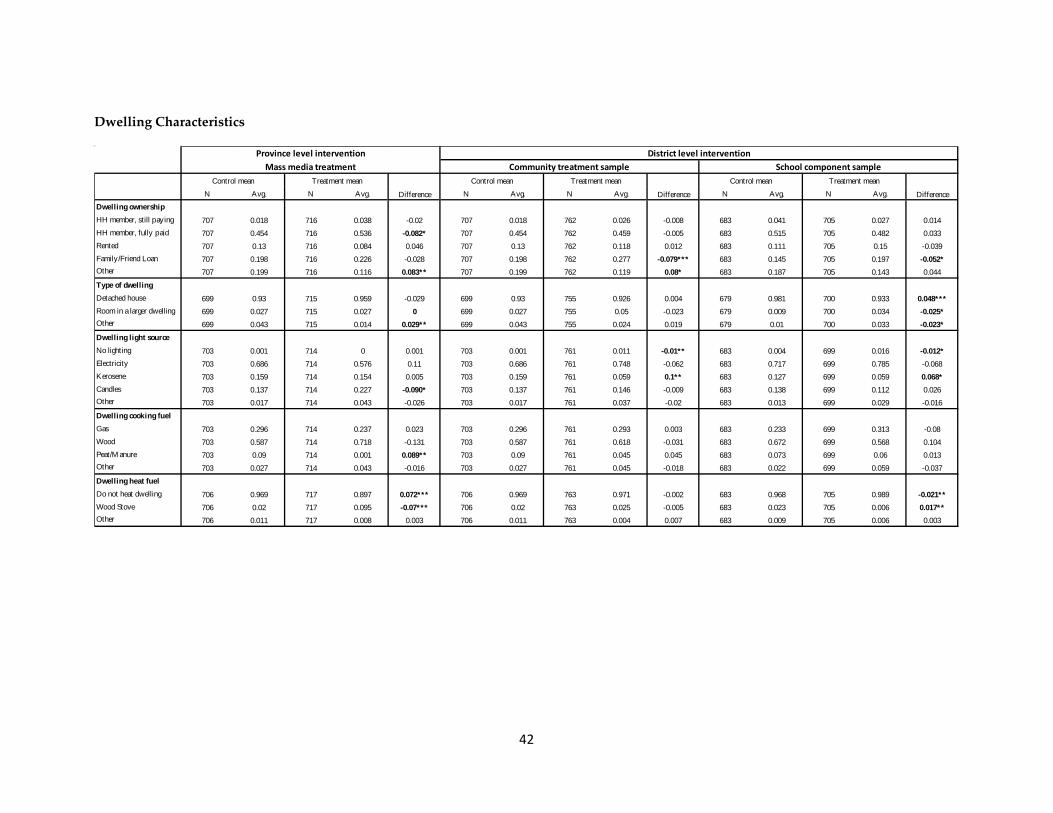
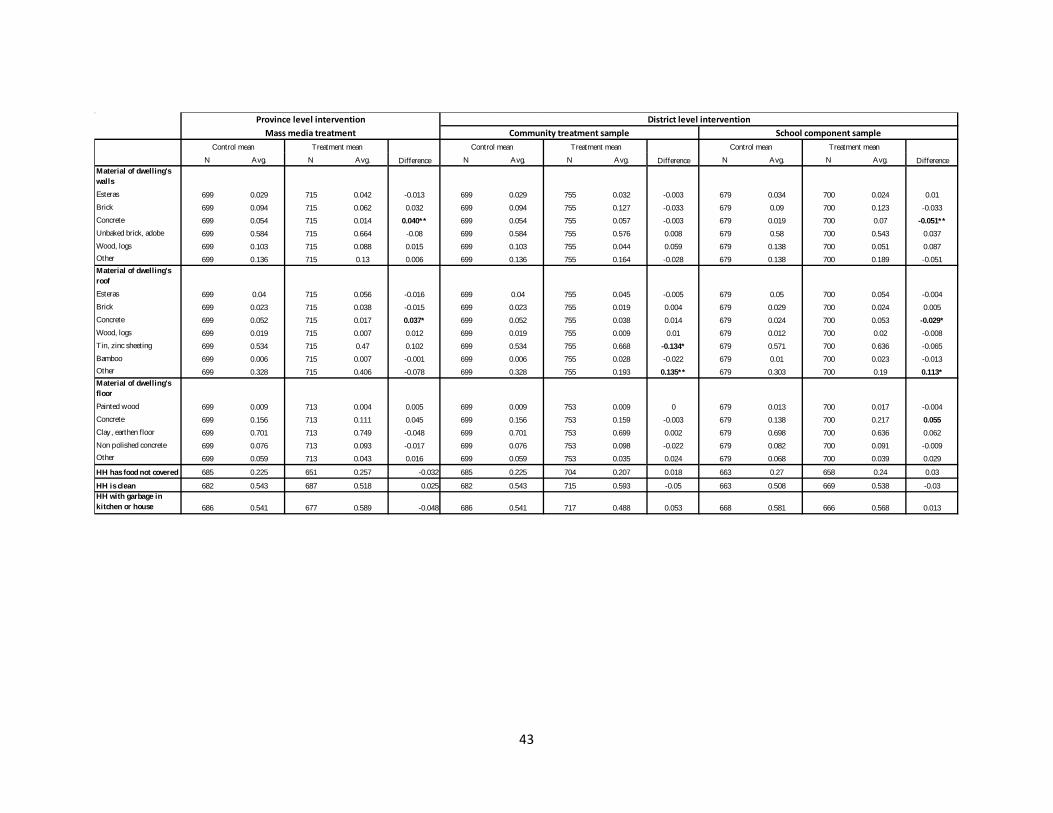
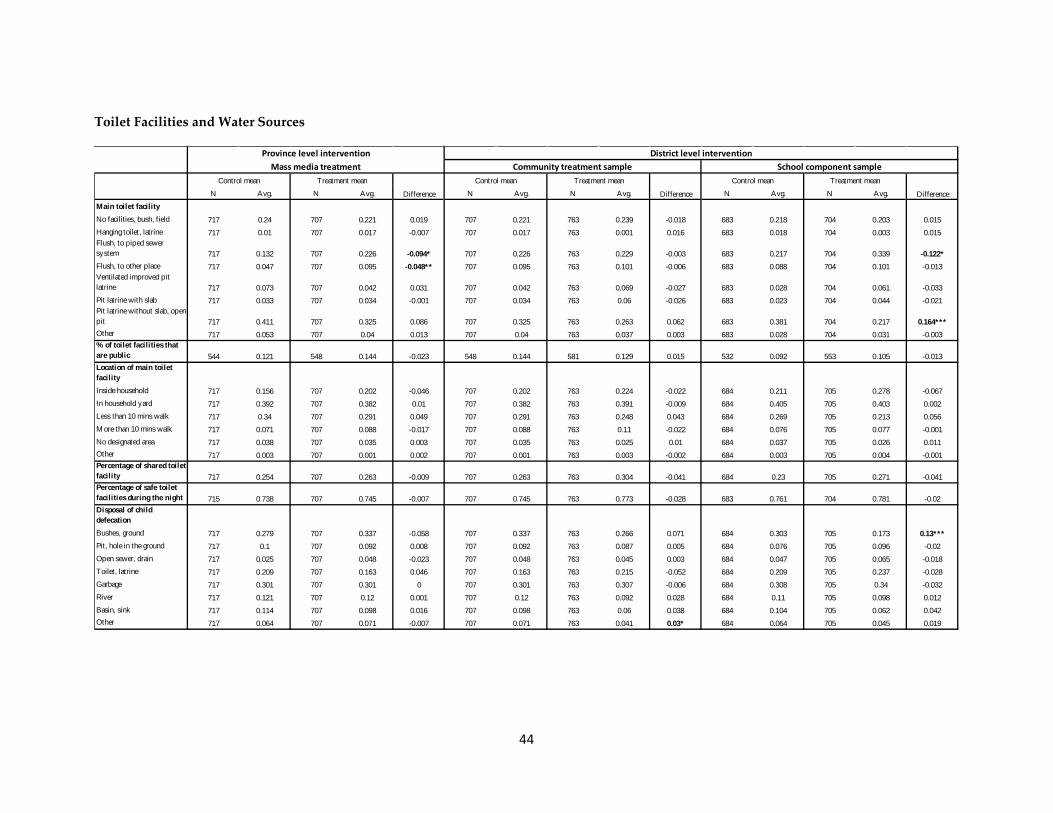
5.1 Baseline Balance
Random assignment of the study participants to treatment and control groups ensures that
in probability the groups will be similar in their observable and unobservable
characteristics. In this section we check that the randomization was performed adequately,
resulting in comparable groups.
Appendix 1 shows the mean comparison tests38 across treatment/control groups for an
exhaustive set of variables included in the baseline survey. We compare the characteristics
38 The standard errors used in those tests were clustered at the district level, allowing the possibility of intradistrict correlation.
19
of households allocated to each treatment with the households of the corresponding
control groups. We test for differences in a wide range of variables including socio-
economic characteristics, dwelling facilities and materials, household assets, children’s
situation (education, health, nutrition, cognitive development, childcare, and the
relationship between family and school), and many variables directly or indirectly
associated with handwashing habits. We obtained the variables reported through
questionnaires, microbiological analysis of samples (drinking water and child stools),
anthropometric measurements, and capillary blood sample of children (for anemia).
The province-level mass media treatment and control comparison used more than 242
variables; in 39 (16.1 percent) of them, we rejected the null hypothesis of mean equality at
the 10 percent significance level. This proportion is slightly lower for the district-level
intervention: for the community treatment sample, 30 of 242 (12.4 percent), and for the
school treatment sample, 29 of 251 (11.5 percent) were unbalanced at conventional
significance levels.39 The larger proportion of statistically significant mean differences in
the mass media treatment could have been expected given that the randomization was at
province level for this intervention, unlike the district-level randomization within the
same provinces for the community treatment samples. One would expect to find less
significant differences among districts within the same group of provinces than among
districts in different provinces.
The differences between treatment and control groups go in either direction without a
clear pattern. The only apparent difference is that the control group for the mass media
province treatment appears to perform better in terms of improved sanitation than the
treatment group. However, the opposite occurs when comparing the school treatment
sample.
39 The proportion of unbalanced variables is close to the standard of 10 percent usually acceptable in randomized experiments. It is important to note, however, that the variables measured are not independent (probably neither the balanced nor the unbalanced ones).
20
5.2 Attrition Analysis
An important concern for any impact evaluation is the fact that participants sometimes
drop out of the study before its completion. Our baseline and endline survey records show
an overall attrition rate of 20 percent after three years. This rate is in line with the attrition
rates found in other similar randomized studies of this type.40 In addition to the fact that
sample size is reduced, when attrition is systematically related to the outcomes under
study or to the program itself, it can bias the estimates of the causal effects of the
interventions studied. We followed the standard procedures in the impact evaluation
literature to address this potential problem.
First, we explored whether the attrition rates differed between the treatment and
comparison groups for each of the interventions studied. As Appendix 2 shows, the
proportion of households that stayed in each group ranges from 0.72 to 0.84, and we
cannot reject the null hypothesis of equal level of attrition in the control and treatment
groups at conventional significance levels in any of the samples studied.
The fact that there was no differential attrition in the treatment and comparison groups is
consistent with the hypothesis that attrition is ignorable, and it suggests that the estimate
of the treatment effects will not be biased unless different types of households dropped
out of the sample in the treatment and the comparison groups.41 For example, if
households with healthier children were more likely to drop out when they were assigned
to the treatment group, this could bias the estimator of the program effect on health
outcomes downward. Fortunately, this does not seem to be the case in our study. Baseline
balance was achieved for the entire initial sample in most of the variables (see Appendix1),
and in Appendix 2 we can see that baseline balance is also high for a set of variables for
the non-attriters’ sample. This implies that those remaining in the sample and the attriters
were balanced in terms of observable characteristics.
40 For example, Banerjee et al. (2007) find attrition rates of 17 and 18 percent, respectively, in the comparison and treatment groups in Vadodara (India) in the first year when they evaluated Balsakhi education program in India. 41 Angrist 1996
21
To make up for the loss in sample size due to attrition, we included 688 new households in
the follow-up survey to replace households that dropped out. To confirm that the
characteristics of the replacement households were balanced between treatment and
control groups, we selected 32 variables that were presumably independent of the
treatment and affected by more structural patterns (e.g., the dwelling’s characteristics). In
most of them, we could not reject the null hypothesis of equality of means at conventional
significance levels (see Appendix 2).
6 Methodology The treatment assignment in this study was random and, as shown in section 5, the
randomization produced comparable groups in terms of observables for all the groups
studied. Furthermore, the results of the previous section suggest that attrition is unlikely
to bias the experiment’s results. Therefore, in the context of this randomized experiment,
we can obtain the average treatment effect on the outcomes of interest by estimating the
following simple regression model:
where i indexes households or individuals, Y is any of the outcomes under study, T is the
dummy variable indicating treatment assignment (equal to one for units in treated
groups), γ is the parameter that captures the causal effect of the intervention considered on
the outcome of interest (Y), X is a vector of control variables, and ε is the error term. We
estimate robust standard errors clustered at the district level in all the analysis.
The vector X comprises the following control variables: gender and education of the head
of household, dummy variables for children’s ages in months, gender of children, an
indicator variable for mother living in the house, rainfall42 (at district level) and
geographical dummies for region (jungle, coast, and mountain).
42 Rainfalls are measured as the maximum rainfalls per district, averaging January, February, March, and April 2011.
22
The results presented throughout the paper are estimates of model (1). The results are
robust to two alternative models: dropping all the control variables and dropping only the
geographical dummies. In Appendix 3 we present the results for the three models as
robustness checks.
7 Effects of the Global Project in Peru In this section we present the results for both the province-level and district-level
interventions. We present the results following the relevant outcomes of the hypothesized
causal chain: exposure to handwashing promotion, effects on handwashing determinants
(handwashing knowledge and beliefs, and access to and placement of soap and water),
handwashing behavior (self-reported and observed handwashing and hand cleanliness),
environmental contamination (bacteria prevalence in drinking water), and child health
(prevalence of diarrhea, ALRI, anemia, parasites in stools, nutrition, and anthropometric
measures).43
In addition to assessing the impact of the mass media and community interventions on the
mentioned outcomes, we are interested in studying the effect of the school handwashing
curricula component, which is part of the community intervention, separately. Thus, in
Tables 1–5, ”community treatment sample” refers to the sample of households employed
to explore the comprehensive community treatment, and ”school component sample”
refers to the households sampled to investigate the community treatment’s school
component. In the remaining of the paper, we will use school component and school
treatment interchangeably.
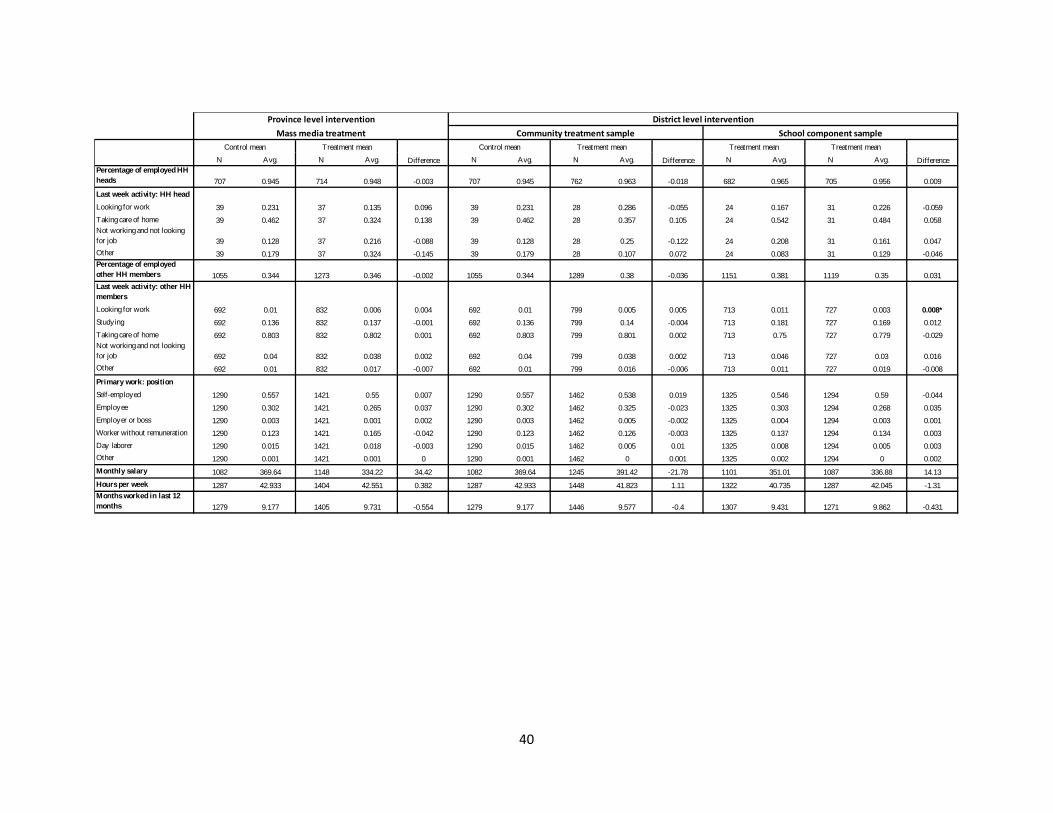
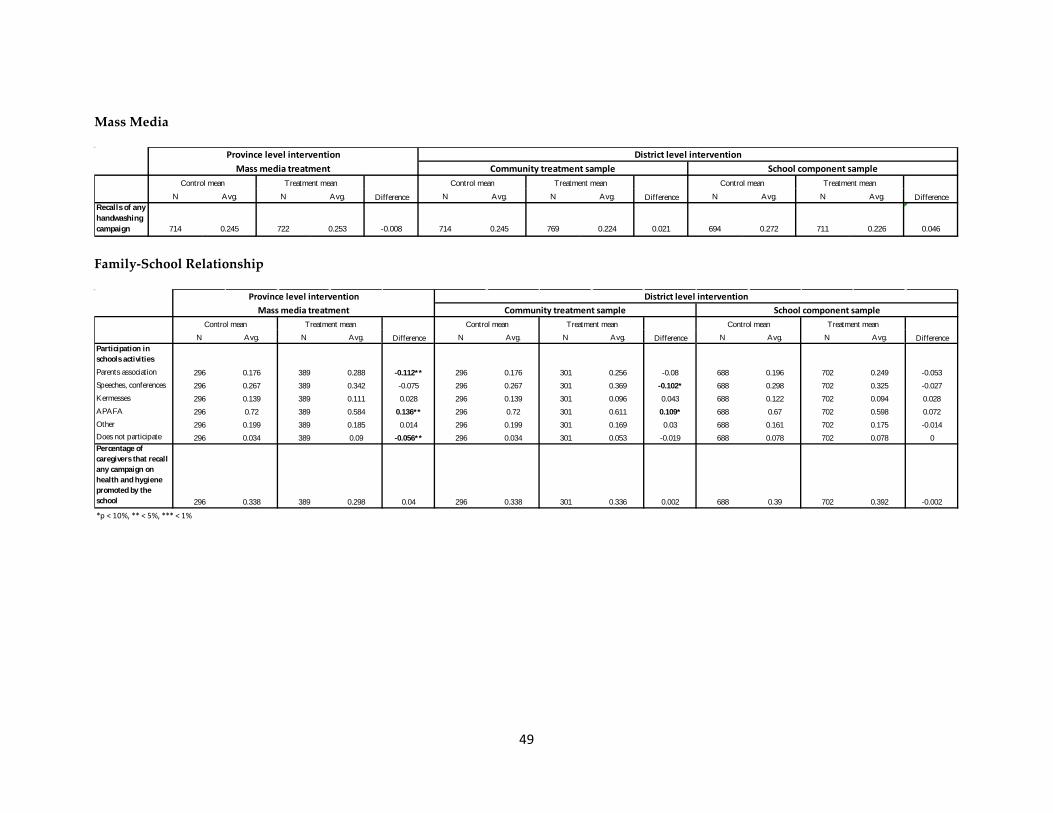
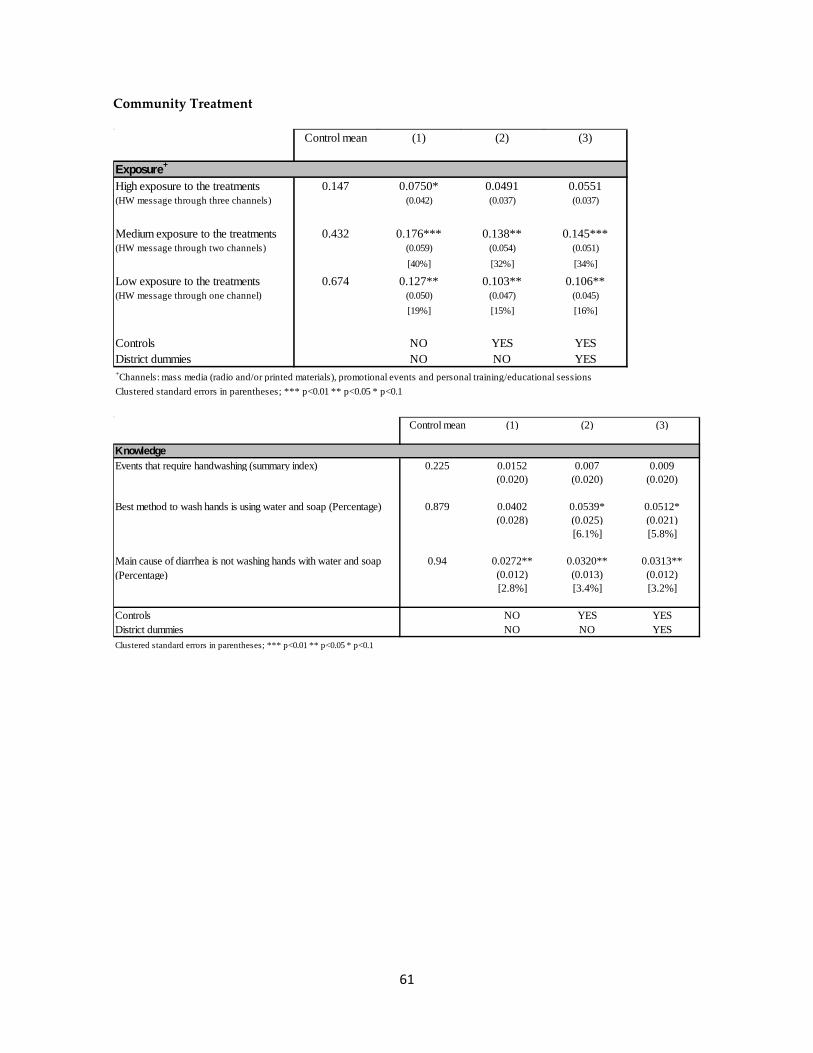
7.1 Exposure to Handwashing Promotion
The Global Scaling Up Handwashing Project in Peru uses a behavior change approach;
therefore, to expect any project impact, the campaign and its messages must reach the target
population. Thus, we asked mothers and caregivers whether they had received handwashing
43 We do not pursue the study of child development outcomes because the health results suggest that those could not be causally interpreted as a response to the interventions studied.
23
promotional messages during the past 12 months, through any of the three channels used by
the intervention: radio and printed materials, promotional events, and educational sessions.
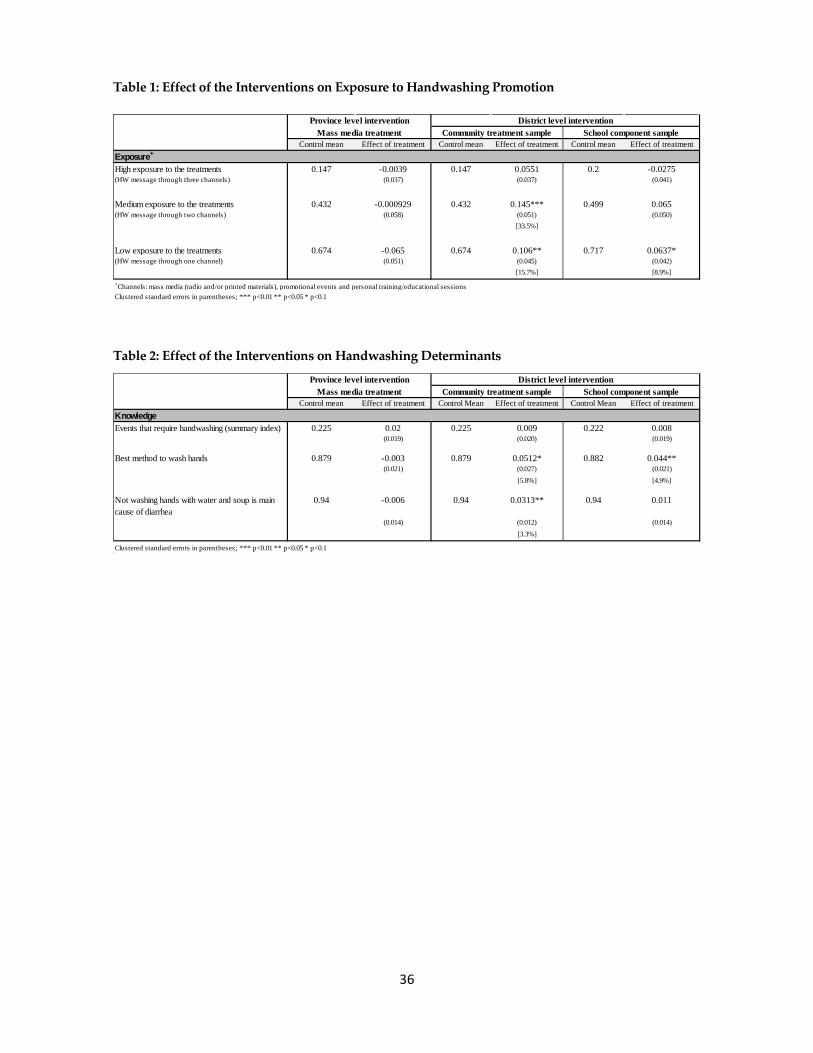
As Table 1 illustrates, the province-level mass media plus DCC treatment did not increase the
exposure of the treated households to the handwashing promotion message through any of
the channels proposed. Thus, starting with this finding, we do not expect to find any other
causal effect that could be attributed to the mass media province-level intervention.
The district-level intervention (mass-media plus DCC, and community treatment) was
considerably more successful in exposing the target audience to the handwashing with soap
message. The random sample exposed to the community-level treatment was the most
affected as a result of this intervention, as the proportion of mothers or caregivers that
reported having received handwashing messages through at least one (two) of the
communications channels was 15.7 percent (33.5 percent) higher in the treatment group than
in the control group.44
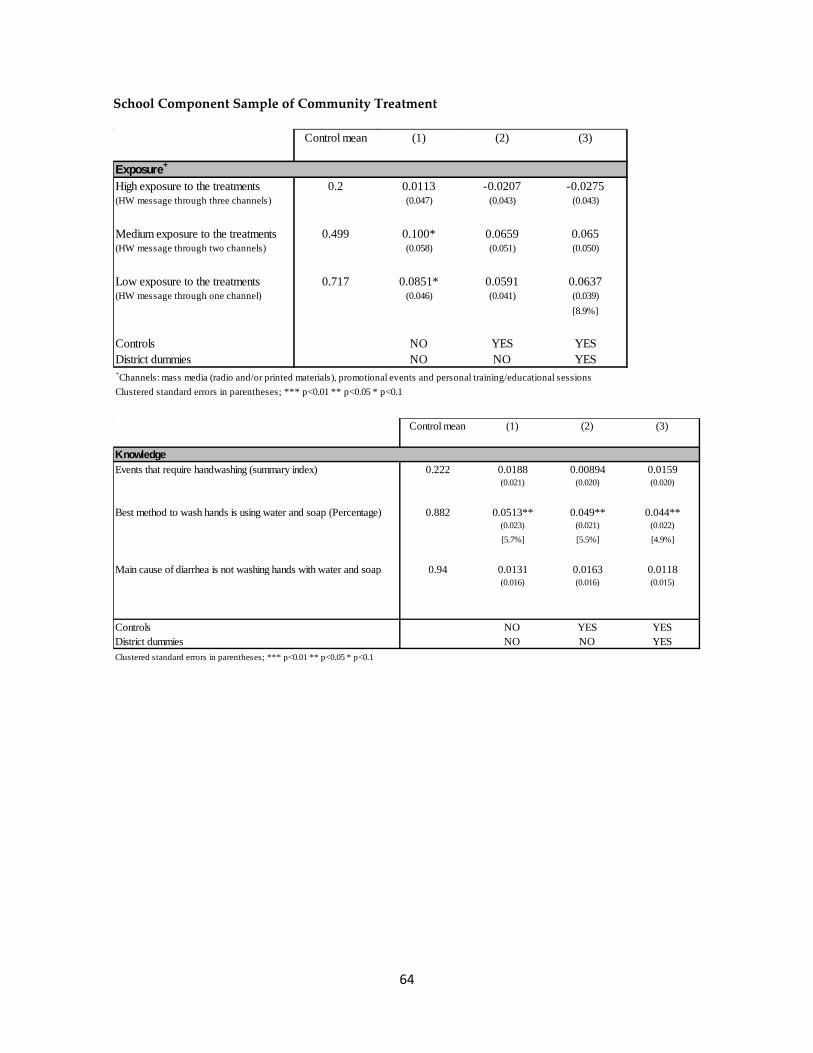
We are also interested in assessing whether the messages imparted at schools reached the
attending children—even though those children and their mothers/caregivers might also have
been exposed to the other community-level activities. Table 1 shows that the school
component increased the probability of low exposure to the treatment (that is, receiving the
messages through one channel) by 8.9 percent. To compare this result with that of the
community treatment, notice that the households in this treatment group have at least one
child attending the school. These households are located in districts also affected by the
community treatment, but because they are clustered in a certain area (around the main
primary school), their probability of receiving the handwashing message through the other
promotional activities in the district might be lower than the probability of receiving them for
a random household in the district.
44 Note, however, that the control group also reports high levels of exposure to similar messages. Although this might partially reflect measurement error, it might also reflect the fact that other, less intensive campaigns could have been implemented elsewhere.
24
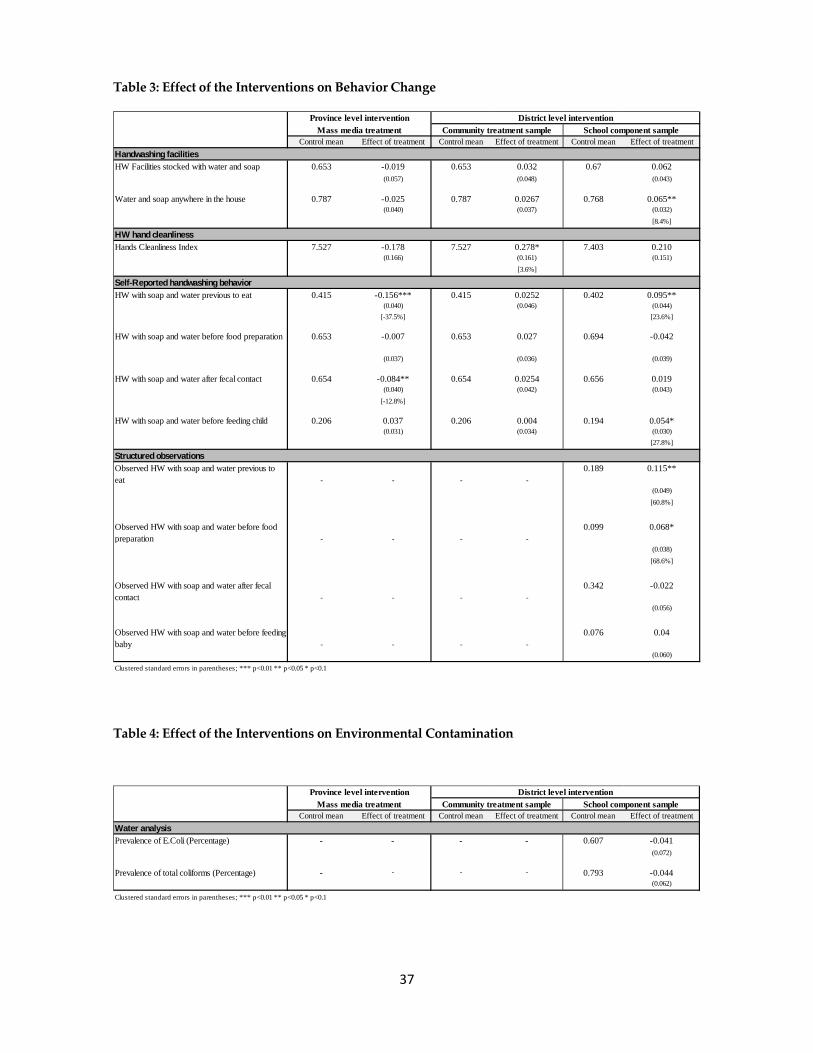
7.2 Treatment Effects on Handwashing Determinants
Improving handwashing behavior requires changing the factors that motivate that behavior.
These factors are known as handwashing determinants, and include knowledge about the best
way to wash hands, beliefs about whether soap is needed for effective handwashing, and the
availability and placement of soap and water. Caregivers were asked about their knowledge
of effective handwashing habits as well as the availability of water or soap in the household.
This would constitute the second link—after exposure to information—in understanding
whether the project could lead to a behavior change.
Table 2 shows that the mass media plus DCC treatment was ineffective in improving the
knowledge of the survey respondents or in increasing the availability of soap and water in
households. This result is expected given that respondents did not show a higher exposure to
the handwashing promotion campaign. Table 2 also shows that the district-level interventions
increased not only the exposure to the treatment, but also the knowledge of mothers and
caregivers regarding handwashing practices. For instance, in the treated districts, there was a
significant (around 5 percent) increase in the proportion of respondents answering that the
best method for washing hands is using water and soap. In addition, 3.3 percent more
households in the treated districts knew that inadequate handwashing is the main cause of
diarrhea.
It is important to note that the mean of the control group for these knowledge variables is
high: 88 percent of the caregivers answered that the best method for washing hands is with
water and soap and 94 percent of the interviewees claimed that inadequate handwashing is
the main cause of diarrhea. In these variables, we observe a modest gap of 12 and 6 percentage
points, respectively, to total knowledge. If we measure the effect of the community
intervention in terms of closing the knowledge gap, we can see that the program reduced this
gap by as much as 50 percent (the gap on knowledge regarding the best method for washing
hands was reduced by 42 percent and the gap about how inadequate handwashing can cause
diarrhea was reduced by 50 percent).
Finally, the community treatment increased the availability of water and soap in households
by 8.4 percent (among the school component sample). Again, it is worth mentioning that
25
availability of soap and water anywhere in the dwelling is also high in the control group (e.g.,
77 percent of the households in the control group for the school component of the community
treatment have water and soap somewhere in the dwelling). Thus, the treatment reduced the
gap by 28 percent, which constitutes remarkable progress.
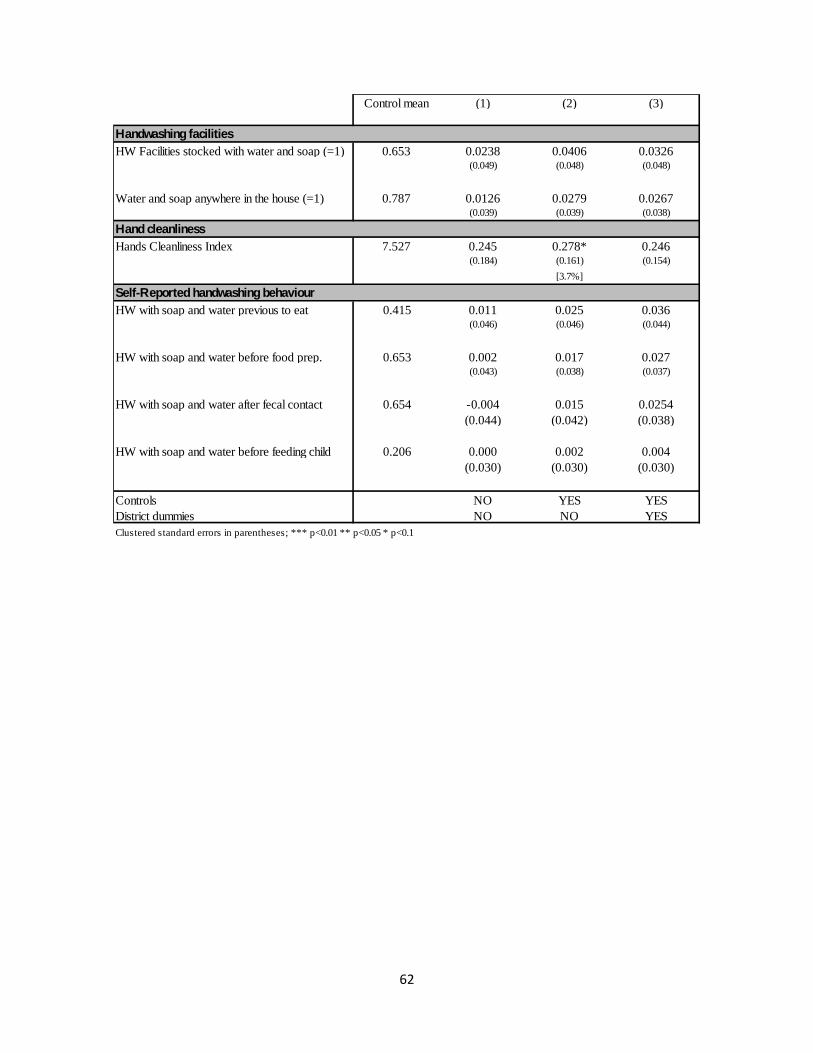
7.3 Treatment Effects on Handwashing Behavior
The next step in the causal chain is assessing whether the improvements in handwashing
knowledge and the availability of water and soap brought about by the community treatment
translated into handwashing behavior changes.
Measuring handwashing behavior is complex. The simplest and most affordable method for
measuring handwashing with soap is to ask respondents to self-report their behavior.
However, respondents tend to over report their behavior, especially if they know that
handwashing with soap is the right thing to do. Ideally, multiple methods should be used to
obtain a more reliable rate of true handwashing behavior. This study uses four different
measurement methods and proxies that vary in validity, reliability, and cost to obtain accurate
rates of handwashing behavior.45 These measures include observation of handwashing
facilities in the households, cleanliness of caregivers’ hands, self-reported handwashing with
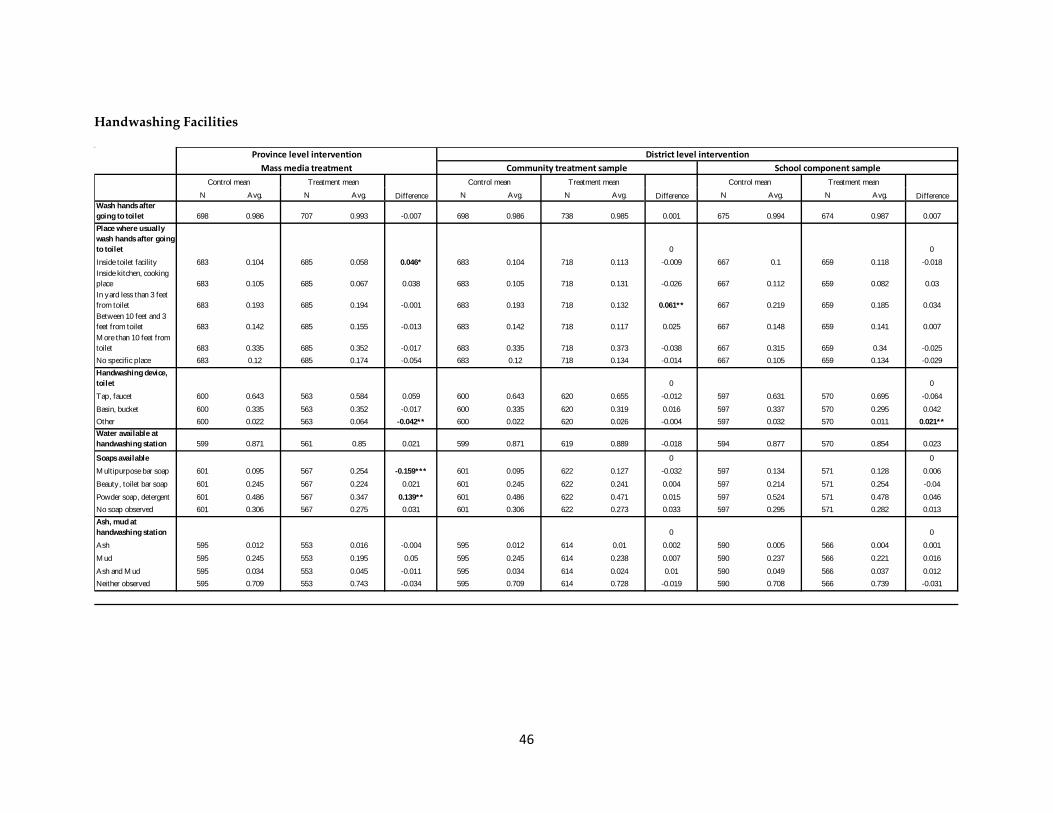
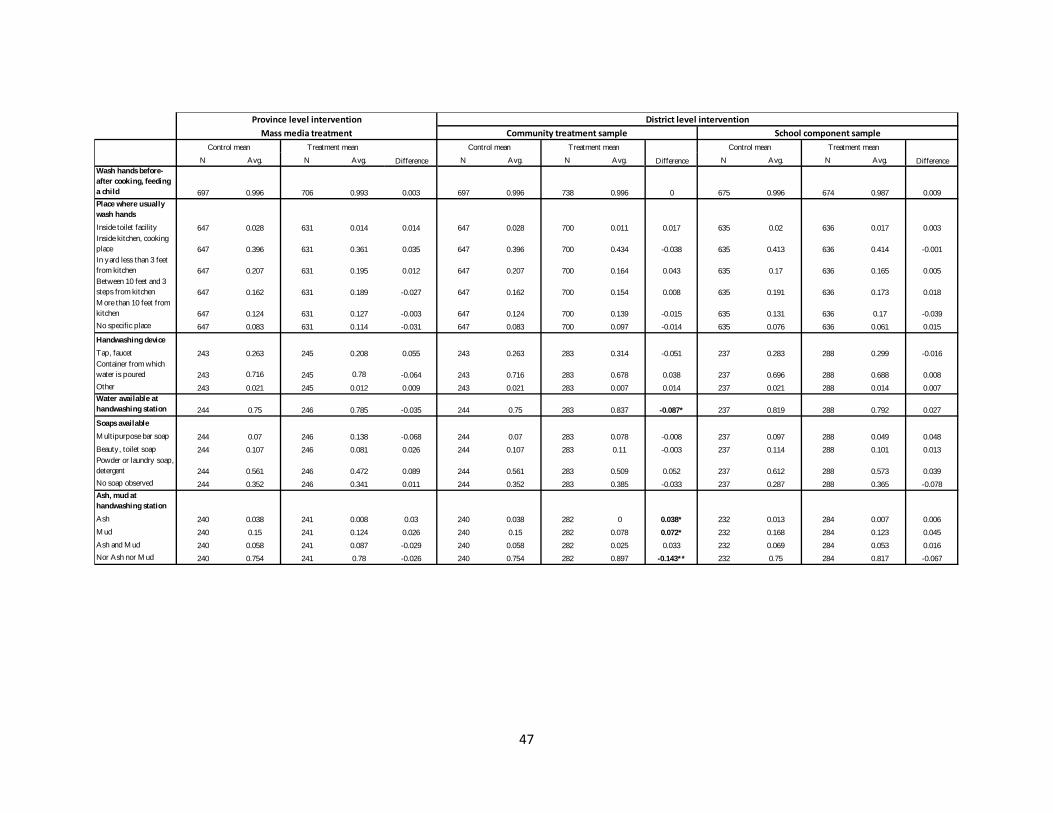
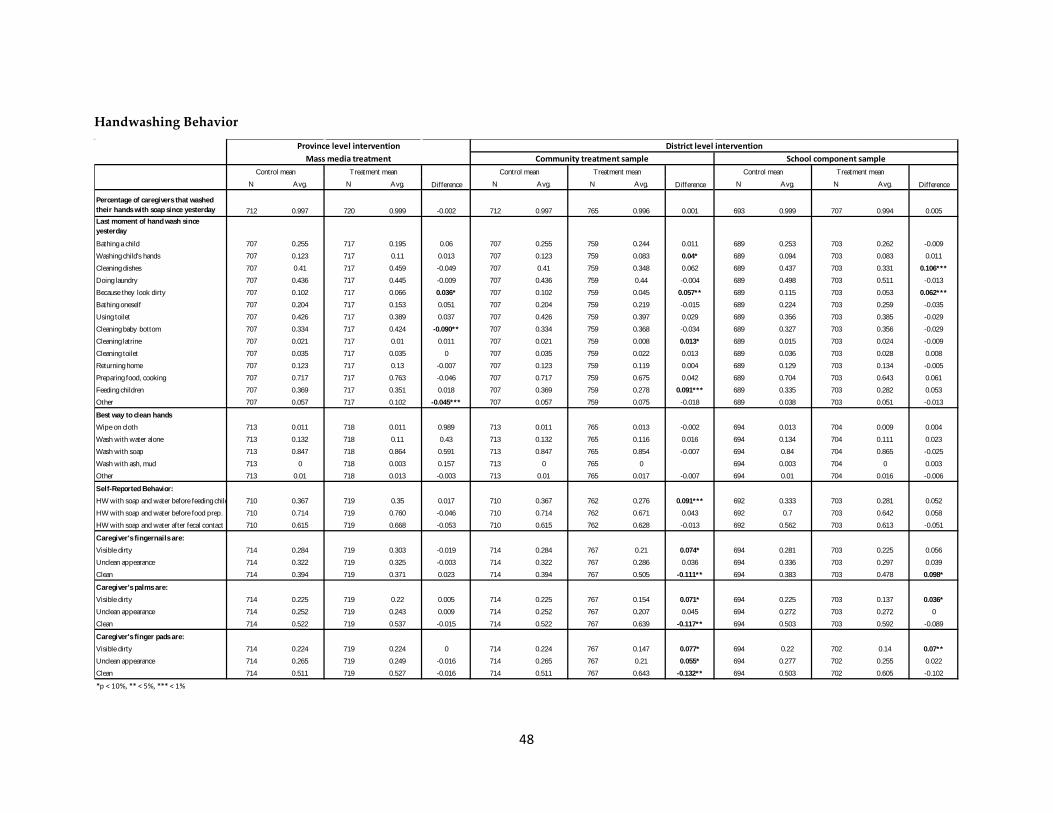
soap behavior, and direct structured observations of handwashing. Table 3 summaries the
results for these four measures.
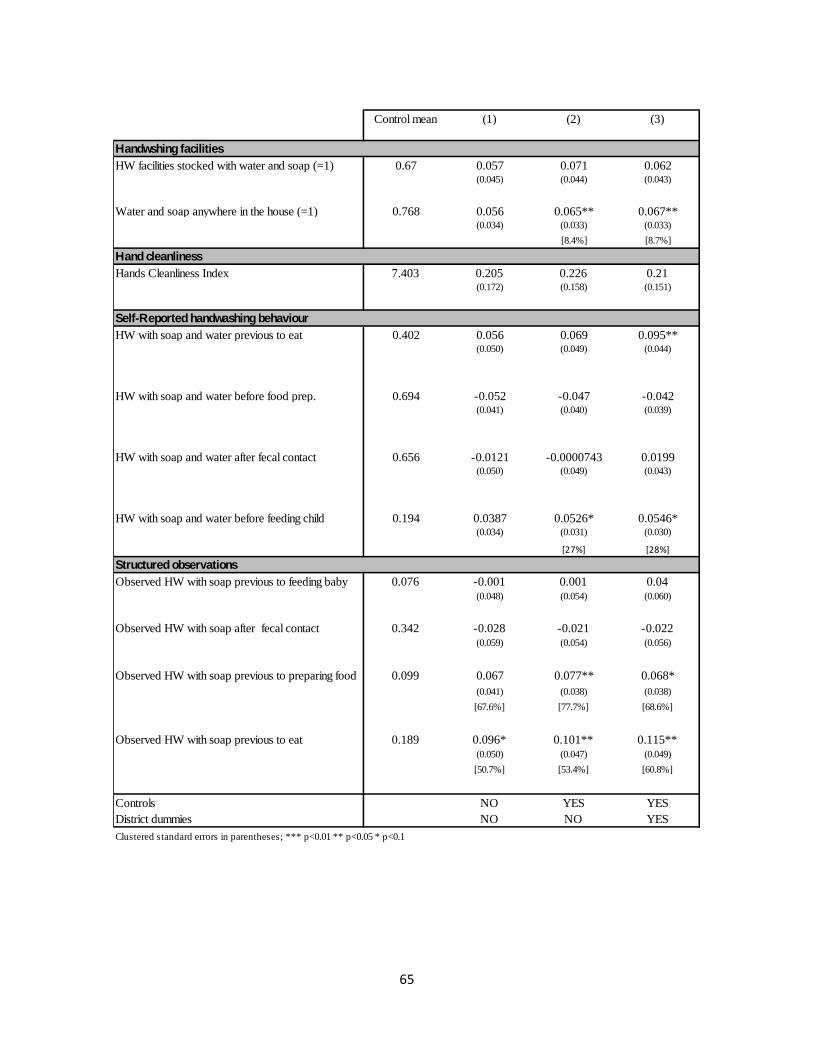
Observations of handwashing facilities were conducted in all households. The mother or
caregiver was asked to identify any place in the household designated for handwashing after
fecal contact or before food contact.46 When the answer was positive, the enumerator noted all
the details about the handwashing facility, including the facility type, its distance from the
toilet or kitchen, the availability of water and soap, and the type of soap. At baseline, the
proportion of households with at least one handwashing facility near the toilet or kitchen was
quite high (66 percent). The community treatment increased the share of households with
45 Ram 2010 46 Fecal contact includes using the toilet and cleaning a child’s bottom; food contact includes food preparation, eating, or feeding a child.
26
handwashing facilities by 4.9 percent (9.2 percent for the school component sample), but the
increase was not statistically significant at conventional levels of significance. The enumerators
also observed the hands of mothers and caregivers and recorded the cleanliness of their nails,
palms, and finger pads. These observations were used to create a Hand Cleanliness Index.47
The district-level intervention had a positive and significant effect on the hand cleanliness of
mothers, as respondents in the community treatment group were 3.6 percent more likely to
have clean hands than those in the control group.
Self-reported handwashing behavior was measured by asking mothers and caregivers under
what circumstances they had washed their hands with soap in the previous 24 hours.
Respondents were asked to recall every time they had used soap during handwashing.
Analysis of the responses focused on self-reported handwashing with soap behavior during
any of the critical junctures. As Table 3 shows, self-reported handwashing with soap behavior
improved in the district-level interventions in almost all the critical junctures, but it was
statistically significant only in the school treatment. Among the school component sample,
23.6 percent more respondents in the treatment group reported having washed their hands
with soap before eating and 27.8 percent more reported having washed with soap before
feeding a child, relative to the control group.
As mentioned earlier, self-reported handwashing behavior tends to be over reported, so in
order to triangulate the results, the study included structured observations of handwashing in
a subsample of 600 households. Direct observations were conducted among the school
component and its control group during a 4-to-5-hour period on the day after the main
questionnaire was administered. Enumerators in charge of the structured observations
received extensive training on being discreet and not revealing that the visit’s main focus was
to observe handwashing behavior. The enumerators observed events that should be followed
by handwashing and recorded whether the caregiver had actually washed hands, the time of
the event, whether water and soap were used, whether hands were dried, and what was used 47 The Hand Cleanliness Index comprises the following components: a) Nails: +1 if visibly dirty, +2 if apparently dirty, +3 if clean; b) Palms: +1 if visibly dirty, +2 if apparently dirty, +3 if clean; and c) Fingerpads: +1 if visibly dirty, +2 if apparently dirty, +3 if clean. The index ranges from 3 to 9, with higher scores indicating greater cleanliness.
27
for drying. Table 3 summaries the results of these structured observations. As the results
show, the district-level intervention had a significant and large effect on observed
handwashing in two of the four main critical junctures. In particular, 61 percent more
households in the treatment group washed their hands with soap before eating than those in
the control groups. Similarly, treated households were 69 percent more likely to wash hands
before food preparation than nontreated households. These effects are encouraging with
respect to the potential of the community intervention in achieving behavior change.
There is a possible caveat regarding the results of the structured observations, as individuals
may have changed their behavior because they were observed. For instance, Clasen et al. show
that during a field trial in India where they measured the number of latrine events with a
device hidden in the latrine, the presence of a human observer was associated with a
statistically significant increase in the number of latrine events (i.e., the users modified their
behavior in response to the observer).48 In the context of this handwashing campaign in Peru,
that type of change in behavior would be true for both the control and the treatment group.
However, rates of handwashing with soap as measured by structured observations are
substantially lower than self-reported rates, so there does not seem to be a high overreaction to
the observer. What could still bias our causal estimates is a situation in which the treated
group would react differently in the observer’s presence (probably showing better practices
given that they received the handwashing message) relative to what they would do in the
control group. If this were the case, our results still would confirm that the treated group had
received the handwashing messages and knew when to practice handwashing with soap.
Nevertheless, structured observations continue to be the gold standard in measuring
handwashing behavior, and it provides a more reliable measure of true handwashing
practices than self-reported rates. Thus, the results show that the community intervention was
successful in achieving behavior change.
For the mass media provincial-level intervention, we found no negative effects, which are not
likely to be attributed to the treatment, as its messages did not reach the targeted audience.
48 Clasen et al. 2012.
28
7.4 Treatment Effects on Environmental Contamination
Medical evidence suggests that the transmission of diarrhea and respiratory infections is
mainly through the hands, which constitute disease vectors carrying respiratory
microorganisms and fecal material to the domestic environment of the susceptible child. The
use of soap reduces germs and bacteria in hands, thus reducing the risk of becoming sick. It is
expected that those practicing handwashing with soap at key junctures will have a lower
presence of bacteria such as Escherichia Coli or total coliforms on their hands, thereby reducing
the risk of contamination when handling, preparing, or serving drinking water at home. Thus,
the study collected samples of drinking water49 from a subsample of 600 households among
the school component sample and its control group. These samples were collected during the
administration of the questionnaire, and analyzed to detect the presence of Escherichia Coli and
total coliforms. Consistent with previous results, the microbiological analysis of drinking
water samples summarized in Table 4 shows that the prevalence of Escherichia Coli and of total
coliforms was lower in the treated households than in those of the control group, but none of
the effects are statistically significant at conventional levels.
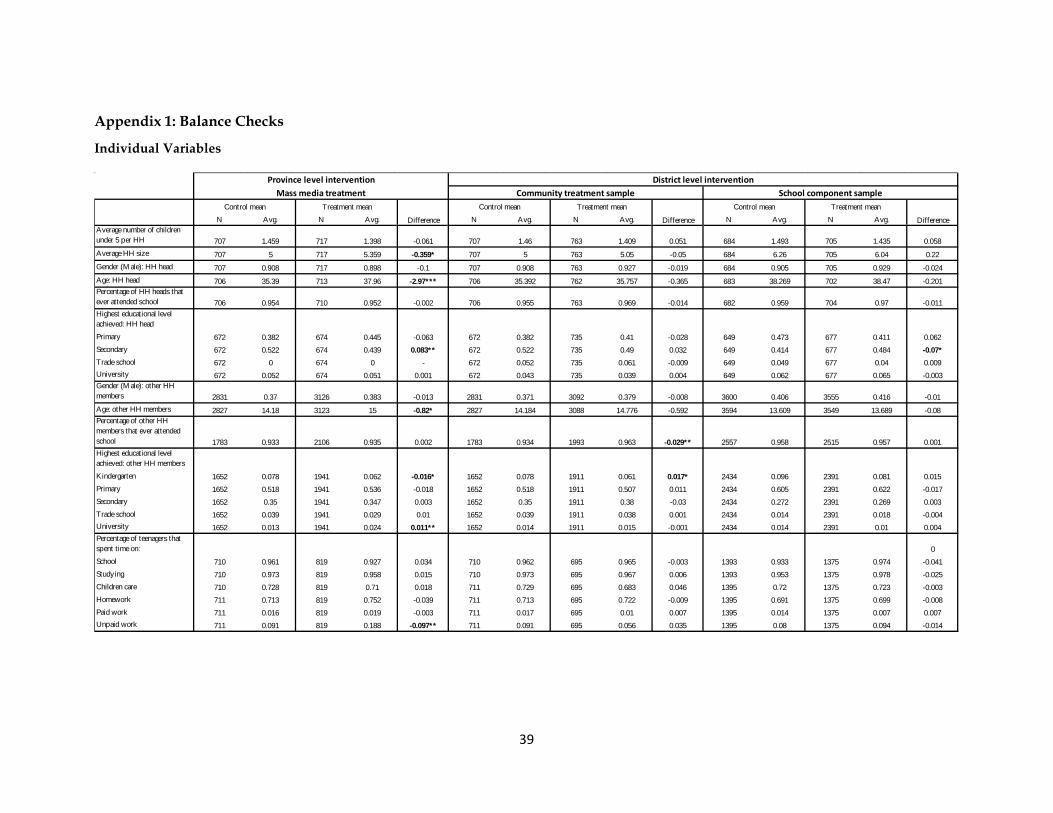
7.5 Treatment Effects on Child Health
The last step in the causal chain is to assess whether the positive results found on exposure to
the campaign—knowledge of appropriate handwashing practices, access to soap and water,
and handwashing with soap behavior—resulted in health improvements. Table 5 summarizes
the effects of the treatments in a wide range of indicators of child health and well-being,
including symptoms of illness, nutrition, parasite infestations, and anemia. The results show
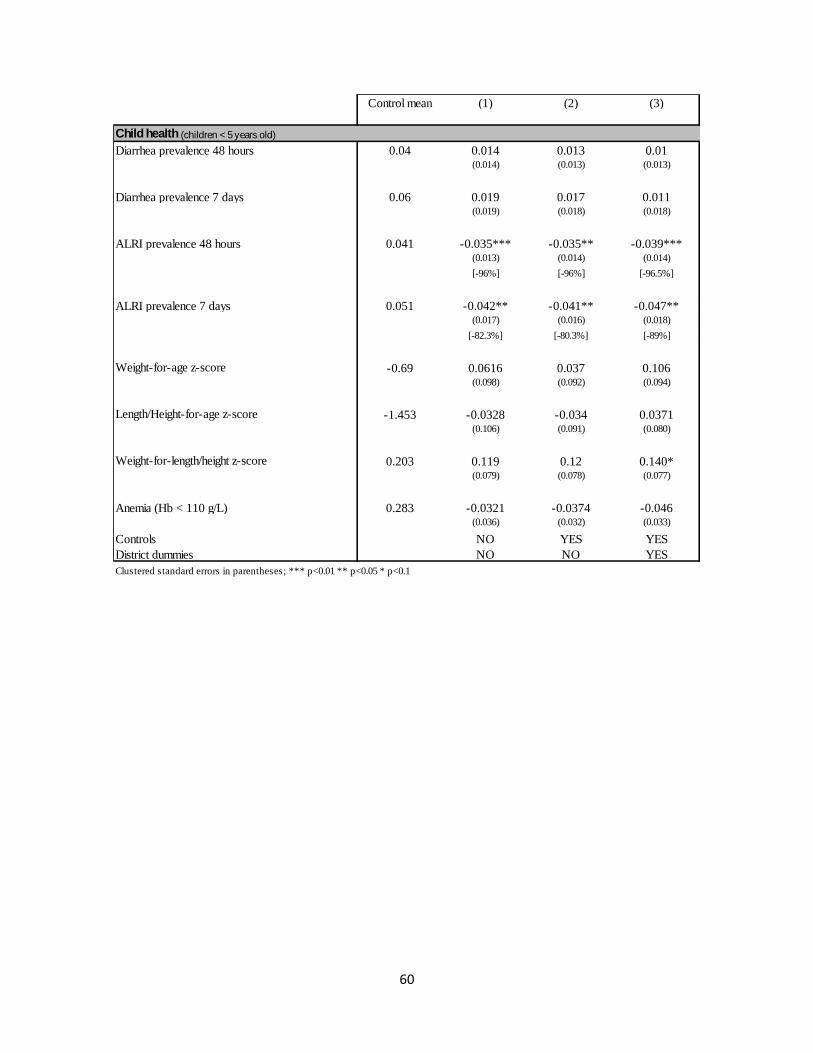
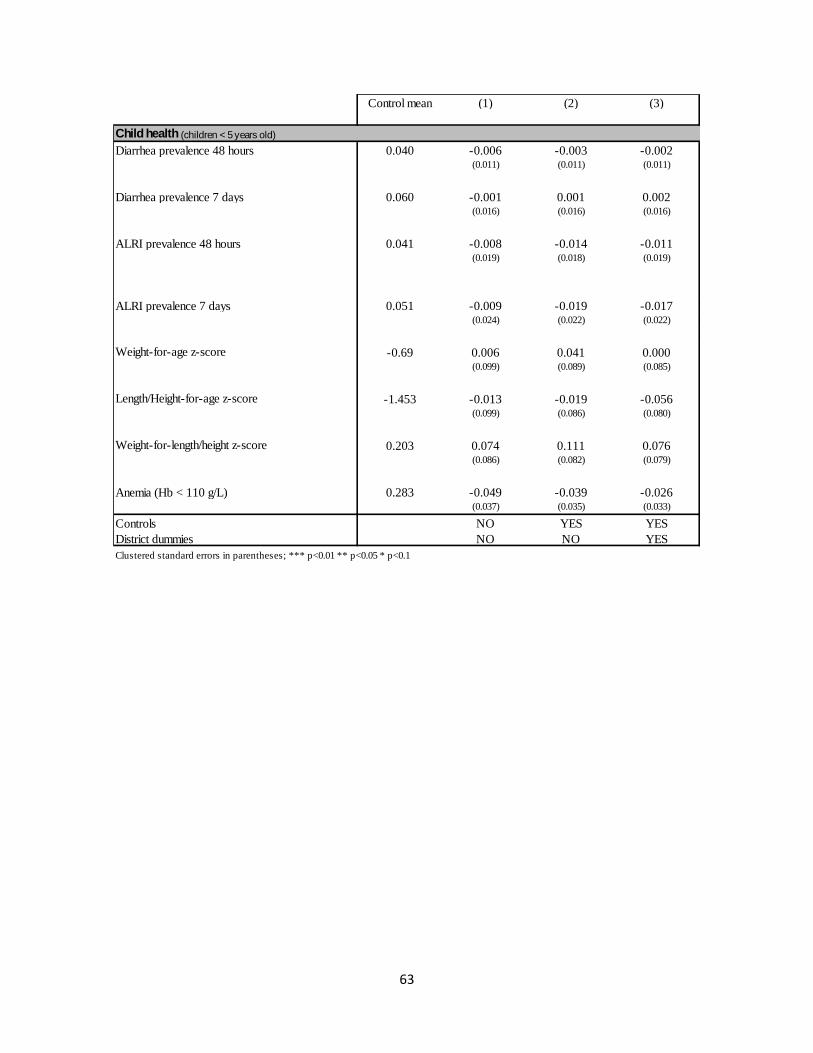
that overall none of the treatments had a significant effect on those variables.
Because the mass media plus DCC provincial-level treatment alone had no effects on previous
outcomes, we did not expect to find any impact on child health. If there were significant
estimates, they would probably not be causally attributed to the treatment given that it did not
reach the target audience (see Table 1). This is the case of a reduction in the prevalence of
49 Drinking water is not the water at source, but rather the water that the household drinks directly. Drinking water can be boiled or treated and is usually stored in containers or jars inside the household.
29
ALRI. In the baseline, this variable was not balanced, as households in the control group were
performing significantly worse than those in the treatment group. In the follow-up survey, the
situation reverted but there are no grounds to think that it was the effect of the program. This
suggests that in this specific health dimension the two groups might not be comparable and
that respiratory diseases are influenced by regional temporary variability.
For the district-level intervention (community and school component samples), the
improvement in knowledge and behavior change do not seem to have resulted in better health
for the children. There are no statistically significant differences between the prevalence of
diarrhea or ALRI among children in treated households and those not treated. Nor do we
observe any important improvement in the anthropometric measurement50 or anemia
indicators. The prevalence of parasites and the parasite counts obtained from the stool
samples (of children under 5 years old) are not significantly different in the control and
treatment groups. These results are consistent with the fact that the treatments had no effect
on diarrhea, micronutrient malnutrition, or anemia, as these health problems are usually
related to parasitic infestations.51
8 Conclusion Some simple technologies, such as vaccines and mosquito bed nets, are cheap and effective
preventative measures that can save lives at minimal costs.52 Handwashing with soap at
critical times is another of these technologies: soap is generally easy to use, is relatively cheap,
and has the potential of substantially improving the living standards of households. Despite
these potential benefits, however, only 3 to 34 percent of people in developing countries
routinely wash their hands with soap at critical junctures during the day.53
50The z-scores for the anthropometric measures were calculated discarding the lower and upper 1 percent of the distribution. 51 Unfortunately, a disaggregation of the prevalence of different parasites shows extremely large variability, suggesting that making inference at that level of disaggregation could be unreliable. Nevertheless, we report finding large drops in the treatment group in the prevalence of any Ascaris Lumbricoides infections and any Trichuris Trichuria infections, no differences in Hookworm infections, but a significant rise in the treatment group in any other parasites infection. 52 Banerjee and Duflo 2011 53 World Bank 2005
30
Although medical evidence about the benefits of handwashing with soap is clear, changing
handwashing behavior is a complex phenomenon related to personal habits that has multiple
determinants (economic, cultural, social, etc.).54 These characteristics of handwashing result in
important difficulties in changing and sustaining these hygienic practices. This paper studies a
large-scale handwashing promotion intervention that took place in Peru between 2008 and
2010, and that introduced an innovative mix of communication strategies to induce
handwashing with soap at critical times. In particular, the study examined the effect of two
different treatments—a province-level mass media campaign and a district-level community
treatment—on several outcomes: exposure to the program, handwashing determinants,
handwashing behavior, environmental contamination, and child health. We combined
different quantitative and qualitative data collection techniques to measure these variables,
including detailed questionnaires; structured observations; microbiological analysis of
samples of child stools, capillary blood, and drinking water collected in the field; and
anthropometric measures performed by health experts.
This paper is the first to assess the effect of a large-scale handwashing with soap intervention
using such a wide range of indicators. Previous studies in the literature of randomized
handwashing experiments focus on intensive (in terms of labor, inputs and/or monitoring)
and controlled treatments, showing that they are effective in reducing diarrhea and
pneumonia incidence in children.55 This study, in contrast, examines a significantly less
intensive intervention at scale under real-world conditions. In addition, we study a full set of
intermediate outcomes, such as the effectiveness of the campaigns and behavior change, in
order to better understand the results in the context of the causal path of disease transmission
identified in the medical and public health literature. To the best of our knowledge, ours is the
first study of handwashing to focus on all components of this causal chain.
The results of this evaluation show that the mass media intervention alone was not effective in
reaching the targeted audience with the handwashing message and therefore failed to
improve the handwashing knowledge of mothers and caregivers and to generate a behavior
54 Chapman 2010 55 Luby et al. 2005
31
change that could improve child health. The null results are in line with most of the existing
evidence on health promotion campaigns, which typically show that they are ineffective in
impacting behavior or that they, at best, enhance the knowledge about the promoted topic.
(See, for example, Babor et al.’s work on alcohol prevention campaigns56; Madajewicz et al.’s
work on arsenic in water in Bangladesh57; Banerjee and Duflo’s work on vaccination
campaigns in Zambia58; and Summerbell et al.’s work on obesity prevention campaigns59).
In contrast, the community intervention, which combined the mass media campaign with
more intense training and promotional activities delivered at the district level, proved to
be more effective in reaching the targeted audience with the handwashing promotion
message, significantly increasing the proportion of mothers and caregivers that reported
receiving it. The community treated group reported receiving the message at least through
one communication channel more than 15 percent more often than the control group. This
more comprehensive treatment seemed to have successfully transmitted the key messages
related to handwashing with soap. Increased exposure to the campaign and educational
sessions translated into observable learning about best handwashing practices. For example,
the proportion of mothers and caregivers that responded correctly that the best method for
washing hands is using water and soap increased significantly (around 5 percent) as
compared to the control group. Considering the generally good levels of knowledge about this
among sample households, this 5 percent change means that almost half the remaining gap in
56 Babor et al. 2003 57 Madajewicz et al. 2007. In this paper, the authors also compared two types of information campaigns and found that the more personalized treatment was more effective. People exposed to a media information campaign obtained as much information as those exposed to a door-to-door campaign, but they did not change their behavior regarding checking whether the dwelling where they obtained water was safe and moving to another dwelling if it was not. The authors also studied a personalized campaign that provided information specific to the individual (whether her/his well is safe and which wells in the vicinity are safe), achieving behavior changes. 58 Banerjee and Duflo (2011) review, among others, the case of Zambia in which a big NGO distributed subsidized chlorine tablets widely, and as a result the campaign informed the population (98 percent identified it as a good way to clean drinking water). However, only 10 percent of families use the tablets. In addition, Banerjee et al. (2010) show that immunization campaigns in rural India are more effective when the poor are given small incentives apart from the vaccines (in this case, lentils and metal plates for completed immunization). 59 Summerbell et al. 2007. Two recent Cochrane reviews on childhood obesity (Campbell et al. 2001; Summerbell et al. 2005) find only modest evidence that diet education impacts the BMIs and consumption habits of schoolchildren, especially in the short term.
32
hygiene knowledge (between current levels and full awareness) has been closed. This
improvement in knowledge led, in turn, to statistically significant behavior changes in key
areas, such as an 8.4 percent increase in the availability of water and soap in the household,
hand cleanliness, and observed and caregiver self-reported handwashing behavior before
eating, feeding a child, and preparing food. In addition, observed handwashing with soap
only increased among the treated households by 61% before eating and by 69% before
preparing food, as compared to the control groups. However, these behavior changes did not
translate into better child health. Overall, no impact was found on parasite and bacterial
prevalence in stools and drinking water (respectively), which is consistent with the fact that
there were no effects on diarrhea, micronutrient malnutrition, or anemia.
The results of this study yield important insights for policymakers and practitioners.
Although we did not observe treatment effects on health outcomes, the study successfully
identified which component of the intervention was more effective in changing handwashing
behavior. Handwashing with soap at critical junctures continues to be a preventive measure to
improve child health, especially in developing countries with a high incidence of diarrhea.
Thus, future efforts should be invested in identifying additional activities, delivery
mechanisms, and/or more effective messages in order to ensure significant and sustainable
changes in behavior that improve child health.
33
References
Anderson, R., and R. May. 1992. Infectious Diseases of Humans: Dynamics and Control. Oxford, UK: Oxford University Press.
Angrist, J. 1996. Conditioning on the Probability of Selection to Control Selection Bias. NBER Technical Paper: No. 181.
Ansari, S., S. Sattar, V. Springthorpe, G. Wells, and W. Tostowaryk. 1989). In vivo protocol for testing efficacy of hand-washing agents against viruses and bacteria: Experiments with rotavirus and Escherichia coli. Applied and Environmental Microbiology 55, 3113–3118.
Babor, T., R. Caetano, S. Casswell et al. 2003. Alcohol: No ordinary commodity: Research and public health. Geneva: Oxford University Press/World Health Organization.
Banerjee, A., S. Cole, E. Duflo, and L. Linden. 2007. Remedying education: Evidence from two randomized experiments in India. The Quarterly Journal of Economics, Vol. 122 (3), pp. 1235–1264.
Banerjee, A., and E. Duflo. 2011. Poor Economics: A Radical Rethinking of the Way to Fight Global Poverty. Public Affairs, New York.
Banerjee, A., R. Glennerster, and D. Kothari. 2010. Improving immunization coverage in rural India: A clustered randomized controlled evaluation of immunization campaigns with and without incentives. British Medical Journal, 2010; 340: c2220.
Black, R., S. Morris, and J. Bryce. 2003. Where and why are 10 million children dying every year? Lancet 361, 2226–2234.
Bowen, A., H. Ma, J. Ou, W. Billhimer, T. Long, and E. Mintz. 2007. A cluster-randomized controlled trial evaluating the effect of a handwashing-promotion program in Chinese primary schools. American Journal of Tropical Medicine and Hygiene 76(6): 1166–1173.
Campbell, K., E. Water, S. O’Meara, and C. Summerbell. 2001. Interventions for preventing obesity in childhood: A systematic review. Obesity Reviews 2, 149–157
Cattaneo, M., S. Galiani, P. Gertler, S. Martinez, and R. Titiunik. 2009. Housing, health, and happiness. American Economic Journal: Economic Policy, American Economic Association, 1(1), pages 75–105, February.
Chapman, S. 2010. Evaluating social marketing interventions. Evaluating Health Promotion: Practice and Methods, 3rd ed. Eds. Margaret Horogood and Yolande Coombes, 105–120. Oxford: Oxford University Press.
Clasen, T., D. Fabini, S. Boisson, J. Taneja, J. Song, E. Aichinger, A. Bui, S. Dadashi, W. Schmidt, Z. Burt, and K. Nelson. 2012. Making sanitation count: Developing and testing a device for assessing latrine use in low-income settings. Environmental Science & Technology, forthcoming.
34
Curtis, V., S. Cairncross, and R. Yonli. 2000. Tropical Medicine and International Health 5 (1), 22–32, January.
Curtis, V., and S. Cairncross. 2003. Effect of washing hands with soap on diarrhea risk in the community: a systematic review. The Lancet Infectious Diseases 3 (5), 275–281, May.
Engle, P., M. Black, J. Behrman, M. Cabral de Mello, P. Gertler, L. Kapiriri, R. Martorell, and M. Young. 2007. Strategies to avoid the loss of developmental potential among 200 million children in the developing world. The Lancet 329, 229–240.
Esrey, S., J. Potash, L. Roberts, and C. Shiff. 1991. Effects of improved water supply and sanitation on ascariasis, diarrhea, dracunculiasis, hookworm infection, schistosomiasis and trachoma. Bulletin of the World Health Organization 69, 609–621.
Faix, R. 1987. Comparative efficacy of handwashing agents against cytomegalovirus. Infection Control 8, 158–162.
Favin, M. 2011. Endline Assessment of the Enabling Environment in Peru. Water and Sanitation Program, World Bank, August 2010.
Galiani, S., P. Gertler, and E. Schargrodsky. 2005. Water for life: The impact of the privatization of water services on child mortality. Journal of Political Economy 113(1), 83–120, February.
Galiani, S., and A. Orsola-Vidal. 2010. Scaling Up Handwashing Behavior: Findings from the Impact Evaluation Baseline Survey in Peru. Water and Sanitation Program, World Bank, August 2010.
Gibson, L., J. Rose, C. Haas, C. Gerba, and P. Rusin. 2002. Quantitative assessment of risk reduction from hand washing with antibacterial soaps. Journal of Applied Microbiology 92, 136S–143S.
Hendley, J., R. Wenzel, and J. Gwaltney. 1973. Transmission of rhinovirus colds by self-inoculation. The New England Journal of Medicine 288, 1361–1364.
Hesham, M., A. Edariah, and M. Norhayati. 2004. Intestinal parasitic infections and micronutrients deficiency: A review. Medical Journal of Malaysia 59(2): 284–293.
Instituto Nacional de Estadísticas e Informática (INEI). 2012. Condiciones de Vida en Peru, Octubre-Noviembre-Diciembre 2011.
International Monetary Fund (IMF). 2011. World Economic Outlook.
Luby, S., M. Agboatwalla, J. Paynter, A. Altaf, W. Billhimer, and R. Hoekstra. 2001. Effect of intensive handwashing promotion on childhood diarrhea in high-risk communities in Pakistan. JAMA, Journal of the American Medical Association 291(21), 2547–2554.
35
Luby, S., M. Agboatwalla, D. Feikin, J. Painter, W. Billhimer, A. Altaf, and R. Hoekstra. 2005. Effect of handwashing on child health: a randomized controlled trial. The Lancet 366, 225–233.
Luby, S., A. Halder, T. Huda, L. Unicomb, and R. Johnston. 2011. The effect of handwashing at recommended times with water alone and with soap on child diarrhea in rural Bangladesh: An observational study. PLoS Med 8(6), e1001052; doi:10.1371/journal.pmed.1001052.
Madajewicz, M., A. Pfaff, A. van Geen, J. Graziano, I. Hussein, H. Momotaj, R. Sylvi, and H. Ahsan. 2007. Can information alone change behavior? Response to arsenic contamination of groundwater in Bangladesh. Journal of Development Economics, 84(2), pp. 731–754.
Montville, R., Y. Chen, and D. Schaffner. 2002.Risk assessment of hand washing efficacy using literature and experimental data. International Journal of Food Microbiology 73, 305–313.
Nokes, C., S. Grantham-McGregor, A. Sawyer, E. Cooper, and D. Bundy. 1992. Parasitic Helminth infection and cognitive function in schoolchildren. Proceedings of the Royal Society of London, Series B, Biological Sciences 247: 77–81.
Pollit, E. 1990. Malnutrition and Infection in the Classroom. Paris, France: UNESCO.
Ram, P. 2010. Guidance for Measuring Handwashing Behavior. The Water and Sanitation Program.
Scott, B., V. Curtis, and T. Rabie. 2003. Protecting children from diarrhea and acute respiratory infections: the role of handwashing promotion in water and sanitation programmes. Regional Health Forum WHO South-East Asia Region 7,42–47.
Summerbell, C., W. Waters, L. Edmunds, S. Kelly, T. Brown, and K. Campbell. 2007. Interventions for preventing obesity in children. Cochrane Database of Systematic Reviews, Issue 3 Art. No.: CD001871. DOI: 10.1002/14651858. CD001871.pub2.
WHO. 2002. The World Health Report 2002: Reducing Risks, Promoting Healthy Life. World Health Organization, Geneva.
WHO. 2003. Update 47—Studies of SARS Virus Survival, Situation in China. Available at: http://www.who.int/csr/sarsarchive/2003_05_05/en/ (accessed July 16, 2003).
World Bank. 2005. The Handwashing Handbook: A Guide for Developing a Hygiene Promotion Program to Increase Handwashing with Soap.
36
Table 1: Effect of the Interventions on Exposure to Handwashing Promotion
Table 2: Effect of the Interventions on Handwashing Determinants
Control mean Effect of treatment Control mean Effect of treatment Control mean Effect of treatment
High exposure to the treatments 0.147 -0.0039 0.147 0.0551 0.2 -0.0275(HW message through three channels) (0.037) (0.037) (0.041)
Medium exposure to the treatments 0.432 -0.000929 0.432 0.145*** 0.499 0.065(0.058) (0.051) (0.050)
[33.5%]
Low exposure to the treatments 0.674 -0.065 0.674 0.106** 0.717 0.0637*(0.051) (0.045) (0.042)
[15.7%] [8.9%]
Clustered standard errors in parentheses; *** p<0.01 ** p<0.05 * p<0.1
Province level intervention District level interventionMass media treatment Community treatment sample School component sample
Exposure+
(HW message through two channels)
(HW message through one channel)
+Channels: mass media (radio and/or printed materials), promotional events and personal training/educational sessions
Control mean Effect of treatment Control Mean Effect of treatment Control Mean Effect of treatment
Province level intervention District level interventionMass media treatment Community treatment sample School component sample
Difference
Control mean Treatment mean
Difference
Treatment meanControl mean
40
N Avg. N Avg. N Avg. N Avg. N Avg. N Avg.Percentage of employed HH heads 707 0.945 714 0.948 -0.003 707 0.945 762 0.963 -0.018 682 0.965 705 0.956 0.009
Last week activity: HH headLooking for work 39 0.231 37 0.135 0.096 39 0.231 28 0.286 -0.055 24 0.167 31 0.226 -0.059Taking care of home 39 0.462 37 0.324 0.138 39 0.462 28 0.357 0.105 24 0.542 31 0.484 0.058Not working and not looking for job 39 0.128 37 0.216 -0.088 39 0.128 28 0.25 -0.122 24 0.208 31 0.161 0.047Other 39 0.179 37 0.324 -0.145 39 0.179 28 0.107 0.072 24 0.083 31 0.129 -0.046Percentage of employed other HH members 1055 0.344 1273 0.346 -0.002 1055 0.344 1289 0.38 -0.036 1151 0.381 1119 0.35 0.031Last week activity: other HH membersLooking for work 692 0.01 832 0.006 0.004 692 0.01 799 0.005 0.005 713 0.011 727 0.003 0.008*Studying 692 0.136 832 0.137 -0.001 692 0.136 799 0.14 -0.004 713 0.181 727 0.169 0.012Taking care of home 692 0.803 832 0.802 0.001 692 0.803 799 0.801 0.002 713 0.75 727 0.779 -0.029Not working and not looking for job 692 0.04 832 0.038 0.002 692 0.04 799 0.038 0.002 713 0.046 727 0.03 0.016Other 692 0.01 832 0.017 -0.007 692 0.01 799 0.016 -0.006 713 0.011 727 0.019 -0.008
District level interventionCommunity treatment sample School component sample
Control mean Treatment mean
Difference
Treatment mean Treatment meanControl mean Treatment mean
Difference
Mass media treatmentProvince level intervention
41
Household Assets
N Avg. N Avg. N Avg. N Avg. N Avg. N Avg.Average HHs non labor income 312 110.37 240 106.01 4.36 312 110.37 205 106.13 4.24 315 111.45 191 129.89 -18.44
District level interventionMass media treatment Community treatment sample School component sample
Control mean Treatment mean
Difference
Treatment meanControl mean
46
Handwashing Facilities
N Avg. N Avg. N Avg. N Avg. N Avg. N Avg.Wash hands after going to toilet 698 0.986 707 0.993 -0.007 698 0.986 738 0.985 0.001 675 0.994 674 0.987 0.007Place where usually wash hands after going to toilet 0 0
Province level intervention District level interventionMass media treatment Community treatment sample School component sample
Difference
Control mean Treatment mean
Difference
Control mean Treatment meanControl mean Treatment mean
48
Handwashing Behavior
N Avg. N Avg. N Avg. N Avg. N Avg. N Avg.
Percentage of caregivers that washed their hands with soap since yesterday 712 0.997 720 0.999 -0.002 712 0.997 765 0.996 0.001 693 0.999 707 0.994 0.005Last moment of hand wash since yesterday
Province level intervention District level interventionMass media treatment Community treatment sample School component sample
Control mean Treatment mean
Difference
Control mean Treatment mean
Difference
Treatment meanControl mean
49
Mass Media
Family-School Relationship
N Avg. N Avg. N Avg. N Avg. N Avg. N Avg.Recalls of any handwashing campaign 714 0.245 722 0.253 -0.008 714 0.245 769 0.224 0.021 694 0.272 711 0.226 0.046
Control mean Treatment mean
Difference
Province level intervention District level interventionMass media treatment Community treatment sample School component sample
Difference
Control mean Treatment mean
Difference
Control mean Treatment mean
N Avg. N Avg. N Avg. N Avg. N Avg. N Avg.Participation in schools activitiesParents association 296 0.176 389 0.288 -0.112** 296 0.176 301 0.256 -0.08 688 0.196 702 0.249 -0.053Speeches, conferences 296 0.267 389 0.342 -0.075 296 0.267 301 0.369 -0.102* 688 0.298 702 0.325 -0.027Kermesses 296 0.139 389 0.111 0.028 296 0.139 301 0.096 0.043 688 0.122 702 0.094 0.028APAFA 296 0.72 389 0.584 0.136** 296 0.72 301 0.611 0.109* 688 0.67 702 0.598 0.072Other 296 0.199 389 0.185 0.014 296 0.199 301 0.169 0.03 688 0.161 702 0.175 -0.014Does not participate 296 0.034 389 0.09 -0.056** 296 0.034 301 0.053 -0.019 688 0.078 702 0.078 0Percentage of caregivers that recall any campaign on health and hygiene promoted by the school 296 0.338 389 0.298 0.04 296 0.338 301 0.336 0.002 688 0.39 702 0.392 -0.002
*p < 10%, ** < 5%, *** < 1%
Control mean Treatment mean
Difference
Province level intervention District level interventionMass media treatment Community treatment sample School component sample
Controls NO YES YESDistrict dummies NO NO YESClustered standard errors in parentheses; *** p<0.01 ** p<0.05 * p<0.1
Parasites in child stools
67
Appendix 4: Variable Description
Variable Unit of Observation Description Total Number of Observations (endline)
Individual Characteristics
Age: Head of HH Head of HH Average age in years 3,518
Age: Other HH members Other HH members Average age in years 14,981 Gender (male): Head of HH Head of HH Male gender indicator 3,518 Gender (male): Other HH members Other HH members Male gender indicator 14,981 Average number of children under 5 HH Children under 5 per HH 3,563 Average household size HH Members per HH 3,547 Percent of Heads of HH that ever attended school Head of HH - 3,495 Highest educational level achieved: Head of HH Head of HH - 3,308 Percent of other HH members that ever attended school Other HH members - 10,345
Highest educational level achieved: other HH members Other HH members - 9,840
Percent of teenagers that spent time on school and other activities Attending school individuals Positive hours indicator 19903
Percent of employed heads of HH Head of HH Employment status indicator 3,514 Last week activity: head of HH Unemployed head of HH - 225
Percent of employed other HH members Other HH members Employment status indicator, +15 years 5,224
Last week activity: other HH members Unemployed other HH members - 3,328 Primary work: position Employed individuals - 6,797 Primary work: monthly salary Employed individuals - 5,850 Primary work: hours per week Employed individuals - 6797 Primary work: months worked in last 12 months Employed individuals - 6,797 Households Assets HH’s assets Household Possession of assets indicator 3,547 Percent of HHs having other piece of land Household Land possession indicator 3,547
Percent of HHs having farm equipment Household Farm equipment possession indicator 3,547
Percent of HHs having animals Household Animal possession indicator 3,547
Average number of livestock owned Household Average number of total livestock owned 3.547
Dwelling ownership Household - 3,547
68
Dwelling Characteristics
Type of dwelling Household - 3,544
Dwelling light source Household - 3,547 Dwelling cooking fuel Household - 3,5447 Dwelling heat fuel Household - 3,547 Material of dwelling's walls Household - 3,544 Material of dwelling's roof Household - 3,544 Material of dwelling's floor Household - 3,543 Percent of HHs with food not covered Household - 3,055 Percent of clean HHs Household - 3,527 Percent of HHs with garbage in kitchen or house Household - 3,255 Main toilet facility Household - 3,547
Toilet Facilities Percent of toilet facilities that are public Household - 3,033 Location of main toilet facility Household - 3,547 Percent of shared toilet facility Household - 3,547 Percent of safe toilet facilities during the night Household - 3,547 Disposal of child defecation Household - 3,547 Improved water source Household - 3,492 Improved sanitation Household - 3,547 Soap and water at handwashing station Household - 3,547 Water Source
Source of drinking water Household Rainy station only, Smaller categories grouped in Other 3,547
Source location Household Rainy station only 263 Covered source Household Rainy station only 263 Who mainly collects water from this source Household Rainy station only 806 Satisfied with the quantity Household Rainy station only 3,526 Does the household pay for the water Household Rainy station only 3,529 Fixed, limited quantity obtained for the payment Household Rainy station only 2,374 How water was prepared (last seven days) Household - 3,067 Wash hands after going to toilet Household Yes/No: Any HH member 3,526 Handwashing Facilities
Place where usually wash hands after going to toilet Household - 3,435
69
Handwashing device, toilet Household - 3,252 Water available at handwashing station Household - 1107 Soap available Household Allows multiple answers 3,547 Wash hands before/after cooking, feeding a child Household Any HH member 3,529 Place where usually wash hands before/after cooking, feeding a child Household - 3,49
Handwashing facilities stocked with water and soap Household
Percent of HH that have a place to wash hands inside the house or in the yard (in this case, ONLY if it less than 3 meters away from a bathroom); the place must have water available and soap of any kind.
3,547
Water and soap anywhere in the house Household Percent of HH that have a place to wash hands (anywhere) with water available and soap of any kind.
3,547
Exposure Measures
High exposure to the treatments Caregivers
Percent of caregivers exposed to handwashing promotion through three channels (mass media, promotional events and training/educational sessions)
3,545
Medium exposure to the treatments Caregivers
Percent of caregivers exposed to handwashing promotion through two channels (mass media and either promotional events or training/educational sessions)
3,545
Low exposure to the treatments Caregivers
Percent of caregivers exposed to handwashing promotion through one channel only (mass media or promotional events or training/educational sessions)
3,545
Handwashing Knowledge
Events that require handwashing (summary index) Caregivers
Proportion of “yes” answers to the following questions: “When do you think it is necessary to wash your hands with soap? A) After cleaning baby bottom; B) After using the toilet, C) Before Eating; D) Before feeding the baby; E) Before preparing food”.
3,591
Best method to wash hands is using water and soap ( Caregivers Percent of caregivers that answer 3,553
70
percent) “washing hands with water and soap” to the following question: “What is the best way to clean hands”
Main cause of diarrhea is not washing hands with water and soup ( percent) Caregivers
Percent of caregivers that mention “Not washing hands with water and soap” to the following question: “What causes diarrhea?”
3,582
Family-School Relationship
Percent of caregivers that recall any campaign on health and hygiene promoted by the school
Caregiver of child attending primary school
- 2,376
Handwashing Behavior Percent of caregivers that washed their hands with soap since yesterday
Caregiver of child under the age of 5 - 3,579
Last moment of hand wash since yesterday Caregiver of child under the age of 5 Allows multiple answers 3,196
Best way to clean hands Caregiver of child under the age of 5 Allows multiple answers 3,553
Caregiver's fingernails are: Caregiver of child under the age of 5 - 3,556
Caregiver's palms are: Caregiver of child under the age of 5 - 3,556
Caregiver's finger pads are: Caregiver of child under the age of 5 - 3,556
Recalls of any handwashing campaign Caregiver of child under the age of 5 - 3,543
Participation in schools activities Caregiver of child attending primary school Allows multiple answers 3,543
Hands Cleanliness Index Caregiver of child attending primary school
Index composed by three elements: • Nails: +1 if visibly dirty, +2
if apparently dirty, +3 if clean.
• Palms: +1 if visibly dirty, +2 if apparently dirty, +3 if clean.
• Fingerpads: +1 if visibly dirty, +2 if apparently dirty, +3 if clean.
The range of the index is from 3 to 9, and it goes up when hands are
3,549
71
cleaner. Handwashing w/soap and water previous to eat Caregiver Self-reported handwashing with
soap previous to eat 3,560
Handwashing w/soap and water before food preparation Caregiver Self-reported handwashing with
soap before preparing food 3,560
Handwashing w/ soap and water after fecal contact Caregiver
Self-reported handwashing with soap after fecal contact (after using the bathroom/after changing diaper)
3,560
Handwashing w/ soap and water before feeding child Caregiver Self-reported handwashing with
soap before feeding child 3,560
Structured Observations Observed handwashing w/soap and water previous to eat Caregiver Observed handwashing with soap
prior to eating 1,255
Observed handwashing w/soap and water before food preparation
Caregiver Observed handwashing with soap before preparing food 1,256
Observed handwashing w/soap and water after fecal contact
Caregiver Observed handwashing with soap after fecal contact (after using the bathroom/after changing diaper)
901
Observed handwashing w/soap and water before feeding child
Caregiver Observed handwashing with soap before feeding child 250
Childcare Situation Percent of children with clean aspect Children under the age of 5 - 4,563 Percent of children with dirty hands Children under the age of 5 - 4,563 Percent of children with dirty finger nails Children under the age of 5 - 4,563 Percent of children with dirty face Children under the age of 5 - 4,563 Percent of children wearing clothes Children under the age of 5 - 4,563 Percent of children with dirty clothes Children under the age of 5 - 4,563 Percent of children with pot-belly Children under the age of 5 - 4,563 Percent of children wearing shoes (or shoes available) Children under the age of 5 - 4,563 Percent of children that play with household objects Children under the age of 5 - 688 Percent of children that play with toys Children under the age of 5 - 688 Average number of children's books or pictures Children under the age of 5 - 688 Percent of children that attended early education programs Children under the age of 5 - 688 Percent of adults that read books with child Children under the age of 5 - 688 Percent of adults that tell stories to the child Children under the age of 5 - 688 Percent of adults that take the child outside the home Children under the age of 5 - 688 Percent of adults that play with the child Children under the age of 5 - 688
72
Average daily caring time Caregiver of child under the age of 5 - 4,404
Child Development
ASQ communication skills-for-age z-score Children under the age of 5 Z-score computed child development index based on caregivers responses to certain child’s reactions to specific stimuli and achieved milestones. The questions were based on the Ages and Stages Questionnaire and the skills measured included three domains: communications, gross-motor and social/personal skills. age.
3,628
ASQ gross-motor skills-for-age z-score Children under the age of 5 3,624
ASQ social-personal skills-for-age z-score Children under the age of 5 3,627
Average number of times child was left at the charge of another child Children under the age of 2 - 688
Average number of times was child left alone Children under the age of 2 - 688 Child Health
ALRI prevalence (48 hours) Children under the age of 5 ALRI symptoms: constant cough or difficulty breathing, and raised respiratory rate (according to WHO)
4,563
ALRI prevalence (7 days) Children under the age of 5 4,563
Diarrhea prevalence (48 hours) Children under the age of 5 Diarrhea symptoms: 3 or more stools per day and stools were loose or watery, or blood and/or mucus were present in stool.
4,563
Diarrhea prevalence (7 days) Children under the age of 5 4,563
Anemia (Hb < 110 g/L) Children under the age of 5
Percent of children under 5 with hemoglobin levels < 100 g/L. Hemoglobin counts were altitude-adjusted
4,083
Anthropometric Measures
BMI-for-age z-score Children under the age of 5 Z-scores were adjusted taking into account child’s age; values outside reasonable bounds were not considered (following
4,347
Head circumference-for-age z-score Children under the age of 5 4,375
Length/height-for-age z-score Children under the age of 5 4,354 Arm circumference-for-age z-score Children under the age of 5 4,342
73
Weight-for-length/height z-score Children under the age of 5 recommendations by WHO)
BMI stands for body mass index.
4,343
Weight-for-age z-score Children under the age of 5 4,369
Prevalence of stunting ( percent) Children under the age of 5
Percent of children under 5 whose length/height-for-age indicator is less than 2 SD from its Z-score mean.
4,354
Prevalence of underweight ( percent) Children under the age of 5
Percent of children under 5 whose weight-for-age indicator is less than 2 SD from its Z-score mean.
4,369
Prevalence of wasting ( percent) Children under the age of 5
Percent of children under 5 whose weight-for-length indicator is less than 2 SD from its Z-score mean.
4,343
Water Contamination
Prevalence of E.Coli Children under 5
=1 if E.Coli> 0.013 NMPx mL, 0 otherwise Water collected only in T3
575
Prevalence of total coliforms Children under 5
=1 if Total Coliforms > 0.013 NMPx mL, 0 otherwise Water collected only in T3
575
Parasite Prevalence
Prevalence of any parasites Children under 5
Percent of children with any parasites (Trichura, Ascaris, Uncinaria or others) detected in stool samples
1,552
Parasite count Children under 5
Parasite count present in child’s stool sample. It sums 1 for each different type of parasite found on the sample (Trichura, Ascaris, Uncinaria, Others)