Promoting Institutional Deliveries In Rural India: The Role of Antenatal-Care Services K. S. Sugathan, Vinod Mishra, and Robert D. Retherford National Family Health Survey Subject Reports Number 20 • December 2001 International Institute for Population Sciences Mumbai, India East-West Center, Population and Health Studies Honolulu, Hawaii, U.S.A.
Transcript
Promoting InstitutionalDeliveries In Rural India:The Role of Antenatal-CareServices
India’s first and second National Family Health Surveys (NFHS-1 and NFHS-2) were conducted
in 1992–93 and 1998–99 under the auspices of the Ministry of Health and Family Welfare. The
surveys provide national and state-level estimates of fertility, infant and child mortality, familyplanning practice, maternal and child health, and the utilization of services available to mothers
and children. The International Institute for Population Sciences, Mumbai, coordinated the
surveys in cooperation with selected population research centres in India, the East-WestCenter in Honolulu, Hawaii, and ORC Macro in Calverton, Maryland. The United States Agency
for International Development (USAID) provided funding for the NFHS, and United Nations
Population Fund (UNFPA) provided support for the preparation and publication of this report.
ISSN 1026-4736
This publication may be reproduced for educational purposes.
Promoting InstitutionalDeliveries In Rural India:The Role of Antenatal-CareServices
ABSTRACT
India’s maternal and child health programmes have not aggressively promoted
institutional deliveries, except in high-risk cases. The reason is that provision of
facilities for institutional delivery on a mass scale in rural areas is viewed as a
long-term goal requiring massive health infrastructure investments. Institutional
delivery is nevertheless desirable, inasmuch as it reduces the risk of both mater-
nal and infant mortality. This report examines the role of existing antenatal-care
services in promoting institutional delivery in rural areas of four Indian states—
Andhra Pradesh, Gujarat, Bihar, and Rajasthan, selected from the southern,
western, eastern, and northern parts of the country, respectively. Currently, about
one in two births in Andhra Pradesh and Gujarat, about one in five births in
Rajasthan, and about one in six births in Bihar are delivered in medical institutions.
Because the likelihood of delivering in a medical institution is influenced
not only by use of antenatal-care services but also by such potentially con-
founding factors as mother’s age, education, exposure to mass media, house-
hold standard of living, and access to health services, these other factors are
statistically controlled (i.e., held constant) when estimating the effects of ante-
natal care on institutional delivery. Logistic regression is used for this purpose.
The analysis is based on data from India’s first and second National Family
Health Surveys (NFHS-1 and NFHS-2).
The results indicate that, even after statistically controlling for other fac-
tors, mothers who received antenatal check-ups are two to five times more likely
to give birth in a medical institution than mothers who did not receive any ante-
natal check-up. Among the other factors considered, mother’s age and educa-
tion and child’s birth order also have strong effects on the likelihood of
institutional delivery. Household standard of living also has a substantial effect
in most cases. Contrary to expectation, access to health services, as measured
by availability of a hospital within 5 km of the village and by availability of an
4
National Family Health Survey Subject Reports, No. 20
all-weather road connecting the village to the outside, does not have a statisti-
cally significant effect on institutional delivery in most cases.
Overall, antenatal care is the strongest predictor of institutional delivery,
a finding that has important programme implications. It suggests that it is pos-
sible to promote institutional delivery by promoting antenatal check-ups and
associated counseling. Given that distance to a hospital does not have a signifi-
cant effect on institutional delivery, it may not be necessary to create new hospi-
tals (at least not for the purpose of encouraging institutional delivery), but
rather to focus on expanding the availability and quality of services at existing
facilities, as well as counseling and educating mothers about the importance of
giving birth in medical institutions under the supervision of trained profession-
als. Because a much higher proportion of institutional deliveries take place in
private-sector facilities than in public-sector facilities in three of the four states,
efforts should also be made to strengthen private-sector health facilities to make
them more accessible to rural mothers, in terms of cost and quality of services.
In addition, since half or more of deliveries in all four states still occur at home,
efforts to train traditional birth attendants, increase the availability of trained
midwives, promote home visits by paramedics for antenatal check-ups, distrib-
ute iron and folic acid tablets, and vaccinate against tetanus should continue.
K. S. Sugathan, Vinod Mishra, and Robert D. Retherford
K. S. Sugathan is the Principal Secretary and Principal Resident Commissioner
of Government of Gujarat at New Delhi. Vinod Mishra is a Fellow, and Robert
D. Retherford is Coordinator in Population and Health Studies at the East-West
Center in Honolulu, Hawaii.
National Family Health Survey Subject Reports, Number 20 • December 2001
5
National Family Health Survey Subject Reports, No. 20
INTRODUCTION
It is well established that giving birth in a medical institution under the care and super-
vision of trained health-care providers promotes child survival and reduces the risk of
maternal mortality. In India, both child mortality (especially neonatal mortality) and
maternal mortality are high. Seven out of every 100 children born in India die before
reaching age one, and approximately five out of every 1,000 mothers who become
pregnant die of causes related to pregnancy and childbirth. India accounts for more
than one-fifth of all maternal deaths from causes related to pregnancy and childbirth
worldwide.
Despite the many benefits associated with institutional delivery, India’s maternal
and child health programmes have not aggressively promoted institutional deliveries,
except in high-risk cases. The reason is that providing facilities for institutional deliv-
ery on a mass scale in rural areas is viewed as a long-term goal requiring massive
health infrastructure investments. In recent years, however, there has been a shift in
this policy with the establishment of the Child Survival and Safe Motherhood (CSSM)
and the Reproductive and Child Health (RCH) programmes. The new programmes
aim at expanding existing rural health services to include facilities for institutional
delivery. Existing maternal and child health services at primary health centres (PHCs)
are being upgraded, and new first-referral units (FRUs) are being set up at the sub-
district level to provide comprehensive emergency obstetric and new-born care (Min-
istry of Health and Family Welfare, n.d.).
Despite the uniformity in programme design throughout the country, there is
considerable regional diversity in the availability and quality of health services, includ-
ing maternal health services. In 1992–93, according to NFHS-1, the proportion of
mothers receiving antenatal check-ups ranged from 31 percent in Bihar to 94
percent in Tamil Nadu, and the proportion giving birth in medical institutions ranged
from 11 percent in Rajasthan and Uttar Pradesh to 88 percent in Kerala (IIPS
1995). In 1998–99, according to NFHS-2, the proportion receiving antenatal
check-ups ranged from to 34–36 percent in Uttar Pradesh and Bihar to 98 per-
cent in Kerala and Tamil Nadu, and the proportion giving birth in medical institu-
tions ranged from 22–23 percent in Uttar Pradesh and Bihar to 95 percent in
Kerala (IIPS and ORC Macro 2000a).
The explanation of this diversity is complex. Utilization of health services is
affected by a multitude of factors including not only availability, distance, cost, and
quality of services, but also by socioeconomic factors and personal health beliefs. In
an attempt to understand the factors that determine women’s utilization of health
services, Chatterjee (1990) posited the role of need, permission, ability, and availabil-
ity. He reasoned that when permission and ability interact with need, a demand for
6
National Family Health Survey Subject Reports, No. 20
health services is generated. Actual utilization of health services occurs when this
generated demand overlaps with availability. In the Indian context, the situation is
further complicated by women’s perceptions of illness, which are affected by women’s
cultural conditioning to tolerate suffering. Because of this tolerance, which varies
considerably across regions of India, the perceived need for health services can be
small even when the actual need is great.
Another factor affecting women’s health-seeking behavior, especially as re-
lated to pregnancy and childbirth, is that traditionally in rural India pregnancy is con-
sidered a natural state of being for a woman rather than a condition requiring medical
attention and care. Such perceptions and beliefs constitute a “lay-health culture” that
is an intervening factor between the presence of a morbidity condition and its corre-
sponding treatment. Postnatal care and infant and child health care are similarly af-
fected by this culture, with the result that women often do not avail themselves of
preventive and curative medical services intended to safeguard their own and their
children’s health and well-being. The lay-health culture presumably has substantial
effects on utilization of maternal health services in regions of the country where
poverty and illiteracy are widespread. This culture is difficult to measure directly, but
it is possible to include socioeconomic factors that are correlated with it when analyz-
ing utilization of maternal health services.
Several studies have attempted to identify and measure the effects of the fac-
tors that contribute to differential use of maternal health services. Based on data
from NFHS-1, a multivariate analysis of utilization of maternal and child health ser-
vices in India and four major northern states concluded that utilization of maternal and
child health services in rural areas is driven primarily by socioeconomic factors, such
as education, media exposure, and standard of living, that create a demand for ser-
vices and much less so by physical access to and availability of health and family
welfare services (Das et al. 2001). Another study, also based on data from NFHS-1,
found that woman’s education is a major factor affecting utilization of maternal health
services in both north and south India (Govindasamy and Ramesh 1997).
A number of other studies have stressed the role of socioeconomic and demo-
graphic factors in influencing demand for and utilization of maternal and child health
services (Ray et al. 1984; Kanitkar and Sinha 1989; Elo 1992; Swenson et al. 1993;
Abdalla 1993; Govindasamy 1994; Khan et al. 1994; Barlow and Diop 1995; Ahmed
and Mosley 1997; Regmi and Manandhar 1997). Many of these studies have also
shown that utilization of maternal and child health services is strongly affected by
woman’s education. Other socioeconomic factors usually found to be important are
urban-rural residence, woman’s work status, woman’s status relative to men, religion,
caste/tribe membership, household standard of living (or economic status of the house-
hold), and community development.
7
National Family Health Survey Subject Reports, No. 20
Some studies have stressed the importance of access to health services as a
factor affecting the utilization of services (Rao and Richard 1984; Sarita and Tuominen
1993; Kumar et al. 1997; Rohde and Viswanathan 1994). Historically, improving ac-
cess to services has been a primary strategy for increasing health-service utilization
in developing countries. In recent years, field experience and data from both qualita-
tive and quantitative studies have indicated that improvements in the quality of ser-
vices can further increase service utilization. Programmes that maximize quality as
well as access to services enhance client satisfaction, leading to greater utilization
(Shelton and Davis 1996; Levine et al. 1992). It is argued that access helps determine
whether an individual makes contact with the provider, while quality of care influ-
ences a client’s decision whether to accept and use the service or to continue using
the service (Bertrand et al. 1995). Many of the above studies have stressed outreach
programmes, including home visits, mobile clinics, and community-based delivery
systems, as mechanisms to increase both the quantity and quality of services. Al-
though quality of services is often mentioned as an important factor in the utilization of
health services (Dennis et al. 1995; Shrestha and Ittiravivongs 1994; Phommasack
1995; Visaria 1999), much of the research on this subject refers to family planning
services rather than institutional delivery (Levine et al. 1992; Koenig and Khan 1999;
Koenig et al. 1999; Roy and Verma 1999; Khan et al. 1999; Gupte et al. 1999; UNECA
1989; Roberto 1993; Townsend et al. 1999; Patel et al. 1999; Satia and Sokhi 1999).
Some studies have presented evidence that the effects of inadequate access to
services on utilization of services are greater than the effects of socioeconomic fac-
tors (Sawhney 1993; Elo 1992) and that as access to public health facilities improves,
the effects of socioeconomic factors on utilization of services become less important
(Rosenzweig and Schultz 1982; Govindasamy and Ramesh 1997). Other studies ar-
gue that lack of motivation is the major factor in nonutilization of services, and that
provision of services alone cannot overcome lack of motivation or demand for ser-
vices (Ray et al. 1984).
As this brief review of literature illustrates, previous research provides conflict-
ing evidence on the relative importance of programmatic (supply) and nonprogrammatic
(demand) factors affecting health-seeking behavior. Also, there is little research on
how utilization of one type of health service might affect utilization of other types of
health service. In particular, there is no research that we know of that examines how
utilization of antenatal-care services affects the likelihood of giving birth in a medical
institution, which is the topic of the present study.
In this report we attempt to measure the effect of utilization of antenatal-care
services on the likelihood of institutional delivery, after controlling for the effects of a
number of demand and supply factors discussed above. Antenatal care is hypoth-
esized to have a positive effect on the likelihood of institutional delivery, inasmuch as
8
National Family Health Survey Subject Reports, No. 20
women receiving antenatal care come in contact with health-care providers who are
likely to encourage them to give birth in a medical facility. A complicating factor is
that women with pregnancy complications are more likely than other pregnant women
both to receive antenatal check-ups and to deliver in a health facility because of the
pregnancy complication. For these women the correlation between antenatal care
and institutional delivery arises not because of a causal effect of antenatal care on the
likelihood of institutional delivery but instead because a third, prior factor (pregnancy
complication) influences both the likelihood of antenatal care and the likelihood of
institutional delivery. As we shall see, however, statistically controlling for the pres-
ence or absence of pregnancy complications makes virtually no difference in the
results.
The analysis covers the states of Andhra Pradesh, Gujarat, Rajasthan, and Bihar.
Each of these states is from one of the four major regions of India—Rajasthan in the
north, Andhra Pradesh in the south, Bihar in the east, and Gujarat in the west. Andhra
Pradesh and Gujarat are states with relatively high utilization of maternal health ser-
vices, while Bihar and Rajasthan are states with relatively low utilization.
DATA AND METHODS
Data for this study are from India’s two National Family Health Surveys conducted in
1992–93 and 1998–99, respectively. NFHS-1 collected data from a nationally repre-
sentative sample (except for Sikkim, the Kashmir region of Jammu and Kashmir
state, and the small Union Territories, which were not included) of 89,777 ever-mar-
ried women age 13–49 years residing in 88,562 households. NFHS-2 collected data
from a nationally representative sample (except for the small Union Territories) of
90,303 ever-married women age 15–49 residing in 92,486 households. Data from
both surveys are representative at the state level.
The analysis here is based on births during the three-year period before each
survey to ever-married women in the four states of Andhra Pradesh, Gujarat, Bihar,
and Rajasthan. The NFHS-1 and NFHS-2 samples include, respectively, 1,412 and
1,129 such births in Andhra Pradesh; 1,499 and 1,324 births in Gujarat; 2,660 and
2,912 births in Bihar; and 2,197 and 3,076 births in Rajasthan.
In both NFHS-1 and NFHS-2, the sample design was such that in some states
certain categories of respondents (e.g., those from urban areas) were oversampled,
so that weights are needed to restore the correct proportions. The weights are de-
signed to preserve the total numbers of households and ever-married women inter-
viewed in each state, so that the weighted state total equals the unweighted state
total. Details of sample design, including sampling frame and sample implementation,
are provided in the basic survey reports for the four states (PRC Visakhapatnam and
9
National Family Health Survey Subject Reports, No. 20
IIPS 1995; IIPS and ORC Macro 2000b; PRC Vadodara and IIPS 1995; IIPS and
ORC Macro 2001a; PRC Patna and IIPS 1995; IIPS and ORC Macro 2001b; PRC
Udaipur and IIPS 1995; IIPS and ORC Macro 2001c).
Three types of questionnaires were administered in both NFHS-1 and NFHS-2:
a Household Questionnaire, a Woman’s Questionnaire, and a Village Questionnaire.
This report uses data from all three questionnaires. The Household Questionnaire
provides basic demographic and socioeconomic information on households. The
Woman’s Questionnaire provides, for ever-married women of reproductive age, in-
formation on socioeconomic and demographic characteristics, reproductive history,
contraceptive behavior, fertility preferences, and maternal and child health. The Vil-
lage Questionnaire provides information on various amenities available in sampled
villages, such as electricity, water, transportation, and various educational and health
facilities.
In both NFHS-1 and NFHS-2, mothers who gave birth during the three years
preceding the survey were asked if their delivery was assisted by a health profes-
sional, such as a doctor, auxiliary nurse midwife (ANM), lady health visitor (LHV), or
other nurse/midwife. Mothers were also asked if they delivered at home or in a
medical institution, such as a government or private hospital/clinic, primary health
centre, or maternity home. Whether the mother delivered in a medical institution (yes
or no) is the primary response variable in our analysis.
Each survey also collected information on utilization of specific antenatal-care
services for each pregnancy that resulted in a live birth during the three years preced-
ing the survey. Mothers were asked whether they had received any pregnancy-
related check-up from a doctor or a health worker in a health facility or at home (yes
or no). They were also asked whether they had received two or more doses of
tetanus toxoid vaccine during the pregnancy (yes or no). These two antenatal-care
variables are the primary predictor variables in our analysis.
As mentioned earlier, estimation of the effects of the antenatal-care variables
on the likelihood of institutional delivery requires statistical controls for other factors
that may be correlated with the antenatal-care variables. Failure to control for these
variables could bias the estimates of the effects of the antenatal-care variables. The
following demographic, socioeconomic, and health-services variables are included as
controls in the analysis: age of the mother at the time of survey (15–19, 20–24, 25–29,
30–49), birth order of child (1, 2, 3, 4+), religion of household head (Hindu, Muslim,
other), caste/tribe of household head (scheduled caste or scheduled tribe, other)1 ,
1Scheduled castes (SC) and scheduled tribes (ST) are castes and tribes identified by the Government of
India as socially and economically backward and in need of special protection from social injustice and
exploitation.
10
National Family Health Survey Subject Reports, No. 20
mother’s education (illiterate, literate but less than middle school complete, middle
school complete or higher), mother’s work status at the time of the survey (working,
not working), mother’s exposure to electronic mass media (regularly exposed, not
regularly exposed)2 , household standard of living (low, medium, high)3, 4 , availability
of a hospital within 5 km of the village (yes, no), and whether the village is connected
to the outside by an all-weather road (yes, no). Two additional variables for which
information was collected only in NFHS-2—decisionmaking about one’s own health
(self, jointly with others, not involved) and quality of health-care services in the pri-
mary sampling unit in which the mother resides (low, high)5 —are also included in the
bivariate analysis of variables that may be correlated with institutional delivery. But
because the decisionmaking and quality-of-care variables show little correlation with
institutional delivery, they are not included in the multivariate analysis.
2Listens to radio at least once a week, watches television at least once a week, or goes to a cinema hall or
theatre to see a movie at least once a month.
3In NFHS-1, standard of living is measured by an index defined in terms of ownership of household
goods. The standard of living index (SLI) is calculated by adding the following scores: house type: 4 for
pucca, 2 for semi-pucca, 0 for kachha; toilet facility: 4 for own flush toilet, 2 for public or shared flush
toilet or own pit toilet, 1 for shared or public pit toilet, 0 for no facility; source of lighting: 2 for electricity,
1 for kerosene, gas, or oil, 0 for other source of lighting; main fuel for cooking: 2 for electricity, liquified
natural gas, or biogas, 1 for coal, charcoal, or kerosene, 0 for other fuel; source of drinking water: 2 for
pipe, hand pump, or well in residence/yard/plot, 1 for public tap, hand pump, or well, 0 for other water
source; separate room for cooking: 1 for yes, 0 for no; ownership of house: 2 for yes, 0 for no; ownership
of agricultural land: 4 for 5 acres or more, 3 for 2.0–4.9 acres, 2 for less than 2 acres or acreage not known, 0
for no agricultural land; ownership of irrigated land: 2 if household owns at least some irrigated land, 0 for no
irrigated land; ownership of livestock: 2 if owns livestock, 0 if does not own livestock; durable goods
ownership: 4 for a car or tractor, 3 each for a scooter/motorcycle or refrigerator, 2.5 for a television, 2 each for
a bicycle, electric fan, radio/transistor, sewing machine, water pump, bullock cart, or thresher, 1 for a clock/
watch. Index scores range from 0–10 for low SLI, 10.5–20 for medium SLI, and 20.5–45.5 for high SLI.
4In NFHS-2, standard of living is measured by an index calculated by adding the following scores: house
type: 4 for pucca, 2 for semi-pucca, 0 for kachha; toilet facility: 4 for own flush toilet, 2 for public or
shared flush toilet or own pit toilet, 1 for shared or public pit toilet, 0 for no facility; source of lighting:
2 for electricity, 1 for kerosene, gas, or oil, 0 for other source of lighting; main fuel for cooking: 2 for
electricity, liquified natural gas, or biogas, 1 for coal, charcoal, or kerosene, 0 for other fuel; source of
drinking water: 2 for pipe, hand pump, or well in residence/yard/plot, 1 for public tap, hand pump, or
well, 0 for other water source; separate room for cooking: 1 for yes, 0 for no; ownership of house: 2 for
yes, 0 for no; ownership of agricultural land: 4 for 5 acres or more, 3 for 2.0–4.9 acres, 2 for less than 2
acres or acreage not known, 0 for no agricultural land; ownership of irrigated land: 2 if household owns at
least some irrigated land, 0 for no irrigated land; ownership of livestock: 2 if owns livestock, 0 if does not
own livestock; durable goods ownership: 4 for a car or tractor, 3 each for a moped/scooter/motorcycle,
telephone, refrigerator, or color television, 2 each for a bicycle, electric fan, radio/transistor, sewing
machine, black and white television, water pump, bullock cart, or thresher, 1 each for a mattress, pressure
cooker, chair, cot/bed, table, or clock/watch. Index scores range from 0–14 for low SLI, 15–24 for medium
SLI, and 25–67 for high SLI.
11
National Family Health Survey Subject Reports, No. 20
Presence or absence of pregnancy complications is another variable for which
information was collected only in NFHS-2. We defined two pregnancy-complications
variables. The first specification defines pregnancy complications as 1 if the mother
mentions any of the following and 0 if none are mentioned: night blindness; blurred
vision; convulsions not from fever; swelling of the legs, body, or face; excessive
fatigue; anaemia; or any vaginal bleeding. The second specification defines preg-
nancy complications more restrictively as 1 if the mother reports convulsions not
from fever or any vaginal bleeding and 0 if neither of these complications is reported.
As discussed earlier, the pregnancy-complications variable is considered because the
correlation between antenatal care and institutional delivery may arise not because of
a causal effect of antenatal care on the likelihood of institutional delivery but instead
because pregnancy complications have positive effects on both the likelihood of ante-
natal care and the likelihood of institutional delivery. However, neither of the preg-
nancy-complications variables has a statistically significant effect on the likelihood of
delivery in a medical institution, nor does its inclusion or exclusion in the statistical
models alter the estimated effect of antenatal care on delivery in a medical institution.
For this reason, and also because the question on pregnancy complications was not
asked in NFHS-1, the models presented in the tables below do not include a variable
for pregnancy complications.
Information on the three household-level variables is derived from the House-
hold Questionnaire; information on the five woman-level variables, one child-level
variable, and the quality-of-care index for each primary sampling unit is derived from
the Woman’s Questionnaire; and information on the two community-level variables is
derived from the Village Questionnaire. A complete listing of variables and their
definitions is shown in Table 1.
Each control variable has a rationale for inclusion. Mother’s age and child’s
birth order are included because they are correlated with utilization of antenatal- and
delivery-care services. Religion and caste/tribe variables help control for cultural
5NFHS-2 included several questions on quality of care for women who visited a health facility during the
12 months before the survey. Based on this information, an index of quality of care was constructed for
each primarily sampling unit (PSU, consisting of a rural village or urban block). This index was constructed
in several steps, as follows. First the following scores were added for each sampled woman in the PSU
who went to a health facility or provider during the 12 months before the survey: spent enough time: 1 for
yes , 0 for no; talked nicely: 2 for nicely, 1 for somewhat nicely, 0 for not nicely; need for privacy: 2 for
respected privacy, 1 for privacy not needed, and 0 for not respected need for privacy; and cleanliness: 2
for very clean, 1 for somewhat clean, and 0 for not clean. This score ranges from 0 to 7. A PSU-level
quality-of-care index was then calculated as the average score for these women. The average PSU-level
score was then assigned to all women and births in a given PSU. The index score was then dichotomized
as low if less than or equal to the median score for PSUs or high if greater than the median score for PSUs.
12
National Family Health Survey Subject Reports, No. 20
Table 1 Definitions of the variables included in the analysis of births during the 3-year periods precedingNFHS-1 and NFHS-2
Variable Definition
Age (in years)15–19 Mother’s age at the time of the survey is 15–19 years20–24 Mother’s age at the time of the survey is 20–24 years25–29 Mother’s age at the time of the survey is 25–29 years30–49 Mother’s age at the time of the survey is 30–49 years
Birth order1 First birth2 Second birth3 Third birth4+ Fourth or higher-order birth
ReligionHindu Mother lives in a household whose head is HinduMuslim Mother lives in a household whose head is MuslimOther Mother lives in a household whose head is neither Hindu nor Muslim
Caste/tribeScheduled caste/scheduled tribe Mother lives in a household whose head belongs to a scheduled caste (SC)
or scheduled tribe (ST)Other Mother lives in a household whose head does not belong to a scheduled
caste (SC) or scheduled tribe (ST)Woman’s education
Illiterate Mother is illiterateLiterate, < middle complete Mother is literate with less than a middle school educationMiddle complete or higher Mother is literate with at least middle school education
Current work statusNot working Mother is currently not working, aside from own household workWorking Mother is currently working, aside from own household work
Media exposureExposed Mother watches television or listens to radio at least once a week or visits a
cinema at least once a monthNot exposed Mother is not regularly exposed to any electronic mass media
Decisionmaking about own healthcarea
Self Mother herself makes the decision about obtaining health care for herselfJointly with others Mother makes the decision about obtaining health care for herself jointly with
husband or others in householdNot involved Mother not involved in decisionmaking for obtaining health care for herself;
husband or others in household make the decisionStandard of livingb,c
Low Mother lives in a household with a low standard of livingMedium Mother lives in a household with a medium standard of livingHigh Mother lives in a household with a high standard of living
Received antenatal check-upYes Mother received at least one antenatal check-up while pregnant with the
specified childNo Mother did not receive any antenatal check-up while pregnant with the
specified childReceived two or more tetanus toxoidinjections
Yes Mother received two or more tetanus toxoid injections while pregnant with thespecified child
No Mother received less than two tetanus toxoid injections while pregnant withthe specified child
Received professional assistanceat delivery
Yes Mother received assistance of a doctor, ANM/LHV, or nurse/midwife fordelivery of the specified childd
No Mother did not receive assistance of a doctor, ANM/LHV, or nurse/midwife fordelivery of the specified child
Delivered in a medical institutionYes Mother delivered the specified child in a medical institutionNo Mother did not deliver the specified child in a medical institution
cont.
13
National Family Health Survey Subject Reports, No. 20
variation in health-seeking practices. The various socioeconomic variables are in-
cluded because they also tend to be correlated with utilization of antenatal- and deliv-
ery-care services. Distance to a hospital and availability of an all-weather road affect
access to health services, which can influence utilization of antenatal- and delivery-
care services.
The multivariate statistical method used in the analysis is logistic regression,
with institutional delivery (yes or no) as the response variable, the two antenatal-care
variables discussed above as the primary predictor variables, and the ten demographic,
socioeconomic, and community-access variables discussed above as controls. The
twelve predictor variables are divided into four groups: background factors, demand
factors (socioeconomic), demand factors (antenatal care), and supply factors. For
each state and each survey, five alternative logistic regression models are estimated
using different combinations of these groups of variables. Background factors in-
clude age, birth order, religion, and caste/tribe. These are factors that affect the
likelihood of institutional delivery but are not easily amenable to change, and they are
included as controls in all five models. Demand factors (socioeconomic) include the
mother’s education, current work status, media exposure, and standard of living.
Demand factors (antenatal care) include whether the mother received at least one
antenatal check-up and whether the mother received two or more tetanus toxoid
injections during the pregnancy. Supply factors include availability of a hospital within
5 km of the village and availability of an all-weather road connecting the village to the
outside. The results of the multivariate analysis are presented in the form of odds ratios.
Table 1, cont. Definitions of the variables included in the analysis of births during the 3-year periodspreceding NFHS-1 and NFHS-2
Variable Definition
Availability of a hospital within 5 kmYes Mother lives in a village that has a government hospital, a community health
centre/rural hospital, or a private hospital within a distance of 5 kmNo Mother lives in a village that does not have any government hospital, commu-
nity health centre/rural hospital, or private hospital within a distance of 5 kmVillage has all-weather road
Yes Mother lives in a village that has an all-weather road within a distance of 1 kmthat connects the village to other places
No Mother lives in a village that does not have an all-weather road within adistance of 1 km that connects the village to other places
Quality of health care servicesa,e
Low Mother lives in a village with low-quality health care servicesHigh Mother lives in a village with high-quality health care services
aAvailable only for NFHS-2.bSee text footnote 3 for explanation of how the standard of living index (SLI) is defined using NFHS-1 data.cSee text footnote 4 for explanation of how the standard of living index (SLI) is defined using NFHS-2 data.dANM denotes auxiliary nurse midwife. LHV denotes lady health visitor.eSee text footnote 5 for explanation of how the quality-of-care index is constructed using NFHS-2 data.
14
National Family Health Survey Subject Reports, No. 20
Table 2 Selected background characteristics of Andhra Pradesh, Gujarat, Bihar, Rajasthan, and all India
AndhraCharacteristic Pradesh Gujarat Bihar Rajasthan All India
Population 2001 (millions)a 75.7 50.6 109.8 56.5 1,027.0
Per capita net State Domestic Product,1997–98 (Rs. at current prices) 10,590 16,251 4,654 9,256 12,729
Average rural population served by asub centrec 5,038 4,230 6,156 4,203 NA
Average rural population served by aprimary health centre (PHC)c 32,545 31,821 41,241 24,911 NA
Average population served by anallopathic hospitald 23,288 17,810 270,475 240,790 NA
Average distance to a primary healthcentre (km)c 7.3 7.9 5.0 8.0 6.6
NA: Not calculated because the reference years for states are not the same.
Notes:aFigures for Bihar include Jharkhand state. In 2000, the state of Jharkhand was created from part of Bihar.bLiteracy rates for Bihar are population-weighted averages of Bihar (post-2000) and Jharkhand states. Literacy rates pertain to ages 7 and above.cFigures for Andhra Pradesh refer to 1998, and figures for Gujarat, Bihar, and Rajasthan refer to 1999.dNot including community health centres (CHCs) and TB sanatoriums/clinics. Figures for Andhra Pradesh and Rajasthan refer to 1998,
figures for Bihar refer to 1992, and figures for Rajasthan refer to 1995.
Sources:
1. Central Statistical Organization. 2000. Selected Socio-Economic Statistics, India, 1998. New Delhi: Central Statistical Organization.
2. Office of the Registrar General. 2000. Sample Registration System, Statistical Report 1998. New Delhi: Office of Registrar General, India.
3. Ministry of Finance. 2000. Economic Survey 1999–2000. New Delhi: Ministry of Finance.
4. Ministry of Health and Family Welfare. 2000a. Bulletin on Rural Health Statistics, 2000 . New Delhi: Department of Family Welfare,
Ministry of Health and Family Welfare.
5. Ministry of Health and Family Welfare. 2000b. Health Information of India, 1997–98. New Delhi: Central Bureau of Health Intelligence,
Ministry of Health and Family Welfare.
RESULTS
Background Characteristics of the Study States
Table 2 shows selected socioeconomic and demographic indicators and indicators of
availability of health facilities for the four states of Andhra Pradesh, Gujarat, Bihar,
and Rajasthan and all India. The four states account for 28 percent of India’s popula-
tion. Bihar and Rajasthan are more backward than Andhra Pradesh and Gujarat on
most indicators. For example, levels of literacy—especially female literacy—are much
15
National Family Health Survey Subject Reports, No. 20
lower in Bihar and Rajasthan than in Andhra Pradesh and Gujarat. Fertility is much
higher in Bihar (4.3 children per woman) and Rajasthan (4.1) than in Andhra Pradesh
(2.4) and Gujarat (3.0). Per capita net state domestic product is about four times
higher in Gujarat than in Bihar. Although availability of government-sponsored pri-
mary health centres does not vary much among the four states, availability of hospi-
tals is much lower in Bihar and Rajasthan than in Andhra Pradesh and Gujarat.
Population served per hospital is 270,475 in Bihar, 240,790 in Rajasthan, 23,288 in
Andhra Pradesh, and 17,810 in Gujarat.
Patterns of Antenatal and Delivery Care
Table 3 presents rates of utilization of selected antenatal- and delivery-care services
for births in the three years preceding NFHS-1 and NFHS-2 in the four states by
urban/rural residence. In both NFHS-1 and NFHS-2, the proportions of mothers re-
ceiving antenatal care and delivery care are much lower in Bihar and Rajasthan than
in Andhra Pradesh and Gujarat. In all four states, the proportions receiving each of
the antenatal- and delivery-care services are higher in urban areas than in rural areas,
especially in Bihar and Rajasthan. Utilization of antenatal- and delivery-care services
Table 3 Percentage utilization of selected antenatal- and delivery-care services for births during thethree years preceding NFHS-1 and NFHS-2 by residence: Andhra Pradesh, Gujarat, Bihar, and Rajasthan
Delivered in a medical institutionTotal 35 50 37 46 13 15 12 22Rural 23 40 24 33 8 12 8 15Urban 69 79 64 69 42 41 34 48
Number of births 1,412 1,129 1,499 1,324 2,660 2,912 2,197 3,076
16
National Family Health Survey Subject Reports, No. 20
Table 4 Percentage distribution of births by place of delivery for births during the three years precedingNFHS-1 and NFHS-2 by residence: Andhra Pradesh, Gujarat, Bihar, and Rajasthan
improved in each state between NFHS-1 and NFHS-2, with the partial exception of
Bihar, where the proportion of mothers receiving an antenatal check-up declined
slightly between the two surveys. The proportion giving birth in medical institutions
increased considerably in Andhra Pradesh, Gujarat, and Rajasthan between
NFHS-1 and NFHS-2. In Bihar, however, it increased only marginally, from 13
percent to 15 percent.
Table 4 shows place of delivery for births in the three years preceding NFHS-1
and NFHS-2 in the four states by urban/rural residence. In all four states, the majority
of deliveries take place at home (either own home or parents’ home). In NFHS-2, the
proportion delivering in medical institutions is highest in Andhra Pradesh (50 percent),
followed by Gujarat (46 percent), Rajasthan (22 percent), and Bihar (15 percent). In
Andhra Pradesh, Gujarat, and Bihar, about three out of four deliveries in health facili-
ties take place in private-sector health facilities. But the situation is reversed in
Rajasthan, where about three out of four deliveries in health facilities take place in
public-sector health facilities. The proportion delivering in public-sector facilities de-
clined between the two surveys in Andhra Pradesh, Gujarat, and Bihar but increased
in Rajasthan. The proportion delivering in private medical institutions increased in all
four states. Use of private-sector facilities for delivery increased in both rural and
urban areas in all four states.
17
National Family Health Survey Subject Reports, No. 20
Correlates of Institutional Delivery
The likelihood of giving birth in a medical institution depends on many factors, includ-
ing urban/rural residence, mother’s demographic and socioeconomic characteristics,
and availability and quality of health services. Table 5 presents the proportion of rural
mothers giving birth in a medical institution during the three years preceding NFHS-1
and NFHS-2 by selected characteristics for each of the four states. The table shows
that older mothers are somewhat less likely to give birth in a medical institution than
younger mothers. It also shows that first-order births to rural mothers are much more
likely to take place in a medical institution than second or higher-order births. In
NFHS-2 in Andhra Pradesh, for example, 53 percent of first-order births but only 24
percent of fourth or higher-order births took place in medical institutions. In NFHS-2,
Hindu mothers are somewhat more likely than Muslim mothers to deliver in a medical
institution in Bihar and Rajasthan, but somewhat less likely to do so in Andhra Pradesh
and Gujarat. In all four states, rural mothers belonging to scheduled castes or sched-
uled tribes are much less likely to give birth in a medical institution than mothers not
belonging to a scheduled caste or scheduled tribe.
Institutional delivery is positively associated with mother’s education, exposure
to mass media, and household standard of living. Among rural mothers, literate moth-
ers are much more likely to give birth in a medical institution than illiterate mothers in
all four states in both surveys. In NFHS-2 in Bihar, for example, only 7 percent of
illiterate mothers delivered in a medical institution, compared with 39 percent of mothers
with middle school complete or more education. In all four states, rural mothers who
are regularly exposed to electronic mass media are several times more likely to give
birth in a medical institution than mothers not so exposed. Mothers belonging to house-
holds with a low standard of living are much less likely to give birth in a medical
institution than mothers belonging to households with a medium or high standard of
living. For example, in NFHS-2 in Andhra Pradesh and Gujarat, mothers living in
households with a high standard of living are about three times as likely to deliver in a
medical institution as mothers living in households with a low standard of living. Cur-
rently working rural mothers are much less likely than nonworking rural mothers to
give birth in a medical institution. Surprisingly, woman’s autonomy, as measured
by decisionmaking about her own health care, shows little association with insti-
tutional delivery.
In all four states, rural mothers who received antenatal care are several times
more likely to deliver in a medical institution than mothers who did not receive such
care. Rural mothers who received at least one antenatal check-up are six to nine
times as likely to give birth in a medical institution as mothers who did not receive an
antenatal check-up in NFHS-1 and three to seven times as likely in NFHS-2. Simi-
larly, rural mothers who received two or more tetanus toxoid injections are three to
18
National Family Health Survey Subject Reports, No. 20
Table 5 Percentage of rural women giving birth in a medical institution during the three years precedingNFHS-1 and NFHS-2 by selected characteristics: Andhra Pradesh, Gujarat, Bihar, and Rajasthan
SUPPLY FACTORSAvailability of a hospital within 5 km
Yes 30 40 27 42 7 15 8 18No 20 41 24 30 8 10 7 14
Village has all-weather roadYes 29 43 30 38 10 15 11 18 No 17 37 13 24 6 11 5 14
Quality of health-care servicesLow NA 35 NA 33 NA 10 NA 12High NA 45 NA 33 NA 16 NA 20
Number of births 1,056 846 1,025 841 2,312 2,657 1,837 2,446
NA Not available*Not shown; <25 unweighted cases in the denominator( ) 25–49 unweighted cases in the denominator
19
National Family Health Survey Subject Reports, No. 20
four times as likely to give birth in a medical institution as mothers who received only
one or no tetanus injection in NFHS-1 and two to three times as likely in NFHS-2.
The availability and quality of health services are correlated with institutional
delivery, but the relationships are rather weak. In NFHS-2, rural mothers living in
villages within 5 km of a hospital facility are more likely to give birth in a medical
institution than mothers living farther away in Gujarat, Bihar, and Rajasthan but not in
Andhra Pradesh. In all states, mothers living in villages with an all-weather road are
more likely to deliver in a medical institution than mothers living in villages without an
all-weather road. Rural mothers living in villages with higher-quality health services
are more likely to deliver in medical institutions than mothers living in villages with
lower-quality health services in all states except Gujarat.
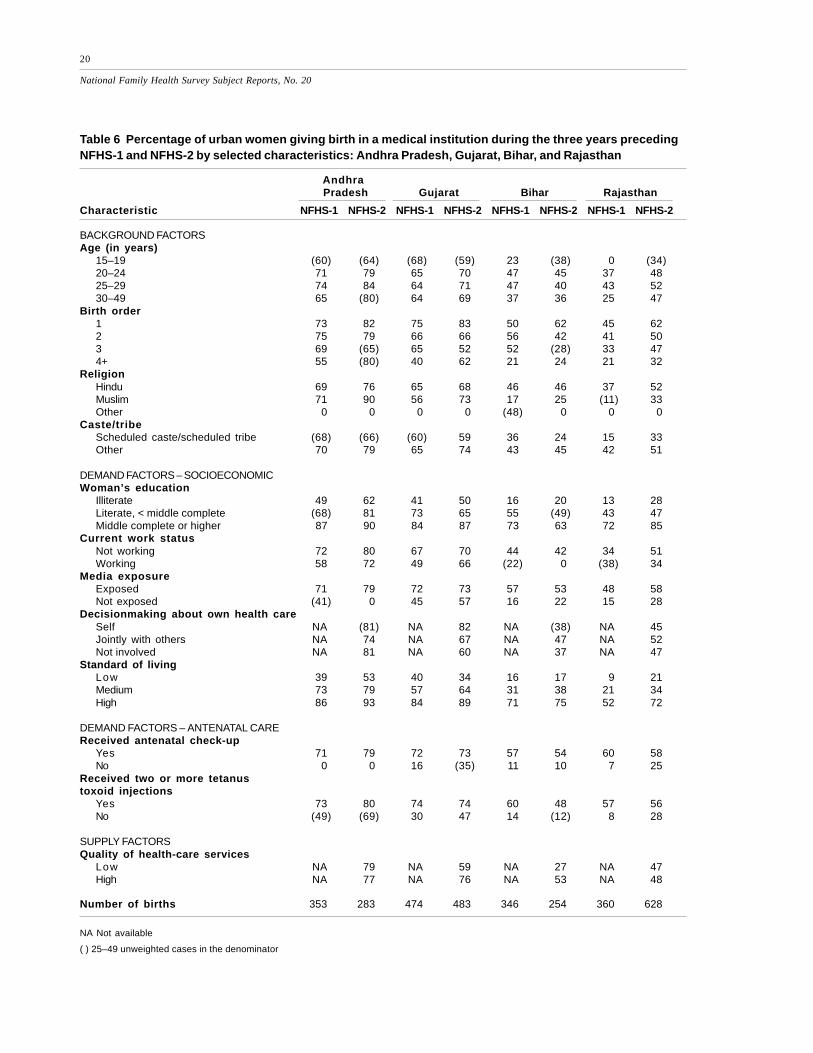
By way of comparison with Table 5, Table 6 presents correlates of institutional
delivery for urban mothers of births in the three years preceding each survey. Among
urban mothers, older mothers and mothers of higher-order births are less likely to give
birth in a medical institution. Muslim mothers are more likely than Hindu mothers to
give birth in a medical institution in Andhra Pradesh and Gujarat, but Muslim mothers
are much less likely than Hindu mothers to do so in Bihar and Rajasthan. Scheduled-
caste and scheduled-tribe mothers in urban areas in all four states are much less
likely than other mothers to deliver in a medical institution. More-educated mothers,
mothers regularly exposed to electronic mass media, and mothers living in households
with a high standard of living are much more likely to give birth in a medical institution
than other mothers. Working urban mothers are less likely to deliver in a medical
institution than nonworking mothers in all four states. As in the case of rural mothers,
decisionmaking about one’s own health care is weakly associated with institutional
delivery. In Andhra Pradesh and Gujarat, urban mothers who are not involved in
decisionmaking about their own health care are less likely to deliver in medical insti-
tutions than mothers who are involved, but in Bihar and Rajasthan involvement in this
decisionmaking has no effect on institutional delivery.
As in the case of rural mothers, antenatal care is strongly associated with insti-
tutional delivery for urban mothers. In all four states and in both surveys, urban moth-
ers who received an antenatal check-up are several times more likely to deliver in a
medical institution than those who did not. Mothers who received two or more tetanus
toxoid injections are also more likely to deliver in a medical institution than mothers
who received one or no injection. The quality of health-care services, as perceived by
respondents, is positively associated with institutional delivery in Gujarat and Bihar
but not in Andhra Pradesh and Rajasthan.
20
National Family Health Survey Subject Reports, No. 20
Table 6 Percentage of urban women giving birth in a medical institution during the three years precedingNFHS-1 and NFHS-2 by selected characteristics: Andhra Pradesh, Gujarat, Bihar, and Rajasthan