129


PromotingOral HealthThe Use of Salt Fluoridation to Prevent Dental Caries
Saskia Estupiñán-Day
NDIN
A LUTS
O
R
OPS
AHO
NDIN
P
E
O V I M U
P
66274_001_014 8/24/05 9:19 AM Page i
Also published in Spanish (2005),as part of the Paltex series, with the title
Promoción de la Salud Bucodental:La fluoruración de la sal para prevenir la caries dental
PAHO HQ Library Cataloguing-in-Publication
Pan American Health OrganizationPromoting oral health: the use of salt fluoridation to prevent dental caries.
Washington, D.C: PAHO, © 2005.(Scientific and Technical Publication No. 615)
ISBN 92 75 11615 6
I. Title II. Series
1. FLUORIDATION2. DENTAL CARIES — prevention & control3. ORAL HEALTH4. CARIOSTATIC AGENTS5. HEALTH PLANS AND PROGRAMMES
NLM WU 270
The Pan American Health Organization welcomes requests for permission to reproduce ortranslate its publications, in part or in full. Applications and inquiries should be addressed tothe Publications Area, Pan American Health Organization, Washington, DC, USA, which willbe glad to provide the latest information on any changes made to the text, plans for new edi-tions, and reprints and translations already available.
© Pan American Health Organization, 2005
Publications of the Pan American Health Organization enjoy copyright protection in ac-cordance with the provisions of Protocol 2 of the Universal Copyright Convention. All rightsare reserved.
The designations employed and the presentation of the material in this publication do notimply the expression of any opinion whatsoever on the part of the Secretariat of the Pan Amer-ican Health Organization concerning the status of any country, territory, city or area or of itsauthorities, or concerning the delimitation of its frontiers or boundaries.
The mention of specific companies or of certain manufacturers’ products does not implythat they are endorsed or recommended by the Pan American Health Organization in prefer-ence to others of a similar nature that are not mentioned. Errors and omissions excepted, thenames of proprietary products are distinguished by initial capital letters.
66274_001_014 8/24/05 9:19 AM Page ii

TABLE OF CONTENTS
Preface. . . . . . . . . . . . . . . . . . . . . . . . . . . . . . . . . . . . . . . . . . . . . . . . . . . . . . . . . . . 000Foreword . . . . . . . . . . . . . . . . . . . . . . . . . . . . . . . . . . . . . . . . . . . . . . . . . . . . . . . . . 000Introduction. . . . . . . . . . . . . . . . . . . . . . . . . . . . . . . . . . . . . . . . . . . . . . . . . . . . . . . 000Acknowledgments . . . . . . . . . . . . . . . . . . . . . . . . . . . . . . . . . . . . . . . . . . . . . . . . . . 000
History and Success Stories
1. Overview. . . . . . . . . . . . . . . . . . . . . . . . . . . . . . . . . . . . . . . . . . . . . . . . . . . . . . 3References . . . . . . . . . . . . . . . . . . . . . . . . . . . . . . . . . . . . . . . . . . . . . . . . . . . 5
2. Early Experiments, 1955–1980 . . . . . . . . . . . . . . . . . . . . . . . . . . . . . . . . . . . . 6Switzerland . . . . . . . . . . . . . . . . . . . . . . . . . . . . . . . . . . . . . . . . . . . . . . . . . . 6Hungary . . . . . . . . . . . . . . . . . . . . . . . . . . . . . . . . . . . . . . . . . . . . . . . . . . . . 7Colombia . . . . . . . . . . . . . . . . . . . . . . . . . . . . . . . . . . . . . . . . . . . . . . . . . . . 9Evidence Summary . . . . . . . . . . . . . . . . . . . . . . . . . . . . . . . . . . . . . . . . . . . . 10References . . . . . . . . . . . . . . . . . . . . . . . . . . . . . . . . . . . . . . . . . . . . . . . . . . . 10
3. Progress and Success, 1980–2000. . . . . . . . . . . . . . . . . . . . . . . . . . . . . . . . . . . 12Reduction of Caries . . . . . . . . . . . . . . . . . . . . . . . . . . . . . . . . . . . . . . . . . . . . 12Differences among Population, Racial, and Ethnic Groups . . . . . . . . . . . . . . 17Multiyear Plan to Prevent Caries in the Americas . . . . . . . . . . . . . . . . . . . . . 17
Costa Rica . . . . . . . . . . . . . . . . . . . . . . . . . . . . . . . . . . . . . . . . . . . . . . 19Jamaica . . . . . . . . . . . . . . . . . . . . . . . . . . . . . . . . . . . . . . . . . . . . . . . . 22Mexico . . . . . . . . . . . . . . . . . . . . . . . . . . . . . . . . . . . . . . . . . . . . . . . . . 23Effectiveness of Programs in Costa Rica, Jamaica, and Mexico. . . . . . . 24
Enamel Fluorosis . . . . . . . . . . . . . . . . . . . . . . . . . . . . . . . . . . . . . . . . . . . . . 27References . . . . . . . . . . . . . . . . . . . . . . . . . . . . . . . . . . . . . . . . . . . . . . . . . . . 28
Planning, Launching, and Running Salt Fluoridation Projects
4. Educating Communities about Salt Fluoridation . . . . . . . . . . . . . . . . . . . . . . . 35Why Educate about Salt Fluoridation? . . . . . . . . . . . . . . . . . . . . . . . . . . . . . 36Who Needs to be Educated about Salt Fluoridation? . . . . . . . . . . . . . . . . . . 36Principles and Methods for Educating about Salt Fluoridation . . . . . . . . . . . 36
Principles Applicable to Salt Fluoridation Education Include . . . . . . . . 36
iii
TABLE OF CONTENTS
Preface. . . . . . . . . . . . . . . . . . . . . . . . . . . . . . . . . . . . . . . . . . . . . . . . . . . . . . . . . . . viiForeword . . . . . . . . . . . . . . . . . . . . . . . . . . . . . . . . . . . . . . . . . . . . . . . . . . . . . . . . . ixIntroduction. . . . . . . . . . . . . . . . . . . . . . . . . . . . . . . . . . . . . . . . . . . . . . . . . . . . . . . xiAcknowledgments . . . . . . . . . . . . . . . . . . . . . . . . . . . . . . . . . . . . . . . . . . . . . . . . . . xiii
History and Success Stories
1. Overview. . . . . . . . . . . . . . . . . . . . . . . . . . . . . . . . . . . . . . . . . . . . . . . . . . . . . . 3References . . . . . . . . . . . . . . . . . . . . . . . . . . . . . . . . . . . . . . . . . . . . . . . . . . . 5
2. Early Experiments, 1955–1980 . . . . . . . . . . . . . . . . . . . . . . . . . . . . . . . . . . . . 6Switzerland . . . . . . . . . . . . . . . . . . . . . . . . . . . . . . . . . . . . . . . . . . . . . . . . . . 6Hungary . . . . . . . . . . . . . . . . . . . . . . . . . . . . . . . . . . . . . . . . . . . . . . . . . . . . 7Colombia . . . . . . . . . . . . . . . . . . . . . . . . . . . . . . . . . . . . . . . . . . . . . . . . . . . 9Evidence Summary . . . . . . . . . . . . . . . . . . . . . . . . . . . . . . . . . . . . . . . . . . . . 10References . . . . . . . . . . . . . . . . . . . . . . . . . . . . . . . . . . . . . . . . . . . . . . . . . . . 10
3. Progress and Success, 1980–2000. . . . . . . . . . . . . . . . . . . . . . . . . . . . . . . . . . . 12Reduction of Caries . . . . . . . . . . . . . . . . . . . . . . . . . . . . . . . . . . . . . . . . . . . . 12
Differences among Population, Racial, and Ethnic Groups . . . . . . . . . . 17Multiyear Plan to Prevent Caries in the Americas . . . . . . . . . . . . . . . . . . . . . 17
Costa Rica . . . . . . . . . . . . . . . . . . . . . . . . . . . . . . . . . . . . . . . . . . . . . . 19Jamaica . . . . . . . . . . . . . . . . . . . . . . . . . . . . . . . . . . . . . . . . . . . . . . . . 22Mexico . . . . . . . . . . . . . . . . . . . . . . . . . . . . . . . . . . . . . . . . . . . . . . . . . 23Effectiveness of Programs in Costa Rica, Jamaica, and Mexico. . . . . . . 24
Enamel Fluorosis . . . . . . . . . . . . . . . . . . . . . . . . . . . . . . . . . . . . . . . . . . . . . 27References . . . . . . . . . . . . . . . . . . . . . . . . . . . . . . . . . . . . . . . . . . . . . . . . . . . 28
Planning, Launching, and Running Salt Fluoridation Projects
4. Educating Communities about Salt Fluoridation . . . . . . . . . . . . . . . . . . . . . . . 35Why Educate about Salt Fluoridation? . . . . . . . . . . . . . . . . . . . . . . . . . . . . . 36Who Needs to be Educated about Salt Fluoridation? . . . . . . . . . . . . . . . . . . 36Principles and Methods for Educating about Salt Fluoridation . . . . . . . . . . . 36
Principles Applicable to Salt Fluoridation Education Include . . . . . . . . 36
iii
66274_001_014 8/24/05 9:19 AM Page iii

Using Plain Language . . . . . . . . . . . . . . . . . . . . . . . . . . . . . . . . . . . . . 37Methods Applicable to Educating about Salt Fluoridation . . . . . . . . . . 37
What to Teach about Fluorides . . . . . . . . . . . . . . . . . . . . . . . . . . . . . . . . . . . 37What to Teach about Salt Fluoridation . . . . . . . . . . . . . . . . . . . . . . . . . . . . . 37Who Should Provide Education about Salt Fluoridation . . . . . . . . . . . . . . . . 38
The Role of Health Professionals in Educating about the Need for and Benefits of Fluoridating Salt. . . . . . . . . . . . . . . . . . . . . . . . . 39
The Need for Continuous Education about Salt Fluoridation . . . . . . . . . . . . 39Planning and Strategy Development . . . . . . . . . . . . . . . . . . . . . . . . . . . . . . . 39Summary . . . . . . . . . . . . . . . . . . . . . . . . . . . . . . . . . . . . . . . . . . . . . . . . . . . 40References . . . . . . . . . . . . . . . . . . . . . . . . . . . . . . . . . . . . . . . . . . . . . . . . . . . 40
5. Salt Production and Technology Development for Salt Fluoridation . . . . . . . . . 41Introduction . . . . . . . . . . . . . . . . . . . . . . . . . . . . . . . . . . . . . . . . . . . . . . . . . 41Global and Regional Salt Production. . . . . . . . . . . . . . . . . . . . . . . . . . . . . . . 42
Salt Production Methods . . . . . . . . . . . . . . . . . . . . . . . . . . . . . . . . . . . 43Salt Processing . . . . . . . . . . . . . . . . . . . . . . . . . . . . . . . . . . . . . . . . . . . 44
Production of Fluoridated Salt . . . . . . . . . . . . . . . . . . . . . . . . . . . . . . . . . . . 48Fluoridation Chemicals. . . . . . . . . . . . . . . . . . . . . . . . . . . . . . . . . . . . . 48The Dry Method . . . . . . . . . . . . . . . . . . . . . . . . . . . . . . . . . . . . . . . . . . 49The Wet Method . . . . . . . . . . . . . . . . . . . . . . . . . . . . . . . . . . . . . . . . . . 49Choosing between the Wet and Dry Methods . . . . . . . . . . . . . . . . . . . . 50Quality Control Issues with Both Methods . . . . . . . . . . . . . . . . . . . . . . 51
Marketing of Salt . . . . . . . . . . . . . . . . . . . . . . . . . . . . . . . . . . . . . . . . . . . . . 51National Salt Flows and Balance . . . . . . . . . . . . . . . . . . . . . . . . . . . . . 51Box: Venezuela’s Successful Salt Industry . . . . . . . . . . . . . . . . . . . . . . . 52Internal Marketing of Salt . . . . . . . . . . . . . . . . . . . . . . . . . . . . . . . . . . 52Salt Prices . . . . . . . . . . . . . . . . . . . . . . . . . . . . . . . . . . . . . . . . . . . . . . 53Bibliography. . . . . . . . . . . . . . . . . . . . . . . . . . . . . . . . . . . . . . . . . . . . . 54
6. Strategic Planning for the Implementation of Salt Fluoridation Programs . . . . 55Phase I: Feasibility and Program Implementation . . . . . . . . . . . . . . . . . . . . . 56
Institutional Analysis and Cost-benefit Study of aSalt Fluoridation Program . . . . . . . . . . . . . . . . . . . . . . . . . . . . . . . . 56
Baseline Studies . . . . . . . . . . . . . . . . . . . . . . . . . . . . . . . . . . . . . . . . . . 59Surveillance Systems and Quality Control . . . . . . . . . . . . . . . . . . . . . . 62
Phase II: First Evaluation . . . . . . . . . . . . . . . . . . . . . . . . . . . . . . . . . . . . . . . 63Plant Equipment for the Production of Fluoridated Salt,
by Production Method . . . . . . . . . . . . . . . . . . . . . . . . . . . . . . . . . . . 63Training of Personnel for the Program . . . . . . . . . . . . . . . . . . . . . . . . . 63Development of Monitoring Infrastructure . . . . . . . . . . . . . . . . . . . . . . 64Mass Communication Strategy . . . . . . . . . . . . . . . . . . . . . . . . . . . . . . . 64Initiation of Epidemiological Surveillance. . . . . . . . . . . . . . . . . . . . . . . 64Biological Monitoring . . . . . . . . . . . . . . . . . . . . . . . . . . . . . . . . . . . . . . 64Chemical Monitoring . . . . . . . . . . . . . . . . . . . . . . . . . . . . . . . . . . . . . . 64Quality Control in the Production and Distribution of Fluoridated Salt . . 65Safety Aspects in the Production of Fluoridated Salt . . . . . . . . . . . . . . 65
PROMOTING ORAL HEALTH
iv
Using Plain Language . . . . . . . . . . . . . . . . . . . . . . . . . . . . . . . . . . . . . 37Methods Applicable to Educating about Salt Fluoridation . . . . . . . . . . 37
What to Teach about Fluorides . . . . . . . . . . . . . . . . . . . . . . . . . . . . . . . . . . . 37What to Teach about Salt Fluoridation . . . . . . . . . . . . . . . . . . . . . . . . . . . . . 37Who Should Provide Education about Salt Fluoridation . . . . . . . . . . . . . . . . 38
The Role of Health Professionals in Educating about the Need for and Benefits of Fluoridating Salt. . . . . . . . . . . . . . . . . . . . . . . . . 39
The Need for Continuous Education about Salt Fluoridation . . . . . . . . . . . . 39Planning and Strategy Development . . . . . . . . . . . . . . . . . . . . . . . . . . . . . . . 39Summary . . . . . . . . . . . . . . . . . . . . . . . . . . . . . . . . . . . . . . . . . . . . . . . . . . . 40References . . . . . . . . . . . . . . . . . . . . . . . . . . . . . . . . . . . . . . . . . . . . . . . . . . . 40
5. Salt Production and Technology Development for Salt Fluoridation . . . . . . . . . 41Introduction . . . . . . . . . . . . . . . . . . . . . . . . . . . . . . . . . . . . . . . . . . . . . . . . . 41Global and Regional Salt Production. . . . . . . . . . . . . . . . . . . . . . . . . . . . . . . 42
Salt Production Methods . . . . . . . . . . . . . . . . . . . . . . . . . . . . . . . . . . . 43Salt Processing . . . . . . . . . . . . . . . . . . . . . . . . . . . . . . . . . . . . . . . . . . . 44
Production of Fluoridated Salt . . . . . . . . . . . . . . . . . . . . . . . . . . . . . . . . . . . 48Fluoridation Chemicals. . . . . . . . . . . . . . . . . . . . . . . . . . . . . . . . . . . . . 48The Dry Method . . . . . . . . . . . . . . . . . . . . . . . . . . . . . . . . . . . . . . . . . . 49The Wet Method . . . . . . . . . . . . . . . . . . . . . . . . . . . . . . . . . . . . . . . . . . 49Choosing between the Wet and Dry Methods . . . . . . . . . . . . . . . . . . . . 50Quality Control Issues with Both Methods . . . . . . . . . . . . . . . . . . . . . . 51
Marketing of Salt . . . . . . . . . . . . . . . . . . . . . . . . . . . . . . . . . . . . . . . . . . . . . 51National Salt Flows and Balance . . . . . . . . . . . . . . . . . . . . . . . . . . . . . 51Box: Venezuela’s Successful Salt Industry . . . . . . . . . . . . . . . . . . . . . . . 52Internal Marketing of Salt . . . . . . . . . . . . . . . . . . . . . . . . . . . . . . . . . . 52Salt Prices . . . . . . . . . . . . . . . . . . . . . . . . . . . . . . . . . . . . . . . . . . . . . . 53Bibliography. . . . . . . . . . . . . . . . . . . . . . . . . . . . . . . . . . . . . . . . . . . . . 54
6. Strategic Planning for the Implementation of Salt Fluoridation Programs . . . . 55Phase I: Feasibility and Program Implementation . . . . . . . . . . . . . . . . . . . . . 56
Institutional Analysis and Cost-benefit Study of aSalt Fluoridation Program . . . . . . . . . . . . . . . . . . . . . . . . . . . . . . . . 56
Baseline Studies . . . . . . . . . . . . . . . . . . . . . . . . . . . . . . . . . . . . . . . . . . 59Surveillance Systems and Quality Control . . . . . . . . . . . . . . . . . . . . . . 62
Phase II: First Evaluation . . . . . . . . . . . . . . . . . . . . . . . . . . . . . . . . . . . . . . . 63Plant Equipment for the Production of Fluoridated Salt,
by Production Method . . . . . . . . . . . . . . . . . . . . . . . . . . . . . . . . . . . 63Training of Personnel for the Program . . . . . . . . . . . . . . . . . . . . . . . . . 63Development of Monitoring Infrastructure . . . . . . . . . . . . . . . . . . . . . . 64Mass Communication Strategy . . . . . . . . . . . . . . . . . . . . . . . . . . . . . . . 64Initiation of Epidemiological Surveillance. . . . . . . . . . . . . . . . . . . . . . . 64Quality Control in the Production and Distribution of Fluoridated Salt . . 65Safety Aspects in the Production of Fluoridated Salt . . . . . . . . . . . . . . 65
Phase III: Long-term Evaluation and Consolidation . . . . . . . . . . . . . . . . . . . 65Epidemiological Surveillance Elements. . . . . . . . . . . . . . . . . . . . . . . . . 65Quality Control in Production and Distribution . . . . . . . . . . . . . . . . . . 66
References . . . . . . . . . . . . . . . . . . . . . . . . . . . . . . . . . . . . . . . . . . . . . . . . . . . 66
PROMOTING ORAL HEALTH
iv
66274_001_014 8/24/05 9:19 AM Page iv

7. Epidemiological Surveillance . . . . . . . . . . . . . . . . . . . . . . . . . . . . . . . . . . . . . . 67General Considerations . . . . . . . . . . . . . . . . . . . . . . . . . . . . . . . . . . . . . . . . . 67
Epidemiological Surveillance Requirements . . . . . . . . . . . . . . . . . . . . . 67Epidemiological Surveillance Measurements . . . . . . . . . . . . . . . . . . . . . 67Organization of Epidemiological Surveillance. . . . . . . . . . . . . . . . . . . . 68Planning and Monitoring . . . . . . . . . . . . . . . . . . . . . . . . . . . . . . . . . . . 68
Biological Monitoring . . . . . . . . . . . . . . . . . . . . . . . . . . . . . . . . . . . . . . . . . . 69Oral Health Surveys for Determining DMFT and Dental
Fluorosis in Children 6–8, 12, and 15 Years Old . . . . . . . . . . . . . . . 69Determining Fluoride Excretion in Urine in Children 3–5 Years Old . . 71Monitoring the Nutritional Status of Preschool Children. . . . . . . . . . . . 73
Chemical Monitoring. . . . . . . . . . . . . . . . . . . . . . . . . . . . . . . . . . . . . . . . . . . 75Determining Fluoride in Drinking Water—
Wells and Water Supply Networks . . . . . . . . . . . . . . . . . . . . . . . . . . 75Determining Fluoride in Water Supplies . . . . . . . . . . . . . . . . . . . . . . . 77
Monitoring Fluoride Concentration in Salt in the Distribution Network . . . . 77Quality Control in the Salt Plant’s Production Process . . . . . . . . . . . . . 78
78Quality Control of the Plant’s Distribution . . . . . . . . . . . . . . . . . . . . . . 78Quality Control of Distribution by Health Authorities . . . . . . . . . . . . . 78
Monitoring Fluoridated Salt in Plants, Warehouses, and Points of Sale . . . . . 79Sampling in the Plant by Health Workers. . . . . . . . . . . . . . . . . . . . . . . 79Sampling at Points of Sale and Warehouses by Health Workers . . . . . . 79Fluoride Determination in Salt . . . . . . . . . . . . . . . . . . . . . . . . . . . . . . . 80
Monitoring the Marketing and Use of Fluoridated Supplements(drops and tablets) . . . . . . . . . . . . . . . . . . . . . . . . . . . . . . . . . . . . . . . . . . 80
Monitoring the Use of Fluoridated Toothpaste in Preschool Children . . . . . . 81References . . . . . . . . . . . . . . . . . . . . . . . . . . . . . . . . . . . . . . . . . . . . . . . . . . . 81
Tool-kit for Decision-makers, Health Planners, Legislators,Epidemiologists, and Health Workers
8. PAHO’s Recommendations for Setting up and Orchestrating a SuccessfulSalt Fluoridation Program . . . . . . . . . . . . . . . . . . . . . . . . . . . . . . . . . . . . . . . . 85
Reference . . . . . . . . . . . . . . . . . . . . . . . . . . . . . . . . . . . . . . . . . . . . . . . . . . . 87
9. A Legal Framework for Mandatory Iodization and Fluoridation of Salt . . . . . . 88
10. Standardized Research Protocols. . . . . . . . . . . . . . . . . . . . . . . . . . . . . . . . . . . . 931. Examination Procedures and Coding for Visual-tactile
Oral Health Surveys . . . . . . . . . . . . . . . . . . . . . . . . . . . . . . . . . . . . . . . 932. Determining Fluoride Concentration in Drinking Water . . . . . . . . . . . . . . 1063. Determining Urinary Fluoride Excretion in Children: Time-control
Urine Sampling . . . . . . . . . . . . . . . . . . . . . . . . . . . . . . . . . . . . . . . . . . 106
CONTENTS
v
Quality Control in the Production Process by Health Authorities . . . . .
66274_001_014 8/24/05 9:19 AM Page v

66274_001_014 8/24/05 9:19 AM Page vi

PREFACE
An understanding of the overall development of nations shows that the solution to manyof the problems that affect a population’s health and, to a large extent, individuals’ healthcannot rely solely on expanding health care systems. All sectors, interested parties, and dis-ciplines must apply innovative strategies to the solution if people’s health—our first andforemost concern—is to be improved in the near term.
The Pan American Health Organization’s Regional Oral Health Program has focusedon planning and designing oral health strategies and has collaborated with the countriesof the Americas to change epidemiological patterns and improve delivery systems for oralhealth care.
To support those who make or implement national or local oral health policies, wepresent Promoting Oral Health: The Use of Salt Fluoridation to Prevent Dental Caries.This book bears witness to the effectiveness of salt fluoridation for the mass reduction ofdental caries in the population. Over time, salt fluoridation has come to be recognized asthe most promising—and the most egalitarian—strategy for improving the oral health ofmillions in the Americas and as the key factor in changing the epidemiological profile oforal health for the Region in a relatively short period of time.
To date, 11 countries in our Region have fluoridated salt programs, and new countriescontinually strive to launch such programs. We offer this book to all those who are oper-ating salt fluoridation programs or who are considering launching salt fluoridation pro-grams, to those who implement national or local oral health policies, and to the tirelesshealth workers who strive to improve the health of our people.
Mirta Roses PeriagoDirector
Pan American Health Organization
vii
66274_001_014 8/24/05 9:19 AM Page vii

66274_001_014 8/24/05 9:19 AM Page viii

FOREWORD
For more than 60 years, the Kellogg Foundation has been a proud supporter of the PanAmerican Health Organization (PAHO). In collaboration with PAHO, the Foundation hasdone some of its most lasting and important work in Latin America and the Caribbean.And one of the proudest success stories from this fruitful partnership has been the salt flu-oridation project. Because of this effort, millions of people across the region can enjoyhealthier, happier, and more productive lives.
Our founder, W.K. Kellogg, was a pragmatic visionary who believed in “applyingknowledge to the problems of people.” The salt fluoridation program embodies this prin-ciple by combining scientific knowledge with political coordination and grassroots educa-tion. Additionally, the project was able to build on the impressive gains in water fluorida-tion, which resulted from an earlier Kellogg Foundation/PAHO partnership. Yet the saltfluoridation effort was distinct in its ability to deliver oral health benefits to remote loca-tions where no municipal water supplies existed. As is true with most good ideas, the tech-niques pioneered by this project can be readily adapted by other nations and communitiesthat seek to establish similar oral health programs.
Without question, there is much that can be learned from the history of this remarkableinitiative. As we consider the current challenges in public and oral health that face LatinAmerica and the world, we encourage the professionals and lay people who read Promot-ing Oral Health: The Use of Salt Fluoridation to Prevent Dental Caries to apply its lessonsin as many ways and places as possible.
William C. Richardson, Ph.D.President and Chief Executive Officer
W.K. Kellogg Foundation
ix
66274_001_014 8/24/05 9:19 AM Page ix

66274_001_014 8/24/05 9:19 AM Page x

xi
INTRODUCTION
In many countries of the Americas, the high prevalence of dental caries in the popula-tion (more than 90% of schoolchildren may be affected) reflects the absence of an oralhealth strategy targeting the disease. And yet, the scope of this public health problem runscounter to advances many of these countries already have attained in other social indica-tors and in other aspects of public health.
In 1994, the Pan American Health Organization (PAHO) drafted an initial strategy toimplement caries prevention programs in the Region of the Americas that relied on bothwater and salt fluoridation. The intention was to help create new prevention programs andstrengthen existing fluoridation programs. PAHO’s Regional Oral Health Program con-ducted a situation assessment of the countries of the Americas based on the most recentreports on caries prevalence and severity and on the existence of prevention programs. Al-though water fluoridation had been highly effective, the lack of adequate water distribu-tion systems in the Region, especially in rural areas, made it difficult to implement na-tionwide water fluoridation programs.
In 1994, the program began to develop a strategy by evaluating experiences of coun-tries that had launched salt fluoridation programs from the mid-1980s to the early 1990s.At that time, Costa Rica, Jamaica, and Mexico had had projects in place for more than fiveyears. In Jamaica, the salt industry had made most of the initial investment, whereas inCosta Rica and Mexico, projects had been partially financed by the W. K. Kellogg Foun-dation; PAHO provided technical support to all three projects. By 1999, other countrieshad begun their salt fluoridation projects: Peru received financial support from the Kel-logg Foundation to launch its national program in 1989; Venezuela and Colombia reportedhaving salt fluoridation programs, but the extent of their coverage could not be determined(it is known that Venezuela’s program used lower concentrations of salt than did those inother countries); Ecuador and Bolivia initiated national programs with World Bank assis-tance; in Uruguay, the salt industry, too, made most of the initial investment. Among saltfluoridation projects that were terminated or did not report results were a pilot programlaunched at the end of the 1980s by the State University of Rio de Janeiro in five munic-ipalities in the state’s northwest.
On the basis of its assessment, the Regional Oral Health Program prepared a plan thatset priorities for technical cooperation needs. Initially, the plan identified six countries inwhich caries were widespread and/or severe, or where salt fluoridation programs wereunder way and would require limited additional effort. One of PAHO’s objectives was thatprograms be multisectoral and that they include the public sector (health authorities), theprivate sector (the salt industry), and the financial sector (lending institutions). Also in-
66274_001_014 8/24/05 9:19 AM Page xi

volved were the academic sector, dental associations, and other international organiza-tions. A select group of epidemiologists, health workers, administrators, and salt produc-tion engineers have provided comprehensive technical support since the program began in1993.
PAHO submitted a request for financial support to the W.K. Kellogg Foundation, whichapproved a subsidy in 1996 for implementing salt fluoridation programs in Bolivia, theDominican Republic, Honduras, Nicaragua, Panama, and Venezuela. A year later, Kelloggapproved a second subsidy to support programs in Belize and Paraguay. Meanwhile, PAHOcontinued to provide technical cooperation through its caries prevention projects in El Sal-vador, Guatemala, and Uruguay and in several Caribbean islands, including Puerto Rico.To date, Mexico and all the Central American and South American countries (except Ar-gentina, Brazil, Chile, and French Guyana) have already begun, are maintaining, or areabout to launch salt fluoridation programs.
Today, the Pan American Health Organization works to help countries advance from aless-than-optimal state of oral health and inadequate or nonexistent oral health policies,to a stage in which oral health improves and sound public health policies prevail. The pro-motion of fluoridated water or fluoridated salt as a mass prevention measure is a key ele-ment of this effort. Currently, salt fluoridation programs offer the best alternative, becausethey provide greater coverage at lower cost.
This publication has come out of the experience of national salt fluoridation programsand of 12 workshops corresponding to Phase II (first evaluation) of such programs thatwere held in Mexico in 1994 and in Jamaica in 1996. The book gives a historical overviewof successful salt fluoridation programs; details the components, effectiveness, and bene-fits of the programs; and offers recommendations to health administrators who are con-sidering establishing such a program in their countries.
We hope that it helps to confirm salt fluoridation as an effective method of preventingdental caries and encourages its application through the world. As programs continue tobe developed in the Region, PAHO will share information and knowledge with the publichealth community as a way to improve the dental health of the Region’s population.
Dr. Saskia Estupiñan-DayRegional Advisor for Oral Health
Pan American Health Organization
PROMOTING ORAL HEALTH
xii
66274_001_014 8/24/05 9:19 AM Page xii

xiii
ACKNOWLEDGMENTS
Over the past 12 years, the Pan American Health Organization (PAHO), with strongand ongoing support from the W.K. Kellogg Foundation, developed the foundation forlaunching and running salt fluoridation programs in the Region of the Americas. Duringthese years, PAHO came up with strategies to improve the monitoring of national saltfluoridation programs, and fostered the development of knowledge in this regard and itstransfer through technical cooperation. A significant part of this work was made possibleby the support of the W.K. Kellogg Foundation. PAHO’s and the Foundation’s joint lead-ership and initiatives have been decisive in the success of salt fluoridation in the Americas.The development of modern dentistry and its progress in Latin America and the Caribbeanis directly tied to the W. K. Kellogg’s efforts—it is the single major philanthropic institu-tion that has continually supported the advancement of oral health in the Region.
Dr. Herschel S. Horowitz’ contribution deserves special mention, and he has played avital and special role in preparing this book. His knowledge about caries prevention andfluorides, his vast understanding of dental public health, and his dedication to the fieldhave brought better oral health to millions of Latin Americans and Caribbeans. Dr.Horowitz’ pioneered the implementation of fluoridation programs and he remains as oneof the most outstanding dental public health scientists of the 20th century.
Special thanks also go to all those who contributed in some way to create this publica-tion. We are especially grateful to the ministries of health, dental programs, and the saltindustry in the countries of the Americas, as well as to Eugenio Beltrán, Lawrence M. Day,Alice Horowitz, Thomas Marthaler, and Trevor Milner, special contributors to this book.
66274_001_014 8/24/05 9:19 AM Page xiii

Salt is born of the purest of parents: the sun and the sea.
Pythagoras, 580BC–500 BC
66274_001_014 8/24/05 9:19 AM Page xiv

HISTORY AND
SUCCESS STORIES


The history of salt fluoridation spans more thanhalf a century, encompassing efforts in Europeand the Americas (see Table 1.1). The realiza-
tion of how valuable salt fluoridation was in pre-venting dental caries resulted from a series of eventsdating from the middle of the 20th century. In the1940s, Swiss physician H.J. Wespi prescribed iodizedsalt, which he prepared for his pregnant patients, toprevent endemic goiter and iodine deficiencies inchildren (1). Having learned of studies by H.T. Dean(2–11) on fluoride and caries, Wespi envisioned pre-venting caries on a mass scale by using fluoridatedsalt. Taking into account the similarities of fluoride(F) and iodine (I) as halogens, he arranged throughthe United Swiss Rhine Salt Works to begin adding200 mg of sodium fluoride (NaF), which is equiva-lent to 90 mg of fluoride, per 1 kg of salt producedby the company, assuming an average salt intake of10–12 g per day. In 1955, on the recommendationsof Wespi and others, the United Swiss Rhine SaltWorks began producing salt containing 10 mg ofpotassium iodide (KI) and 90 mg of fluoride (F) per1 kg of salt, for consumption in Canton Zurich. In1968, enriched salt was consumed in 23 of 25 Swisscantons (12); currently, fluoridated salt is consumedin all 26 cantons (in 1974, a new canton, CantonJura was incorporated, bringing the total to 26).Canton Basel City had introduced water fluorida-tion in 1962. In 2004, the Council resolved to switchfrom fluoridation of water to fluoridation of salt forvarious reasons, one being that the logistics of keep-ing fluoridated salt out of fluoridated water in Baselwas becoming increasingly difficult, finally becom-ing legally impossible (13). Accordingly, fluoridatedsalt, available in packages up to 1 kg, is now sold allover Switzerland, and its market share among all do-mestic salt has been 85% since 2000.
A second important event occurred in June 1965,when distribution of fluoridated salt began in twoColombian communities in the Andes, as part of atrial to determine the effect of salt fluoridation inpreventing dental caries, as compared with water flu-oridation’s. Sponsored by several international or-ganizations, the United States Public Health Service,and the University of Antioquia in Colombia, thisproject benefited from an excellent analytical designand represents the best proof to date of salt fluorida-tion’s effectiveness. Salt fluoridation (200 mg of flu-oride per kg of salt) produced benefits similar tothose of water fluoridation. Reductions in dentalcaries ranged from 60%–65%; such results were notobserved in a control community that had neitherwater nor salt fluoridation.
Between 1966 and 1976, Karoly Toth conducteda trial in three Hungarian communities that con-sumed salt with three different fluoride concentra-tions—200, 250, and 350 mg of F per 1 kg of salt.Three other communities served as controls. In thecommunities using fluoridated salt, dental cariesdropped 33% in children 2–6 years of age (primarydentition) and 66% in children 12–14 years of age(permanent dentition).
Salt fluoridation was introduced in Finland in1952, with levels of fluoride in table salt of 90 mg perkg. Consumption of fluoridated salt increased in the1970s, but with limited distribution. Since 1978, nofluoridated salt has been available in Finland (14).
In 1971 and 1985, Viñes reported the results oftwo studies that began in 1966 and 1968 in Pam-plona, Spain (6, 7). The study in 1966 was restrictedto a group of children 6–13 years old living in an or-phanage, who received salt with a concentration of250 mg of F per 1 kg. Given the controlled environ-ment of the orphanage, daily consumption was en-
1. OVERVIEW
3

PROMOTING ORAL HEALTH
4
TABLE 1.1 Major events in the history of salt fluoridation.Year Country Event
1955
1964
1965
1966, 1968, and1972
1966, 1968
1970 and 1974
1972
1977
1982
1986
1987
1990–1991
1991
1996
1997
1998
2004
Switzerland
Switzerland
Colombia
Hungary
Spain (Pamplona, Navarraand Potasas, Navarra)
Switzerland
Colombia
Colombia
Austria
Guatemala
Costa Rica and Jamaica
Peru and Uruguay
Mexico
PAHO
PAHO Headquarters(Washington D.C.)
Ecuador
Cuba
Salt fluoridation, at 90 mg of F per 1 kg (from NaF), begun by theUnited Swiss Rhine Salt Works.
Production reached 598 million tons of fluoridated salt, consumed in20 of the total 25 cantons then in existence.
Salt fluoridation began at 200 mg of F per kg (from NaF and CaF2), aspart of a trial in four. Andean communities.
Three community trials were begun with salt at 200, 250, and, 350 mgof F per 1 kg of salt.
Two studies of effectiveness were conducted in children 6–13 years oldwho consumed 250 or 225 mg of F per 1 kg of salt. Results after threeyears showed an approximately 50% reduction in the average numberof DMFT.
Salt fluoridation at 250 mg F per 1 kg salt was initiated in the Cantonof Vaud (1970, population 500,000) and in the Canton of Glarus (1974,population 40,000). In these two cantons, fluoridated salt has beenused in households as well as institutional kitchens (restaurants,canteens, hospitals) and in bakeries.
Colombia’s study of salt fluoridation ends. Data reported in 1976indicates a 60%–65% reduction in caries, 65% in the communities thatconsumed fluoridated salt (caries reduction percentages werecomparable to those obtained in the community that consumedfluoridated water).
First international symposium on salt fluoridation.
International conference on fluorides.
Meeting of experts on fluoridation and iodization of salt for humanconsumption.
Programs for fluoridation of salt at 250 mg F per 1 kg were launched.
Programs for salt fluoridation at 250 mg F per 1 kg were launched.
Meeting of experts on Salt Fluoridation in Mexico City.
Programs for salt fluoridation were launched in Bolivia, the DominicanRepublic, Honduras, Nicaragua, Panama, and Venezuela in the firststage of the project financed by the Kellogg Foundation. A year laterBelize and Paraguay were included.
Task force meets to review and issue recommendations for fluorideconcentration in salt.
First international symposium on surveillance and quality control ofsalt fluoridation.
Regional meeting of dental chief officers to update effectiveness ofsalt fluoridation.
sured at between 1.2 and 1.6 mg of F. In 1968, dis-tribution started in the town of Potasas, Navarra,and entailed the use of salt fluoridated to 225 mg ofF per 1 kg; daily consumption ranged between 0.8and 1.2 mg of F. A comparison of decayed, missing,and filled teeth (DMFT) in children 6–13 years of age
in both communities—before and three years afterintroducing fluoridated salt—showed reductions ofaround 50%. Viñes’ study in Potasas, Navarra, had acontrol; the one in Pamplona did not (16).
By the beginning of the 1980s, scientific evidenceclearly favored fluoridation of salt to prevent dental

OVERVIEW
5
caries. At that time, a number of countries in the Re-gion of the Americas launched their own nationalsalt fluoridation programs.
The following two chapters trace the history ofsalt fluoridation and its later success stories.
References
1. Wespi HJ. Experiences and problems of fluoridatedcooking salt in Switzerland. Arch Oral Biol 1961;6[Suppl.]:33–39.
2. Dean HT. The investigation of physiological effects ofthe epidemiological method. In Moulton FR (ed.). Flu-oride and Dental Health. Washington, DC: AmericanAssociation for the Advancement of Science; 1942.
3. Dean HT. Epidemiologic studies in the United States.In Moulton FR (ed.). Fluoride and Dental Health.Washington, DC: American Association for the Ad-vancement of Science; 1942.
4. Dean HT. Endemic fluorosis and its relation to dentalcaries. Public Health Rep 1938;53:1443–1452.
5. Dean HT. Chronic endemic dental fluorosis. JAMA1936;107:1269–1273.
6. Dean HT. Classification of mottled enamel diagnosis.J Am Dent Assoc 1934; 21:1421–1426.
7. Dean HT, Jay P, Arnold FA Jr, Elvove E. Domesticwater and dental caries. II. A study of 2,832 whitechildren aged 12 to 14 years, of 8 suburban Chicagocommunities including Lactobacillus acidophilus
studies of 1,761 children. Public Health Rep 1941;56:761–792.
8. Dean HT, Arnold FA Jr., Elvove E. Domestic water anddental caries. V. Additional studies of the relation offluoride domestic waters to dental caries experience in4,425 white children, aged 12 to 14 years, of 13 citiesin 4 states. Public Health Rep 1942;57:1155–1179.
9. Dean HT, McKay FS, Elvove E. Mottled enamel sur-vey of Bauxite, Ark., 10 years after a change in thecommon water supply. Public Health Rep 1938;53:1736–1748.
10. Dean HT, Elvove E. Some epidemiologic aspects ofchronic endemic dental fluorosis. Am J Public Health1936; 26:567–575.
11. Dean HT, Elvove E. Studies on the minimal thresholdof chronic endemic dental fluorosis. Public HealthRep 1935;50:1719–1729.
12. Wespi HJ. Wie kann die Fluor-Vollsalz-prophylaxe derKaries verbessert Werden? Praxis. Schweiz Rundschaufur Medizin 1962;51:995–1000.
13. Marthaler T, Meyer J. Drinking water fluoridation inBasle 1962–2003. Community Dent Health 2004;21:1–3.
14. Tala H. Some aspects of salt fluoridation in Finland. SaltFluoridation. Washington, DC: Pan American HealthOrganization; 1986. (Scientific Publication 501).
15. Viñes JJ. Flúor profilaxis de la caries dental a través dela sal fluorada. Rev Clin Española 1971;4:319–334.
16. Viñes JJ. Caries-preventive salt fluoridation. Br Dent J1985;158(2):45–49.

SWITZERLAND
Salt fluoridation began in Switzerland in 1955, on therecommendation of several health care providers andauthorities, with distribution of salt containing 90 mgof fluoride (F) and 10 mg of potassium iodide (KI)per 1 kg of salt. At that time, toxic levels of fluoridewere unknown, and it was believed that a personshould not ingest more than 2 mg a day (1). TheUnited Swiss Rhine Salt Works (Vereinigte Schweiz-erische Rheinsalinen [VSR]) fluoridated the salt, ini-tially using a solution containing sodium fluoride(NaF), but later replacing it with the more solublepotassium fluoride (KF). In the VSR experiments,80%–90% of fluoride added to the salt remainedpresent after almost four years, yet moisture increasedby only 0.03% (1). This demonstrated that the fluo-ride in the salt did not deteriorate and the salt retainedits physical characteristics during storage. First dis-tributed in the city of Zurich and then in Zurich Can-ton, fluoridated salt was available by 1960 in 20 ofthe 25 Swiss cantons in existence at that time; by1964, almost 600 metric tons were being produced.
Even though salt could be fluoridated withoutcompromising the quality of the product, salt fluori-dation’s effectiveness in preventing caries remainedto be proven. Such proof was difficult to come by,however, since each canton determined what methodof caries prevention it would use. For example, sinceabout 1975, most cantons gradually introduced su-pervised toothbrushing with a concentrated fluoridepreparation of 1.25% F. Fluoride tablets were dis-tributed in schools in a few cantons, but such mea-sures were locally driven, and often were not fol-lowed up with sufficient consistency and the effort
died out in the 1970s. By the beginning of the 1980s,they were totally abandoned (2). Topical fluorideprograms continued after the nationwide sale of saltfluoridated with 250 ppm F had begun in 1983.
Two retrospective studies conducted between1960 and 1962 in Zurich and Wadenswil (3, 4) tomeasure the preventive effect of salt fluoridation (at90 mg F/per 1 kg salt), showed lower average num-bers of decayed, missing, and filled surfaces (DMFS)in children who consumed fluoridated salt than inthose lacking fluoridated salt in their diets or whohad consumed it sporadically. Among children 8–9years of age, DMFS reductions of 25%–32% wererecorded, while among 12–14-year-olds, evidence ofsuch change was negligible. Overall, fluoridatedsalt’s benefit was less than expected, maybe due tothe reduced dose, the short period during which thepopulation was evaluated (4–5 years), and a possiblebias in reporting fluoridated salt consumption.
Given the limited preventive effect observed withsalt fluoridation at 90 mg of F per 1 kg of salt, Can-ton Vaud, which had participated in the school pro-gram to distribute fluoridated supplements, in 1969and 1970 fluoridated salt produced by the local BexSalt Mine at 250 mg of F per 1 kg of salt. Salt usedby bakeries and public dining rooms was similarlyfluoridated. To avoid the increased risk of enamelfluorosis (a purely cosmetic defect in the toothenamel caused by an excessive intake of fluoridesduring enamel formation), the new salt was intro-duced with consumer advice about not taking otherfluoride supplements. No problems with enamel flu-orosis were observed. In 1974, Canton Glarus(40,000 inhabitants) also began distributing saltwith 250 mg of F per 1 kg.
2. EARLY EXPERIMENTS,1955–1980
6

It should be noted that fluorides have been usedworldwide since then, and have proven to be indis-pensable for reducing and controlling caries preva-lence. It has become evident that some dental fluo-rosis is to be expected in any effective program forcontrolling caries, whether it involves fluoridation of water or salt or relies solely on topical fluorides(essentially, twice daily toothbrushing with fluoridedentifrices). After some increase of fluorosis, the sit-uation is known to become stable. An analysis offluorosis levels in the United Kingdom covering twodecades illustrates this very well (5).
The Vaud project conducted epidemiological sur-veys every four years in three of the canton’s commu-nities (Moudon, Grandson, and Vevey) and in threeother communities selected as controls (Romont andChâtel-St. Aubin in the Canton Fribourg and St.Aubin in Canton Neuchâtel). Children in the Vaudcommunities participated in the fluoride-supplementprogram and consumed salt fluoridated with 250 mgof F per kg; in Grandson, children also brushed theirteeth with fluoride gels (1.2% F). Children in controlcommunities received fluoride in several vehicles:some of their families used salt fluoridated at 90 mgof F per kg until 1982; in St. Aubin and Romont somechildren received sporadic fluoride supplements; addi-tionally, in St. Aubin an annual program of toothbrushing using gel with 1.2% F began in 1971 (6).After four years (1970–1974), the prevalence andseverity of caries dropped in all communities, but to amuch greater extent in those that consumed salt at250 mg of F per kg. The rate of DMFS at age 12 de-creased from 10.37 to 7.33 (29%). The reduction indecayed, missing, and filled teeth (DMFT) observedin the control communities was attributed to the useof fluoride supplements and topical fluorides. In 1980a second evaluation reported similar results (7).
An evaluation of 12 years of data from the Vaudproject (1970–1982) was published in 1985 (8).Figure 2.1 shows average DMFT values in children10 and 12 years of age in four epidemiological eval-uations over that span of time. Although the sever-ity of caries was already low in 1970, the evaluationrevealed a reduction in caries in both groups (Can-ton Vaud and three control communities) and inboth ages: almost 50% among 12-year-olds in Vaud,compared with 31% in children of the same age incontrol communities.
An interpretation of these results should take intoaccount that caries prevalence in economically de-veloped communities (such as in Switzerland) tendsto diminish as a result of general socioeconomic de-velopment and widespread use of fluoridated tooth-paste. By 1966, some 60% of dentifrices sold inSwitzerland contained fluoride; by 1990, the per-centage had risen to more than 90%. Given the pres-ence of these additional factors, the effects of saltfluoridation in Vaud Canton are even more impres-sive. Notwithstanding, the existence of several fluo-ride sources in the project’s experimental and controlcommunities over varying periods of time precludesa scientifically rigorous demonstration of the ab-solute benefit of salt fluoridation.
HUNGARY
Starting in the mid-1960s, Hungary began threecommunity trials with salt fluoridation (9):
• In February 1966, the village of Denszk, with2,909 inhabitants, was chosen to consume saltfluoridated with 250 mg of F per 1 kg of salt; a
EARLY EXPERIMENTS, 1955–1980
7
FIGURE 2.1 Average DMFT in children 10 and 12years old who consumed fluoridated salt (250F/kg salt) in Canton Vaud communities and inchildren 10 and 12 years old in three controlcommunities, Switzerland, 1970–1982.
0
10% reduction
20% reduction
48% reduction
31% reduction7.09
5.4
4.65
4.02
4.91
5.65
3.682.97
4.37
3.36
2.43
2.6
2.28
2.932.96
2.67
1970 1974 1978 1980
Vaud (10 years old)
1
2
3
4
5
6
7
8
Vaud (12 years old)
Control (10 years old) Control (12 years old)
Source: (8)

small water processing facility began to providethe area water containing 0.1 mg of F per l.
• In May 1968, the town of Röszke, population3,860, began receiving salt fluoridated at 200mg of F per 1 kg.
• In September 1972, the villages of Myhalytelekand Gyalaret, with a combined population ofnearly 2,900, were incorporated as a third ex-perimental community, receiving salt fluori-dated at 300 mg of F per kg (Röszke is about10 km from Szeged and the villages of Myha-lytelek and Gyalaret are between the two).
Three villages were chosen as controls: Szöreg in1967 and Tápé and Dorozsma in 1968. Initially onthe periphery of Szeged, the three control villageseventually became part of that city. The presence ofprimary schools in experimental and control com-munities meant that, other than on short trips andvacation days, most students of school age up to 14years old remained in their communities. Each con-trol village had a central water system that was laterconnected to the water of Szeged. Fluoride concen-tration in the water was 0.15 mg in Szöreg and 0.20mg in Tápé, Dorozsma, and Szeged (9).
Each experimental village received a single typeof fluoridated household salt prepared by the wetmethod, (see Chapter 5 for a description of dry andwet methods.) and utilizing sodium fluoride. Thissalt was used in food preparation in homes andcommunity kitchens, although salt for bakeries wasnot fluoridated. During the study, it was prohibitedto use salt from other sources or other method toprevent caries. To that end, a campaign was con-ducted to educate residents, schoolteachers, localauthorities, and health professionals. Otherwise, thepopulation continued its normal dietary patterns.
Clinical examinations for dental caries were con-ducted in each community—in schools, health cen-ters, or cultural centers—every May, by two teams,each consisting of a dentist and an assistant usingartificial light.
Figures 2.2 and 2.3 show trends in DMFT in chil-dren aged 2–6 and 12–14 years old, from 1966 to1976. Information on children 7–11 years old is notpresented here, but results were similar to those ob-served in the 12–14-year-olds. Over 10 years, the re-
duction in DMFT in children 2–6 years of age was65.8% (from 4.18 to 1.43 DMFT. In children 12–14years of age, the reduction was 59%. In control com-munities, indicators remained more or less stable.
PROMOTING ORAL HEALTH
8
FIGURE 2.2 DMFT trends in children 2–6 yearsold in Denszk (salt fluoridated at 250 mg of F per1 kg salt) and in Dorozsma, Szoreg, and Tápé(controls), Hungary, 1966–1976.
0
4.18
5.32
5.19
6.06
5.39
5.95
5.00
5.54
4.56
1.43
2.432.41
3.17
2.49
1.64
3.18
4.51
5.13
6.38
1
2
3
4
5
6
7
1966 1967 1968 1969 1970 1971 1972 1973 1974 1975 1976
Fluoridated Not fluoridated
FIGURE 2.3 DMFT trends in children 12–14 yearsold in Denszk (salt fluoridated at 250 mg of F per kg salt) and in Dorozsma, Szoreg, and Tápé(controls), Hungary, 1966–1976.
Fluoridated Not fluoridated
6.60
7.25
7.33 7.26 7.227.61 7.55 7.46
7.76 7.54
5.37
6.71
6.45
7.31
6.65
5.80
4.37
1966 1967 1968 1969 1970 1971 1972 1973 19742
3
4
5
6
7
8
9
Source: (9)
The community trials in Hungary demonstratedthat salt fluoridation at 250 mg of F per kg signifi-cantly reduced the prevalence of caries in successivecohorts—a result not observed in the control com-munities. Furthermore, comparison of results fromthe three experimental communities that used dif-ferent fluoride concentrations indicated that as thequantity of fluoride increased so did the preventiveeffect.
COLOMBIA
At its first meeting in 1962, PAHO’s Advisory Com-mittee on Medical Research endorsed a proposalsubmitted by the Organization’s Dental Health Unitthat a study be conducted of the use of salt fluori-dation to prevent caries. The study objectives were(10):
1. Investigation of the effectiveness1 of table saltas a vehicle for fluoride in caries preventionprograms
2. Comparison of the effectiveness of sodium flu-oride (NaF) and calcium fluoride (CaF2) asvehicles of the fluoride ion
3. Establishment of optimal levels of fluoride insalt for its general, safe application.
4. Comparison of the effectiveness of salt fluori-dation with that of water fluoridation.
PAHO’s Dental Health Unit chose the Departmentof Antioquia in Colombia as the site of a communitystudy and worked with a team at the Department ofPreventive and Social Dentistry of the School of Den-tistry of the University of Antioquia, whose membersdesigned and implemented the study.
Four communities—Armenia, Montebello, SanPedro, and Don Matías—were selected to participate
in the study because of their similar geographic, de-mographic, socioeconomic, nutritional, and healthcharacteristics (11). A grant from the United StatesNational Institute of Dental Research (NIDR) fi-nanced the study from 1963 to 1972.
Four interventions were implemented:
• Salt fluoridation using NaF in Armenia• Salt fluoridation using CaF2 in Montebello• Water fluoridation using NaF in San Pedro• Absence of fluoridation (control) in Don Matías
The study also included a population census ineach community (12); collection of blood samples toestablish blood profile, hemoglobin, total proteins,and levels of vitamin A, carotene, and riboflavin; X-rays of the wrist to evaluate bone density anddevelopment; and a dietary survey in a randomsample of 15% of the population to determine saltconsumption.
In addition, on the basis of technical recommen-dations and to obtain consistent, stable products, itwas decided to add sodium pyrophosphate to thesodium fluoride and tricalcium phosphate to thecalcium fluoride. The function of these chemicalswas to buffer the salt, (neutralize any naturally oc-curring acid) and ensure the stability of the mixture.Furthermore, because San Pedro lacked electricpower, a simple feeder line was used to supply waterto that community.
Salt fluoridation began in June 1965. Fluoridatedsalt was prepared in the School of Dentistry of theUniversity of Antioquia and distributed to mer-chants in Armenia and Montebello. Since the studyabsorbed the cost of distributing fluoridated salt,the new salt proved less expensive, and wholesaledistributors stopped marketing salt without fluo-ride. In each community, a dental office was set upand a dentist named to provide emergency service—ranging from tooth extractions in the populationunder study to full treatment upon request for thosein the population over 14 years of age, who conse-quently were not participating in the study (12).
Epidemiological assessments were conductedyearly to determine the prevalence and severity ofcaries in schoolchildren 6–14 years of age. Urinesamples from 12–14-year-olds were analyzed as a
EARLY EXPERIMENTS, 1955–1980
9
1In the original article (reference 10) the term “effectiveness”is used. However, in the biomedical literature, the term effec-tiveness is restricted to the determination of the benefit in opti-mal controllable conditions, for example in a randomized clini-cal trial. We believe that the most appropriate term is“efficiency” because it denotes the benefit in common currentconditions, as in the case of a preventive intervention in a wholecommunity, where the use of the preventive element is left to theindividual.

marker for fluoride exposure and the suitability offluoride supplementation (12, 13). As shown in Fig-ure 2.4, study results indicated that:
• The average DMFT dropped every year of thestudy;
• The three communities that received fluorideshowed similar constant reductions in averageDMFT, a significant difference from results inthe community that did not receive the benefitof fluoride;
• The percentage reduction in average DMFTwas higher in the youngest cohorts (who hadparticipated in the trial from birth);
• Fluoridation from sodium fluoride and from cal-cium fluoride produced similar beneficial effects(however, those effects were lower, by a smallpercentage, than the benefit observed in thecommunity that consumed fluoridated water).
EVIDENCE SUMMARY
The leading method for establishing the effectivenessof a preventive measure at the population level is thecommunity trial, where one population receives thepreventive measure (such as a vaccine, fluoridation,
or an educational intervention) and another, similarpopulation does not. In terms of appropriate method-ologies, the experiments in Hungary and Colombiawere community trials, whereas those in Switzerlandwere not. Except for small differences in sample sizeand fluoride dosage, both community trials show theeffectiveness of salt fluoridation in reducing theprevalence of caries in successive cohorts. Notably,the prevalence of caries was initially higher in Co-lombia than in Hungary and the reduction percent-ages were slightly higher in Hungary—probably be-cause a higher dosage was used.
In conclusion, adding fluoride in the form ofsodium or calcium fluoride to salt for domestic con-sumption prevents caries, and the higher the dosagethe greater the preventive effect. Salt fluoridationhas been demonstrated to be an effective and practi-cal vehicle to provide appropriate levels of fluoride tothe population and, therefore, prevent dental caries.
References
1. Wespi HJ. Experiences and problems of fluoridatedcooking salt in Switzerland. Arch Oral Biol 1961;6[Suppl.]:33–39.
2. Bernimoulin JP, Marthaler TM. Prevention de la cariedentaire en Suisse. [Prevention of Dental Caries inSwitzerland]. Inf Dent 1983;65 (1):19–25.
3. Marthaler TM, Mejía R, Toth K, Viñes JJ. Caries-preventive salt fluoridation. Caries Res 1978;12(Suppl. 1):15–21.
4. Marthaler TM, Schenardi C. Inhibition of caries inchildren after 5 years use of fluoridated table salt.Helv Odont Acta 1962;6:1–6.
5. Holloway PJ, Ellwood RP. The prevalence, causes andcosmetic importance of dental fluorosis in the UnitedKingdom : a review. Community Dent Health1997;14:148–155.
6. Marthaler TM, de Crousaz P, Meyer R, Regolati B,Robert A. Fréquence globale de la carie dentaire dansle canton de Vaud, après passage de la fluorurationpar comprimés a la fluoruration du sel alimentaire.SSO Schweiz Monatsschr Zahnheilk 1977;87(2):147–158.
7. de Crousaz P, Marthaler TM, Robert A. Prophylaxiecollective de la carie dans le canton de Vaud: fluoru-ration du sel alimentaire. Schweiz Monatsschr Zahn-heilk 1980;90:790–795.
8. de Crousaz P, Marthaler TM, Wiesner V, Bandi A,Steiner M, Robert A, Meyer R. Caries prevalence inchildren after 12 years of salt fluoridation in a Can-
PROMOTING ORAL HEALTH
10
FIGURE 2.4 Average DMFT in children aged 6–14years old, four communities, Colombia, 1964–1972.
01964 1965 1966 1967 1968 1969 1970 1971 1972
2
4
6
8
10
Armenia
(NaF 200mgF/kg) (CaF2 200mgF/kg) (NaF 1ppm F indrinking water)
(Control)
Montebello San Pedro Don Matías
ton of Switzerland. Schweiz Monatsschr Zahnmed1985;95(9):805–8l5.
9. Toth K. Ten years domestic salt fluoridation in Hun-gary. Acta Paediatr Acad Sci Hung 1978;19(4):319–327.
10. Restrepo D, Gillespie GM, Velez H. Estudio sobre lafluoruración de la sal. [Study of salt fluoridation].Bol Of Sanit Panam 1972;73(5):418–423.
11. Restrepo D. Salt fluoridation: An alternate measureto water fluoridation. Int Dent J 1967;17(1): 4-g.
12. Restrepo D, Velez H, Espinal F, Hernández N. Fluo-ruración de la sal. I. Estudio censal y selección de lamuestra. [Salt fluoridation. I. Survey Study and Se-lection of the Sample]. Bol Of Sanit Panam 1972;73(5): 424–435.
13. Mejía R. Experience with salt fluoridation in Colom-bia. Salt Fluoridation. Washington, DC: Pan Ameri-can Health Organization; 1986. Scientific Publica-tion No. 501.
EARLY EXPERIMENTS, 1955–1980
11

PAHO’s Regional Oral Health Program has as itsmain objective the promotion of cost-effectivestrategies to prevent oral diseases and the adop-
tion of targeted measures to improve equitable accessto oral health services. Over the past 10 years, almostall the countries of the Americas have made signifi-cant progress in these respects.
Although the Region of the Americas continues toexperience a high prevalence of dental caries, ac-cording to Health in the Americas, 1998 edition (1),it was beginning to decrease, a trend that becameclearer in 2004 after analysis of additional epidemi-ological data from several countries. One of the mostimportant factors contributing to that trend has beenthe initiation and maintenance of national programsfor dental caries prevention based on the use of fluo-rides in accordance with technical guidelines devel-oped by PAHO’s Regional Oral Health Program (2).By 2001, several countries in the Americas had hadsalt fluoridation programs in place for at least sevenyears—Mexico had its program running for sevenyears; Uruguay for 9 years; and Costa Rica and Ja-maica for 11 years. They all reported a reduction inthe prevalence and severity of caries (3–6). Similarevaluations will be conducted in the next six years inother countries that have initiated or expanded thecoverage of their salt fluoridation programs.
In 1997, PAHO’s Governing Bodies approved a re-gional plan and strategies to set up national programsfor caries prevention (7, 8). That plan stipulated thatmassive prevention programs through fluoridation ofsalt and drinking water be implemented, and made itpossible to mobilize resources to:
1. Initiate or strengthen salt fluoridation pro-grams in 16 countries—Belize, Bolivia, Colom-
bia, Costa Rica, the Dominican Republic,Ecuador, El Salvador, Guatemala, Honduras,Jamaica, Mexico, Nicaragua, Panama, Para-guay, Peru, and Venezuela; and
2. Carry out water fluoridation programs in Ar-gentina and Chile.
In most of the countries that had salt fluoridationprograms, the salt industry had begun to add fluorideto salt for human consumption (9). In countrieswhere salt is not produced locally, PAHO promotedthe enactment of legislation mandating that onlyfluoridated salt be imported for domestic use. As partof these national fluoridation programs, epidemiolog-ical surveillance systems have been strengthened, im-proving the quality of programs as well as the collec-tion of information by countries (10).
REDUCTION OF CARIES
Among the goals set forth by the Pan AmericanHealth Organization in 1999 was a 50% reductionin caries prevalence throughout the Region (11). Tomonitor progress in that effort, PAHO cooperateswith countries to conduct epidemiological surveil-lance of caries, using cross-sectional clinical studiesin specific population groups (cohorts), followingprotocols established by the World Health Organiza-tion (12).
Table 3.1 shows the prevalence and severity ofcaries in 12-year-old schoolchildren in several coun-tries of the Region. It shows averages of indexes re-ported in epidemiological studies carried out in the1980s and 1990s, using a wide range of sources—among them, official publications of governmental
3. PROGRESS AND SUCCESS,1980–2000
12

PROGRESS AND SUCCESS, 1980–2000
13
TABLE 3.1 DMFT index and percentage reduction in children 12 years of age, selected countries of theAmericas, 1980–2004.
AnnualizedYear Year Reduction reduction
Subregion/Country (1980s) DMFT (1990–2000s) DMFT (%) (%)
North AmericaCanadaa 1982 3.2 1990 1.8 43.8 6.94United States 1986–1987 1.8 1988–1991 1.4 21.8 7.86Mexico 1988 4.42b 1997–1998 3.11b, d 29.6 3.45
1987 4.60c 2001 2.0c, d 45.7 6.55
Central America and PanamaGuatemala 1987 8.1 2002 5.2Belize 1989 6.0 1999 0.60 89.5 20.18El Salvador 1989 5.1 2000 1.4 74.5 11.69Honduras 1987 7.7 1997 4.0 48.4 6.41Nicaragua 1983 6.95 1997 2.78 (1983–1997) 6.34
1988 5.9 60.0Costa Rica 1988 8.4 1992 4.9 (1988–1992) 42.2 12.82
1999 2.5 (1988–1999) 72.5 10.61Panama 1989 4.2 1997 3.64 13.3 1.77
Andean AreaVenezuela 1987 3.67 1997 2.1 42.2 4.13Colombia 1977–1980 4.8 1998 2.30 52.1 3.70Ecuador 1988 5.0e 1996 2.95 40.5 5.95Peru 1988 4.8 1990 3.09f N/Ag
Bolivia 1981 7.6 1995 4.61 39.3 3.51Chile 1987 6.0h 1992 4.70 (1987–1996) 47.8 6.98
1996 4.10i (1992–1996) 12.8 3.361996 3.4d
Southern Cone and NortheastArgentina 1987 3.4Uruguay 1983–1987 8.5j 1992 4.2 (1992–1999) 40.6 7.18
6.0k 1999 2.5Paraguay 1983 5.9 1999 3.8 35.1 2.66Brazil 1986 6.66l 1996 3.1 (1986–1996) 54.0 7.47Suriname 1992 2.7
2002 1.9Guyana 1983 2.7 1995 1.3 51.9 5.91
CaribbeanAnguilla 1986 7.5 1991 2.5 66.7 19.73Antigua and Barbuda 1988–1989 0.7Aruba 1990 2.9m
Bermuda 1990 0.2Bahamas 1981 1.6 2000 1.3 2.5 0.14Barbados 1983 4.4 1996 1.4j
2001 0.8Cuba 1984 3.9 1992 2.9
1998 1.6 25.6 3.64Curaçao 2001 0.8Dominica 1989 2.5 1995 2.0d 20.0 3.65Grenada 1984 2.6n 1991 5.52 (1984–1991) 1.2 10.15
2000 2.70 (1991–2000) 50.9 7.60Guyana 1983 2.7 1995 1.3Haiti 1983 3.2 2000 1.0o
Cayman Islands 1989–1990 4.6 1995 1.71999 0.9 63.0 16.57
Jamaica 1984 6.7 1995 1.1 83.9 15.19
(continued on next page)

offices, the World Bank, WHO, and PAHO’s Re-gional Oral Health Program (13–43).
The various sources of data for countries were asfollows:
• Initial studies or evaluations that are part of theepidemiological surveillance system of nationalfluoridation programs—Belize (45), Bolivia(46), Costa Rica (47, 48), Chile (49), the Do-minican Republic (50), Ecuador (51), El Sal-vador (52), Honduras (53), Jamaica (18),Nicaragua, Panama, Paraguay (54), Peru (55),Uruguay (29), and Venezuela (56).
• A national study of urban areas conducted in1986 and data from a comparative study con-ducted in 1993, Brazil (57).
• Studies conducted in the Province of Ontario,Canada (20).
• The first part of the NHANES (National Healthand Nutrition Examination Survey), which
gathered information between 1988 and 1991(21), United States.
Table 3.1 includes the annualized percentage re-duction (APR) in the prevalence of caries, followingthe procedures established by PAHO. (Note: TheAPR is positive when the final value is less than theinitial value [reduction] and negative if the finalvalue is greater than the initial value [increase].)The APR permits a more consonant comparison tobe made between countries than the percentage re-duction reported in Health in the Americas, 1998edition, because in calculating APR, the compoundrate of reduction per year in percentage is included.
The table shows the great disparity in the averagenumber of decayed, missing, or filled teeth at 12years of age. In the 1980s, a DMFT of 6 was reportedin Anguilla, Belize, Bolivia, Brazil, Chile, the Domini-can Republic, Honduras, Martinique, Nicaragua, Ja-maica, and Uruguay. In Costa Rica and Guatemala,the average DMFT was 8 or more. During the 1980s
PROMOTING ORAL HEALTH
14
Dominican Republic 1986 6.0 1997 4.44 26.0 1.99Martinique 1988 6.3Puerto Ricop 1992 3.5
1997 3.8Saint Vincent and the Grenadines 1991 3.25Saint Kitts and Nevis 1979–1980 5.54 1998 2.6q 53.4 3.84Suriname 2002 1.9Saint Lucia 1997 6.0Trinidad and Tobago 1989 4.9 1998 5.2
2004 0.6Turks and Caicos 2002 0.9a Province of Ontario.b Mexico, D.F.c Mexico, State of Mexicod Data sent to the Regional Oral Health Program, PAHO. Some of these studies are in press.e Children 12 to 14 years of age.f Population 11 years oldg The percentages have not been calculated because the age groups are widely different and it has not been possible to corroborate the orig-
inal report(s) or the data bases.h Restricted to the metropolitan region of Gran Santiago and reported in Urbina.i Includes only six regions of Chile.j Population of 13 to 19 years olds.k Range of values in three studies reported by the Ministry of Healthl Urban population.m Data unpublished but reported in Adewakun, 1997.n Project HOPE. Results reported in Adewakun, 1997.o The value corresponds to the average DMFS. Applying linear and curvilinear regression models (see Järvinen, 1983), the DMFT can be expected
to be between 0.53 and 1.47.p (44).q Includes only Saint Kitts.
TABLE 3.1 (continued)Annualized
Year Year Reduction reductionSubregion/Country (1980s) DMFT (1990–2000s) DMFT (%) (%)

and 1990s, average DMFT values decreased from2.5% in the Bahamas to nearly 90% in Belize. Theannualized percentage reduction ranged from 0.14%in the Bahamas to approximately 20% in Belize andAnguilla. In Grenada, an increase of 112% was ob-served between 1984 and 1991, followed by a reduc-tion of 51% between 1991 and 2001.
WHO established the goal of DMFT below 3 atage 12 years by the year 2000 as a benchmark fororal health under the 1979 Alma Ata Declaration onPrimary Health Care (58). The objective of an aver-age DMFT of 3 has been reached in Anguila, An-tigua, Aruba, Bahamas, Barbados, Belize, Bermuda,Canada, Cayman Islands, Colombia, Costa Rica,Cuba, Curaçao, Dominica, Ecuador, El Salvador,Grenada, Guyana, Haiti, Jamaica, Mexico, Nicara-gua, Peru, Saint Kitts, Suriname, Trinidad and To-bago, Turks and Caicos Islands, the United States,Uruguay, Venezuela, and some states of Brazil.Some countries—Bolivia, the Dominican Republic,and some regions of Chile—still present an averageDMFT above 4.
Analysis of the data in Table 3.1 should take intoaccount several factors. First, the reduction percent-ages and annualized reduction percentages dependon initial and final values. As a result, these figurescan be imprecise due to variations in sampling, rep-resentativeness, the age groups included, and the va-lidity and reproducibility of the information used tocalculate both values. These differences tend to bemore marked when the number of years betweenstudies increases and new researchers become in-volved. Secondly, the reductions and analyzed fig-ures are not absolute measures; thus, an evaluationof the percentages should take into account the ini-tial and final values used in their calculation. For ex-ample, between 1987 and 1996, the State of Mexicoreported a reduction of approximately 46% (APR =6.6%), similar to that reported by Honduras between1987 and 1997 (48% reduction, APR = 6.4%).Notwithstanding, in Mexico the DMFT went from4.6 to 2.5, while in Honduras it went from 7.7 to 4.0.As the average DMFT decreases, small changes inaverage values, which can be the results of biases,can produce elevated percentage reductions.
These differences aside, it is remarkable that allcountries exhibit reductions in the average DMFT. Ifthe trends observed in Table 3.1 continue, most
countries in the Region can be expected to bringcaries under control, so they become less prevalentand less serious in their presentation, as has occurredin countries that have had preventive programs foryears, such as Canada and the United States.
The cases of Costa Rica and Jamaica, as shown inFigure 3.1, illustrate the epidemiological changesthat can be expected in the Region.1 As can be ob-served, in the 1980s almost all 12-year-olds in bothcountries were affected by caries (the cumulativeDMFT curve reached 100% in 100% of the popula-tion), and the disease followed the same populationpattern (the curves coincide). By 1995, only 40% of 12-years-olds in Jamaica experienced caries. By1999, 70% of 12-year-olds in Costa Rica were stillaffected. The difference in reductions in the twocountries is due to the high prevalence and severityof dental caries in Costa Rica at the start of the na-tional prevention program (DMFT = 8.4). If the ob-
PROGRESS AND SUCCESS, 1980–2000
15
FIGURE 3.1 Cumulative percentage of DMFT inchildren 12 years of age in Costa Rica (1988 and1999) and Jamaica (1984 and 1995).
0
Cu
mu
lati
ve p
erce
nta
ge
of
DM
FT
0 10
Jamaica 1984 Jamaica 1995Costa Rica 1988 Costa Rica 1999
20 30 40 50 60
Cumulative percentage in the 12-year-old population
70 80 90 100
20
40
60
80
100
1The cumulative percentages are calculated utilizing theDMFT frequency distribution: the frequencies accumulate fromthe end of the distribution with the highest values of DMFT untilthey reach a value that corresponds to the total DMFT in thepopulation. These values are graphed according to the cumula-tive percentage of the population sample.

served trend continues, the cumulative distributionin Costa Rica can be expected to approach that ofJamaica. Furthermore, countries that have launchedsalt fluoridation programs can be expected to expe-rience similar epidemiological changes.
Table 3.2 presents information from a group ofcountries where recent epidemiological studies havebeen conducted. It gives the percentages of people ineach of four groups categorized by the degree ofseverity of caries: those free from caries (DMFT = 0),those with DMFT between 1 and 3, those withDMFT between 4 and 6, and those with DMFTequal to or greater than 7. The table also presentsthe percentage contribution of each of the three ele-ments of DMFT in those affected by caries (DMFT > 0). It distinguishes two groups of countries. In onegroup—Belize, the Cayman Islands, Guyana, Jamaica,and the United States—40% or more of 12-year-oldsdid not present caries (DMFT = 0). In the secondgroup—Bolivia, the Dominican Republic, Ecuador,Honduras, Nicaragua, Panama, and Paraguay—only 10%–25% of 12-year-olds presented no caries;moreover, in Bolivia, the Dominican Republic, andHonduras, over 50% of 12-year-olds had three ormore teeth affected by caries or sequelae (DMFT� 3); and in Bolivia, the Dominican Republic, Ecua-dor, Honduras, Panama, and Paraguay more than10% of 12-year-olds had seven or more teeth af-fected by caries or sequelae.
Analysis of the percentage contribution of eachelement of DMFT in those who experienced caries(Table 3.2) makes it possible to draw inferencesabout the type of oral health services the populationreceives. Populations with access to oral health ser-vices that offer restorative treatment have high per-centages of the filled component and low percent-ages of the decayed and extracted components.Inversely, populations with limited access to restora-tive treatment present high percentages of decayedand extracted teeth. The values in Table 3.2 contrastcountries such as the Cayman Islands, Costa Rica,and the United States, that have high percentages(49%–71%) of filled teeth, with countries such asBolivia, the Dominican Republic, Ecuador, Hon-duras, Panama, and Paraguay, where teeth with un-treated caries account for more than 80% of DMFT.The cases of Jamaica and Guyana present two situ-ations that warrant additional interpretation. Thecountries present similar percentages of teeth withuntreated caries (D)—73% and 77% of DMFT, re-spectively. Jamaica, however, has a higher percent-age of people free of caries (66%) and 17.5% ofDMFT represent restored teeth, whereas in Guyanaonly 0.6% of DMFT are restored teeth. From thesedata it can be inferred that Jamaica’s populationhas, on average, greater access to restorative clinicalinterventions than the population in Guyana, whereoral health needs are served mainly through dental
PROMOTING ORAL HEALTH
16
TABLE 3.2 Severity of caries and relative percentage of DMFT components in children 12 years of age,selected countries of the Americas, based on available information from the 1990s.
DMFT severity D, M, and F as % of DMFT in(% of children according to DMFT level) those with DMFT � 0
Country No. 0 1�DMFT�3 4�DMFT�6 DMFT�7 D/DMFT (%) M/DMFT (%) F/DMFT (%)
Belize, 1999 70.6 24.8 3.7 0.9 87.4 4.3 8.3Bolivia, 1995 389 12.3 30.1 29.0 28.5 90.3 3.6 6.1Costa Rica, 1999a 1349 28.05 39.78 26.16 6.01 33.87 4.62 61.50Ecuador, 1996 500 22.40 41.20 26.20 10.20 84.61 6.63 8.76United Statesb 176 50.05 32.6 16.3 1.1 27.00 1.30 71.40Guyana, 1995 547 45.00 44.20 9.70 1.10 76.87 22.49 0.64Honduras, 1997 307 11.7 35.8 34.2 18.2 92.1 1.8 6.1Cayman Islands, 1995 154 39.60 44.20 11.70 4.50 50.88 0.54 48.57Jamaica, 1995 362 59.2 29.8 10.2 0.8 72.60 9.90 17.50Nicaragua, 1997 365 20.8 44.4 26.9 8.0 95.9 2.5 1.6Panama, 1997 149 22.1 30.2 30.9 16.8 80.4 10.1 9.5Paraguay, 1999 348 18.4 41.4 24.4 15.8 88.0 7.5 4.6a Data reported to the Regional Oral Health Program, PAHO, in press.b The percentages have been taken from the NHANES Study III, 1988–1991, and have been calculated especially for this table by Dr. E. Beltrán
of the CDC.

extractions. This difference may result from the ab-sence of preventive and restorative alternatives im-plemented at the beginning of the course of the dis-ease; for example, Jamaica has three times as manydentists per inhabitant as Guyana. Similarly, it ispossible that the low DMFT in Guyana (1.3 in1995) results from the inclusion in this study ofsamples from isolated rural populations that stillwould not have adopted cariogenic diets (63). Thecase of Belize, which presents the lowest DMFT inthe Region (0.63), likewise indicates a lack of accessto restorative treatment, as reflected in a high per-centage of caries that are untreated (87%).
Differences among Population, Racial, and Ethnic GroupsThe epidemiological change described above has notoccurred uniformly over the entire population: epi-demiological studies describe population groups orindividuals with high prevalence and severity of dis-ease, associated with geographic, demographic,ethnographic, and socioeconomic factors.
Differences in caries prevalence and severityamong racial and ethnic groups in Guyana (1995)and the United States (1988 to 1991) were describedin Health in the Americas, 1998 edition. Studies con-ducted after 1998 in the Bahamas, Costa Rica, Hon-duras, and Paraguay, for example, confirm those dif-ferences, namely that the groups most affected bycaries are those without adequate access to preven-tive and curative interventions, even in countries thathave national preventive programs based on salt orwater fluoridation. Access to services is a direct con-sequence of socioeconomic level (59, 60).
Despite the overall low prevalence of dentalcaries in countries such as El Salvador and Haiti,rural areas generally show higher prevalence thanurban ones, although differences tend to be decreas-ing. In many Caribbean countries, for example,there is no significant difference in prevalence ofdental caries between urban centers and rural com-munities, probably because the two are not geo-graphically separate. In countries with diverse pop-ulations and ecosystems, however, geographicdifferences can be marked, especially if the socio-economic factor is added. Figure 3.2 presents theaverage DMFT values for 12-year-olds in Bolivia,
and shows how the effect of geographic factors—namely llano (plains), valle (valley), and altiplano(high plains)—is modified by the socioeconomiclevel in different areas.
Stratification of caries indexes by geographic lo-cation allows areas to be identified where the level ofthe disease requires specific interventions. For ex-ample, Figure 3.3 shows average values for DMFTfor 12-year-olds in various states of Mexico, takenfrom the national epidemiological evaluation begunin 1996 (61); they range from 0.68 in Coahuila to3.11 in the Federal District (the capital). Similardifferences have been reported in the Bahamas (62)and Colombia (31).
MULTIYEAR PLAN TO PREVENT CARIESIN THE AMERICAS
The preventive benefits for caries of systemic flu-orides in water and salt for human consumptionhave been demonstrated in several countries of theAmericas and Europe, as shown in Chapter 2. Fluo-ridation of drinking water has been a significantfactor in reducing the prevalence of caries in the
PROGRESS AND SUCCESS, 1980–2000
17
FIGURE 3.2 Effect of socioeconomic level inDMFT values among children aged 12 years inthree geographic regions, Bolivia, 1995 epidemiologic study.
DM
FT(1
2)0
Llano Valle Altiplano
1
2
3
4
5
6
7
8
High LowModerate

United States and Canada (63). Similar benefitshave been reported from consumption of fluoridatedsalt (2–5, 18).
In 1994, PAHO’s Regional Oral Health Programbegan implementing a multiyear plan to preventcaries in the Americas, making use of salt and waterfluoridation. A situational analysis of the Region’scountries determined the prevalence and severity ofcaries (see the column corresponding to the 1980s inTable 3.1) and the existence of prevention programs.That analysis yielded a typology for classifying coun-tries according to their oral health development (seeTable 3.3). DMFT at 12 years of age (DMFT-12) isused as the principal criterion, because it is easilymeasured in most of the countries and allows forvalid, reliable comparisons among countries. Threestages of oral health development are defined: (1) anemerging stage, with a DMFT-12 greater than 5; (2)a growth stage, with a DMFT-12 of 3 to 5; and (3) aconsolidation stage, with a DMFT-12 below 3.
The plan is guided by three operating principles:caries prevention, development of technical capabil-ity, and program continuity. Under the plan, everycountry targets positive epidemiological change—from emerging and growth stages with high preva-lence and severity of caries, to stages of consolida-tion with limited prevalence and severity. Towardthat end, almost all countries in the Region have
started water and salt fluoridation projects. Figure3.4 shows the distribution of these programs in theRegion, and Table 3.4 shows the status and cover-age in each country by the end of 2001. As can beseen, not all fluoridation programs cover 100% ofthe population. For example:
• In Bolivia only 40% of the salt is fluoridated.• The Dominican Republic, Guatemala, Hon-
duras, and Nicaragua are still in initial stagesof production.
• Chile has extended water fluoridation to theSantiago metropolitan area, whereas previ-ously only the areas of Valparaiso and Viña delMar were covered.
• Argentina now adds fluoride to drinking waterin Buenos Aires; previously, only the city ofRosario had fluoridated water.
By 2010, more than 400 million people in LatinAmerica and the Caribbean are expected to have ac-cess to fluoridated salt or water. Three countries—Costa Rica, Jamaica, and Mexico—launched saltfluoridation programs at the end of the 1980s, andtheir programs have been evaluated for over fiveyears. (Other countries—among them Peru, Ecuador,and Uruguay—launched salt fluoridation programsin the mid-1990s, so medium-term epidemiological
PROMOTING ORAL HEALTH
18
FIGURE 3.3 Variation in DMFT in children 12 years old, different states, Mexico.
0
Coahuila
Querét
aro
Nuevo Le
ón
Quinta
na Roo
Chihuah
ua
Guanaju
ato
Nayar
it
Sinalo
a
Tabas
co
Mich
oacán
Feder
al Dist
rict
1
2
0.68
1.59 1.72
2.04 2.08 2.202.39
2.68
3.11
2.67
2.22
3
4
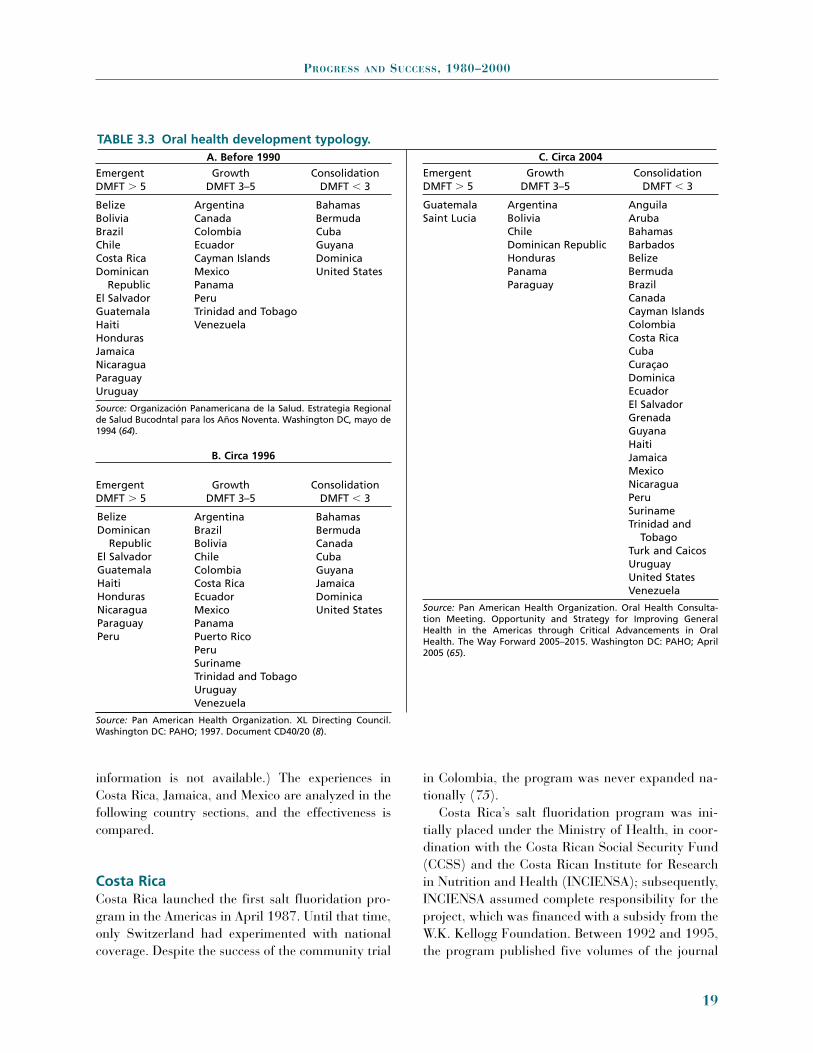
information is not available.) The experiences inCosta Rica, Jamaica, and Mexico are analyzed in thefollowing country sections, and the effectiveness iscompared.
Costa RicaCosta Rica launched the first salt fluoridation pro-gram in the Americas in April 1987. Until that time,only Switzerland had experimented with nationalcoverage. Despite the success of the community trial
in Colombia, the program was never expanded na-tionally (75).
Costa Rica’s salt fluoridation program was ini-tially placed under the Ministry of Health, in coor-dination with the Costa Rican Social Security Fund(CCSS) and the Costa Rican Institute for Researchin Nutrition and Health (INCIENSA); subsequently,INCIENSA assumed complete responsibility for theproject, which was financed with a subsidy from theW.K. Kellogg Foundation. Between 1992 and 1995,the program published five volumes of the journal
PROGRESS AND SUCCESS, 1980–2000
19
A. Before 1990
Emergent Growth ConsolidationDMFT � 5 DMFT 3–5 DMFT � 3
Belize Argentina BahamasBolivia Canada Bermuda Brazil Colombia CubaChile Ecuador GuyanaCosta Rica Cayman Islands Dominica Dominican Mexico United States
Republic PanamaEl Salvador PeruGuatemala Trinidad and TobagoHaiti Venezuela Honduras Jamaica Nicaragua Paraguay Uruguay
Source: Organización Panamericana de la Salud. Estrategia Regionalde Salud Bucodntal para los Años Noventa. Washington DC, mayo de1994 (64).
B. Circa 1996
Emergent Growth ConsolidationDMFT � 5 DMFT 3–5 DMFT � 3
Argentina BahamasBrazil Bermuda Bolivia Canada Chile Cuba Colombia Guyana Costa Rica Jamaica Ecuador Dominica Mexico United States PanamaPuerto RicoPeruSuriname Trinidad and TobagoUruguayVenezuela
Source: Pan American Health Organization. XL Directing Council.Washington DC: PAHO; 1997. Document CD40/20 (8).
C. Circa 2004
Emergent Growth ConsolidationDMFT � 5 DMFT 3–5 DMFT � 3
Guatemala Argentina AnguilaSaint Lucia Bolivia Aruba
Chile BahamasDominican Republic Barbados Honduras Belize Panama Bermuda Paraguay Brazil
Canada Cayman Islands Colombia Costa Rica Cuba Curaçao Dominica Ecuador El Salvador Grenada Guyana HaitiJamaica MexicoNicaragua PeruSuriname Trinidad and
TobagoTurk and Caicos UruguayUnited StatesVenezuela
Source: Pan American Health Organization. Oral Health Consulta-tion Meeting. Opportunity and Strategy for Improving GeneralHealth in the Americas through Critical Advancements in OralHealth. The Way Forward 2005–2015. Washington DC: PAHO; April2005 (65).
TABLE 3.3 Oral health development typology.
BelizeDominican
RepublicEl SalvadorGuatemalaHaitiHondurasNicaraguaParaguayPeru

Fluoridation Update, reporting on several aspects ofthe program, especially studies related to chemicaland biological monitoring. Highlights of the pro-gram follow.
Salt consumption was estimated at 10 g per per-son per day. Salt in Costa Rica is fluoridated usingthe dry method and NaF. The initial concentrationwas 250 ± 25 mg of F per 1 kg, but in 1994 the dosewas reduced to 150–200 mg of F per 1 kg, afterenamel fluorosis was reported in some cohorts ofchildren who had consumed salt during tooth for-mation. Retrospectively, however, the levels of fluo-rosis were reported to be very low. Following an in-ternational meeting of experts in 1999, the fluorideconcentration adopted by Costa Rica was 200 ± 25mg of F per 1 kg salt.
Salt was locally produced by seven plants through-out the country. Quality control was carried out bythe salt plants locally and centrally at INCIENSA,with periodic data recording and monthly evalua-tions. INCIENSA obtained salt samples from supplycenters and analyzed 15–20 samples from each plant.Salt distribution is strictly controlled in Costa Rica,since in some areas there is a high level of naturalfluoride in drinking water, and thus only non-fluoridated salt should be sold there. Quality controlshows that Costa Rican salt is consumed within fourmonths of being produced.
The initial dosage (250 mg of F per 1 kg salt) wasestablished after review of dosages used in Switzer-land (90 and later 250 mg of F per 1 kg salt), Hun-gary (250 mg of F per 1 kg salt), and Colombia (200
PROMOTING ORAL HEALTH
20
FIGURE 3.4 Status of salt fluoridation programs, Region of the Americas, 2004.
Advanced Programs:Mexico, BelizeCosta Rica, JamaicaVenezuela, ColombiaEcuador, PeruBolivia, Uruguay
Beginning Programs:Cuba, Dominican Republic,Guatemala, El SalvadorHonduras, Nicaragua,Paraguay
Source: PAHO

mg of F per 1 kg salt), and after analysis of the resultsof studies of fluoride concentration in urine and water.
Urine studies were conducted using differentmethodologies: 24-hour samples, specific samples(for example, at 9 a.m. and two hours after lunch),individual samples (from the person), and collectivesamples (from the school). The studies were con-ducted in groups of children 7–13 years of age inschools and in young adults 20–30 years of age insoccer stadiums. Results were similar for bothgroups, with fluoride concentration in urine rangingbetween 0.24 and 0.44 mg of F among 7–13 yearolds and between 0.30 and 0.42 mg of F in adults. InJune and October 1987 and again in 1988, studieswere conducted of fluoride in urine in 16–22-year-olds. Despite the limited number of samples, an in-crease in fluoride in urine, associated with consump-tion of fluoridated salt, was detected. For example, in
Cantón Siquierres (Limón) samples collected at 9a.m. and 1 p.m. had average concentrations of 0.75and 0.80 mg of F, respectively, an increase over the0.44 mg of F obtained in June 1987, a few monthsafter fluoridation began. Later, stabilization of fluo-ride concentrations in urine—ranging between 1.0and 1.7 mg of F—was observed.
The water study revealed areas with naturally oc-curring fluoride (67). The most significant of theseis in the Cantón Central in the Province of Cartagoand neighboring sectors of cantons Oreamuno andAlvarado. In the communities of Tierra Blanca andLlano Grande, natural fluoride concentrations inwater range between 0.8 mg FAI (Free AndrogenIndex) in the rainy season and 1.4 mg FAI in the dryseason. Those communities, moreover, are in anarea characterized by the presence of volcanic erup-tions. Studies in 1986 and 1988 of fluoride in urine
PROGRESS AND SUCCESS, 1980–2000
21
TABLE 3.4 Countries with programs for water or salt fluoridation in the Region of theAmericas at the end of 2001. Country System Coverage Status
Argentina Water Data is not available OperationalBelize Salt National InitiatedBolivia Salt 40% coverage OperationalBrazil Water 60% of the population with Operational
drinking water systemsCanada Water OperationalChile Water National OperationalColombia Salt Incomplete data OperationalCosta Rica Salt National OperationalCuba Salt National OperationalDominican Republic Salt National OperationalEcuador Salt National OperationalEl Salvador Salt National InitiatedGrenada Salt PlannedGuatemala Salt Data not available InitiatedGuyana Salt National Importation of fluoridated
salt plannedHonduras Salt National InitiatedJamaica Salt National OperationalMexico Salt National OperationalNicaragua Salt National InitiatedPanama Water National InitiatedParaguay Salt National InitiatedPeru Salt Incomplete data OperationalSuriname Salt National Importation of fluoridated
salt plannedUnited States Water Approximately 67% of the Operational
population with drinking water systems
Uruguay Salt National OperationalVenezuela Salt National, at less than 100 mg Operational
of F per kg
and fluorosis in children 5 and 7 years old in TierraBlanca and Llano Grande found that fluoride con-centration in urine ranged between 0.47 and 3.3 mgof F per liter and that the prevalence of very mild tomore intense fluorosis was 47%. Both values areabove what would be expected in a community witha maximum level of 1.4 mg of F in the drinkingwater. In 10 children with moderate to serious fluo-rosis, a fluoride concentration in urine higher than1.5 mg of F was observed.
Salt marketed in Tierra Blanca and LlanoGrande does not contain fluoride. Taking into ac-count the levels of fluorosis observed and the con-centration of fluoride in the water, it is probable thatchildren in these communities receive additional flu-oride from various sources, such as volcanic gasesboiled from drinking water to prepare food or feed-ing bottles. INCIENSA researchers plan to conduct a more specific study in Tierra Blanca and LlanoGrande to determine the different fluoride sources.It is important to note that Costa Rica’s salt fluori-dation program includes an educational campaignin communities with natural fluoride, promotingawareness of the availability of non-fluoridated salt (67).
Since 1984, when a national study of oral healthwas conducted, epidemiological studies have beencarried out every four years on 12-year-old school-children. In 1988, a year after the fluoridation pro-gram was launched, a second national study wasconducted (16). Between 1984 and 1988, the epi-demiology of caries in Costa Rica had changed verylittle. Average DMFT in children 12 years old was9.1 in 1984 and 8.4 in 1988, a reduction of 0.7 possibly explained by intrinsic differences in the de-sign of the two studies. In 1992, a national study of12-year-old schoolchildren yielded an averageDMFT of 4.9, a reduction of 40% compared to theaverage DMFT in 1988 (68). In 1996, as part of thenational nutrition study, data on the state of denti-tion of children 7–12 years old indicated that theaverage DMFT for 12 year olds was 4.9, which iscomparable to the value obtained in 1992 (47). Fi-nally, preliminary data from the latest epidemiolog-ical evaluation of caries and the first national eval-uation of enamel fluorosis carried out in 1999showed an average DMFT of 2.5 at 12 years of age,
confirming the downward trend of the prevalenceand severity of caries in Costa Rica (69).
An important aspect of Costa Rica’s program forsalt fluoridation was the designation of a sentinelsite to monitor caries and enamel fluorosis. TheCantón La Unión-Cartago was chosen for that pur-pose, to represent socioeconomic and populationcharacteristics similar to those of the average CostaRican canton. Between 1990 and 1993, four epi-demiological studies of samples of children 7 and 12years old were conducted at the sentinel site.
Finally, data from the latest epidemiological eval-uation of caries and the first national evaluation ofenamel fluorosis carried out in 1999 showed anoverall mean DMFT of 2.46 at age 12 and of 4.37at age 15. Regional differences were observed, withthe DMFT at age 12 ranging from 1.93 to 3.86.Compared with pre-fluoridation data collected in1984, schoolchildren aged 12 years experienced a28% decrease in prevalence (from 100% down to72%) and a 73% decrease in severity (DMFT from9.13 to 2.46, representing an 8.3% compound an-nual percent reduction).
Prevalence of very mild or greater enamel fluoro-sis at age 12 years was 17% for teeth 13 to 23 and32% when teeth 14 and 24 were included. At age 15years, the prevalence was 12% for teeth 13 to 23 and25% when teeth 14 and 24 were included. Large re-gional differences were observed, ranging from 10%to 76% among 12-year-olds and from 6% to 50%among 15-year-olds. The prevalence of enamel fluo-rosis is within the range expected for a salt fluorida-tion program, but regions with higher severity shouldinvestigate further on additional sources of fluoride,including environmental ones.
Between 1984 and 1999, Costa Rican school-children experienced substantial reductions in cariesprevalence and severity. Many factors may be in-volved in this decline, but the most likely appears tobe exposure to fluoridated salt.
JamaicaAlthough Costa Rica was the first country to initiatesalt fluoridation in the Americas, Jamaica was thefirst country that launched a nationwide program.Between 1985 and 1986, Jamaica’s Parliament and
PROMOTING ORAL HEALTH
22
the Ministry of Health established final legalarrangements for launching the program. In 1987, aproposal for a national salt fluoridation programwas introduced, feasibility studies undertaken, per-sonnel at Alkali Ltd., the salt production facility,trained (70), a dietary survey carried out (yieldingaverage consumption of 7.8 g of salt per person perday), and a caries survey conducted (71). In Sep-tember of that same year, five months after CostaRica had launched its program, Jamaica undertooka wide ranging campaign to promote the use of saltfluoridation to prevent dental caries, which was fol-lowed by the production and sale of fluoridated saltto 2.4 million of its inhabitants (70).
During the 1970s and 1980s, Jamaica undertookseveral preventive interventions against caries, in-cluding the use of fluoride rinses and fluoride sup-plements among schoolchildren. In addition, duringthe 1970s it was proposed to fluoridate the water inKingston, the capital. Unfortunately, most of theseprograms were of limited duration and were termi-nated for lack of financial support.
The most important factors in Jamaica’s decisionto fluoridate salt for household use instead of relyingon fluoridated water, was the absence of water distri-bution networks, the use of rainwater in rural areas,and the presence of a single salt producer for thecountry. That producer buys salt from the Bahamasand processes it for domestic consumption and for ex-port to other areas of the Caribbean (70). Only saltfor domestic consumption is fluoridated, by sprayingit with a potassium fluoride solution.
Jamaica’s Ministry of Health monitors the pro-gram. To that end, it carried out urine studies in fourgroups (age groups 2–6, 7–11, 12–17, and 18–70years old) prior to launching the fluoridation pro-gram and 20 months after. Urine samples were col-lected in two or three time periods with extrapolationto 24 hours (72). Fluoride excretion was expressed asrate of urinary excretion, using µg/24 hours, insteadof µg/h, as the unit of measure to compensate for thelack of uniformity in intake of fluoridated salt dur-ing the day (73). Values before salt fluoridationranged between 169 and 485 µg/24 hours; 20months later they had increased to 304 to 657 µg/24hours. In children from 2 to 6 years old, the high-riskage for enamel fluorosis, the values increased from
14.3 µg/h to 30.3 µg/h in those that drank waterwith a fluoride concentration under 0.25 mg/l, andthey increased from 20.2 µg/h to 29.4 µg/h amongchildren whose drinking water contained between0.31 and 0.50 mg/l. These values are equivalent tothose obtained in Swiss children who consume waterfluoridated at optimal levels (73).
As a part of the evaluation of the program’s effec-tiveness, an epidemiological oral health survey wascarried out in 1995, comparing values obtained atthat time with those from a 1984 survey (prior to im-plementation of the program). Age specific DMFTmeans observed in 1995 were 0.2 at age 7, 0.4 at age8, 1.1 at age 12, and 3.0 at age 15. Mean DMFTscores in children 6, 12, and 15 years of age weredramatically lower than the corresponding scores of1.7, 6.7, and 9.6 obtained at the baseline examina-tion in 1984 for children of the same age groups(baseline data for 7- and 8-year-olds were not col-lected). The mean percentage of sound permanentteeth for all age groups was 90% in 1995. The 1995oral health survey indicated a significant decline indental caries compared with findings in 1984. Themajor change in Jamaica during those years was theintroduction of salt fluoridation in 1987 (18).
MexicoAt the end of 1988 and beginning of 1989, the Stateof Mexico, one of 32 Mexican states, launched a pro-gram to fluoridate salt at a concentration of 250 mgof F per 1 kg. Carried out in coordination with Salesdel Istmo, a company that controls 90% of the saltmarket in the State of Mexico, the program hadachieved broad coverage by 1992. In 1995, morethan half of salt sold had fluoride concentrations be-tween 200 and 300 mg of F per kg. In 1993 and1994, most salt sold in the state had concentrationsbetween 100 and 199 mg of F per kg.
A study of salt consumption carried out in 1986among 430 families from four localities in the state(74) showed that consumption increased with age.In children 1–3 years old, average consumption was1.9 g/day; in those 4–6 years of age, it was 3.4 g/day; and in adults 23–50 years old, it was 6.9 g/dayfor men and 5.4 g/day for pregnant women. Fromthose average values, investigators estimated that
PROGRESS AND SUCCESS, 1980–2000
23

the daily fluoride intakes with salt fluoridated at250 mg of F, would be 0.5, 0.8, and 1.3 mg per dayin these three age groups. Note that there are twoareas in the State of Mexico—Zumpango and Ten-ango del Valle—where the concentration of naturalfluoride ranges from 0.7 to 1.5 mg per 1 l.
Two epidemiological surveys of school-age popu-lations 5–12 years old were conducted in 1987 andin 1996. Findings from those surveys are analyzed,along with data from the Costa Rican and Jamaicanexperiences, in the following section.
In 1991, Mexican national health authorities es-tablished a national caries prevention program basedon consumption of salt fluoridated at 250 mg per kg.Fluoridated salt was introduced gradually, reachinga total of 279,700 tons per year in 1999. Mexico hasgeographic areas with optimal concentrations of flu-oride in the drinking water; consequently, as in CostaRica, it was important to monitor the use of systemicfluoride compounds, design and distribute maps ofareas with natural fluoride in water, and distributenon-fluoridated salt in areas with natural fluoride.That monitoring indicated that no community withconcentrations of natural fluoride of at least 0.7 mgper liter should receive fluoridated salt.
In addition, 58 million schoolchildren in Mexicoreceived a broad range of caries prevention inter-ventions—from instruction on oral hygiene to fluo-ride rinses, topical applications of fluoride, andsealants. Regulations prohibited the prescription andsale of fluoride supplements to those children.
From 1987 to 1989, an epidemiological surveywas carried out involving representative samplesfrom ten states (Baja California Sur, Colima, Chia-pas, Guerrero, Morelos, Hidalgo, Tabasco, NuevoLeón, Yucatán, and the State of Mexico) and theFederal District. In 1996, a second national survey ofcaries and enamel fluorosis included samples fromchildren 6–10, 12, and 15 years of age from eachstate (61). Evaluation of epidemiological changes inthe states based on those two studies is still pending.
Effectiveness of the Programs in CostaRica, Jamaica, and MexicoSalt fluoridation programs in Costa Rica, Jamaica,and Mexico incorporated, within their plans for epi-demiological assessment, frequent monitoring of the
prevalence and severity of caries and fluorosis in in-dexed age groups, as has been indicated. The fre-quency of these studies varied according to theavailability of resources. Because of the programs’nationwide coverage (Costa Rica and Jamaica) orstatewide coverage (in the State of Mexico), annualsurveys could not be conducted, as they had been incommunity trials in Hungary and Colombia, norwere control groups available. As a result, the pro-grams should be evaluated by comparing before-and-after data, taking into account that any reduc-tion should be interpreted within the frame ofreference of trends in the epidemiology of the dis-ease, which can be an increase in disease prevalenceor a decrease in disease prevalence. It should be re-called that, due to the magnitude of its program,Costa Rica set up a sentinel site.
Epidemiological data on the average number ofdecayed, missing, and filled teeth (DMFT) in theprimary dentition in children 6–8 years of age in Ja-maica, the State of Mexico (Mexico), and Costa Ricaare shown in Table 3.5 and Figure 3.5, includingfour studies of children 7 years of age from CostaRica’s sentinel community. Table 3.5 shows that be-tween 1996 and 1999 the severity of caries in CostaRica dropped 35% (from 4.3 to 2.8), for an annual-ized reduction of 13.4%. In the State of Mexico, thereduction between 1987 and 1996 was 28%, for anannualized reduction of 3.6%. Unfortunately, nodata for primary dentition in 1984 are available,making it impossible to calculate the reduction per-centages. In comparing these values, it should betaken into account that, although the program inthe State of Mexico began in 1988 and 1989, effectswere poor until 1995, possibly explaining the lim-ited initial response to the program. In addition, theCosta Rican children exhibited a high degree of re-duction in a short period of time, but indirect infor-mation from the sentinel group indicates that theprevalence was quite high at the beginning.
Table 3.6 shows the average DMFT values in thethree countries evaluated (Costa Rica, Jamaica, andMexico). In Costa Rica, the reduction between 1988and 1992 was 42% (12.6% annualized); between1988 and 1999 it was 70% (10.4% annualized).These percentages are very significant, given thehigh prevalence of dental caries at the program’s be-ginning. (Note that the reduction percentages for
PROMOTING ORAL HEALTH
24
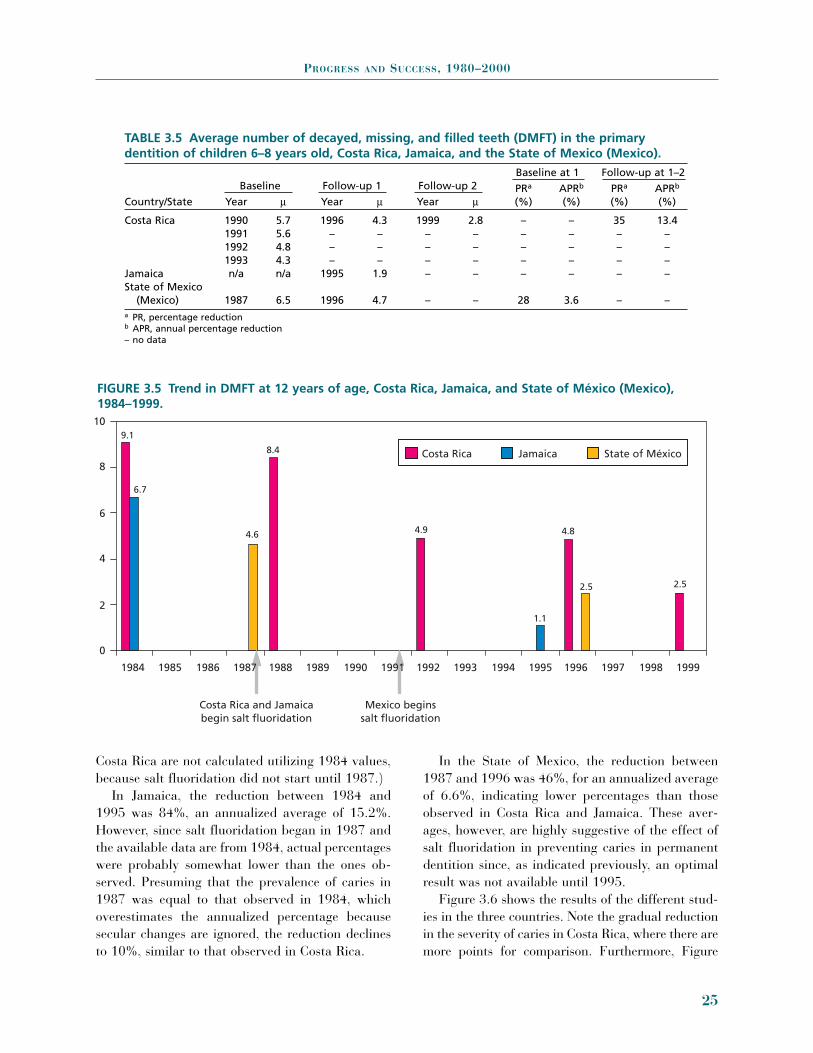
Costa Rica are not calculated utilizing 1984 values,because salt fluoridation did not start until 1987.)
In Jamaica, the reduction between 1984 and1995 was 84%, an annualized average of 15.2%.However, since salt fluoridation began in 1987 andthe available data are from 1984, actual percentageswere probably somewhat lower than the ones ob-served. Presuming that the prevalence of caries in1987 was equal to that observed in 1984, whichoverestimates the annualized percentage becausesecular changes are ignored, the reduction declinesto 10%, similar to that observed in Costa Rica.
In the State of Mexico, the reduction between1987 and 1996 was 46%, for an annualized averageof 6.6%, indicating lower percentages than thoseobserved in Costa Rica and Jamaica. These aver-ages, however, are highly suggestive of the effect ofsalt fluoridation in preventing caries in permanentdentition since, as indicated previously, an optimalresult was not available until 1995.
Figure 3.6 shows the results of the different stud-ies in the three countries. Note the gradual reductionin the severity of caries in Costa Rica, where there aremore points for comparison. Furthermore, Figure
PROGRESS AND SUCCESS, 1980–2000
25
TABLE 3.5 Average number of decayed, missing, and filled teeth (DMFT) in the primarydentition of children 6–8 years old, Costa Rica, Jamaica, and the State of Mexico (Mexico).
Baseline Follow-up 1 Follow-up 2Baseline at 1 Follow-up at 1–2
PRa APRb PRa APRb
Country/State Year m Year m Year m (%) (%) (%) (%)
Costa Rica 1990 5.7 1996 4.3 1999 2.8 – – 35 13.41991 5.6 – – – – – – – –1992 4.8 – – – – – – – –1993 4.3 – – – – – – – –
Jamaica n/a n/a 1995 1.9 – – – – – –State of Mexico
(Mexico) 1987 6.5 1996 4.7 – – 28 3.6 – –a PR, percentage reductionb APR, annual percentage reduction– no data
FIGURE 3.5 Trend in DMFT at 12 years of age, Costa Rica, Jamaica, and State of México (Mexico),1984–1999.
109.1
6.7
4.6
8.4
4.9
1.1
4.8
2.52.5
8
6
4
2
0
1984 1985 1986
Costa Rica Jamaica State of México
1987 1988 1989
Costa Rica and Jamaicabegin salt fluoridation
Mexico beginssalt fluoridation
1990 1991 1992 1993 1994 1995 1996 1997 1998 1999

3.7 includes data obtained at the sentinel site, todemonstrate that the use of sentinel sites is useful formonitoring preventive programs. In interpreting thediscrepancies observed between 1992 and 1996, apossible bias in selection at the beginning and theend of that period should be considered in La Unión,where only 60 children 12 years of age were exam-ined, because in the overall study, the group sampledcontained children from 7 to 12 years of age.
In comparing the effectiveness of salt fluoridationin preventing caries in the three countries, it shouldbe noted that the prevalence and severity of caries in
the initial studies were lower in the State of Mexicoand higher in Costa Rica. That means that if trendstoward reduction of prevalence and severity ob-served in Costa Rica continue, the same average val-ues observed in Jamaica should be reached in CostaRica.
In short, the experiences in Costa Rica and Ja-maica show the benefit of salt fluoridation in pre-venting caries. In the State of Mexico, additionalevaluations are needed to estimate the correct re-duction, because there were problems in producingthe fluoridated compound.
PROMOTING ORAL HEALTH
26
TABLE 3.6 Average number of decayed, missing, and filled teeth (DMFT) in the permanentdentition of children 12 years old, Costa Rica and Jamaica, and State of México (Mexico).
Baseline Follow-up 1 Follow-up 2Baseline at 1 Follow-up at 2
APR* PR** APR*Country Year Average Year Average Year Average Year % % %
Costa Rica 1984 9.1 1992 4.9 1999 2.5 1992a 12.6 70b 10.41988 8.4 1996 4.8
Jamaica 1984 6.7 1995 1.1 1984 15.2State of Mexico
(Mexico) 1987 4.6 1996 2.5 1996 6.6a 1988–1992b 1988–1999* APR, annual percentage reduction
** PR, percentage reduction
FIGURE 3.6 Trends in average DMFT in children 6–8 years in Costa Rica and the State of México (Mexico), and in children aged 7 years in La Unión, Costa Rica (sentinel site), 1987–1999.
6.5
5.7 5.6
4.8
4.3 4.34.7
2.8
Costa Rica La Unión, Costa Rica State of México, Mexico
1987 1988 1989
Costa Rica beginssalt fluoridation Mexico begins
salt fluoridation
1990 1992 1993 1994 1995 1996 1997 1998 1999
0
1
2
3
4
5
6
7
1991

ENAMEL FLUOROSIS
Enamel fluorosis is not a disease, as is caries.Rather, it is a disturbance in the mineralization ofthe dental enamel resulting from exposure to highfluoride levels in the late formative and matura-tional stages of tooth development. For most teeth,that development occurs during the first six years oflife, or the first eight years if one includes the secondpremolars and the second permanent molars. Forthe central incisors, the critical period is the first 18months of life (75).
In every preventive program that administerssystemic fluoride to children under 8 years old, anincrease in the prevalence and severity of enamelfluorosis should be expected. If the program restrictsconsumption of fluoride in salt and water to withinlevels recommended for the first 6 years of life (seethe chapter on “Epidemiological Surveillance), aprevalence of the mildest forms of fluorosis (10%–15%) is to be expected. For that reason, enamel flu-orosis is one of the conditions recommended for in-clusion in epidemiological surveillance programs inthe Region. It is important to note that the role offluoride supplements (pills, tablets, lozenges, drops)in public health has been limited (76).
Table 3.7 presents information on the prevalenceand severity of enamel fluorosis for selected countriesfor which information is available. Prevalence rangesfrom 2% in Honduras to 26% in Valparaiso and Viñadel Mar in Chile. Fluoride sources ingested during thefirst six years of life should be taken into account inevaluating data in the table. For example, in theUnited States and Chile (specifically, Valparaiso),high prevalence is possibly due not only to consump-tion of water fluoridated at optimal levels, but also toingestion of fluoridated toothpaste. The effect ofother fluoride sources on fluorosis prevalence can beinferred from the 9% prevalence reported in Santi-ago, where drinking water contained only negligiblequantities of fluoride at the time data in the tablewere reported. The high prevalence (24%) in the Ba-hamas, could be explained by the existence of wide-spread prevention programs using fluoridated sup-plements; those programs have ended, and theprevalence of enamel fluorosis can be expected to de-cline in successive cohorts. An analysis of the preva-lence and severity of enamel fluorosis in countriesthat launched salt fluoridation programs with finan-cial support from the W. K. Kellogg Foundation hasbeen presented and analyzed in PAHO’s final report tothe foundation (77).
PROGRESS AND SUCCESS, 1980–2000
27
FIGURE 3.7 Trend in DMFT of children 12 years old, Costa Rica, national data and data from La Unión,Costa Rica (sentinel site), 1984–1999.
Costa Rica La Unión
Beginning ofsalt fluoridation
10
8
6
4
2
01987198619851984 1988 1989 1990 1992 1993 1994 1995 1996 1997 1998 19991991
9.1
8.4
6.1
5.1 4.9
3.3
4.0
4.8
2.5

The high prevalence observed in Belize, Bolivia,Costa Rica, the Dominican Republic, and Paraguaycan be explained by the existence of communitiesthat consume water containing natural fluoride.Costa Rica’s, national salt fluoridation program per-mits the marketing of fluoridated salt only in com-munities where the fluoride concentration in wateris less than 0.3 mg/l (67). However, a recent studyin Costa Rica (78), identified additional communi-ties (not identified in the initial study in 1988) withnaturally occurring fluoride. It is to be expected thatthe prevalence and severity of fluorosis in thesecommunities are elevated. Costa Rican health au-thorities are evaluating the possibility of reducingnatural fluoride concentrations or including thesecommunities in areas where no fluoridated saltshould be sold.
Belize has areas with fluoride concentrationsabove 1.5 mg/l, where fluoridated salt from Mexicoand Jamaica is consumed; the combined consump-tion of fluoride from both sources is sufficient toproduce the higher levels of enamel fluorosis ob-served. The 7% of fluorosis observed in Nicaraguaprior to implementation of the salt fluoridation pro-gram can be explained by the existence of naturalfluoride in Managua’s drinking water (around 0.6
mg/l). Low concentrations of fluoride in Ecuador, ElSalvador, Honduras, and Nicaragua in cohorts notexposed to fluoridated salt from birth, can be ex-pected to increase as successive cohorts reach theage of examination (12 and 15 years).
References
1. Pan American Health Organization. Health in theAmericas. Washington, DC: PAHO; 1998. (ScientificPublication 569).
2. Estupiñán-Day S. Overview of salt fluoridation in the Region of the Americas. Part I: Strategies, cost-benefit analysis, and legal mechanisms utilized in theNational Programs of Salt Fluoridation. In GeertmanRM (ed.). Salt 2000, 8th World Salt Symposium. Am-sterdam: Elsevier Science; 2000.
3. Estupiñán-Day S. Improving oral health in LatinAmerica. Oral Care Report/Harvard 1999;9(3).
4. Estupiñán-Day S. The Success of Salt Fluoridation in the Region of the Americas after a Decade. 128thAnnual Meeting of APHA. Abstract 52080. Boston,Massachusetts, 2000.
5. Solórzano I, Beltrán E, Salas M, Chavarría S, Es-tupiñán S. Prevalence and trends of dental caries inCosta Rican school children from 1984 to 1999. Jour-nal of Dental Research 2001;90 (Special Issue):36.
PROMOTING ORAL HEALTH
28
TABLE 3.7 Distribution of the level of severity of enamel fluorosis among children 12 years ofage, applying Dean’s fluorosis index.
PrevalenceVery (very low
None Questionable low Low Moderate Serious or greater)Country No. (%) (%) (%) (%) (%) (%) (%)
Bahamas, 1999–2000 854 59.1 16.6 14.5 7.4 1.7 0.7 24.3Belize, 1999 323 66.3 10.8 14.8 5.3 1.2 1.5 22.8Bolivia, 1995 287 58.5 23.7 15.7 1.7 0 0 17.4Chile, 1994 125a 44.0 30.4 21.6 2.4 1.6 25.6
203b 80.8 9.3 7.3 1.5 0.5 9.3Colombia, 1998 PSc 66.8 14.5 17.5 1.1 18.7Costa Rica, 1999 PSc 74.1 9.1 10.6 3.8 2.0 0.4 16.8Ecuador, 1996 500 90.0 5.2 1.6 2.4 0.8 0 4.8El Salvador, 2000 524 93.1 2.86 1.84 2.24 4.1USA, 1987d PSc 42.6 36.0 16.2 4.4 0.4 0.4 21.4Honduras, 1997 307 92.1 5.6 1.3 0.0 0.7 0.3 2.3Nicaragua, 1997 365 82.7 9.9 4.9 1.9 0.6 0.0 7.4a Children 7 and 12 years of age in Valparaiso and Viña del Mar, with 1.0 ppm of F in the drinking water.b Children 7 and 12 years of age, in Santiago, with negligible concentration of F in drinking water.c Probalistic sampling.d Results obtained from a subsample of 12-year-old children that had lived in a single place throughout their lives, whose drinking
water had been adjusted to optimal fluoride levels (0.7–1.2 mg/l) and who were not reported to have consumed fluoride supple-ments in infancy [Beltrán and others. JADA 2001].

6. Irigoyen-Camacho ME. Caries dental en escolares delDistrito Federal. Salud Pública de México 1997;39:133–136.
7. Estupiñán-Day S. Oral Health Regional Strategies forthe Pan American Health Organization/World HealthOrganization for the 1990s. Washington, DC: WHO/PAHO; 1997.
8. Pan American Health Organization. XL DirectingCouncil. Washington, DC: PAHO; 1997. DocumentCD40/20.
9. Milner T, Estupiñán-Day S. Overview of salt fluori-dation in the Region of the Americas. Part II: The sta-tus of salt production, quality and marketing and thestate of technology development for salt fluoridation.In Geertman RM (ed). Salt 2000, 8th World SaltSymposium. Amsterdam: Elsevier Science; 2000.
10. Beltrán-Aguilar ED, Estupiñán-Day S. Analysis ofprevalence and trends of dental caries in the Ameri-cas between the 1970s and 1990s. International Den-tal Journal 1999;49:322–329.
11. Pan American Health Organization. Strategic andProgrammatic Orientations 1999–2002. Washington,DC: PAHO; 1999.
12. World Health Organization. Oral health surveys: Basicmethods. 4th ed. Geneva: WHO; 1997.
13. Olano O. Condición de la salud bucal en el Uruguay.Revista de la Asociación Odontológica Uruguaya1983;33(1):5–15.
14. McNulty JA, Fos PJ. The study of caries prevalence ina developing country. ASDC Journal of Dentistry forChildren 1989;56:129–136.
15. Leake JK, Otchere DF, Davey KW, Bedford WR,McIntyre DON. The dental health of 12-year-old chil-dren in Dominica: A report of a survey using WHOmethods. Journal of the Canadian Dental Association1990;56:1025–1028.
16. Salas-Pereira MT. Prevalencia de la caries dental enescolares de 12 años en Costa Rica. Fluoruración alDía 1991;1:11–14.
17. Salas MT, Solano S. La fluoruración de la sal enCosta Rica y su impacto en la caries dental. Identifi-cación de cantones prioritarios en salud oral. Fluoru-ración al Día 1994;4:13–19.
18. Estupiñán-Day SR, Baez R, Horowitz H, Warpeha R,Sutherland B, Thamer M. Salt fluoridation and den-tal caries in Jamaica. Community Dentistry and OralEpidemiology 2001;29:247–252.
19. Estupiñán S, Baez R, Sutherland B, Horowitz H,Warpeha R, Marthaler T. Impact of salt fluoridationin preventing caries in Jamaica. J Dent Res 1996;75.(IADR Abstract 997).
20. Burt BA. Trends in caries prevalence in North Amer-ican children. International Dental Journal 1994;44:403–413.
21. Kaste LM, Selwitz RH, Oldakowski RJ, Brunelle JA,Winn DM, Brown LJ. Coronal caries in the primary
and permanent dentition of children and adolescents1–17 years of age: United States, 1988-1991. Journalof Dental Research 1996;75 (Special Issue):631–641.
22. Smith AC, Lang WP. CPITN, DMFT, and treatmentrequirements in a Nicaraguan population. CommunityDentistry and Oral Epidemiology 1993;21: 190–193.
23. Alonge OK, Narendran S. Dental caries experienceamong school children in St. Vincent and theGrenadines. Report of the First National Oral HealthSurvey. Community Dental Health 1999;16:45–49.
24. Brazil. Health State Department. National Division ofPublic Health Dentistry. DMFT in Brazilians 12-years-old decreased 53.22%. J Bras Assoc Odont 1996; Nov–Dec:8b/c1-6.
25. Vignarajah S. Dental caries experience and enamelopacities in children residing in urban and rural areasof Antigua with different levels of natural fluoride indrinking water. Community Dental Health 1992;9:349–360.
26. Flanders RA. School dental health in Honduras. Jour-nal of Public Health Dentistry 1988;48:168–171.
27. Honduras. Ministerio de Salud Pública. Encuesta Na-cional de Salud Bucal en alumnos de las escuelas deeducación primaria. Tegucigalpa, Honduras, 1987.
28. Uruguay. Ministerio de Salud Pública. ComisiónHonoraria de Salud Bucal. Valoración de la saludbucal de la población escolar. Sector público. Monte-video, Uruguay, 1992.
29. Uruguay. Ministerio de Salud Pública. Encuesta deSalud Bucal en Escolares de 11 a 14 años. Sectorpúblico. Montevideo, Uruguay, 1999.
30. Moncada OA, Herazo BJ. Estudio Nacional de Salud.Morbilidad Oral. Bogotá, Colombia: Ministerio deSalud; c1981.
31. Colombia. Ministerio de Salud. Estudio Nacional deSalud Bucal. Serie Documentos Técnicos. Bogotá:Ministerio de Salud; 1999.
32. Brasil. Ministério da Saúde. Levantamento epidemi-ológico em saúde bucal: Brasil, zona urbana, 1986.Brasília: Centro de documentação do Ministério daSaúde; 1988.
33. Pinto VG. Epidemiologic Study of Caries Prevalencein School Children from 7 to 14 Years-Old, Brazil1993. Rio de Janeiro: SESI-DN; 1996.
34. United States Department of Health and Human Ser-vices. National Institute of Dental Research. OralHealth of United States Children. The National Sur-vey of Dental Caries in U.S. School Children: 1986–1987. Bethesda, MD: DHHS; 1989. (NIH PublicationNo. 89-2247).
35. Beltrán ED. Guyana Oral Health Survey of SchoolChildren. Health Volunteers Overseas. Washington,DC: Pan American Health Organization; 1996.
36. Adewakun AA. Oral health. Health Conditions in theCaribbean. Washington, DC: Pan American HealthOrganization; 1994. (Scientific Publication 561).
PROGRESS AND SUCCESS, 1980–2000
29

37. Aponte-Merced LA. Oral Health of 6, 12, and 15 yearold children. Population Sample of Grenada. HealthVolunteers Overseas/Dentists Overseas; 1991.
38. Pan American Health Organization, Regional OralHealth Program. Cayman Island; 1996.
39. Pan American Health Organization. Regional OralHealth Program. St. Kitts; 1998.
40. Pan American Health Organization, Regional OralHealth Program. Grenada; 2001.
41. Saint-Jean L. Oral Health Survey in Haiti; 2000.42. Bahamas. Ministry of Health of the Commonwealth
of the Bahamas. Oral Health Status of School Chil-dren in the Commonwealth of the Bahamas. Result ofa National Survey 1999-2000; Nassau: Ministry ofHealth; 2001.
43. Lourents NT, Wolters L, Winklaar R, Gerstenbluth,Alberts JF. Oral Health Survey Curaçao. Willemstad,Curaçao: Epidemiology and Research Unit, Medicaland Public Health Service of Curaçao; 2001.
44. Elias-Boneta A et al. Dental caries prevalence oftwelve year olds in Puerto Rico. Community DentalHealth 2003;20:171–176.
45. Pan American Health Organization, Regional OralHealth Program, Belize; 2000.
46. Bolivia. Ministerio de Salud, Organización Panameri-cana de la Salud. Estudio epidemiológico de saludbucal, Bolivia, 1995. La Paz: PROISS/Banco Mundial;1997.
47. Costa Rica. Ministerio de Salud, Instituto Costarri-cense de Investigación y Enseñanza en Nutrición ySalud. Encuesta Nacional de Nutrición. Caries den-tal. San José: Ministerio de Salud; 1996.
48. Costa Rica. Ministerio de Salud, Instituto Costarri-cense de Investigación y Enseñanza en Nutrición ySalud. Encuesta Nacional de Salud Oral, 1999. In-forme Técnico. Tres Ríos: INCIENSA; 2000.
49. Urbina T, Caro JC, Vicent M. Caries dentaria y fluo-rosis en niños de 6 a 8 y 12 años de la II, VI, VIII, IXy X Región Metropolitana, Chile 1996. Santiago:Ministerio de Salud, Universidad de Chile; 1996.
50. República Dominicana. Secretaría de Estado de SaludPública y Asistencia Social. Estudios de línea basal,caries dental y fluorosis. Informe resumido. SantoDomingo: Secretaría de Estado de Salud Pública yAsistencia Social; 1997.
51. Ecuador. Ministerio de Salud. Programa Nacional deFluoruración de la Sal de Consumo Humano. Estudiosde línea basal. Quito: Ministerio de Salud Pública; 1997.
52. El Salvador. Ministerio de Salud Pública y AsistenciaSocial. Estudio epidemiológico de caries y fluorosisdental en escolares de 6, 7-8, 12 y 15 años de centrosde enseñanza pública de El Salvador. San Salvador:Ministerio de Salud Pública y Asistencia Social; 2000.
53. Honduras. Ministerio de Salud Pública. Estudio epi-demiológico de salud bucal en escolares de escuelas
públicas, menores de 15 años. Tegucigalpa: Ministe-rio de Salud Pública; 1997.
54. Pan American Health Organization. Final Report tothe W.K. Kellogg Foundation. Project #43225. Multi-year Plan for Salt Fluoridation Programs in Region ofthe Americas (Belize, Bolivia, the Dominican Repub-lic, Honduras, Nicaragua, Panama, Paraguay, andVenezuela). Washington, DC, May 2000.
55. Perú. Ministerio de Salud. Estudio epidemiológico desalud bucal en el Perú (caries dental). Lima: Ministe-rio de Salud; 1990.
56. Venezuela. Ministerio de Sanidad y Asistencia Social.Fluoruración de la sal: un reto en salud bucal. Cara-cas: Ministerio de Sanidad y Asistencia Social; 1997.
57. Brazil. Health State Department. National Division ofPublic Health Dentistry. DMFT in Brazilians 12-years-old decreased 53.22%. J Bras Assoc Odont 1996; Nov–Dec:8b/c1-6.
58. International Conference on Primary Health Care.Alma-Ata. USSR, 6–12 September, 1978.
59. Kaste LM, Drury TF. Disparities in untreated coronaldecay among children and adolescents. Journal ofDental Research 1999;78 (Special Issue):366.
60. United States Department of Health and Human Ser-vices. Oral Health in America: A Report of the Sur-geon General. Rockville, MD: DHHS, National Insti-tute of Dental and Craniofacial Research, NationalInstitutes of Health; 2000.
61. Rabasa R, Irigoyen E. Encuesta Nacional de Caries yFluorosis Dental 1996-1997. Práctica Odontológica1997;12:15–17.
62. Pan American Health Organization. Oral Health Sta-tus of School Children in the Commonwealth of theBahamas: Result of a National Survey. Nassau; 2001.
63. Murray JJ. El uso correcto de fluoruros en saludpública. Ginebra: Organización Mundial de la Salud;1986.
64. Organización Panamericana de la Salud. EstrategiaRegional de Salud Bucodental para los Años Noventa.Washington, DC, mayo de 1994.
65. Pan American Health Organization. Oral Health Con-sultation Meeting. Opportunity and Strategy for Im-proving General Health in the Americas through Crit-ical Advancements in Oral Health. The Way Forward2005–2015. Washington, DC: PAHO; April 2005.
66. Herazo Acuña B, Salazar Oliveros L. Antecedentes deprogramas preventivos de salud oral en la Repúblicade Colombia. Rev Foc (144), Bogotá, Colombia; 1983.
67. Avendaño A. Control de zonas con flúor natural en elagua dentro de un programa de fluoruración de la sal.Fluoruración al Día 1995;5:25–28.
68. Salas MT, Solorzáno S. La fluoruración de la sal enCosta Rica y su impacto en la caries dental. Identifi-cación de cantones prioritarios en salud oral. Fluoru-ración al día 1994;4:13–419.
PROMOTING ORAL HEALTH
30

69. Costa Rica. Ministerio de Salud, Instituto Costarri-cense de Investigación y Enseñanza en Nutrición ySalud. Encuesta Nacional de Salud Oral, 1999. In-forme Técnico. Tres Ríos: INCIENSA, 2000.
70. Warpeha R. Salt Fluoridation in Jamaica. West In-dian Dental Journal 1994;8–l 1.
71. Warpeha RA. Dental caries and salt fluoridation. Ja-maican Pract 1985;5:6–8.
72. Warpeha RA, Marthaler TM. Urinary fluoride excre-tion in Jamaica in relation to fluoridated salt. CariesResearch 1995;19:35–41.
73. Marthaler TM, Steiner M, Menghini G, de Crousaz P.Urinary fluoride excretion in children with low fluo-ride intake or consuming fluoridated salt. Caries Re-search 1995;29:26–34.
74. Martínez-Salgado H, Tovar-Zamora E, Chávez-Villasana A, Armendáriz DM, Baz-Díaz-Lombardo G.
Consumo familiar e individual de sal de mesa en elEstado de México. Salud Pública de México 1993;35:630–636.
75. Horowitz HS. Decision-making for National Pro-grams of Community Fluoride Use. Community Den-tistry and Oral Epidemiology 2000;28:321–329.
76. Burt B. The case for eliminating the use of dietaryfluoride supplements for young children. J PublHealth Dent 1999;59:269–274.
77. Pan American Health Organization. Multi-Year Planfor Salt Fluoridation Programs in the Region of theAmericas. Project #43225. Washington, DC, 2000.
78. Salas MT, Beltrán E, Chavarría P, Solórzano I,Horowitz H. Enamel fluorosis in 12 and 15-year-oldschool children in Costa Rica. Journal of Dental Re-search 2001; 80 (Special Issue):47.
PROGRESS AND SUCCESS, 1980–2000
31

Where would we be without salt?James Beard, Master Chef

PLANNING, LAUNCHING,AND RUNNING A SALT
FLUORIDATION
PROGRAM


A ppropriate use of fluoride is the foundationof any strategy to prevent tooth decay, alsoknown as dental caries. Salt fluoridation is
a safe and effective method of preventing this dis-ease. Just as fluoride is essential to prevent dentalcaries, education about use of fluorides is essentialto ensure acceptance and continuation of a programof salt fluoridation.
Educating the public, policymakers, health careproviders, the mass media, and salt manufacturers iscritical to successfully implement and maintain saltfluoridation. All too often, educating these groups isgiven little or no attention. This chapter describesopportunities and responsibilities for providing edu-cation about salt fluoridation and discusses the rolesof various groups in such an effort.
The consequences of providing inadequate infor-mation about salt fluoridation, which are especiallydamaging to the poor and underserved (1), include:
• A public uninformed or misinformed aboutavailable measures of self-protection.
• Failure of individuals and society to benefitfrom scientifically valid health measures.
• Harm caused by underuse or inappropriate useof fluoride.
• Needless illness, such as dental caries, and asso-ciated social and financial costs for the public.
Thus, providing science-based health informationin an effective manner for use by individuals andcommunities is an essential ingredient for reducingmorbidity and mortality and improving the qualityof life. To that end, a few definitions are in order.
Health education is “any planned combination oflearning experiences designed to predispose, enable,and reinforce voluntary behavior conducive tohealth in individuals, groups, or communities” (2).Education is required at all stages of starting andcontinuing any health measure. Education about theneed to use caries-preventive agents such as fluori-dated salt is especially important. While tooth decayoften is considered inevitable, and is nearly ubiqui-tous among some groups, those affected by the dis-ease often do not know how it can be prevented.
Education suitable for all audiences is essential togain acceptance of a community-based interventionsuch as salt fluoridation. Thus, all educational ma-terials—whether printed, electronic, or verbal—must be tailored to the specific intended audience.For example, salt fluoridation educational materialsdesigned to train health care providers would not bethe same as those meant for the general public.
Health promotion is “any planned combination ofeducational, political, regulatory, and organizationalsupports for action and conditions of living con-ducive to the health of individuals, groups, or com-munities” (2). Such ‘supports’ change the environ-ment in ways that improve health, even in theabsence of an individual’s actions, or they enable in-
4. EDUCATING COMMUNITIESABOUT SALT FLUORIDATION1
35
1This chapter was written by Alice M. Horowitz, PhD, Na-tional Institute of Dental Research, National Institutes of Health,United States Department of Health and Human Services.

PROMOTING ORAL HEALTH
dividuals to take advantage of a preventive regimenlike fluoridated salt by removing barriers to its use.Making fluoridated salt available in communitieswhere the level of fluoride in drinking water is scantis one example of health promotion.
Health communication is the art and technique ofinforming, influencing, and motivating individuals,institutions, and communities about importanthealth issues. Health communication is a tool fordisease prevention, health promotion, health educa-tion, health care policy-making, and for providinghealth care (3). Health communication takes placethrough many channels, in homes, in schools, atwork, and in the street.
Health literacy is “the degree to which individualshave the capacity to obtain, process, and understandbasic health information and services needed tomake appropriate health decisions” (3). In the con-text of salt fluoridation, health literacy means un-derstanding about the role of fluoride in preventingor reducing dental caries.
Primary prevention refers to a procedure or courseof action that prevents the onset of disease (4). Ap-propriate use of fluoride by health care providers and individuals, and encouragement of its use incommunity-wide programs is a primary preventivemeasure. For example, the implementation of fluor-idated salt or community water fluoridation is a pri-mary preventive measure. In contrast, restoring orfilling a tooth is a secondary preventive measure be-cause it arrests or treats disease after it has alreadyoccurred.
WHY EDUCATE ABOUT SALTFLUORIDATION?
All too often, lack of understanding of a health pro-cedure creates confusion, fosters suspicion, and stim-ulates myths and untruths. Thus, when implementinga preventive procedure, especially a community-based procedure like salt fluoridation, education ofall groups involved in the adoption process is neces-sary. For example, misunderstanding about fluoridescan arise in communities where too much fluoride
naturally occurs in drinking water, causing fluorosis.People in such communities may not recognize thebenefits of using fluoride at lower doses. Another rea-son for salt fluoridation education is to counter mis-information spread by groups that oppose the use offluoride at any level, including at safe levels to pre-vent tooth decay. Although anti-fluoride groups havelargely focused on opposing community water fluori-dation programs and have not attacked the use offluoridated salt, such opposition should be plannedfor by educating individuals and communities aboutthe benefits of appropriate fluoride use.
WHO NEEDS TO BE EDUCATED ABOUTSALT FLUORIDATION?
Implementing and continuing the use of salt fluori-dation requires education of not just the public atlarge, but of health care providers, public health of-ficials, elected officials, salt manufacturers, salt plantoperators, and members of the mass media (5).
PRINCIPLES AND METHODS FOREDUCATING ABOUT FLUORIDATED SALT
Many skills are needed to spread knowledge aboutsalt fluoridation. These include seeking information,planning, organizing, informing, listening, demon-strating, leading, guiding, and providing reinforce-ment and feedback. These activities help individualsand communities understand the need for an effec-tive preventive measure against dental caries. Often,people in low-income groups feel helpless and be-lieve that they cannot control events in their lives.But such individuals should be persuaded that den-tal caries is one disease they can control. Knowledgeabout the disease and what is available to fight itprovides the understanding necessary for them totake appropriate action.
Principles Applicable to Salt FluoridationEducation Include:
• Education must be an integral part of any leg-islation, regulation, or service.
• Education is needed to reinforce understand-ing and gain acceptance for the procedure.
36

• The content of education must be accurate andbased on the most recent scientific evidence.
• Educational materials such as leaflets, films,DVDs, and slides about salt fluoridation areaids to understanding. Educational materialsalone are not a preventive regimen.
• Educational materials must be designed forspecific ethnic, cultural, and age groups. Theyshould be field-tested prior to final development.
• Educational materials are most effective whenthey focus attention on one topic (such as saltfluoridation), provide reinforcement on thesubject, or foster discussion in group sessions.
• Educational materials should only use plainlanguage to facilitate understanding among usergroups (6–10).
Using Plain LanguageWhen communicating about salt fluoridation, youmust use plain language in printed materials, bill-boards, fact sheets, in television or radio announce-ments, in group sessions and in one-on-one commu-nication. Avoid dental jargon. For example, ratherthan ‘dental caries,’ use the terms ‘tooth decay’ or‘cavities.’ State information in short, simple sen-tences and paragraphs, and use the active voice. Thisapproach may be difficult for health care providers,including dental care providers, to grasp and applybecause of their academic or technical training. Butwhen educating the public about any medical ordental procedure, we must communicate in plain,clear language to achieve understanding of all groups(6–10). Using medical and dental terms unfamiliarto our audiences stifles the educational process andmay hinder implementation of the preventive inter-vention we are trying to introduce.
Methods Applicable to Educating aboutSalt FluoridationMultidimensional approaches to health promotionhave been shown to be much more effective thanusing a single approach. Well-planned educationalprograms for communities usually use more thanone of the following broad approaches:
• One-on-one or interpersonal communicationwhen discussing the need for salt fluoridation
with community policymakers and salt manu-facturers.
• Group presentations and discussion about flu-orides for training health care professionalsabout salt fluoridation. Group presentationsmight also include town hall meetings or visitswith parent groups, or training mothers toteach other parents about salt fluoridation.
• Community organization, such as establishinga committee to provide guidance for the saltfluoridation program or a committee to obtainepidemiologic data for program managersabout the need for caries prevention before saltfluoridation is initiated.
• Mass communication, tapping newspapers, tele-vision, posters, kiosks, websites and radio toinform the public about the need for salt fluor-idation or to reinforce knowledge and under-standing about the effectiveness of a given reg-imen (5, 7).
WHAT TO TEACH ABOUT FLUORIDES
Everyone needs to know what fluoride is and how it prevents dental caries, as well as about variousmethods of fluoride application and appropriatecombinations of toothpastes, oral rinses, or watersupplements containing fluorides and their relativeeffectiveness. Box 4.1 briefly explains what needs tobe taught about fluorides. It is equally important toteach that too much fluoride can and should beavoided. Table 4.1 provides a list of fluoride agentsthat can be used safely in combination with fluori-dated salt, by age group.
WHAT TO TEACH ABOUT SALTFLUORIDATION
Box 4.2 provides information that should be taughtabout salt fluoridation. Everyone needs to knowwhat salt fluoridation is and how it works, as well as the benefits of using it. Also, everyone needs toknow that we must practice good oral hygiene, re-duce the frequency and number of sweets, and go toa dentist periodically. Using fluoridated salt does notmean that other important dental health proceduresshould be abandoned.
EDUCATING COMMUNITIES ABOUT SALT FLUORIDATION
37

WHO SHOULD PROVIDE EDUCATIONABOUT SALT FLUORIDATION?
Health care professionals, including but not limitedto dentists, physicians, nurses, pharmacists, andhealth educators should be the primary teachers of
other health care providers and of the public. This isbecause, due to their health-related training, theseprofessionals are believable and are respected in theircommunity. But, just because they have their respec-tive degrees does not mean that they are knowledge-able about fluoride or salt fluoridation. Thus, health
PROMOTING ORAL HEALTH
38
BOX 4.1 What Everyone Needs to Know About Fluorides
• Fluoride is a natural element found in the earth land mass and, in varying amounts, in all water.• Appropriate and continuous use of fluoride is the best method of preventing tooth decay throughout
life.• Fluoride can be used by children, adults, and the elderly.• Fluoride protects teeth from decay in two ways:
1. During tooth formation, fluoride is incorporated into the tooth structure, making it more resistantto decay (referred to as systemic fluoride).
2. After tooth eruption, fluoride remineralizes areas of the tooth that have been demineralized (referredto as topical fluoride).
• Fluorides are available in a variety of products.
BOX 4.2 What Everyone Needs to Know about Fluoridated Salt
• The use of fluoridated salt to prevent tooth decay is well-documented by scientific research.• Fluoridated salt is an equitable public health procedure that benefits all people, regardless of age,
socioeconomic status, or access to dental care.• Fluoridated salt is safe, effective, and used in many countries around the world.• Fluoridated salt provides both topical and systemic fluoride benefits.• The process of adding fluoride to salt is similar to that of adding iodide to salt.• The use of fluoridated salt saves teeth and cuts dental bills.
TABLE 4.1 Topical fluoride regimens that can be used in combinationwith fluoridated salt.Agent Ages Recommendation
Fluoride toothpaste 2–6 years Use only a pea-size amount. Do not swallow
6 years and older No restrictions.
Fluoride mouthrinse 6 years and older No restrictions.
Professionally applied fluoride Based on individual needs either annually or semi-annual applications.
Caution: Fluoridated salt should not be used in combination with community water fluoridation ordietary fluoride supplements.

care professionals need to acquire accurate informa-tion to ensure that they are imparting science-basedinformation and that their messages are as consistentas possible.
In addition, trained health care providers can ed-ucate other professionals outside the sector who, inturn, can help educate the broader public. For ex-ample, mothers can be taught to educate other par-ents about fluorides. We need these education ‘ex-tenders’ to help inform the entire population. ‘Eachone teach one’ is an approach many communitiesuse to share health information. These communityhealth educators may be especially useful in ruralareas. Consequently, they must be well-informedand receive periodic educational reinforcement.
The Role of Health Professionals inEducating about the Need for andBenefits of Fluoridated SaltHealth professionals have multiple roles in educatinga community about salt fluoridation. First and fore-most, they must be well-informed. The public expectshealth professionals to be experts in health matters,and to advocate for preventive procedures on thebasis of well-documented evidence. In addition,health professionals are expected to provide accurateinformation in a variety of settings, to average citi-zens as well as to community leaders. Dental profes-sionals may take a leading role in implementing andsustaining salt fluoridation, or they may choose to as-sist others involved in the process. They may be con-sultants or primary educators of community mem-bers. Their role includes helping to overcome barriersto implementing preventive procedures, such asworking with salt manufacturers and processors toensure fluoridated salt is available in the market-place. Our role as health care providers is to be proac-tive and to support preventive procedures.
Health professionals also need to be well-versedabout salt fluoridation because they may work withthe mass media in different capacities. For example,health professionals may be interviewed on radio ortelevision or for a newspaper, or may be asked towrite an editorial for a local newspaper. Cultivatingrelationships with news media representatives is animportant strategy for health communication.
THE NEED FOR CONTINUOUSEDUCATION ABOUT SALTFLUORIDATION
Education about a preventive health regimen is nota one-shot effort, but must be continuous. The rea-son is simple: each new generation needs to learnimportant health information. Just as new parentsmust be taught about the need for early childhoodvaccinations, those novice parents also need to learnabout the appropriate use of fluorides. Also, all of usbenefit from having education reinforced periodi-cally, especially on health matters, particularly asnew or updated information becomes available.
PLANNING AND STRATEGYDEVELOPMENT
A plan is a detailed scheme to implement strategiesto accomplish specific objectives. In this case, wewant to increase understanding about the need forfluoridated salt, make that salt available, and ensurethat it is used appropriately. A small group repre-senting all potential partners in the process, includ-ing representatives from the community, should draftthe plan. People with formal training in communica-tions should be involved in this planning process;these expert communicators can be found in educa-tional institutions, private industry, and in the massmedia. Once the plan is drafted to the planninggroup’s satisfaction, it should be shared with thelarger group of partners (5–7). A written plan ofaction that includes a timeline will help everyoneunderstand:
• Specific objectives and long-term goals of im-plementing salt fluoridation.
• Roles and responsibilities of each group orindividual.
• Partners needed in the process.• Strategies needed to reach each audience.• Specific channels of communication (print ma-
terials, radio, TV, Web sites, posters, etc.) andcontent for each target audience.
• Specific materials to be developed and howthey will be distributed.
EDUCATING COMMUNITIES ABOUT SALT FLUORIDATION
39

• Specific messages for each audience.• Meeting sites for the organizers and other spe-
cific audiences.• Available resources.• Barriers and constraints. • Priorities.• Evaluation process.
A written plan of action helps everyone involvedin the project stay on track to achieve objectives.The plan also can be used to inform others aboutwhat is being done and to enlist new partners. Sucha plan also can be used to help get resources to covercosts for some of the promotional materials.
SUMMARY
Education is essential for promoting optimal fluo-ride use by health care providers and the public.The educational role of health care providers, espe-cially dentists, may be quite diverse. First, healthcare providers need to be well-informed and mayneed special training on salt fluoridation. They needto be advocates for salt fluoridation, and they mustbe able to communicate at the appropriate level forindividuals or groups. These trained health care pro-viders will teach other health professionals aboutfluoridated salt and they may educate members ofthe public. Finally, they may be called on to discussthe topic with legislators or members of the media.Like any other preventive health regimen, imple-menting salt fluoridation in a community or nationrequires education every step along the way. A writ-
ten plan of action is necessary to achieve the collec-tive objectives.
References
1. Institute of Medicine. Health literacy: A prescriptionto end confusion. Washington, DC: National Acade-mies Press, 2004.
2. Green LW, Kreuter MW. Health Program Planning.McGraw Hill. New York 2005.
3. U. S. Department of Health and Human Services.Healthy People 2010. 2nd ed. With Understandingand Improving Health and Objectives for ImprovingHealth. 2 vols. Washington, DC: U.S. GovernmentPrinting Office, November 2000.
4. Allukian M. Jr. Horowitz AM. Effective communityprevention programs for oral diseases. In. Jong’sCommunity Dental Health Eds. Gluck GM Mor-ganstein WM. 237-276. 5th ed. St. Louis 2003.
5. Horowitz AM, Frazier PJ. Promoting the use of fluo-rides in a community. In: Newbrun E. Ed. 3rd edi-tion. Fluorides and Dental caries. Charles C. ThomasPub. Springfield, IL 1986.
6. Nelson DE, Brownson RC, Remington PL, ParvantaC. Communicating Public Health Information Effec-tively. American Public Health Association, Washing-ton, DC, 2002.
7. U.S. Department of Health & Human Services. Mak-ing Health Communication Programs Work. NIHPublication No. 02-5145. Bethesda, MD 2002.
8. Maibach E, Parrott RL. Designing health messages.Thousand Oaks, CA: Sage Publications, 1995.
9. Doak CC, Doak LG, Root JH. Teaching patients withlow literacy skills. 2nd ed. Philadelphia, PA: J.B. Lip-pincott Company, 1996.
10. http://www.plainlanguage.gov/populartopics/health_literacy/index.php
PROMOTING ORAL HEALTH
40

INTRODUCTION
The population of the countries of the Region of theAmericas reaches nearly 800 million persons. The na-tions of North, South, and Central America, and theCaribbean encompass the full spectrum of social andeconomic development and infrastructure. Countriessuch as the United States of America and Canada areamong the world’s most developed, and their popula-tions enjoy high levels of wellness and good healthcare. The opposite is true of countries such as Haiti,Bolivia, and Nicaragua, where extreme poverty is re-flected in the state of health care and services theirpopulations receive. This is especially true in regardsto oral health and oral health services. For most coun-tries of the Region, scant resources make it nearly im-possible to tackle the high incidence of caries.
The discovery of fluoride as a preventive agentfor caries, and the subsequent development of waterfluoridation (first used in Grand Rapids, Michigan,in 1945) led to the hope of widespread implementa-tion of water fluoridation. However, in underdevel-oped countries where water supply and distributionsystems are generally decentralized and inadequate,water fluoridation proved impractical. Although theuse of iodized salt enjoyed widespread acceptance,the seemingly obvious anticaries solution—to usesalt as a carrier for fluoride as it was already beingused for iodide—was not put into effect until 1955,
when Switzerland became the first country to im-plement salt fluoridation.
The use of fluoridated salt in Switzerland and offluoridated water in the United States and other de-veloped countries, as well as fluoridation’s success indecreasing caries prevalence rates, led to a landmarkstudy conducted in 1967 by PAHO, the National In-stitute of Dental and Craniofacial Research, and theUniversity of Antioquia in Medellin, Colombia.2 Thatstudy established that the use of fluoridated saltcould have the same anti-caries effect as fluoridatedwater. As a fluoride vehicle, salt was shown to be asreliable and convenient as water.
This was an important discovery, because effortsto promote water fluoridation in the Americas oftenhad failed. Notable water fluoridation efforts in theRegion include the following:
• Guatemala City began fluoridating most of itswater supply in 1983. However, there were pe-riods over the years when the system did notfunction for a variety of reasons, including fi-nancial inability to purchase fluoride. The city’s
5. SALT PRODUCTION AND
TECHNOLOGY DEVELOPMENT FOR
SALT FLUORIDATION1
41
1This chapter was written by Trevor Milner, Salt FortificationConsultant, Pan American Health Organization.2Study conducted by University of Antioquia, in Medellin Co-lombia and sponsored by PAHO, NICDR and W.K. KelloggFoundation during 1963–1972.

water fluoridation program has since beenabandoned.
• Jamaica tried to implement water fluoridationin Kingston in the 1970s. Although fluorida-tion equipment was purchased, the system wasnever implemented due to operational costs.
• Beginning in 1975, Panama’s Canal Zone hadfluoridated water, as did parts of Panama City.Since 2000, budgetary constraints have madeit increasingly difficult to operate the waterfluoridation system.
• Chile’s municipal centers have had water fluor-idation since the 1980s. The system in Chileoperates well, and about 65 % of the country’spopulation is covered.
• Some of Argentina’s main cities, such as BuenosAires and Rosario, have fluoridated water. Butthe system is confined to urban areas and oper-ates inconsistently.
• In Brazil, São Paulo distributes fluoridatedwater to about 65% of its 7 million inhabitants.
The overall failure to establish water fluoridationin Latin America and the Caribbean was mainly dueto the absence of large, centralized water supply sys-tems and problems due to lack of funds for in-stalling and operating fluoridating systems. Even incountries that were able to install and operate waterfluoridation systems, coverage did not exceed 65%of the population.
The realization that water fluoridation was notfeasible for many countries, and the success of theMedellin study, set the stage for the all-out promo-tion of salt fluoridation in the Region. The objectivewas to deliver appropriate fluoride levels to the pop-ulation in order to diminish the rate of dental cariesin a cost-effective fashion.
In response, PAHO embarked on a program to en-courage suitable countries to implement salt fluorida-tion in the early 1980s. In 1985, Jamaica became thefirst country in the Americas to implement salt fluor-idation on a nationwide scale. Costa Rica quickly fol-lowed, as did several other countries. It was clear thatenlisting the cooperation of the Region’s salt industrywould be critical for the success of any salt fluorida-tion efforts. To that end, PAHO set out to gather asmuch information about the characteristics of the saltindustry in the Americas. Existing programs of salt
iodization that had already proven successful in thebattle against iodine deficiency diseases became thefirst building block for the development of a success-ful salt fluoridation strategy in the Region.
• Eighteen countries in the Region have saltfluoridation programs at various stages of de-velopment.
• Five countries (Colombia, Costa Rica, Ja-maica, Mexico, and Uruguay) have fully sus-tainable programs.
• Eleven countries—Belize, Bolivia, Cuba, theDominican Republic, Ecuador, Honduras,Nicaragua, Panama, Paraguay, Peru, andVenezuela— are in an advanced stage of imple-menting salt fluoridation programs.
• Three countries (El Salvador, Guatemala, andthe Bahamas) are beginning to implement pro-grams; Guyana and Grenada are projected toembark on salt fluoridation efforts soon.
• Almost 200 million people in the Region areexposed to sustained, appropriate intake offluoride via salt. Ultimately, an additional 125million people will have an appropriate fluo-ride intake using salt.
This success has been in no small measure due tothe cooperation and assistance from the hundreds ofthe Region’s salt producers. This chapter presents anoverview of the production, quality, and marketingof salt in the Americas, especially as it relates tofluoridated salt.
GLOBAL AND REGIONAL SALTPRODUCTION
Total worldwide production of salt—including bysolar evaporation of seawater or inland brines, min-ing underground and surface rock salt deposits, andgathered as brines, mainly by solution mining—was225 million tons in 2002.3 Table 5.1 shows theworld’s top 15 salt producers. Table 5.2 shows saltproduction by continent, demonstrating that the Re-gion of the Americas is a major contributor to the
PROMOTING ORAL HEALTH
42
3United States Geological Survey, Mineral Commodity Sum-maries, January 2003.

world’s salt production. The Region as a whole ac-counted for 36.2 %, or 81.4 million metric tons, ofworld production. Four of the world’s top ten saltproducers (the United States, Canada, Mexico, andBrazil, in descending order) are in the Americas.Total salt production in the 17 Latin American andCaribbean countries that will be examined in thischapter amounts to 10.2 million tons per year, rep-resenting 13% of salt produced in the Americas and5% of salt produced worldwide.
Salt Production MethodsCrude salt production methods include surface min-ing, underground mining, solution mining, and solar
evaporation of seawater. Worldwide, most produc-tion is done by solar evaporation (see Table 5.3). InLatin America and the Caribbean, the vast majorityof salt production is by solar evaporation of sea-water; the second most-used method is solutionmining of underground salt deposits. Vast resourcesof salt (easily accessible by surface mining) in Bo-livia, Chile, northern Argentina, and southern Brazilare barely exploited.
Surface mining involves the collection of salt de-posits at or just below the earth’s surface. In somecases, small-scale producers simply dig up blocks ofsalt, or use forks or spades to collect rock salt. Large-scale surface mining relies on heavy equipment suchas diggers and front-end loaders that scrape the saltinto heaps and then load it on trucks or railcars fortransport.
Solution mining requires the use of hot waterpumped deep underground to dissolve salt deposits.The resulting salt solution, or brine, is then broughtto the surface and the salt extracted from the solu-tion by evaporation. Sometimes the brine is useddirectly in other chemical or industrial processes,bypassing the salt extraction stage. Used extensivelyin Mexico and parts of the United States, solutionmining is a highly industrial process requiring largecapital expenditures in plant and equipment. En-ergy requirements also are high to heat the water for
SALT PRODUCTION AND TECHNOLOGY DEVELOPMENT FOR SALT FLUORIDATION
43
TABLE 5.1 Top 15 salt producers, worldwide, 2002.Salt production,
including salt in brine Percent ofRank Country (in 1,000 metric tons) world production
1 United States of America 43,900 19.52 China 35,000 15.63 Germany 15,700 7.04 India 14,800 6.65 Canada 13,000 5.86 Australia 10,000 4.47 Mexico 8,700 3.98 France 7,100 3.29 Brazil 7,000 3.1
10 United Kingdom 5,800 2.611 Poland 4,300 1.912 Italy 3,600 1.613 Spain 3,200 1.414 Russia 3,000 1.315 Ukraine 2,400 1.1
All Others 48,000 21.3Total 225,000 100
Source: United States Geological Survey, Mineral Commodity Summaries, January 2003.
TABLE 5.2 Global salt production, by continent,2004.
Production PercentContinent (in 1,000 metric tons) of total
Europe 87,100 38.7North America 68,200 30.3Asia 45,200 20.1Central and
South America 13,200 5.9Oceania 7,200 3.2Africa 4,100 1.8
Total 225,000 100
Source: Data from the Salt Institute (www.saltinstitute.org)

salt dissolution and then to evaporate the water forsalt precipitation.
Underground mining, once used extensively inLatin America, has now been outstripped by otherproduction methods. It involves digging out saltfrom large underground deposits.
Sea salt production uses the natural process ofevaporation. Seawater (with about a 3% concentra-tion of salt) is captured in a series of ponds and, fromexposure to wind and sun, evaporates in stages,yielding a saturated solution of about 33% salt con-centration. The salt is then precipitated in specialponds (called crystallizers) and then reaped by largemachines. The salt may then be washed or sent toprocessing plants for refining or hydro-washing. Theworld’s largest solar salt plant is at Los Cabos, inBaja California, Mexico. Other large solar salt plantsare located near Merida, in Mexico’s Yucatan Penin-sula; near Barcelona, Venezuela; on the island ofBonaire in the Netherlands Antilles; and in Inagua inthe Bahamas. The process can also be used by smallproducers that rely on manual or minimally mecha-nized processing.
All the crude salt production processes describedabove can be found in the Region. The choice of one over another depends on a number of factors,including:
• The availability of the salt raw material—whether it lies in surface deposits, under-ground salt deposits, underground brine de-posits, or the sea.
• The history of salt production in the country orregion; the degree of sophistication and devel-opment of salt producers; and producers’ ac-cess to capital, equipment, and technology.
• The country’s overall economic developmentlevel and its level of industrialization.
Large-scale producers using sophisticated tech-nology and equipment are found in Mexico,Venezuela, Chile, Brazil, and Argentina. They relyon various methods, from solar evaporation to sur-face mining. Smaller-scale producers using lowerlevel technology and relying on more manual tech-niques can be found in Central America and theCaribbean, with one or two exceptions such as theBahamas and Bonaire.
Salt ProcessingSalt used for direct or indirect consumption by hu-mans or animals accounts for only about 7% of totalsalt production. Most salt is used as a raw materialin the manufacture of other chemicals or products.Large quantities of crude or rock salt also are usedfor highway de-icing in the United States, Canada,and European countries. Salt used in foods or as acondiment in the home normally undergoes someform of processing, which may involve washing orpurification of the salt, drying, and reduction in thesize of salt granules, as well as the addition of dehu-midifiers or free-flow agents and other additivessuch as iodide and fluoride. Processing plants or fac-tories of varying sizes and sophistication are there-fore used to carry out these processes before salt in-tended for human or animal food is distributed towholesalers, retailers, and individual consumers.
There are many salt processors in the Region ofthe Americas, ranging in size from those processingmore than 500,000 tons per year (Bahamas, Bonairein the Netherlands Antilles, Brazil, Colombia, Chile,Mexico, and Venezuela) to medium-scale producersthat yield 250,000 tons per year, to small-scale pro-ducers that yield 2–5 tons per year. Small-scale pro-ducers tend to be found in Central America, SouthAmerica’s Pacific Coast, and the Caribbean, where
PROMOTING ORAL HEALTH
44
TABLE 5.3 Salt production worldwide, by production method, 2004.World production
Salt type (in metric tons/year) Percent of total
Solar evaporation of seawater or inland brines (solar salt) 83,000,000 36.9
Rock salt (surface and underground) 67,000,000 29.8Solution mining (brines) 75,000,000 33.3
Total 225,000,000 100
Source: Salt Institute (www.saltinstitute.org)

the tradition of salt making is centuries old. Table5.4 shows the distribution of producers by produc-tion type and of processors by size for the 17 coun-tries that are the focus of this chapter. Although theBahamas and Bonaire (Netherlands Antilles) arelarge-scale salt producers, almost all of their pro-duction is exported and is not locally processed.
Three different methods are mainly used to processsalt—salt refining, salt hydromilling (or hydrorefin-ing), and the mill-package process.
Salt refining produces salt of a regular particlesize and the highest purity, typically 99.8% sodiumchloride, 0.005% insolubles, 0.10% chemical impu-rities, and 0.002% moisture. Capital and energy in-tensive, the process is normally used to extract saltfrom brine produced in solution mining. Salt refin-ing is also used to process salt produced by othermethods, such as solar evaporation and surface orunderground mining.
In salt refining, salt is first dissolved, and the re-sulting brine solution purified by filtration and theaddition of chemical flocculants. The purified brineis then heated and evaporated in a series of ma-
chines known as multi-effect evaporators. The satu-rated brine solution is then crystallized, and the re-sulting salt is dewatered and dried. At the point ofdrying, various chemicals may be added, such aspotassium ferrocyanide (an anticaking agent other-wise known as YPS) or sodium aluminum silicate(an antihumidifying agent). At this time, iodide inthe form of potassium iodide or potassium iodateand fluoride in the form of potassium or sodium flu-oride may also be added. Figure 5.1 demonstratesthe process. Large manufacturers of salt from un-derground solution mining, such as Sales del Istmoin Coatzacoalcos, Mexico (see Figure 5.2) use thisprocess. This process also is used in Colombia, theDominican Republic, and Venezuela.
The hydrorefining process (also known as the hy-dromilling process or mill wash-and-dry process),also produces good quality salt. (See Figure 5.3.)However, the salt is less pure than that produced bythe refining process.
First, crude salt is milled and simultaneouslywashed with clean saturated brine solution. This re-moves most dirt and other insoluble particles. Milling
SALT PRODUCTION AND TECHNOLOGY DEVELOPMENT FOR SALT FLUORIDATION
45
TABLE 5.4 Salt production and processing in countries with a program of salt fluoridation, 2000.
Production by typeSalt consumption
Number of Total
(in 1,000 tons/year)(in 1,000 tons/year)
salt processors by sizecrude salt Large- Medium- Small-
Population production Direct scale scale scale(in (in 1,000 Solution Solar human Fluoridated (� 100K (100–20K (� 20K
Country millions) tons/year) mining evaporation Total consumption salt tons/year) tons/year) tons/year)
Bahamas 0.3 1,000 1,000Bolivia 8.9 50 0 0 45 30 2 0 0 42Bonaire 0.2 750 750(Netherlands
Antilles)Colombia 44.2 1,400 600 700 500 140 70 3 5 50Costa Rica 4.2 20 0 20 18 13 10 0 2 0Cuba 11.3 100 100 4 0Dominican 8.7 50 0 32 53 30 0 0 0 80RepublicEcuador 13.0 75 0 75 75 44 36 1 2 10Guatemala 12.3 60 0 60 58 40 0 0 0 150Honduras 6.9 42 0 42 50 21 0 0 0 250Jamaica 2.6 2 0 2 16 12 12 0 1 0Mexico 103.5 8,700 800 7,900 1,600 350 250 3 6 10Nicaragua 4.5 52 0 52 52 16 0 0 0 300Panama 3.1 18 0 18 30 11 0 0 1 55Peru 27.2 180 0 180 100 87 40 1 2 50Uruguay 3.4 0 0 0 40 11 9 0 3 2Venezuela 25.6 805 0 805 615 85 60 2 2 10
Total 279.9 13,304 1,200 11,736 3,252 888 487 10 28 1,009
Source: Pan American Health Organization.

also reduces the size of the salt particles (solar rocksalt consisting of 1–2 inch particles is typically used asraw material). After the initial washing, the salt fallscountercurrent to brine through an elutriation col-umn. This reduces levels of chemical impurities suchas magnesium, calcium, carbonates, and sulfates.
The washed salt is then dewatered, usually in acentrifuge, although some refineries use simple sys-tems such as draining in piles or in tumble screens.Next the salt (now at 8% to 10% moisture) is driedin a dryer. Just prior to drying, potassium ferro-cyanide is added. Iodide and fluoride also may beadded at this point.
Before being packaged, the dried salt is screenedto separate it into different size fractions. Coarse saltis normally bulk packaged for both food and non-food industrial use. Medium-grain salt is usually in-tended as table grade salt (a dehumidifying agentsuch as sodium aluminosilicate may be added priorto packaging). Finer-grain salt is used in food pro-
cessing to make brine solutions for canning and bythe baking industry.
Hydrorefining or some variant of it is used by thevast majority of salt processors in the Region, espe-
PROMOTING ORAL HEALTH
46
FIGURE 5.1 Salt evaporation refining process.
FIGURE 5.2 “Sales del Istmo” evaporative saltrefinery, Coatzacoalcos, Veracruz, Mexico.
Brine Solution
SaltWashing
Water
Brine
PackagingSaltdrying
FilitrationCentrifuge
Iodide &fluorideaddition
Evaporation
SaltCrude saltdissolution
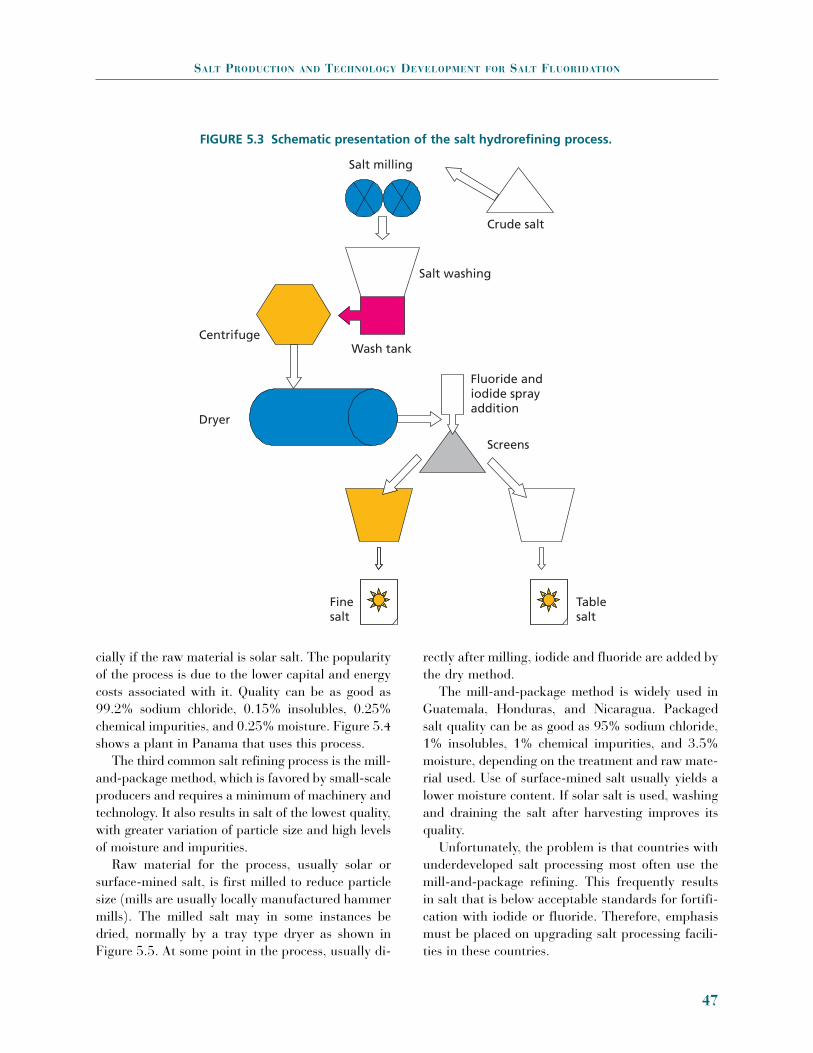
cially if the raw material is solar salt. The popularityof the process is due to the lower capital and energycosts associated with it. Quality can be as good as99.2% sodium chloride, 0.15% insolubles, 0.25%chemical impurities, and 0.25% moisture. Figure 5.4shows a plant in Panama that uses this process.
The third common salt refining process is the mill-and-package method, which is favored by small-scaleproducers and requires a minimum of machinery andtechnology. It also results in salt of the lowest quality,with greater variation of particle size and high levelsof moisture and impurities.
Raw material for the process, usually solar orsurface-mined salt, is first milled to reduce particlesize (mills are usually locally manufactured hammermills). The milled salt may in some instances bedried, normally by a tray type dryer as shown inFigure 5.5. At some point in the process, usually di-
rectly after milling, iodide and fluoride are added bythe dry method.
The mill-and-package method is widely used inGuatemala, Honduras, and Nicaragua. Packagedsalt quality can be as good as 95% sodium chloride,1% insolubles, 1% chemical impurities, and 3.5%moisture, depending on the treatment and raw mate-rial used. Use of surface-mined salt usually yields alower moisture content. If solar salt is used, washingand draining the salt after harvesting improves itsquality.
Unfortunately, the problem is that countries withunderdeveloped salt processing most often use themill-and-package refining. This frequently resultsin salt that is below acceptable standards for fortifi-cation with iodide or fluoride. Therefore, emphasismust be placed on upgrading salt processing facili-ties in these countries.
SALT PRODUCTION AND TECHNOLOGY DEVELOPMENT FOR SALT FLUORIDATION
47
FIGURE 5.3 Schematic presentation of the salt hydrorefining process.
Salt milling
Crude salt
Salt washing
Wash tank
Finesalt
Tablesalt
Screens
Fluoride andiodide sprayaddition
Centrifuge
Dryer

PRODUCTION OF FLUORIDATED SALT
When a fluoride compound is added to salt, it is ex-pected that it will be done in such a way as to reacha consistent level of fluoride ion in the salt and to doso in a cost-effective, efficient, and convenient man-ner without affecting the taste, appearance, flowa-bility, or shelf life of the packaged salt. To this end,the nature of the fluoride chemical and the proper-ties of the fluoride ion at the desired concentrationmust be considered, as well as the method of addi-tion and other operational aspects of the fluorida-tion process.
The addition of fluoride to salt is accomplishedby the wet method or the dry method, both of whichare used throughout the Region. The wet method isusually used for medium- to large-scale continuousdosing. The dry method is usually used in small-
scale to medium-size batch operations. Bear in mindthat the processing and fortification of salt with io-dide and fluoride is an industrial process. The pro-cedures, safeguards, and quality standards requiredfor a modern industrial process need to be built inand adhered to in order to ensure the successful andconsistent manufacture of fluoridated salt. Regard-less of the process used to fluoridate salt, the follow-ing systems and facilities are required:
• A secure facility for storing fluoride chemicals.• A system for the measurement and control of
the amount (weight) of fluoride for a givenweight of salt.
• A system for measuring and controlling theamount of salt.
• A system to ensure dispersion of the fluoridecompound throughout the salt and homogene-ity of the salt-fluoride mixture.
• A quality control system that includes bothdata collection and process monitoring as wellas equipment to analyze and record the con-centration of fluoride in the salt.
The processes themselves are simple. For the drymethod, a fluoride chemical is added to salt in theproportion required and then mixed thoroughly. Forthe wet method, the fluoride chemical is dissolved inwater and sprayed on a known quantity of salt inthe proportion required; thorough mixing results influoridated salt. For each method the standard pro-cedures to make fluoridated salt are:
1. Calculate the required amount of fluoridechemical that, when added to a unit weight ofsalt, will result in a fluoride ion concentrationof 200 to 250 ppm.
2. Measure this quantity of fluoride chemical.3. Add to a unit quantity of salt, dispersing the
fluoride as much as possible4. Mix well.
Fluoridation Chemicals The chemicals used in the fluoridation of salt andtheir relevant properties are shown in Table 5.5.
Either of two chemicals are added to salt to pro-duce fluoridated salt—sodium fluoride (NaF) in the
PROMOTING ORAL HEALTH
48
FIGURE 5.4. Dryer at a hydrorefining salt plantin Panama.
FIGURE 5.5 Schematic presentation of the drymethod of salt fluoridation.
Salt F
Fluoridated salt
DRY MIXER

dry method or potassium fluoride (KF) in the wetmethod. There is also a hydrated form of potassiumfluoride (KF2H2O).
The Dry MethodIn the dry method, weighed amounts of sodium flu-oride are added to a known batch weight of salt. Asfluoridation and iodization of salt are usually doneat the same time using the same equipment, pre-mixes are usually made. (See Figures 5.6–5.7.) Pre-mixes consist of sodium fluoride, potassium iodate,calcium carbonate, and refined undosified salt. Thepremix formula is calculated so that the target con-centration of fluoride and iodide is achieved whenthe premix weight is added to the batch. Premixesare often made by mixing the sodium fluoride andsalt with an existing, commercially available premixcalled “yodo-cal.” Yodocal is a mixture of eightparts-by-weight calcium carbonate and one partpotassium iodate. The target concentrations are nor-mally 225 ppm fluoride and 60 ppm iodide.
The premix addition is done in a salt mixer. Mix-ers vary from rotary paddle and rotary ribbon ma-chines to rotating mixers and mixing cones, and areusually made of stainless steel. Mixer capacities rangefrom 500 kg to 10 ton. A paddle mixer of 1–5 ton ca-pacity, complete with motor, may be built in-house orat a local workshop for US$ 3,000–US$ 8,000.
The Wet MethodThe wet method of fluoride addition uses a solutionof potassium fluoride (potassium fluoride is re-quired because of its high solubility relative tosodium fluoride). Solution concentrations can rangefrom 10% to 55%, that is, saturated, or may even be
SALT PRODUCTION AND TECHNOLOGY DEVELOPMENT FOR SALT FLUORIDATION
49
TABLE 5.5 Chemicals used in the fluoridation of salt, their formulas,and relevant properties.
PotassiumSodium Potassium fluoridefluoride fluoride anhydrous
Formula NaF KF2H20 KFMolecular weight 42.0 94.13 58.13Solubility (gm/100ml) 4.1 100 55Price (U$/kg) 2.5–5.0 2–10 1–8gm required per ton of salt 581 778 1,238Cost added per ton of salt 2.76 7.63 9.91
Figure 5.6 Dry methodequipment: 500 lb capacitypaddle mixer used for drymixing of salt and fluorideand iodide additives.
Figure 5.7 Dry method equipment: 2 toncapacity rotary mixer used for dry mixingof salt and fluoride and iodide additives.

a slurry in a saturated solution. The solution, orslurry, is sprayed continuously at a controlled ratematched to a continuous flow of salt. The salt thenpasses through a mixer to ensure homogeneity. Mix-ers are of the continuous type—normally ribbon orscrew stainless steel devices. (See Figures 5.8–5.10.)
Choosing between the Wet andDry MethodsThe choice between the wet or dry method of salt fluori-dation depends on a number of factors, among them:
Scale and type of salt processing operation. Fora small-stage or batch operation (under 10 tons perday), the dry method is preferable. For continuousprocessing operations, even those as small as 5 tonsper day, the wet method is better.
Cost of equipment and chemicals. Equipment forthe dry method usually costs less than equipmentfor the wet method. Sodium fluoride, the chemicalof choice for the dry method, costs less than potas-sium fluoride, the chemical used for the wet method.
Quality. Applying the wet method to a contin-uous processing offers better control of the fluorideconcentration.
Obviously, availability of equipment and suitablytrained personnel, existing plant layout and place-ment of new equipment, and overall ease of opera-tions also should be considered.
PROMOTING ORAL HEALTH
50
FIGURE 5.8 Wet method of salt fluoridation.
F
Mixer/conveyor
Salt process
Meter pumpMix tank
H2O
FIGURE 5.9 Wet method equipment: dosingsolution mixer and “egg” type pump drivenby compressed air.

Quality Control Issues with Both MethodsThe dry method is best suited to salt particles below16 mesh size or 0.046 inches in diameter. Withcoarser salt, (greater than 16 mesh size) the fluoridepowder tends to separate from the salt crystals. Overtime, the fluoride sinks to the bottom of the saltpackages, with the result that consumers receive un-even fluoride doses as they use up the package. (“Salgruesa,” for example, which is greater than 16 meshsize, should therefore not be treated with the drymethod.
With the wet method, salt particles become coatedwith a layer of fluoride solution. On drying, the saltremains covered by a thin powder layer of fluoride.The wet method, applied to a continuous process,normally offers greater control of fluoride concentra-tion. However, problems occur when a mixture ofsalt particle sizes is sprayed with fluoride solution toa target concentration, and then separated into dif-ferent particle sizes for packaging. This is a normaloccurrence in the salt hydrorefining process. Unfor-tunately, the separated salt particles will have differ-ent fluoride concentrations according to their size.For a target fluoride concentration of 200 ppm, ac-tual values can range from 500 ppm for fine grainsalt to only 100 ppm for the coarsest salt.
There are two reasons for this variation in fluo-ride concentration. Some of the fluoride chemical isshaken off of salt particles, during the process of size
separation, and that loose fluoride powder remainswith the finer salt particles. Also, fine salt is coatedwith a relatively greater amount of fluoride solutionin the first place. This is because small diameter saltparticles have a proportionally greater surface areathan large diameter particles, and so, proportionally,more solution is deposited on the finer salt.
Therefore, it is important that a salt fluoridationsystem be closely tailored to the kind of salt plant inwhich it will be used, taking into account such fac-tors as the salt process method, whether batch orcontinuous process is used, the plant’s productionrate, the types of salt produced and how the salt is tobe packaged, and the types of salt to be fluoridated.
MARKETING OF SALT
The marketing of salt throughout the Region ischanging. As is the case with many other products,the salt market was once highly protected in eachcountry. Now, with reduction of trade barriers, in-traregional trade in salt is increasing. Large, efficientprocessors are beginning to export their product,while processors that lag in quality and efficiency areincreasingly concerned that imports will reduce theirsales.
Production and consumption of salt for humanconsumption among the countries included in Table5.4, increased from 888,000 tons in 2000 to about1 million tons in 2004, more or less in line with pop-ulation growth. Increased trade among these coun-tries has increased more rapidly, however, doublingfrom 70,000 tons of salt for human consumption, or8%, in 2000 to 150,000 tons, or 15%, in 2005.
National Salt Flows and BalanceIn order to track the marketing of salt between coun-tries of the Region, PAHO has developed a way of dis-playing the data to show the salt flows and balancesin a particular country. From a public health per-spective, this information is useful for determining thelikely quantity of salt that could be imported fromnon-fluoridated areas or, conversely, the quantity offluoridated salt that may be exported to countries thatdo not yet produce fluoridated salt locally. This kindof movement contributes to what is known as the
SALT PRODUCTION AND TECHNOLOGY DEVELOPMENT FOR SALT FLUORIDATION
51
FIGURE 5.10 Wet method equipment: fluoride/iodide dosing mixture trickles downon salt in large capacity ribbon mixer.

“halo” effect—the beneficial effects of fluoridation ina country that does not fluoridate salt locally.
From a marketing perspective the information isuseful to see the level of competitiveness of the salttrade in general. If there are many sources of salt en-tering a country, there is good reason to believe thatthe market there is highly competitive and that the
local price of salt will reflect this competitiveness.Table 5.6 shows the salt flow for Venezuela.
Internal Marketing of SaltMechanisms for marketing salt within countries aremore or less the same Regionwide (see Figure 5.11).
PROMOTING ORAL HEALTH
52
BOX 5.1 Venezuela’s Successful Salt Industry
Venezuela’s salt industry, which includes large and small processors, deserves a special look because ofits efficiency and consistently high product quality.
The country has 14 salt processors. These facilities take crude salt, process it and package it, andthen send it on to distributors. Large processors are Sal Bahia and Tecnosal, with capacities of240,000 and 150,000 ton per year, respectively. Tecnosal has been in private hands for the last fiveyears. The main medium and small processors are ALESCA, MOLISOCA and INDULSALCA, withcapacities of 35,000, 18,000, and 24,000 ton per year, respectively. The two large producer-processorsproduce 250,000 tons per year, or 75.8% of total production of processed salt. The four mediumprocessors account for 60,000 tons, or 18.2%, and the eight small and micro processors account for20,000 tons, or 6.1% of the total.
The industry as a whole is considered to be mature and consolidated. As such, it is very difficult fornewcomers to successfully produce and market new salt brands. Compared to most of the Region’scountries, Venezuela has relatively few salt processors and only three crude salt producers. Mostprocessors purchase crude salt from the source that offers the best price and the highest quality. Thecountry overproduces crude salt, which results in a buyers’ market and ensures competition and effi-ciency of operations among crude salt producers.
The processing operations are for the most part mechanized. Most processors use the hydrorefiningprocess; INDULSALCA relies on the evaporative process and Sal Bahia uses both.
The quality of the finished salt product is consistently high. Chemical quality is on a par with simi-lar products internationally and the packaging and presentation is very good. Sal Bahia’s excellentcanister salt product will soon be exported to the United States.
Since the Venezuelan salt market is highly competitive and the consumer relatively sophisticated,the secret of this industry’s success has been management’s recognition of the need to be efficient andto maintain high quality standards. The competitiveness of their product with regards to packaging,presentation, and price is constantly being emphasized.
Smaller processors continually strive to improve operations, adapting methods used by large pro-ducers. They modify existing equipment, and design and manufacture machinery at lower cost to fittheir needs. For example:
• Design and manufacture inhouse of propane-fired rotary salt dryers: the dryer is inexpensive toconstruct, requires less energy to operate, and is virtually maintenance-free. Its cost is U$15,000,compared to a factory-made dryer of equal capacity, which would run U$100,000. Even thoughthe locally manufactured dryer will last one-quarter of the time that the factory-made one will, itis more cost effective.
• Design and inhouse manufacture of milling systems. These are ingenuous and strike the engi-neering compromises best suited for the particular producer.
• Substitution of expensive centrifugal dewatering system by simple, inexpensive, and effectivescrew-and-drain pad dewaterer.
Venezuela’s salt industry can serve as a model for many of the Region’s smaller producers. PAHOhas been encouraging other countries’ processors to learn from the Venezuelan example.

Even the Dominican Republic has changed its sys-tem in which a state-owned company (DISAL) usedto purchase all crude salt produced and then distrib-ute it to processors. This created an unnecessarymiddleman that added no value, reduced efficiency,and increased cost. Many processors in the Domini-can Republic circumvented that system by importingcrude salt directly from other countries. As of 2001,the system is now almost completely liberalized, withlocal processors acquiring inexpensive crude saltfrom the Bahamas, Venezuela, and Mexico.
The relative amounts of salt that go through eachchannel vary from country to country. Countrieswith a less developed salt industry will have moreprocessing operations associated directly with crudesalt producers. The processors would also developtheir own network for distributing salt directly tosmall shops in a particular locality. In countries withlarge and competitive internal markets, each level ofdistribution is normally independent from the others.
Salt PricesSalt prices vary widely throughout the Region. Asmay be expected, such variation is coming underpressure from liberalized trade and more open mar-kets. In this changing environment, the more efficientproducers, processors, and distributors will have anadvantage. There is, however, a limit to the extentthat they will dominate the industry, since a largecomponent of the price of salt is the cost of trans-portation. Local salt producers close to the marketwill always have an edge over large producers. PAHOrecognizes this, and will work closely with theseprocessors to improve their quality and efficiency.
SALT PRODUCTION AND TECHNOLOGY DEVELOPMENT FOR SALT FLUORIDATION
53
TABLE 5.6 Salt flows and balance, Venezuela,1999.
QuantityType/place (tons/years)
Crude, Bonaire 30,000Imports Processed, Colombia 5,000Production Solar salt 705,000Imports + Production 740,000
Consumption Direct human 85,000Food 145,000
Industrial 385,000Exports Crude 70,000
Processed 55,000Consumption plus exports 740,000
Source: Pan American Health Organization.
FIGURE 5.11 Within-country salt distributionchannels.
Crude salt Wholesalers/animal feed
Small shopsWholesalersSupermarkets
Processors
Consumers
TABLE 5.7 Salt prices in US$/ton, selected countries in theAmericas, 2000.
Crude Salt Refined/ packagedCountry (freight on board [FOB]) (marketplace)
Bolivia 8.00 180–120Dominican Republica 93.00 1,790–850Honduras 45.00 210–417Nicaragua 50.00 550–150Panamaa 83.00 630–550Venezuela 12.00 350–100a Prices have dropped rapidly since increased trade liberalization was put in place.Source: Pan American Health Organization.

The Region of the Americas produces a consider-able proportion of the world’s salt, and the countrieshave good production and processing tradition andpractices. Currently, the Region’s salt industry is un-dergoing major changes as a result of trade liberal-ization. This change will bring improvement as wellas disruption. In the end, the industry should bemore vibrant, with surviving producers offering bet-ter quality salt to customers, and with improve-ments in both iodization and fluoridation. PAHOwill continue to assist salt producers acquire infor-mation about salt processing, iodization, and fluori-dation because of that technology’s direct benefit toimproved health.
Bibliography
Pan American Health Organization. Basic Indicators1998. Washington, DC: PAHO; 1998.
Organización Mundial de la Salud. Indicadores para eval-uar los trastornos por carencia de yodo y control me-diante la yodación de la sal. Ginebra:OMS; 1994 .
Milner T, Estupiñán S. The Venezuelan Salt Industry.Washington, DC:1998.
Organización Panamericana de la Salud. Primera Reuniónde Expertos Sobre Fluoruración y Yodación de la sal deConsumo Humano. Antigua, Guatemala: OPS;1986.
Pan American Health Organization. Salt Fluoridation.Washington, DC: PAHO;1985.
PROMOTING ORAL HEALTH
54

Now that many salt fluoridation programs havebeen implemented, an understanding hasemerged of a successful program’s five major
components: salt fluoridation cost-benefit analysis;country baseline studies to assess DMFT and expo-sure to fluoride; epidemiological surveillance systemsfor salt fluoridation, including biological and chemi-cal monitoring of all fluorides, and quality control;salt-industry assessments; and evaluation and track-ing systems to determine the effectiveness of nation-wide fluoridation programs. PAHO has proposed thefollowing three phases for implementing salt fluori-dation programs (1).
• Phase I—Feasibility and Program Imple-mentation. To determine whether a nationalfluoridation program may be appropriate in agiven country, several preliminary studies mustbe conducted, including cost-benefit studiesand prevalence baseline investigations of den-tal caries and fluorosis. Such studies can justifyfluoride interventions, rather than other, lesseffective, interventions. Also, given economicconstraints and market-oriented economies,conducting a cost-benefit analysis is one of thebest ways to justify the implementation of pre-ventive interventions such as salt fluoridation.
• Phase II—First Evaluation. Following base-line-data collection, PAHO recommends that thefirst evaluation of a salt fluoridation program
should be done seven years after its implemen-tation. After this time, early erupting teeth ex-posed to salt fluoridation throughout their de-velopment can be assessed for reduced cariesand the prevalence of fluorosis. Long-term re-sults, ascertained after 14 years, will subse-quently measure the maximal caries-preventiveeffects and dental fluorosis in both early andlater erupting teeth. Further biological monitor-ing (of caries and fluorosis) may be conductedafter additional seven-year intervals.
• Phase III—Long-term Evaluation and Con-solidation. Countries with salt fluoridationprograms that have achieved DMFT scores at12 years of age (DMFT-12) of 3 or less, havereached the consolidation stage. Nonetheless,continued monitoring and evaluation areneeded to provide information on programprogress, effectiveness, and sustainability, allof which are important to generate continuedsupport for the program.
Certain assessments must be undertaken beforebeginning these phases. First, it must be clearlyrecognized—based on existing, immediately avail-able information—whether or not there is a soundreason to reject the proposal to fluoridate salt. Sec-ond, it is important to gauge the political will of gov-ernment and health authorities for undertaking saltfluoridation programs, for without that political will
6. STRATEGIC PLANNING
FOR THE IMPLEMENTATION OF
SALT FLUORIDATION PROGRAMS
55
it will be difficult to mobilize resources. Experiencehas shown, however, that if objectives are clear,goals well-defined, and actions properly articulated,the political will for salt fluoridation and its accept-ance by oral health care providers will follow. Oncethese considerations are taken into account, morein-depth studies may be justified, implying morecosts, whose recovery will depend on the effectiverealization of the project (2).
PHASE I: FEASIBILITY AND PROGRAMIMPLEMENTATION
In the first phase, all data and information necessaryto demonstrate the viability of a national salt fluori-dation program should be developed for inclusion inthe investment proposal that will be submitted tohealth planning and financing authorities. The pro-posal must identify technical and institutional prob-lems to be resolved and the methodology to be appliedfor implementing salt fluoridation. This phase also en-tails conducting baseline studies that will provide afoundation for the scientific evidence required by theprogram. Baseline studies provide information on thedisease that the program intends to address—in thiscase, caries—so that the ultimate effectiveness of pre-ventive programs can be evaluated. The feasibilitystudy also should consider economic and social fac-tors, since they relate to the community’s payment forand benefit derived from the program, and it shouldaddress aspects of implementation and operation.
Institutional Analysis and Cost-benefitStudy of A Salt fluoridation ProgramThis study provides information on the feasibility ofdeveloping a salt fluoridation program in a country.To that end, such a study would collect existing in-formation on dental caries, dental fluorosis, the scopeof dental public health programs and available re-sources and facilities, general information on the saltindustry, iodine programs, what institutions can as-sist in developing a salt fluoridation program, andwhether a legal framework exists that would permitinclusion of fluoride or would facilitate developmentof specific standards for regulating quality and re-quirements for fluoride in salt for human consump-
tion. The study also estimates expected costs andbenefits of implementing salt fluoridation. A cost-benefit ratio would be obtained by assessing the eco-nomic resources that would no longer need to bespent on dental treatments after implementing saltfluoridation, in terms of dental caries prevalence,caries incidence, cost of dental services, program cov-erage, facilities available and other pertinent factors.
We will use the case of Bolivia to illustrate a cost-benefit study for salt fluoridation. Analysis of theeconomic feasibility of the program for fluoridatingall salt destined for human consumption in thatcountry used available data and estimated projec-tions. Variables considered in that study could beapplied to work to be done in other countries.
Conducting an economic evaluation of the use offluoridated salt to prevent caries and other relatedoral disorders is an important step in determining thefeasibility of implementing this intervention. Theproposed methodology analyzes the expected costsand benefits of the intervention. The costs of the pro-gram are estimated in terms of what would be re-quired to develop a system to manufacture and dis-tribute fluoridated salt. The benefits are estimated interms of reduced use of curative services due to thelower incidence of caries in a given period as a resultof the salt fluoridation preventive program.
Bolivia’s total population in 1994 was estimated at7.2 million. The potential coverage with fluoridatedsalt was national, and annual salt consumption perinhabitant was approximately 3.65 kg (10g per dayper person). The program to fluoridate salt for do-mestic consumption represents a modest investmentof economic resources. Direct and indirect expenses(supplies and materials, equipment and machinery,technology, human resources) are relatively low, anddo not require a large investment on the part of saltplants. In Costa Rica, for example, which has had asalt fluoridation program since 1987, the cost to pro-duce the 15,000 tons of salt needed annually is ap-proximately US$ 1.57 per ton or US$ 0.0016 per kg.This cost includes such categories as equipmentmaintenance and purchase of supplies.
The hypothesis proposed for this analysis is thatthe expected cost of salt fluoridation in Boliviawould be less than the benefit derived from reduceddemand for public and private restorative services
PROMOTING ORAL HEALTH
56

within a given time period and in a specific popula-tion. In other words, it is proposed that the use offluoridated salt will achieve a significant savings ofresources that would otherwise have to be investedin restorative services.
Costs of Producing Fluoridated SaltThe costs of producing fluoridated salt include theexpected costs of implementing the program in Bo-livia. These costs are presented in U.S. dollars, inorder to control for the effect of inflation. Table 6.1presents a calculation using the values for producingfluoridated salt by the dry method that were used inCosta Rica and the criteria issued by technicians inthe salt industry. (For more detailed information onthe dry method, please see Chapter 5, “Salt Produc-tion and Technology Development for Salt Fluorida-tion.”) To arrive at the values in the table, the fol-lowing factors were considered:
a) Installation of machinery and equipment in a selected salt plant is estimated to cost US$ 5,000 for the year of initiation (year 0).
b) Beginning with the first year of operation, anannual cost of US$ 2,000 is calculated for main-taining equipment and machinery, US$ 36,000for personnel expenses (workers), and US$25,000for training. These are operating costs of the 42plants participating in the program; currently,these costs are covered mainly by the salt plants
themselves (that is, they do not require fresh oradditional investment).
c) An annual expense of US$ 19,600 is calculatedfor purchase of potassium fluoride, in a quan-tity sufficient to produce 35 tons of fluoridatedsalt per year. This quantity is estimated bytaking into account the total demand for salt,in accordance with Bolivia’s population sizeand the estimated daily consumption of salt byits inhabitants.
The expected total cost of producing fluoridatedsalt in Bolivia has been calculated as US$ 784,900for the five years of the program, plus the year inwhich the program is launched. Of this amount, thecosts of technological renewal at the plant level andthe cost of fluoride (approximately $220,000) areconsidered to be recoverable. The cost of the ma-chinery also is recoverable, because the financingmechanism could be similar to one already used inBolivia’s salt industry (CREDISAL)—through loanswith generous repayment terms (soft loans) to theplants for amortization over a period of three years.
In an analysis by the Bolivian salt industry, it wasestablished that the investment in machinery couldeven return a profit of approximately US$ 30,000after the first five years of the program. As for fluo-ride costs, they are recoverable through a minimalincrease in the price of salt. The investment from thepublic sector—to cover the costs of administration,
STRATEGIC PLANNING FOR THE IMPLEMENTATION OF SALT FLUORIDATION PROGRAMS
57
TABLE 6.1 Costs and benefits associated with caries prevention during a salt fluoridation program thatlasts five years.
PROGRAM YEAR
0 1 2 3 4 5
Discount ratea 0.893 0.797 0.712 0.636 0.567
Total CostsFluoridation cost (in thousands of US$)b 265.6 109.8 99.5 96.7 118.9 94.4
Total BenefitsNumber of decayed teeth prevented (in millions)c 0 1.75 1.92 2.12 2.33 2.53Saving in treatment (in millions of US$)d 0 5.25 5.76 6.36 6.99 7.69Net saving (in millions US$)e 0 4.88e 5.66 6.26 6.87 6.75Present value of the discounted saving (in millions of US$) 0 4.36 4.51 4.53 4.37 3.83a This is calculated at the end of the year, at 12% annually.b This includes front-end and operating costs.c An initial preventive impact on 25% of the total population is assumed, from the second year of the program, with an annual additional re-
duction of 10% in the incidence of caries.d A value of US$ 3 is assumed per decayed tooth avoided. e It takes into account the cost of years 0 and 1.

monitoring, evaluation, and social marketing of theprogram—is approximately US$ 346,500 for thefirst six years of the program.
ResultsThis study’s objective is to examine the economicfeasibility of establishing a program for fluoridatingsalt for domestic use as a way to prevent caries inthe short term. The methodology used has been toanalyze the costs and expected benefits of the inter-vention over five years. From estimates obtained itfollows that, to implement the program, the totalcost to produce fluoridated salt to cover Bolivia’s en-tire population during the five years of executionwould be approximately US$ 785,000.
On the other hand, the benefit expected in the tar-get population (which for purposes of the calculationis taken as 25% of the total population) would be theprevention of somewhat more than 10 million de-cayed teeth in the five years of the program. Thisrepresents a savings in the expenditure of curativedental health care of some US$ 32 million (estimat-ing a cost of US$ 3 per dental visit of low complex-ity to a public sector clinic).
From the analysis, it can be concluded that thecost-benefit ratio would be 1:40. That is, for everyUS$ 1 invested in the program the country couldpotentially save US$ 40 by preventing a significantnumber of caries in the population. If the cost perconsultation is estimated at US$ 10, the cost-benefitratio would be 1:134. And if the cost of a dental visitis US$ 20, as occurs in private sector clinics, thecost-benefit ratio would increase to 1:268.
This analysis demonstrates a high return on in-vestment for salt fluoridation. Due to variations ac-cording in social stratum and area of residency ofpopulation subgroups—especially in a heterogeneoussociety such as Bolivia’s—the benefit is also going tohave a differentiated effect. This means that a pre-vention program such as the one described will ben-efit to a greater degree those groups most affected bycaries, namely, those at lower socioeconomic levels.In that respect, such a program embodies principlesof equity and social justice, making it even more ac-ceptable from a political standpoint.
With regard to the program’s sustainability, theevaluation carried out indicates that the initial andoperating costs are moderate. In Bolivia, the initial
costs of the program could be discounted, by virtueof the fact that the mechanism for potential financ-ing to provide salt plants with machinery and neces-sary technical capability, using the CREDISALmodel, would permit those costs to be recovered inthe short term and plants would even turn a profit ofapproximately US$ 30,000 at the end of six years.Furthermore, the plants’ operating costs (personnel,inputs, maintenance) would be recoverable througha small rise in the price of salt.
If financial sustainability is understood as the ca-pacity of the health system to generate and allocatesufficient resources to carry out planned activitiesand to maintain an acceptable level of coverage, it ishighly likely that a salt fluoridation program canbecome self-sustaining in the short term. The neces-sary resources for its development and maintenanceare reasonable. Thus, the aggregate cost is minimal,and the private sector is favorably disposed to pro-vide technical and financing support.
This analysis is supported by favorable experi-ences with salt iodization programs, for which pro-duction costs have proved easily recoverable.
Thus, a program of salt fluoridation for domesticuse constitutes a highly desirable intervention tocontrol and reduce dental caries. The investmentnecessary to develop and maintain the program ismoderate, and the benefits are significantly high, ashas been demonstrated in several countries through-out the Region.
The cost-benefit study will review existing legisla-tion related to the production and marketing of saltand to the addition of nutrients (such as in iodiza-tion) and, if necessary, will propose updating existinglegislation. Points to be considered in updating orpreparing salt fluoridation standards or legislationinclude:
• Specifications of fluoride content per kg of salt.This should be specified as a range rather thana set number. Sufficient flexibility has to bebuilt in, as there is a possibilty that the rangemay have to be changed.
• Fluoride type to be utilized (potassium orsodium fluoride).
• Type of salt to be fluoridated. The salt distri-bution and consumption patterns need to bereviewed. This will enable good decisions to be
PROMOTING ORAL HEALTH
58

made as to what types of salt need to be fluor-idated for such uses as bakeries, food produc-tion, and household use.
• Salt containers or packaging should bear leg-ends or warnings about salt consumption.
• Recommended method for fluoridating salt.Legislation or regulations should incorporatethe latest analytical techniques and should beable to be easily changed when these techniquesadvance or improve.
• Institution or agency that will monitor theprogram.
• Monitoring reports that salt plants should ex-pect to submit.
• Analytical method for salt quality control. • Sanctions for noncompliance with specifica-
tions for salt fluoridation.• Issuing of a warning so that no other food or
condiment is fluoridated.• Issuing of a warning so that imported salt
meets the specifications established for nation-ally produced salt.
Characteristics of the Salt Industry and theMarket for Salt for Human ConsumptionThis study of the salt industry and salt sales and useshould develop information on the following:
• Sources of salt and its production in small,mid-sized, and large plants.
• Current and projected demand for salt.• The country’s current salt supply.• Geographic location of salt plants and distri-
bution and marketing by the salt industry.• Consumption of salt by the population.• Critical supplies (acquisition of which presents
challenges for the country’s salt industry).• Technology adopted by the industry (how salt
is produced and iodized).• The country’s experience with salt iodization.• The salt industry’s role in fluoridation.
Technical Cooperation, Technological Transfer,and Available Resources for Developing a SaltFluoridation ProgramA salt fluoridation program to reduce the incidenceand prevalence of caries requires financial and tech-nical support from organizations interested in oralhealth. Table 6.2 classifies possible actors in such a
project, as well as their private or public and local orinternational nature. Several alternatives exist forconcerted support of the program. The governmentof each country is responsible for initiating neces-sary contacts with interested organizations to securetheir involvement.
Initially, the institutions that could participate ina country should be identified, and then a completeinvestment proposal should be prepared for presen-tation to cooperation and financial agencies. Institu-tions committed to carrying out a salt fluoridationproject should participate in preparing the proposal.
Apart from financial supporters, there are otherpublic and private institutions that could assist withtechnical aspects of the project. These include insti-tutions that can help with analysis of fluoride levels,as well as university laboratories and their re-searchers who can conduct baseline studies. Privatelending institutions can provide assistance for fund-ing technological development and could run creditprograms for social development. They might be ableto provide assistance in managing the technologicaldevelopment of salt fluoridation. The cooperation ofdental associations can lend legitimacy and credibil-ity to projects. Dentists, especially, play an importantrole in promoting salt fluoridation program as part ofa comprehensive preventive effort; their support iscritical to the program’s success.
Baseline StudiesSalt fluoridation plans call for measurement of base-line oral health status. Two essential studies deter-mine, (1) baseline information on dental caries and
STRATEGIC PLANNING FOR THE IMPLEMENTATION OF SALT FLUORIDATION PROGRAMS
59
TABLE 6.2 Sources of cooperation for developinga national salt fluoridation program.
Public Private
Ministry of HealthUniversity
World BankIDBPAHOUNICEFDonor governments
Rotary ClubPrivate laboratoriesLending institutions
and banksDental associationsFoundations
Salt Institute (U.S.A.)Institute of Nutrition
of Central Americaand Panama (INCAP)
Internal
External

fluorosis and (2) baseline levels of fluoride in watersupplies; PAHO recommends additional studies of(3) urinary fluoride excretion in children 3–5 yearsof age and (4) assessment of other available sourcesof fluoride.
PAHO developed standard protocols, but somecountries have modified them to address specific re-search needs (3). Research protocols for all baselinestudies are presented in Part 3.
Determining the Prevalence of Caries and Dental Fluorosis in Children 6–8 Years Old,and 12 and 15 Years OldThe purpose of this study is to establish a baseline ofseverity and prevalence of dental caries and fluorosisin children 6–8 years old, and 12 and 15 years of age.Baseline data allow comparisons to be made in futureperiodic assessments. These age groups are studiedbecause at 6–8 years old one observes temporary den-tition and the first permanent teeth; at 12 years ofage, the first and second permanent molars can be ex-amined; and at 15 years of age, erupted canines areobserved. For the fluorosis study, only the upper teethfrom canine to canine are taken into account.
These age groups should be studied simultane-ously through a representative national sample tak-ing into account that parts of the population maylive in areas with varying levels of fluoride in drink-ing water, as well as the relationship between cariesand dental fluorosis and existing fluoride concentra-tions in the water.
These studies are intended to assess the currentsituation and to predict the population’s future oralhealth needs. In the event that there is no nationalor regional health authority with responsibility fordetermining oral health needs, then dental associa-tions or university teaching institutions should con-duct these studies periodically.
Determining Fluoride in Water SuppliesPAHO highly recommends that this important studybe conducted. It is known that fluoride is present invarious concentrations in water, depending on thewater source, type of soil, depth of wells, and other en-vironmental and seasonal factors. Each country mustidentify communities where the fluoride concentrationis naturally high enough to prevent caries. Fluoridatedsalt should not be distributed in these communities to
avoid the risk of dental fluorosis in children youngerthan 6 years old. This study should measure all drink-ing water sources, and should progressively become aperiodic evaluation conducted every 4–5 years.
The main objective is to create a database of thecountry’s community water supplies and categorizetheir fluoride concentration. In particular, the studyshould locate water supplies with fluoride concen-trations above optimal levels, and identify the pop-ulation served. Training seminars are recommendedto coordinate study design, the recording of essentialdata, and the methodology for laboratory analysisusing specific fluoride ion electronic meters.
Fluoride levels established for interpretation ofdata are low, moderate, optimal, and high:
Low concentration 0.00 to 0.39 partsper million (ppm)
Moderate concentration 0.40 to 0.69 ppm
Optimal concentration 0.70 to 1.49 ppm
High concentration 1.50 ppm and higher
Note: In warm climates, the minimum optimalconcentration is 0.5 ppm, whereas in temperate andcold climates it is 0.7 ppm .
The study will be conducted following public and private sector sanitary guidelines for samplingdrinking water in supply systems (described inChapter 7, “Epidemiological Surveillance”). Sam-ples from all sources and networks that supplywater for human consumption will be collected todevelop the national database.
Study results will indicate areas where fluori-dated salt will be marketed and where there is a riskof fluorosis. Again, fluoridated salt should be con-sumed only in areas where fluoride concentrationsare low or moderate. Areas with optimal and highfluoride concentrations will have to be monitored toprevent fluoridated salt from being sold there (4).
Determining Fluoride Excretion in Urine ofChildren 3–5 Years Old, Using 24-hour SamplesThis study provides information on fluoride expo-sure, regardless of the source. It is used to determinewhether children are receiving an adequate amountof fluoride to protect against dental caries, and to
PROMOTING ORAL HEALTH
60

alert public health authorities if children are beingexposed to undesirable amounts of fluoride thatcould cause unsightly dental fluorosis. After a saltfluoridation program is implemented, data collectedfrom future studies will indicate whether childrenare being exposed to optimal amounts of fluoride,with minimum risk of dental fluorosis. The data arealso used to advise the salt industry on possible ad-justments of fluoride levels that might be needed. Ifstrict quality control is exercised by the salt industry,regarding fluoride concentration in salt for humanconsumption, and if fluoride excretion rates are stillabove optimal levels, then other sources of fluorideexposure need to be investigated as possible causesof those excessive levels. Additional sources of fluo-ride that can raise the compound’s concentration inhumans include fluoride pills, tablets, lozenges, ordrops, as well as some mineral waters and someblack teas. Fluoride concentrations in populationsthat consume these products need to be studied.
The recommended methodology for performingthese studies follows WHO guidelines. Twenty-fourhours is the recommended monitoring period fortime-controlled urine sampling. Essential data col-lected include volume, urinary collection period,fluoride concentration, and the age and weight ofparticipating children. Fluoride concentration is de-termined using specific fluoride-ion electrodes andelectronic meters. The information obtained is usedto calculate the urinary fluoride excretion rate perhour and per 24-hours.
Monitoring of fluoride concentrations in urine isa convenient method for estimating ingestion of thation in a given population. If in addition to concen-tration, the rate of urinary flow is determined, thenthe rate of excretion of fluoride through the urinarytract can be determined by multiplying the two fac-tors. This procedure has the advantage of reducingthe degree of variation between individuals, sinceevery increase in the rate of flow tends to be relatedto a reduction in fluoride concentration in the urine,and vice versa. In addition, the urinary excretionrate reflects the fluoride level in blood plasma withadequate reliability (5).
This study will be conducted on a population sam-ple of children 3–5 years old. Urine samples shouldbe collected over 24 hours (estimates based on thatmethod or on excretion rate are more reliable than
those based on specific samples of urine). The sam-ples will have to be representative of the total popu-lation of this age group, and of areas in the countrywith different fluoride levels in drinking water (3).
Fluoride excretion in urine will be reported in mi-crograms (µg) of fluoride per hour. This study willprovide children’s fluoride intake in relation to itsexcretion, before consumption of fluoridated salt be-gins (guidelines for the study of excretion of fluoridein urine are described in detail in Protocol 3, “De-termining Urinary Fluoride Excretion in Children—Time-controlled Urine Sampling,” in Chapter 10 ofthis book.)
Reference Data on Nutrition of PreschoolersNutritional surveillance provides information on theprevalence of malnutrition and its trends, potentialnutritional problems, and the operation and effec-tiveness of nutritional interventions. This informa-tion facilitates decision-making by staff members re-sponsible for public health programs, as well asformulation of strategies and planning and evalua-tion of programs.
Some countries have multisectoral food-and-nutrition surveillance systems located in the ministryof health or nutritional surveillance units within thatministry. Most countries have mechanisms for moni-toring some nutritional indicators that make it possi-ble to obtain information on preschool children (6).
At any age, an adequate supply of nutrients isnecessary to maintain oral health. Early malnutri-tion affects tooth structure, delays eruption, and in-creases susceptibility to caries. It also is related to agreater risk of dental fluorosis (8).
Information on food consumption and the nutri-tional status of preschool children is vital for under-standing the state of oral health and for determiningthe effect that the intake of natural fluoride throughwater or by consuming fluoridated salt can have. In-formation on food consumption and nutritional sta-tus can be obtained from national nutritional sur-veys or anthropometric studies.
In addition, it is necessary to conduct studies offluoride content in the staple foods that are con-sumed most frequently by a country’s population, inorder to identify the principal sources of this elementthat are available to that population. Processed foodthat can be enriched with fluoride also should beidentified, as should food of foreign origin, in case
STRATEGIC PLANNING FOR THE IMPLEMENTATION OF SALT FLUORIDATION PROGRAMS
61
health measures must be taken to ban or limit itsmarketing (3).
Assessing other Fluoride Containing ProductsThis study collects information on other fluoridesources available to preschool children, in particularfluoride in toothpaste and in supplemental tablets,drops, or vitamins. It seeks parent or provider infor-mation about a child’s use of toothpaste, age of ini-tiation, frequency of use, brand of toothpaste, andsupervision during toothbrushing. This study com-plements the study of urinary fluoride excretion.
Ingestion by children younger than 5 years of ageof fluoridated toothpaste during toothbrushing (dueto their inability to control the swallowing reflex) is of special interest, since the crowns of the perma-nent teeth are in the process of calcification and aresusceptible to dental fluorosis. Many studies havedemonstrated that ingestion of dentifrices duringtoothbrushing declines with age; children 5 years oldwere found to ingest between 26% and 35% of thetotal dentifrice used, while children 2–4 years old in-gested approximately 35% (8).
Ingestion by children of significant quantities offluoride in the form of toothpaste can put the childat risk of developing dental fluorosis. That risk in-creases if fluoride intake also increases through con-sumption of fluoridated salt.
It is therefore necessary to know the percentageof preschool children using fluoridated dentifricesand the fluoride concentrations in those products,and to provide information to health workers andparents, stressing the importance of supervisingchildren’s toothbrushing and of teaching children touse small quantities of paste and helping them toavoid swallowing it (8).
In addition, toothpaste manufacturers should beencouraged to produce products with lower fluorideconcentrations for use by children; normally, theseproducts have concentrations between 1,000 and1,500 ppm fluoride, while children require 400–550ppm for their brushing (3).
A growing number of pharmaceutical productscontaining organic or inorganic fluoride are used asfluoride supplements to prevent caries. It is thus nec-essary to determine what fluoridated products aremarketed as supplements in a country, and which
ones are regularly prescribed by health professionals(dentists, and pediatricians) without consideration ofthe natural fluoride levels in drinking water or theproper dosage for a patient’s age and body weight.
It also is necessary to know the fluoride concentra-tion in these supplements, with a view to limiting theirsale when fluoridated salt is marketed in the country.The use of additional fluoride (such as through use ofdrops or tablets) by a population consuming fluori-dated salt poses a risk of dental fluorosis (3).
General guidelines for carrying out these ac-tions are described in Chapter 7, “EpidemiologicalSurveillance.”
Determining Baseline Intake or Salt ConsumptionPer Person and Per DayThe population’s salt consumption habits should betaken into account when determining how muchfluoride will be added to salt for human consump-tion. If a great deal of salt is routinely eaten, thenless fluoride should be added. If, on the contrary,salt consumption is minimal, the concentration offluoride in salt will have to be greater (9).
It is recommended that information on the averagesalt intake by individuals in a population be obtainedfrom the national nutrition institutes or programs, aswell as from the salt industry. Only if such informationis not available from those sources would a study ofsalt consumption, in a population sample that is rep-resentative of the country, have to be conducted (10).
As mentioned, information on salt consumption,along with other variables, enables determination ofthe dosage of fluoride to be added to salt to obtain acaries prophylactic effect.
Surveillance Systems and Quality ControlThe purpose here is to establish criteria for epidemi-ological surveillance of caries and dental fluorosis re-lated to the salt fluoridation program, as well as ofconditions that can endanger the oral and overallhealth of the population. The guidelines will be es-tablished in accordance with results obtained frombaseline studies and from monitoring of activities re-quired by the program for its implementation. Theywill be applied in Phase II of the salt fluoridation pro-gram. (PAHO’s recommendations for monitoring salt
PROMOTING ORAL HEALTH
62
fluoridation programs can be found in Chapter 8 ofthis book.)
Determining the Dosage of Fluoride Ion per 1 kg of Salt The initial dosage of fluoride ion will be determinedin terms of information on the concentration of nat-ural fluoride in drinking water, on the baseline forexcretion of fluoride in urine, on intake or con-sumption of salt per person per day, on geochemicalenvironmental aspects, and on certain behaviorsthat will increase the intake of additional fluoride,such as reboiling soups, thereby increasing the fluo-ride concentration, or an excessive consumption ofsome foods, such as tea.
The experiences of countries that already haveimplemented salt fluoridation programs also offerimportant lessons. The dosages they have applied arelisted below (11):
• Switzerland, 250 mg F/1 kg salt• France, 250 mg F/1 kg salt• Jamaica, 250 mg F/1 kg salt• Costa Rica, 200 mg F/1 kg salt• Colombia, 200 mg F/1 kg salt• Mexico, 250 mg F/1 kg salt• Uruguay, 250 mg F/1 kg salt
Recommended dosage of fluoride is 200–250 mg/kg salt. It is sometimes more difficult to control thedosage with the wet method, which is usually usedin plants with continuous production and highproductivity.
PHASE II: FIRST EVALUATION
To reach this phase it is necessary to have obtainedthe information and conducted the baseline studiesspecified in Phase I, since those studies will be com-plemented by actions undertaken in Phase II.
Plant Equipment for the Production of Fluoridated Salt, by Production Method
• Dry method. Used in salt plants where there isbatch production. In small-scale salt production,
heavy mixing equipment with a capacity of 1–5tons per hour is used for individual batches (11).
• Wet method. Used when the production processis continuous or done on a large scale. Intensive,high-speed, continuous mixing equipment isused (4).
Training of Personnel for the Program In all countries, training will need to be provided inepidemiological monitoring of salt fluoridation pro-grams. Every country should tailor its training tothe type of surveillance that it will carry out, espe-cially at intermediate and local levels. Training willbe determined by the needs of each institution andsector participating and by the standards and legalprovisions in force in each country.
It is recommended that training for health work-ers and salt-industry personnel that will participatein the implementation, dissemination, and evalua-tion of the salt fluoridation program be divided intotwo large areas:
• Training for the work is directed at theworker who will become an integral part of theprogram and will perform a function related tosalt fluoridation. Its objective is to provide theindividual with complete appropriate informa-tion about the activity that he or she will carryout. Training can be done with manuals forself-instruction or through formal courses.
• Training in the work consists of a system-atized series of activities aimed at practice andin-service training to detect deficiencies oromissions in the execution of operations andprovide advisory services.
Salt fluoridation programs should include a sub-program for personnel training, in which trainingneeds are specified in accordance with the program’scurrent phase. Some examples of training subjectsare development and benefits of the salt fluoridationprogram; calibration in epidemiological oral healthindexes; and analytical techniques to determine flu-oride in water, salt, urine, and other materials.
Personnel to be trained include dentists, physi-cians, nurses, chemists, nutritionists, health moni-
STRATEGIC PLANNING FOR THE IMPLEMENTATION OF SALT FLUORIDATION PROGRAMS
63
tors, administrative personnel, and health promot-ers, among others. Their training should be tailoredto activities in which they are to participate. Theseactivities should be carried out in coordination withhealth-education sections of each country’s healthinstitutions, as well as with universities (4).
Development of Monitoring InfrastructureLaboratories may be provided with equipment (po-tentiometer, electrodes for fluoride, and an analyticbalance), and with analysis material and reagentsfor the fluoride determinations. Likewise, labora-tory staff may need training in techniques for deter-mination of fluoride in water, salt, and urine. Thenumber of laboratories that are set up should be inaccordance with the degree of regionalization ofeach country’s laboratory network, or with the re-gionalization that the country has established forepidemiological surveillance of salt fluoridation (4).
Mass Communication Strategy At this point in the program, a strategy for masscommunication should be developed and carried outfor each population group. The portion of the popu-lation intended to receive fluoridated salt will be in-formed of its benefits. People living in areas wherefluoride levels in drinking water exceed optimal con-centrations should be warned against consumingfluoridated salt.
Additionally, information concerning restrictionson the use of systemic fluoride as a widespread pre-ventive measure must be disseminated to healthworkers such as dentists, pediatricians, and gyne-cologists. The information disseminated should besimple, persuasive, understandable, and current.
Mass media and promotional materials shouldnot encourage salt consumption, but only spread in-formation on the benefit of consuming fluoridatedsalt in the usual quantity. At the same time, it is rec-ommended that information on other activities thatpromote oral health (toothbrushing, use of dentalfloss after meals, adequate diet, and periodic visitsto the dentist) be disseminated.
Mass communication media—radio, television,salt packaging, cooking magazines, posters, adver-tising material, pamphlets, or printed material on
supermarket bags—should be selected according tothe resources that are available (12).
Initiation of Epidemiological SurveillanceEpidemiological surveillance of the salt fluoridationprogram requires continual or periodic biologicalmonitoring and chemical monitoring. The surveil-lance objective is to determine the caries prophylac-tic fluoride concentration in salt, in order to achievemaximum protection against caries with minimalrisk of producing dental fluorosis, through indica-tors or conformance to standards (3).
Epidemiological surveillance includes the followingchemical and biological monitoring activities, whichmust be completed in the program’s Phase II (13).
Biological Monitoring
1. Monitoring of fluoride excretion in urine inchildren 3–5 years old, using 24-hour sam-ples, beginning 15 months after having regu-larized the fluoride dosage in salt and after thepopulation’s consumption of fluoridated salthas begun.
2. Epidemiological survey of DMFT and dentalfluorosis conducted seven years after imple-mentation of the program in children 6–8years old, 12 years old, and 15 years old.
3. Periodic monitoring of the nutritional statusof preschoolers.
Biological monitoring must be repeated sevenyears after salt fluoridation begins, to determine theeffectiveness and risks of the program. Results willhighlight any corrective measures that should be un-dertaken to reach program objectives.
If there is evidence of higher than optimal fluorideconcentrations in water in certain geographic areas,additional evaluations may be called for there.
Chemical Monitoring
1. Continuous monitoring of the fluoride con-centration in drinking water.
2. Continuous monitoring of the marketing anduse of other fluoride supplements, such asdrops and tablets.
PROMOTING ORAL HEALTH
64

3. Periodic monitoring of the proper use oftoothpaste by preschool children
4. Monitoring of other, newly introduced fluorideproducts.
Quality Control in the Production andDistribution of Fluoridated SaltQuality control should be implemented by thehealth sector and by the salt industry from the startof fluoridated salt production (4).
1. Quality control in the production process—this monitoring is carried out by salt-plantpersonnel, who collect salt samples directlyfrom the hoppers during the productionprocess for analysis in the plant laboratory andany necessary correction of the fluoridedosage. Health sector personnel also visit saltplants to collect samples from the productionline for analysis in health sector laboratories.
2. Quality control in the distribution process—marketing lines for salt and points of sale aremonitored to confirm that the type of salt soldis appropriate for the area. Salt plants andhealth authorities should carry out this control.Monitoring of the marketing lines is donethrough monthly reports from the plant; moni-toring to confirm the type of salt and fluoridedosage is done by collecting salt samples fromthe points of sale, with the samples analyzed inlaboratories set up for monitoring the program.
Safety Aspects in the Production ofFluoridated SaltProper safety measures must be followed in the pro-duction process to reduce the risk of injury to per-sonnel handling fluoride. The following safety mea-sures should be followed:
• The exposure limit for potassium fluoride (KF)in terms of threshhold limit values (TLV)should be 2.5 mg of F per m3 in eight hours, asrecommended by the United Kingdom Healthand Safety Executive and by the 1991–1992United States American Conference of Govern-ment Industrial Hygienists (ACGIH).
• In handling the reagent, spills and the genera-tion of powder should be avoided.
• Protective equipment worn by workers han-dling reagent should include:1. Unsupported Neoprene gloves (Neotop
model) with diamond finish.2. Nonfogging chemical goggles.3. Masks for protection from powders and
mists.• First aid measures include:
1. In case of ingestion or severe exposure offluoride through inhalation, administer ef-fervescent calcium gluconate tablets andcopious amounts of water. Do not inducevomiting.
2. In case of contact with the eyes, wash eyesimmediately with copious amounts of waterand continue irrigating with sterile salinesolution.
3. In case of contact with skin, wash contami-nated area with copious amounts of water.
PHASE III: LONG-TERM EVALUATIONAND CONSOLIDATION
This phase is characterized by established epidemi-ological surveillance and quality control in produc-tion and distribution (13). Procedures for these ac-tivities are identical to those called for during PhaseII and are described in Chapter 7. These activitiesmake it possible to confirm the fluoride dosage andevaluate the impact of salt fluoridation.
Epidemiological Surveillance Elements
• Continual verification of fluoride levels indrinking water.
• Survey of the DMFT index and dental fluoro-sis in children 6–8 years old, 12 years old, and15 years old, conducted 14 years after imple-mentation of the program.
• Periodic monitoring of excretion of fluoride inurine of children 3–5 years old, using 24-hoursamples.
STRATEGIC PLANNING FOR THE IMPLEMENTATION OF SALT FLUORIDATION PROGRAMS
65

• Periodic monitoring of the nutritional status ofpreschool children.
• Periodic monitoring of the use of toothpaste bypreschool children
• Continuous monitoring of marketing and useof other fluoride supplements, such as dropsand tablets.
Quality Control in Production andDistribution
• At salt plants, regular monitoring to ensure thecorrect fluoride dosage.
• In the distribution of salt, monitoring to ensurethat the type of salt and fluoride concentrationare appropriate for the area where they are sold.
References
1. Organización Panamericana de la Salud, ProgramaRegional de Salud Bucodental. Estrategia Regional deSalud Bucodental para los Años Noventa. Washing-ton, DC, mayo de 1994.
2. Instituto Latinoamericano de Planificación Econó-mica y Social. Guía para la presentación de proyec-tos. México: Siglo Veintiuno; 1991.
3. Taller para la Vigilancia Epidemiológica del Pro-grama Nacional de Fluoruración de la Sal de México.Secretaría de Salud, OPS, OMS, NIH. México, sep-tiembre de 1994.
4. México. Secretaría de Salud. Programa Nacional deFluoruración de la Sal. Dirección General de Medi-cina Preventiva. México, 1994.
5. Murray JJ. El uso correcto de fluoruros en saludpública. Ginebra: Organización Mundial de la Salud;1986.
6. Organización Panamericana de la Salud. VigilanciaAlimentaria y Nutricional en las Américas. Una Con-ferencia Internacional. México, 5–9 de septiembre de1988.
7. Álvarez JD, Navia JM. Nutritional status, tooth erup-tion, and dental caries: A review. Amer J Clin Nutr1989;49:417–426.
8. Ophaug R. Dietary fluoride intake of infants andyoung children and the effect of supplemental andnondietary sources of fluoride. Comp Cont Ed Dent1988;9:68.
9. Marthaler T. Algunas consideraciones sobre la fluoru-ración de la sal. Rev Cubana Estomatol 1988;25(3):94–97.
10. Martinez-Salgado H, Tovar-Zamora E, Chavez-Villasana A, Armendariz DM, Baz-Díaz-lombardo G.Consumo familiar e individual de sal de mesa en elEstado de México. Investigación. Instituto Nacionalde Nutrición Salvador Subirán, Instituto de Salud delEstado de México. México, 1990.
11. Salas Pereira MT. Manual de ingeniería de la fluoru-ración de la sal. Costa Rica: Organización Panameri-cana de la Salud. Costa Rica, 19base line.
12. Diseño gráfico para el Programa Nacional de Fluoru-ración de la Sal. Escuela de Diseño Gráfico del Insti-tuto Nacional de Bellas Artes. México, 1994. Tesisprofesional
13. Organización Panamericana de la Salud. Recomen-daciones para la vigilancia epidemiológica del Pro-grama Nacional Preventivo de Fluoruración de laSal. Washington, DC: OPS; 1995.
PROMOTING ORAL HEALTH
66
The objective of conducting epidemiological sur-veillance of a national salt fluoridation programis to determine the proper dosage of fluoride in
salt to achieve maximum protection against carieswith minimum risk of producing dental fluorosis (1).
This section sets out general criteria for epidemi-ological surveillance of dental caries, periodontaldisease, and dental fluorosis in the context of a saltfluoridation program.
GENERAL CONSIDERATIONS
To better understand this aspect of a salt fluorida-tion program, the following definitions are provided:
Epidemiology—the discipline of medicine thatstudies the natural historical processes of health anddisease causes and distribution, as a collectiveprocess (2).
Epidemiological surveillance—the continu-ous, dynamic study of the state of health and of thefactors that modify it, to determine changes occur-ring in the health of the population.
Monitoring—the periodic follow-up of the fun-damental activities of a program, through the devel-opment of indicators or standards serving as vari-ables that can be observed and measured (3).
Epidemiological Surveillance Requirements Monitoring of a salt fluoridation program should becarried out by continuously and systematically col-lecting epidemiological information generated bydental services, laboratories, oral health surveys, and
research in other areas and other community entities.This information is then processed, analyzed, inter-preted, disseminated, and used as feedback about theprogram. Epidemiological surveillance requires:
Information—Chemical and biological monitor-ing generates data from surveys of DMFT indexesand dental fluorosis and from studies of excretion offluoride in urine, of the concentration of fluoride indrinking water in different seasons, of fluoride con-tent of salt, on the use of toothpaste by and the nu-tritional status of preschool children, and on mar-keting and use of fluoridated supplements (4).
Training—In implementing epidemiological sur-veillance, it will be the responsibility of each institu-tion or sector (health, industrial, etc.) to carry outtraining at all required levels. Training may be nec-essary in analytical techniques for determining fluo-ride in water, salt, and urine, as well as in obtainingurine donors, collecting samples, and measuringepidemiological indicators.
Supervision and evaluation—Appropriate su-pervision and evaluation are needed to detect devi-ations, propose alternative solutions, and establishcorrective measures by comparing obtained resultswith what has been programmed. These activitiesmake it possible to determine the impact of saltfluoridation in caries reduction or in causing side ef-fects like dental fluorosis.
Epidemiological Surveillance MeasurementsEpidemiological surveillance of a salt fluoridationprogram measures pathologies, risk factors, and pro-tective factors.
7. EPIDEMIOLOGICAL SURVEILLANCE
67

Those measurements are related to the monitor-ing of:
• Caries prevalence and incidence.• Dental fluorosis prevalence and incidence.• Fluoride concentration in salt.• Levels of fluoride in drinking water in places
where fluoridated salt is consumed.• Restriction of the availability of fluoridated salt
in areas where levels of fluoride in drinkingwater exceed predetermined concentrations.
• Fluoride concentration in products for oral hy-giene (toothpastes, rinses).
• Use and concentration of fluoridated supple-ments (drops, tablets).
• Nutritional status of preschoolers.
Measures will be established, if necessary, in ac-cordance with local, regional, and national epidemi-ological situations, and should meet official require-ments that have been specified by those responsiblefor the salt fluoridation program or by health author-ities. Examples include: restricting the use of fluori-dated supplements (drops, tablets) through legisla-tion; shutting down wells or water systems for humanuse that contain high levels of fluoride; and modify-ing specifications for producing fluoridated salt.
Organization of Epidemiological SurveillanceEpidemiological surveillance of a salt fluoridationprogram should be organized so that the informationit generates is complete, accurate, and timely; so that it follows technical and administrative programspecifications and those of other community entities;and so that it is in line with each country’s geo-graphic area. Surveillance organization extends fromthe operational (or local) level, on through state orprovincial levels, and through the national level.
The organization of epidemiological surveillanceshould include the following structural elements:
Surveillance unit—At each technical and ad-ministrative level, any unit that conducts surveil-lance activities (including monitoring) will be con-sidered a surveillance unit. The population in
general, also is considered as a unit that is part ofthe program; it can informally report to the appro-priate authorities and upper management levels onirregularities that it perceives in terms of salt use orits oral health. Every area of the technical and ad-ministrative levels that carries out surveillance ac-tivities (including monitoring) will be called a sur-veillance unit.
Institutional or interinstitutional groups—institutional groups are those in the areas of den-tistry and epidemiology or the equivalent, trainedby the institution that coordinates the program. In-terinstitutional groups are those from other partici-pating sectors, such as institutions responsible forwater supply, trade associations, universities, anddental societies.
Standard-setting agencies—those responsiblefor the national salt fluoridation program in eachcountry will represent the standard-setting agenciesin conducting epidemiological surveillance at thedifferent technical and administrative levels (3).
Planning and MonitoringWithout proper planning and monitoring, programresults will be unreliable, no matter how much in-formation is collected. Planning activities helps per-sonnel know what they should do; monitoringmakes it possible to quickly identify problems. Mon-itoring requires answering questions such as (3):
• What activities or tasks will be monitored?• Who will monitor them and when?• Where and how the monitoring will be carried
out?
As a part of epidemiological surveillance, moni-toring of salt fluoridation programs consists of ac-tivities carried out to determine the excretion of flu-oride in human urine, concentrations of fluoride inwater and in salt for human consumption, epidemi-ological oral health indexes, and other elements ofinterest to the program.
The basic activities of epidemiological surveil-lance are included in the biological and chemicalmonitoring described below (4).
PROMOTING ORAL HEALTH
68

BIOLOGICAL MONITORING
Biological monitoring enables periodic evaluationof the intake of fluoride and its impact on humans.As part of epidemiological surveillance of a saltfluoridation program, biological monitoring will becarried out among children 6–8, 12, and 15 yearsold to determine the DMFT index and the extent ofdental fluorosis. Among children 3–5 years old, bio-logical monitoring will be used to determine nutri-tional status and excretion of fluoride in urine. Foranalysis in urine, the potentiometric method withthe specific fluoride electrode is to be used (based onthe Nernst equation, which gives a simple relation-ship between the relative potential of an electrodeand the concentration of the ionic species in solu-tion). (See Table 7.1.)
Oral Health Surveys for DeterminingDMFT and Dental Fluorosis in Children6–8, 12, and 15 Years Old Oral health surveys are a fundamental part of PhaseI (the feasibility assessment stage) of a salt fluorida-tion program to gauge the population’s current situ-ation and future oral health needs. Phase II (firstevaluation) constitutes a core monitoring process forevaluation and control of the program’s effectivenessand risks. In Phase III (consolidation and mainte-nance), epidemiological surveys provide the moni-toring that allows determination of program effec-tiveness 14 years after implementation.
Studies to determine the state of oral health arethe responsibility of authorities and administratorsresponsible for oral health services. If there is no na-tional or regional dental health authority, then den-
EPIDEMIOLOGICAL SURVEILLANCE
69
TABLE 7.1 PAHO’s recommendations for monitoring salt fluoridation programs.Phase I
Feasibility Assessment Phase II Phase IIIand Program Implementation First Evaluation Long-term Evaluation
Determination of fluoride watersupplies
Nutritional/dietary survey in preschoolchildren (possibly already available insome countries)
Baseline study of toothpaste use bypreschool children
Baseline study of additional sources offluoride intake (dietary supplements,fluoride-containing products)
Development of epidemiologicalsurveillance guidelines for qualityassurance and quality control offluoridated salt
Baseline DMFT and dental fluorosissurveys in children 6–8, 12, and 15years old
Initial assessment of urinary fluorideexcretion in children 3–5 years old,one-sample/24 hours, after 15 monthsimplementation of salt fluoridation inthe market
Periodic sampling and determinationof fluoride in water supplies
Nutritional/dietary surveys of preschoolchildren
Periodic evaluation of toothpaste useby preschool children
Periodic monitoring of marketing ofadditional sources of fluoride intake
Periodic monitoring for qualityassurance and control of fluoridatedsalt
DMFT and dental fluorosis surveys inchildren 6–8, 12, and 15 years old, fiveto seven years after programimplementation
Urinary fluoride excretion in children3–5 years old, one sample/24 hours, 15months after program implementation
Continued periodic sampling anddetermination of fluoride in watersupplies
Nutritional/dietary surveys of preschoolchildren
Continued periodic evaluation oftoothpaste use by preschool children
Periodic monitoring of marketing ofadditional sources of fluoride intake
Periodic monitoring for qualityassurance and control of fluoridatedsalt
DMFT and dental fluorosis surveys inchildren 6–8, 12, and 15 years old 14years after program implementation
Periodic evaluation of urinary fluorideexcretion in children 3–5 years old (onesample/24 hours)

tal associations or teaching institutions should con-duct periodic epidemiological surveys.
General Guidelines for Conducting the DMFT andDental Fluorosis Survey
1. The national study of DMFT indexes and den-tal fluorosis will be carried out on a represen-tative sample of children 6-8, 12, and 15 yearsold.
2. Determination of fluoride in water suppliesshould be conducted on a representative na-tional sample, considering the different levelsof fluoride in drinking water, in accordancewith the following:• Low concentration, 0.00 to 0.39 ppm• Moderate concentration, 0.40 to 0.69 ppm• Optimal concentration, 0.70 to 1.49 ppm• High concentration, 1.50 ppm and aboveNote: In warm climates the established optimalminimum concentration is 0.5 ppm, whereas intemperate and cold climates, the figure is 0.7ppm (as shown above).
3. Criteria for diagnosis and coding of the DMFTindex will be those established by the WorldHealth Organization in its publication on oralhealth surveys (5).
4. For the survey of dental fluorosis, the DeanFluorosis Index will be used (6). Only theupper teeth, from canine to canine, will beassessed.
5. To maintain epidemiological surveillance ofthe salt fluoridation program, the baselinestudy of DMFT and dental fluorosis should befollowed up by a second study five or sevenyears later.
6. The epidemiological survey should take intoaccount the following aspects (7):a) Determination of the variable(s) to be
sampled (such that later inferences aboutthe population can be made with confi-dence). Variables may be:• Age (children 6–8, 12, and 15 years old,
ages of interest to the program becauseof the chronology of tooth eruption).
• Gender and socioeconomic level (factorsinfluencing the oral health of children).
• Total populations of the age groups se-lected for the country as a whole (usedto calculate a representative sample).
• Sample sizes and indexes. These will becalculated using children who attendschool, which means that precise dataon the numbers of children and schoolsthroughout the entire country are re-quired. This information should be re-quested from the national institutionresponsible for education. The numberof children sampled should be balancedagainst the size of the population chosenin each province.
• Fluoride level in water consumed bychildren chosen for sampling in differ-ent schools must be known. To this end,available data on fluoride concentrationin drinking water will be matched withthe areas chosen for determination ofindexes; samples of drinking water sup-plied to areas where the schools are lo-cated will be collected for determinationof fluoride levels.
b) In light of the characteristics to be sampledand subsequently evaluated, the stratifiedrandom sampling method is recom-mended. This can be carried out on thebasis of pilot studies conducted before-hand, by applying the formula for calcula-tion of sample size; in this way, the sam-ples are determined by stratum, forinfinite or very large populations.
c) For organizing the survey, the approval ofschool officials should be obtained; theprogramming and logistics of the surveyshould be established; emergency treat-ment for dental caries should be availableto those examined; instruments, equip-ment, and necessary material should beobtained; the mechanism for sterilizing theinstruments should be established; andsufficient quantity of survey sheets shouldbe available.
d) To assure reliability of results, criteria to beused by interviewers should be standard-ized (calibrated), a pilot exercise should be
PROMOTING ORAL HEALTH
70
carried out, and 10% of the examinationsshould be replicated.
e) To conduct the survey, the following actionswill be taken: establish contact with direc-tors and teachers at the selected schools; or-ganize participating personnel; prepare ma-terials, instruments, and examination area;determine the epidemiological indexes.
f) Once sampling is completed, data are or-ganized on the basis of age, gender, socialstratum, fluoride level in water, DMFT in-dex, and degree of dental fluorosis for eachschool surveyed in the different provinces.
g) For the analysis of the study data, the fol-lowing statistical techniques are suggested:• Simple or multiple linear regressions
(multivariate technique) with analysisof variance for the regression—useful incomparing correlations among the dif-ferent factors taken into account in thestratified random sampling.
• Discriminant analysis—a powerful mul-tivariate study used to determine the re-lationship between the discriminatingvariable and the group of other vari-ables of interest.
h) The final report of the survey will be pre-pared, enabling the scheduling of activi-ties leading to the implementation of saltfluoridation programs or providing feed-back for existing ones.
Determining Fluoride Excretion in Urine inChildren 3–5 Years OldThe process of fluoride excretion involves a numberof variable characteristics of renal function, amongthem the rate of glomerular filtration, the rate of uri-nary flow, and the pH of the urine (the average rateof excretion of fluoride increases with alkalinity).
The actual percentage of absorbed fluoride that isexcreted varies in accordance with an individual’shistory of exposure to fluoride and with age, sinceboth influence the effectiveness of the skeletal com-ponent of the hemostatic mechanism; however,other factors also intervene, especially the concen-tration of ingested fluoride and fluid intake.
Young children excrete a lower percentage of in-gested fluorides than adults, which is attributed tothe higher rate of fixation of these compounds inchildren’s bones and other calcified tissues. Data onchildren under 6 are limited, but in general theyprobably excrete 20%–30% of ingested fluoride intheir urine, whereas adults excrete 50%–60%.
Fluoride concentration in plasma and in urinetends to be very similar. As a result, fluoride levelsare good indicators of recent fluoride intake (8).
Results obtained from determination of fluorideexcretion in urine make it possible to calculate andevaluate the population’s daily total fluoride intake,in accordance with the level of fluoride that each ve-hicle contains. If data from a program assessing flu-oride intake are expressed in terms of excretion rate,it is important to determine when in the day samplesshould be collected from the subjects. This is due tothe fact that such a program should estimate thedaily fluoride intake based on the daily fluoride ex-cretion in the urine. To solve this problem, it is rec-ommended that a salt fluoridation program designstudies using 24-hour urine collections over an ap-propriate period of time.
Urinary flow rate is determined from the volumeof urine collected and the time elapsed between thefirst emptying of the bladder and the second—anapproach that has the following advantages:
1. It reduces the degree of variation from oneperson to another, since as the urinary flowrate increases, the concentration of fluoride inthe urine decreases, and vice versa.
2. The urinary excretion rate also reflects thefluoride level in blood plasma with sufficientreliability.
3. For adults who consume salt fluoridated at250 ppm, average urinary excretion for 24hours depends on the quantities of fluoridatedsalt consumed, according to Wespi and Burgi.
4. Using the rate of excretion, the dynamics ofexcretion can be analyzed; for example, thefluoride peak that forms after meals can beevaluated.
It is important to recall that children with grow-ing bone systems take more time to regularize their
EPIDEMIOLOGICAL SURVEILLANCE
71

fluoride metabolism so that urinary excretion is ad-justed to the increase in fluoride ingestion, since thisis an element that the bones seek. The amount offluoride in children depends on their current growthperiod (9).
In light of the above, the following guidelinesshould be considered for monitoring fluoride excre-tion in urine of children 3–5 years old.
General Guidelines for Monitoring FluorideExcretion in Urine
1. Fluoride excretion in urine in children 3–5years old should be studied first in the feasi-bility or initiation phase of a salt fluoridationprogram, to establish a baseline before fluor-idated salt is marketed.
2. In the program’s second phase, 15 monthsafter implementing the measurement andcontrol of the marketing and consumption offluoridated salt, monitoring of fluoride ex-cretion in urine in children 3–5 years oldshould be initiated. Moreover, monitoring offluoride excretion in urine should be carriedout periodically (every 12 months) duringthe second and third phases of the salt fluor-idation program.
3. Studies should be carried out in a populationsample of 180 children 3–5 years old wholive in areas with different altitudes, cli-mates, and levels of fluoride in the drinkingwater.
4. Twenty-four-hour samples should be col-lected, with supervision of every donor on atleast two occasions.
5. Selected donors should have resided in thearea a minimum of six months.
6. Children not ingesting any drugs (includingvitamins) should be selected as urine donors.
7. Monitoring personnel should be supervisedduring the following phases: donor selection;sampling; sample conservation and transferto laboratories; and sample processing atlaboratories.
8. Children’s urine samples should be collectedin 1,000 ml, wide-mouth plastic or polyethy-lene containers with double caps.
9. If samples will not be analyzed within thefirst few hours after collection, a preservativethat does not interfere with the chemical re-action in the analysis, such as thymol, shouldbe added to the container prior to collection.
10. Urine samples should be kept refrigerated at7º–14ºC until laboratory analysis, with amaximum storage time of 15 days.
11. Samples should be analyzed individually, toallow comparison of the variation among in-dividuals with regard to fluoride excretionand, presumably, fluoride intake.
12. Excretion of fluoride in urine should be de-termined using a potentiometer with fluorideion-specific and reference electrodes, or elsewith a combination electrode, giving resultsin µg/hour.
13. Internal and external quality control shouldbe carried out at laboratories responsible forthe analyses:
• Each laboratory will periodically carryout internal quality control, and the in-formation should be at the disposal ofsupervisory personnel.
• Those responsible for the salt fluorida-tion program and national laboratorypersonnel will conduct external qualitycontrol.
14. Dental and nursing personnel should be re-sponsible for taking urine samples. Othertrained health workers can participate, ifnecessary.
15. A form should be filled out and numberedprogressively for each child donor, and thecollected urine sample should be markedwith the same number (1).
The pH values and flow rates of monitoring sub-jects should be determined, because these variablescan influence both the concentration and rate of flu-oride excretion. Dietary differences make it proba-ble that the concentrations and the excretion ratesare greater than in other populations and that theaverage pH will be relatively high. If the rate of uri-nary flow is relatively high, then fluoride concentra-tions will be lower and the excretion rates somewhatgreater than in other populations, and vice versa. In
PROMOTING ORAL HEALTH
72

accordance with the fluoride, pH, and urinary flowresults, adjustments could be required in the fluo-ride dosage in salt.
Procedures for Biological Monitoring of 24 Hours of Fluoride Excretion in Urine inChildren 3–5 Years Old
1. A training course covering urine collectionand sample conservation and shipmentshould be conducted for personnel who willparticipate in the study.
2. Study personnel should be informed of areasto be monitored and told to keep in mind thedifferent ranges of fluoride levels in drinkingwater and the number of samples to be col-lected in each place.
3. Homes or institutions should be visited to re-cruit urine donors.
4. Parents or others responsible for participat-ing children should be informed of thestudy’s objective and the procedure for col-lecting urine samples. A signed consent formshould be obtained from the parent or re-sponsible adult.
5. At each donor residence a numbered identi-fication form should be filled out and thecontainers (labeled with the same identifica-tion number) to be used for urine collectionshould be left at the residence.
6. The parents or others responsible for the chil-dren in the study should be instructed to dis-card the first urine excreted by the child uponawakening in the morning and to record thehour when that first urination occurs; thisfirst-urination hour marks the starting timeof the 24-hour period during which the urinesample is collected.
7. Study participants should be told to collectall the urine excreted in each urination dur-ing the rest of the day and night, and also thefirst urine excreted the following morning.Parents or others responsible for the childshould be asked to also record the hour thatthe first urine of the morning of the follow-ing day is issued, indicating that at point thecollection of the urine sample is finished.
8. Urine from female donors should be col-lected in chamber pots or wide containers,which should be plastic, after which all theurine should be poured into the plastic bot-tle provided for collection.
9. Urine donors should be instructed to closeurine containers airtight and keep them in acool place.
10. Health workers should collect urine samplesthe day after collection begins and shouldconfirm that urine-sample identificationforms have been filled out correctly.
11. Urine samples and identification formsshould be sent to the laboratory where theywill be analyzed.
Monitoring the Nutritional Status ofPreschool ChildrenIn Phase I (feasibility assessment) of the salt fluori-dation program, baseline data on the nutritional sta-tus of preschool children should be obtained. Con-tinuous monitoring of nutrition in this populationgroup is carried out in Phase II (first evaluation)and Phase III (consolidation and maintenance).
In many developing countries, malnutrition af-fects children most during the first years of life, whengrowth is rapid and nutritional needs are higher andmore specific. Thus, when poverty limits availabilityof food, children suffer most. When children’s fooddoes not meet their energy requirements, their rate ofgrowth is restricted and their health compromised.Hence, when one wants to know a community’s nu-tritional status, the status of children up 6 years oldis used as an indicator, because the effects of malnu-trition are more noticeable in this age group (10).
For the purposes of a salt fluoridation program,monitoring the nutritional status of preschool chil-dren is especially important, since in children under5 years of age one begins to observe some nutrition-related alterations (caries, fluorosis, etc.) in the teeth.This monitoring will provide information on theprevalence of malnutrition and its trends, on poten-tial problems for oral health, and on the feasibilityand effectiveness of the salt fluoridation intervention.
Because most dentists or coordinators of saltfluoridation programs may have limited experience
EPIDEMIOLOGICAL SURVEILLANCE
73

in evaluating data on nutrition, it is necessary to co-ordinate the monitoring effort with food and nutri-tion institutions. In many countries, food and nutri-tion surveillance systems will already have been setup to select, compile, process, analyze, and interpretdata from existing sources of information (10).
In the context of salt fluoridation, each countryshould establish and test its own procedures formonitoring the nutritional status of preschool chil-dren, always using a minimum of common and safeindicators related to the availability, consumption,and biological utilization of food. Methods for ob-taining the information could include:
• Study of anthropometric measurements ina population sample. In this study, the nutri-tional status of children is evaluated usingweight, height, chest circumference, and tri-ceps skin fold from a sample of children 3–5years old.
• Dietary survey in a population sample. Thissurvey will collect data obtained through con-sultation or questioning, including data on chil-dren’s food consumption, expressed in terms ofnutrients.
The fluoride content of natural or processedfoods that are consumed regularly by the populationwill be determined. In addition, there should be pe-riodic inspection of imported processed food whosecontent specifies that it has been enriched or forti-fied with fluoride; this includes foods suspected ofcontaining fluoride because of water they contain ortheir place of origin.
For quantification of fluoride in food, the follow-ing procedures are recommended:
1. Foods consumed most frequently should begrouped according to United Nations Food andAgriculture Organization classification—forexample, seeds, vegetables, grains, and teas.
2. For selecting food samples, the country’s geo-economic regions should be taken into ac-count—a single region can be included in orcan cover an entire province, but one provincecan also contain several regions—as shouldthe various nutritional areas.
3. Once the food groups are identified, samplesshould be collected and analyzed in the labo-ratory, within 24 hours in the case of perish-able food.
The following two techniques are recommendedfor determining fluoride in food:
Method 1This method is based on separating the fluoridefrom a dry or fresh food sample through diffusion ofthe hydrofluoric acid formed. The fluoride measure-ment is carried out using an ion-specific electrode.
Equipment and Materials:• Potentiometer/ion analyzer• Analytic balance precise to 0.0001 g• Fluoride ion-specific and reference electrodes• Polyethylene petri dish• Volumetric flasks, 100 ml• Pipettes• Convection oven• Magnetic stirrer
Reagents:• Sodium fluoride.• Perchloric acid, 40%.• Silver sulfate.• Sodium hydroxide.• Glacial acetic acid.• Sodium chloride.• A total ionic strength adjuster buffer (TISAB).
Operating Procedure. To prepare the sample, liq-uefy, dry, and grind the food. In the cover of the petridish, place 0.1 ml of 0.5 M NaOH in the form ofdrops (25 to 30 drops) and dry in an oven at 50°C.In the petri dish, weigh 0.1 g of the food and add 0.3 g of silver sulfate and 2 ml of perchloric acid.
Immediately cover the dish with its lid. Agitategently and place the covered petri dish in an oven at45º–50°C for 20 hours. At the end of that time, re-move the cover of the petri dish and add 2 ml ofTISAB; agitate using a small magnetic stirrer to mixthe sample, then read it in the ion analyzer.
To prepare the calibration curve, using pipettes,put 0.1 ml of each work standard (0.00, 0.05, 0.1,0.5, 1.0, 5.0, 10.0, 50.0, and 100.0 µg/ml fluoride)
PROMOTING ORAL HEALTH
74

in petri dishes; add silver sulfate and perchloric acidto each of them in the same quantities as for thesample. Follow the same procedure as was used inthe sample.
Obtaining Results. The fluoride content in the foodsample is determined by interpolation, using thecalibration curve. On semilogarithmic paper, milli-volts are graphed against the logarithm of the stan-dard fluoride concentration, yielding a straight line.Use the equation of the straight line and the milli-volts obtained with the sample to determine the flu-oride concentration in µg/ml.
Method 2This method of fluoride analysis is based on ashproduction.
Samples are washed thoroughly with deionizedwater and broken up with an agate mortar and pes-tle. They are dried for three hours at 110°C; 20 g ofeach sample are taken and mixed thoroughly withone g of calcium oxide in nickel vessels. The pH ismeasured and the samples are dried completely on ahot plate, at which point they will be in a solid state.To produce the ash, the samples are placed in anoven at 500°C for 24 hours.
In the case of tea processing, aliquots of 20 ml areobtained at 0, 3, 5, 10, 15, and 30 minutes of infu-sion. To prepare the infusions, 2.5 g of tea are addedto 250 ml of deionized water (11).
Analysis Method. To determine the fluoride con-tent of each sample, an ion-specific electrode isused, following calibration based on comparisonwith results from fluoride solutions of 0.0, 0.1, 0.5,1.0, and 5.0 ppm. These solutions are preparedfrom a standard fluoride solution and are dilutedwith TISAB.
CHEMICAL MONITORING
Chemical monitoring is a technical procedure thatdetects the presence of a chemical element (in thiscase, fluoride) in a substance such as water or salt,without altering the chemical element.
For fluoride analysis in chemical monitoring, thepotentiometer method is used (based on the Nernst
equation, which gives a simple relationship betweenthe relative potential of an electrode and the con-centration of the ionic species in the solution).
In epidemiological surveillance of a salt fluorida-tion program, chemical monitoring is carried out pe-riodically to detect and quantify fluoride in waterand salt, as described below.
Determining Fluoride in Drinking Water—Wells and Water Supply NetworksPeriodic chemical monitoring of fluoride concentra-tion in drinking water permits inferences to be maderegarding the population’s daily intake of naturalfluoride. Epidemiological studies have demon-strated that there is a relationship between the con-centration of natural fluoride in water and levels ofdental fluorosis and the prevalence and severity ofcaries. Thus, results of water monitoring should beused as feedback to the salt fluoridation program, tocontrol the marketing of fluoridated salt, and to es-tablish the necessary surveillance in places wherethe population is at risk of dental fluorosis.
Where fluoride levels in drinking water are high,institutions responsible for water supply should beurged to consider mixing well water that has highfluoride levels with water with low fluoride levels.Defluoridation of water may soon be another possi-ble solution to high fluoride levels in well water. Inany case, it is the responsibility of health workers toinform the public of measures it can take to reducethe harmful effects of this element (1).
Monitoring the fluoride concentration in drinkingwater should be carried out in accordance with thefollowing guidelines (1).
1. Because the fluoride concentration in aquiferscan vary, monitoring of the concentration ofnatural fluoride in drinking water should becarried out at least twice a year in differentseasons (rainy and dry).
2. To facilitate monitoring of fluoride concentra-tion in drinking water, populations will beclassified according to whether there are morethan 10,000 inhabitants or fewer; dependingon the country’s total population and its geo-graphic distribution, classification based on5,000 inhabitants may be appropriate.
EPIDEMIOLOGICAL SURVEILLANCE
75

3. A national catalog of drinking water sourceswill be prepared; because water supply sys-tems may be opened or closed over time, in-formation on the number and location of wellsand water supply networks should be updatedevery six months.
4. Water samples will be taken from sources usedfor human consumption—the water supplysystem, storage tanks, pumping stations, sup-ply and distribution lines of the delivery sys-tem, wells, and springs.
5. For water sample collection, 125 to 200 mlplastic receptacles will be used, with covers ofthe same material that can be hermeticallysealed.
6. All water samples collected should be labeledand an identification form should be filled outfor each.
7. The potentiometer method with an ion-specific electrode should be used for the fluo-ride analysis. The colorimetric method is notrecommended because it lacks precision.
8. Fluoride concentration in water will be givenin parts per million (ppm) and will be classi-fied according to the following:• Low concentration, 0.00 to 0.39 ppm• Moderate concentration, 0.40 to 0.69 ppm• Optimal concentration, 0.70 to 1.49 ppm• High concentration, 1.50 ppm and aboveNote: For warm climates, the established min-imum optimal concentration is 0.5 ppm; fortemperate and cold climates, it is 0.7 ppm (asshown above).
9. Laboratories should send results of analysesto those responsible for the epidemiologicalsurveillance of the program.
MaterialsTo collect samples for monitoring fluoride in waterthe following materials are necessary:
• Plastic containers (125 to 200 ml) with covers ofthe same material that provide airtight sealing
• Containers or boxes for transferring samples• Self-adhesive labels• Ball-point pens (indelible ink)• Forms for sample identification and for ship-
ment to the laboratory
Sampling the Supply System
1. Open the system valve and allow the water torun for approximately one minute.
2. Before taking the sample, rinse the containertwo or three times with the running water.
3. Take the water sample (fill bottle with water)and put the airtight cover in place.
Sampling Bodies of Surface Water, Storage Tanks,Wells, or Springs
1. Uncover the sample container and submergeit in the water with the neck downwards to adepth of 20 cm to 30 cm. In all cases, avoidtaking the sample from the surface or from adepth greater than 30 cm.
2. When it is not possible to take the sample byextending the arm, tie a weight to the samplecontainer using a clean thread. Lower the con-tainer into the well, unrolling the thread slowly.When the sample has been collected, raise thecontainer and put the airtight cover in place.
Labeling Sample Containers
1. Prepare a report form with date of collection,registration number, sample identification.
2. Write identification data on the labels in in-delible ink.
3. Affix a label to the container and note a regis-tration number with date, and identify thesample.
4. Fill out a form and verify information for flu-oride ion in water to provide complemen-tary data that cannot be noted on the samplecontainer.
Handling the Sample
• Place the labeled samples in a box or containerthat will not be damaged by the weight.
• Keep water samples cool until they are re-ceived by the laboratory.
Control of the Samples
• Deliver samples with their corresponding formsto the laboratory.
• Keep a list of the samples delivered.
PROMOTING ORAL HEALTH
76

Chemical Analysis of the Samples
• Use the potentiometer method to analyze thewater samples.
• Store samples for no more than 15 days beforedelivering to the laboratory.
• Analyze the samples and fill out the section ofthe form that corresponds to the laboratory foreach sample.
• Record results in parts per million (ppm).• Send results to those responsible for the pro-
gram’s epidemiological surveillance.
Determining Fluoride in Water SuppliesTo determine fluoride in water the potentiometermethod (which is based on the Nernst equation)should be used (11).
Equipment and Materials
• Potentiometer/ion analyzer• Fluoride ion-specific electrodes• Reference electrodes• Thermometer, 0.00 to 50°C• Magnetic stirrer• Analytic balance precise to 0.0001 g• Nalgene material (plastic) • Volumetric flasks, 100 ml and 1,000 ml• Volumetric pipettes, 1, 2, 3, 5, 10, 25, and 50 ml
Reagents
• Distilled water• Glacial acetic acid• Sodium citrate• Sodium hydroxide• Sodium chloride• Sodium fluoride• Hydrochloric acid, 37%• Tris (hydroxymethyl) amino methane• Sodium tartrate• TISAB
Preparation of TISABLow-level TISAB. To a 1,000 ml precipitationflask, add 500 ml of distilled water, 57 ml of glacialacetic acid, and 58 g of sodium chloride. Stir themixture until the salt is completely dissolved and
allow to cool. The pH electrode is introduced intothe solution and 5 M NaOH sodium hydroxide isadded gradually, until the pH is between 5.0 and5.5. The cooled solution is poured into a volumetricflask, and distilled water is added to bring it up tothe 3⁄4 volume.
TISAB IV (when water contains large quanti-ties of iron or aluminum). To approximately 500ml of distilled water, add 84 ml of concentrated hy-drochloric acid (36% to 38%), 242 g of tris (hy-droxymethyl) amino methane, and 230 g of sodiumtartrate. Agitate until the solid is dissolved andallow to cool to room temperature. Transfer to a1,000 ml volumetric flask and dilute just below the1,000 ml mark with distilled water.
Preparation of the Standard CurvePrepare a standard solution at 1,000 ppm using flu-oride of known purity. Working standards are pre-pared by successive dilution and may have the fol-lowing concentrations: 0.1, 0.3, 0.5, 1.0, 1.5, and2.0 ppm. The same volume of TISAB should beadded to all the standards (maintaining a 1:1 ratiobetween the standard volumes and TISAB).
Measurement of Fluoride IonAn aliquot of 25 ml of water is added to an emptyplastic precipitation flask, to which is added anequal volume of TISAB. The resulting mixture is ag-itated using a magnetic stirrer; the electrodes are in-troduced; and after three minutes the reading istaken in millivolts. Before reading the samples, theelectrodes are conditioned, and the (working) stan-dard curve is read. The fluoride concentration in thesample is determined by interpolation using the cal-ibration curve (fluoride standards of 0.1, 0.3, 0.5,1.0, 1.5, and 2.0 ppm).
When direct-reading potentiometers are utilized,fluoride concentration in ppm is obtained directly.
MONITORING FLUORIDECONCENTRATION IN SALT AND IN THEDISTRIBUTION NETWORK
Another aspect of chemical monitoring involves theconcentration of fluoride in salt; once fluoridation is
EPIDEMIOLOGICAL SURVEILLANCE
77

initiated, quality assurance consists of controllingthe dosage of the product.
This monitoring will make it possible to knowwhether fluoridated salt that is being produced andmarketed complies with legislative provisions, andensures that the population consumes salt with theadequate fluoride dosage—one that prevents carieswithout risk of dental fluorosis.
Monitoring of fluoride concentration in salt is es-tablished at the time that the production of fluori-dated salt begins, and monitoring should continuethroughout the duration of the salt fluoridation pro-gram (1, 12).
Quality Control in the Salt Plant’s Production Process
(a) For control of reagent dosage, the operatorwill be responsible for taking a sample every twohours from what drops from the helicoids conveyor,in order to analyze it and take corrective actions ifnecessary. In a small-scale salt plant, the sample willbe taken from the hoppers after mixing, and will beanalyzed so that corrective measures can be taken.
(b) The fluoride content in samples that areanalyzed in the laboratory will be certified, and adaily report issued and made available to healthauthorities.
(c) For the analytical determination of fluoride,the potentiometer method will be utilized, with ion-specific and reference electrodes, or a combinationelectrode.
(d) It is suggested that a computer program(quality-alert software) be used to help managemonitoring, enabling data to be processed daily anda report generated monthly for industry and healthauthorities.
The leading indicators for monitoring the pro-duction process are the following:
X, arithmetic meanR, rangeO, standard deviationCPI, process control constant
Quality control in the production processby health authorities
(a) Prepare and update a catalog of all salt-producing plants that participate in the program.
(b) Develop a schedule so that health authoritiescan obtain samples from all plants and certifyequipment and facilities.
(c) Collect salt samples in plants during the pro-duction process.
(d) Analyze salt samples in laboratories involvedin monitoring the salt fluoridation program.
(e) Report results of monitoring and any obser-vations to the plants, indicating any sanctions, ifwarranted.
(f) Collect and analyze, from time to time, sam-ples from salt packages that weigh over 20 kg andthat are transported in vehicles for prolonged peri-ods of time over long distances; this is done to ver-ify the homogeneous distribution of fluoride in thesalt, or its separation, produced by vibration fromthe moving vehicle.
Quality Control of the Plant’s Distribution(a) All deliveries will be controlled for type of
product and brand name, to ensure that the type ofsalt corresponds to the area where it is intended tobe marketed
(b) With regard to transportation of salt, theshipper should present copies of shipping invoicesand the shipping manifest, showing the originalstamps that indicate receipt of the product by theclients in question; this ensures that each type of saltis delivered to the point of sale where it should beconsumed.
Quality Control of Distribution by HealthAuthorities
(a) Once fluoridated salt leaves the salt plant forwarehouses and points of sale, the end product (bagor box) should be sampled to determine the fluoridecontent, and to compare it with the concentration es-tablished by the fluoridation program in the country.
PROMOTING ORAL HEALTH
78

(b) An annual schedule for sampling salt atpoints of sale and storage sites should be set up. Thefrequency of sampling should be dictated by theschedule of deliveries from salt plants or by the in-frastructure of the laboratories.
(c) Salt sampling should be conducted by healthinspectors, personnel responsible for the salt fluori-dation program, or staff trained for this purpose.
(d) Sampling will be carried out in areas wherefluoridated salt is sold, as well as where its sale is pro-hibited, in order to confirm appropriate marketing.
(e) The collected information should be recordedin a format specified for this activity.
(f) Closed salt packages will be obtained for sam-pling. When the required sample is fewer than fivepackages (1-kg bags or boxes), the municipality,community, or locality (area) should be selected atrandom.
(g) When the sample consists of five packages (1-kg bags or boxes) or more, and more than onemunicipality (area) is involved, the sampling shouldbe distributed proportionately; the communities orlocalities within the municipality should be selectedat random.
(h) The results obtained should be sent to the ap-propriate health authories in order to comply witheach country’s health requirements, regulations, orofficial standards for fluoridated salt.
(i) Safety measures should be applied when it isdetected that the establishment where fluoridatedsalt is marketed or distributed does not meet theminimum sanitary standards or if it is confirmed orsuspected that the product does not meet the re-quirements or could be harmful to the population,safety measures should be applied.
MONITORING FLUORIDATED SALT INPLANTS, WAREHOUSES, AND POINTSOF SALE
Sampling in the Plant by Health Workers(a) A salt sample will be taken every hour until at
least five samples have been collected directly fromthe hoppers or from material that falls from the he-
licoid conveyor during production. Each sample willbe divided into three equal parts, and each partplaced in a plastic bag.
(b) Each sample (minimum 5g) will be identifiedas to:
• the type of salt (with fluoride or withoutfluoride),
• lot number, and• date.(c) One of the samples will be delivered to the salt
plant to be analyzed in its laboratory; the other sam-ple will be sealed and kept as a control for any clar-ification that may be necessary; the third samplewill be analyzed in the health sector laboratory.
Sampling at Points of Sale andWarehouses by Health Workers
(a) A minimum of five samples, selected ran-domly, will be collected per lot. Each sample willbe completely collected in its original packaging(bag or box).
(b)• A label will be affixed to the original packag-
ing, so as not to cover important product data.• On that label, the identification of the sample
number and date of sampling should be noted.• A form should be filled out for shipping sam-
ples to the laboratory. The labeled samples areplaced in a plastic container for transfer to thelaboratory.
Analysis of the Samples
• Samples will be delivered to the laboratorywith their corresponding forms, including a listof the samples being delivered.
• Samples should be stored for no longer than 15days.
• For analyzing the fluoride concentration insalt, the potentiometer method (with fluorideion-specific and reference electrodes) will beused.
EPIDEMIOLOGICAL SURVEILLANCE
79

• Results will be sent to those responsible for thesalt fluoridation program or forwarded for epi-demiological surveillance.
• The salt plants, warehouses, or points of salewhere samples were collected will be notifiedof sampling results.
Fluoride Determination in SaltThe ion-specific electrode technique is used to de-termine fluoride in salt for human consumption.
Equipment and Materials
• pH meter and ion analyzer• Fluoride ion-specific and reference electrodes• Water bath• Thermometer, 0.00 to 50°C• Magnetic stirrer• Analytic balance precise to 0.1 mg• Nalgene material (plastic)• Precipitation flasks, 100 ml and 1,000 ml• Volumetric pipettes, 1, 2, 3, 5, 10, 25, and 50 ml
Reagents
• Distilled water• Glacial acetic acid• Sodium chloride• Sodium citrate• Sodium fluoride• Sodium hydroxide• TISAB
PreparationInto a 1,000 ml precipitation flask, pour 500 ml ofdistilled water and add 57 ml of glacial acetic acid,58 g of sodium chloride, and 12 g of sodium citrate.Stir the mixture until the solids are completely dis-solved, then allow to cool.
Introduce the pH meter electrode in the solutionand add 5 M sodium hydroxide (NaOH) until the pHis between 5.0 and 5.5. Once cooled, pour the solu-tion into a 1,000 ml volumetric flask and add distilledwater to bring the liquid level up to the 1,000 mlmark. The solution is stored in a cool dark place.
Preparation of the Calibration CurvePrepare a standard solution at 1,000 ppm, usingsodium fluoride of known purity. By successive dilu-tion, standard solutions with the following concen-trations are prepared: 1, 3, 5, 8, and 10 ppm. Thecalibration curve should be constructed using at leastfive points. To all the standards an equal volume ofTISAB should be added.
MONITORING THE MARKETING ANDUSE OF FLUORIDATED SUPPLEMENTS(DROPS AND TABLETS)
The study of systemic fluorides already on the mar-ket, such as drops or tablets, and the frequency withwhich the population uses them, should be carriedbefore production of fluoridated salt begins. Peri-odic monitoring should continue as long as thesesupplements are marketed; precautionary measuresmay be called for, such as withdrawal of these prod-ucts from the market or restriction of their avail-ability by requiring medical prescription.
Although systemic fluorides should be used by inall countries and regions as a public health measureto reduce the prevalence of caries, each country orregion should use only one such measure, to preventexcessive fluoride ingestion. For example, as statedpreviously, fluoridated salt should not be distributedin communities whose water has sufficient fluorideconcentrations. Nor should fluoridated supplements,such as drops and tablets, be used where fluoridatedsalt is already consumed, because it poses a risk ofdental fluorosis.
In Phase I of a salt fluoridation program (feasi-bility assessment), a baseline study of the marketingand use of fluoridated supplements will be con-ducted. In Phase II (first evaluation) and Phase III(consolidation and maintenance), continuous moni-toring will be carried out as part of the epidemio-logical surveillance that the program requires.
In order to monitor the fluoridated supplements,do the following:
1. Collect the names and specifications of fluoridesupplements on the market and the names of
PROMOTING ORAL HEALTH
80
their manufacturers. This information can beobtained through institutions responsible forregistering supplies and drugs in the healthsector.
2. Eliminate fluorides for systemic use from listsof basic drugs used by institutions providinghealth services.
3. Develop a proposal to enact legislation, so thatadditional sources of fluoride intake arebanned, such as fluoridated supplements, dropsand tablets.
4. Establish protocols for health authorities to ver-ify if fluoride products are being produced. Iffluoride products are available, health authori-ties should test product samples from points ofsale to verify their quality and determine in theappropriate laboratories the fluoride content ofsupplements (drops and tablets).
5. Prepare a program to inform health profes-sionals (dentists, physicians, etc.) about therequirement that fluorides for systemic useonly be available by prescription.
MONITORING THE USE OFFLUORIDATED TOOTHPASTE INPRESCHOOL CHILDREN
As mentioned previously, children under 5 ingestsignificant quantities of fluoride when using fluori-dated toothpastes. Depending on the frequency ofbrushing and the quantity ingested, children can be at risk of developing dental fluorosis, since thequantity of fluoride in ingested toothpaste is close tothree times that from dietary sources (13). It shouldbe stressed here how important it is for dental pro-fessionals to become involved at the very beginningof salt fluoridation projects. Dentists must be wellinformed about the advantages of using low-fluoridetoothpastes. Furthermore, such toothpastes are gen-erally desirable, whether or not systemic fluoride isadministered through salt or water or not at all.
Thus, it is necessary to conduct a baseline studyin Phase I of a salt fluoridation program and tocarry out periodic monitoring during Phases II andIII to determine the number of preschool children
using fluoridated toothpastes and the fluoride con-centration in those products, with a view to imple-menting actions by health workers and parents topromote oral health. Stress should be placed on theimportance of supervising children’s toothbrushing,instructing them to use small quantities of paste,and of teaching them to avoid swallowing it.
General guidelines for monitoring toothpaste useby preschool children include:
1. Identify all toothpastes in the market andtheir fluoride concentrations; this informationcan be obtained from chambers of commerce.To confirm the fluoride concentration oftoothpases, samples should be collected forlaboratory analysis.
2. In a population sample of mothers and pre-school children, periodically program the useof directed interviews and/or questionnaireson toothpaste use and frequency of brushingby children.
3. Encourage the plants that manufacture oralhygiene products to produce children’s tooth-pastes with fluoride concentrations from 250to 500 ppm.
4. Prepare a mass communication program onthe proper use of fluoridated toothpaste bychildren under 5.
References
1. México. Secretaría de Salud. Programa Nacional deFluoruración de la Sal. Dirección General de Medi-cina Preventiva, 1994.
2. Mena García AE, Rivera L. Epidemiología bucal:conceptos básicos. Caracas: OFEDO/UDUAL; 1991.
3. Vidal P LM, Reyes Zapata H. Diseño de un sistemade monitoría. Salud Pública de México 1993;35(3):326–331.
4. Organización Panamericana de la Salud. Recomen-daciones para la vigilancia epidemiológica del Pro-grama Nacional Preventivo de Fluoruración de laSal. Washington, DC: OPS; 1995.
5. Organización Mundial de la salud. Encuestas desalud bucal. Métodos básicos. 3ra. ed. Ginebra: OMS;1994.
6. Fluorosis dental. México: Universidad AutónomaMetropolitana; 1991. Cuadernos CBS.
EPIDEMIOLOGICAL SURVEILLANCE
81

7. Mora Guevara LA, Sánchez Ruíz JF. Muestreo apli-cado en salud bucal. Vigilancia epidemiológica delPrograma de Fluoruración de la Sal. México; 1995.Recopilación bibliográfica.
8. Murray JJ. El uso correcto de fluoruros en saludpública. Ginebra: Organización Mundial de la Salud;1986.
9. Salas Pereira MT. Manual de ingeniería de la fluoru-ración de la sal. Costa Rica: Organización Panameri-cana de la Salud. Costa Rica, 19baseline.
10. Organización Panamericana de la Salud. VigilanciaAlimentaria y Nutricional en las Américas. Una Con-
ferencia Internacional. México, 5–9 de septiembre de1988.
11. Official Methods of Analysis of the Association of Of-ficial Analytical Chemists. 11th ed. Washington, DC;1970:405–411.
12. Memorias del I Foro Nacional de la Industria Sali-nera. México: Asociación Mexicana de la IndustriaSalinera, AC; 1991.
13. Ophaug R. Dietary fluoride intake of infants andyoung children and the effect of supplemental andnondietary sources of fluoride. Comp Cont Ed Dent1988:9:68.
PROMOTING ORAL HEALTH
82


Dust of the sea, in you the tongue receives a kiss from ocean night: taste imparts to every seasoneddish your ocean essence;the smallest, miniaturewave from the saltcellarreveals to usmore than domestic whiteness;in it, we taste infinitude.
Pablo Neruda, excerpt from “Ode to Salt”

TOOL-KIT FOR
DECISION-MAKERS,HEALTH PLANNERS,
LEGISLATORS,EPIDEMIOLOGISTS, AND
HEALTH WORKERS


A salt fluoridation program’s long-term sur-vival depends on the active participation oflocal authorities and the country’s salt in-
dustry. PAHO’s Regional Oral Health Program rec-ommends that a country technical officer (CTO) bedesignated in each country to act as a liaison be-tween health authorities and the salt industry, andas project coordinator and educator for the pro-gram. This person also would provide assistance ondisbursing funds and would coordinate consultantwork dealing with project components under devel-opment. The CTO’s additional functions would in-volve attending periodic meetings of the country’ssalt fluoridation commission, expediting the devel-opment of legal documents designed to enforce saltfluoridation, and providing coordination and assis-tance in identifying funding sources for aspects ofthe program that might not be funded by external orinternal donors.
PAHO’s Regional Oral Health Program, throughthe Organization’s Advisory Board on Oral HealthPrograms, issues recommendations for improvingprojects and sets protocol guidelines and specific re-quirements based on scientific evidence. Research andcountry studies are discussed, and a consensus is pre-sented to the project directors in the countries for
implementation. In February 1998, the Regional OralHealth Program convened a group of scientific ex-perts in Washington, D.C., to evaluate technical as-pects of salt fluoridation programs, using existing sci-entific evidence as a reference. That group submittedrecommendations to PAHO, which were approved byrepresentatives of salt fluoridation programs in 19countries at the First Regional Workshop on Salt Flu-oridation held in Quito, Ecuador, in July of the sameyear.1 The recommendations included issues such aswhich type of salt fluoridation program should bemaintained in each participating country, which pro-grams needed to be phased out, and what instrumentsto use for data collection to monitor program imple-mentation. The last item is an extension of monitor-ing sections included in the overall proposal. The rec-ommendations also stressed two qualifiers. Essentialitems are those that must be implemented becausethey are vital for the success of the program. Non-essential recommendations are important but not vi-tal; non-essential recommendations could be optional.
8. PAHO’S RECOMMENDATIONS
FOR SETTING UP AND OPERATING
A SUCCESSFUL SALT
FLUORIDATION PROGRAM
87
1Organización Panamericana de la Salud. Taller Regional deVigilancia epidemiológica y Control de Calidad de los Programasde Fluoruración de la Sal. Primer Simposio Internacional sobreel uso de fluoruros como medida preventiva de caries dental.Quito, Ecuador, 27 al 30 de julio, 1998. Informe final.

The recommendations issued during the Quito work-shop, which remain valid, are the following:
RECOMMENDATIONS
1. Only one systemic source of fluoride is rec-ommended for each country. This should beeither salt or water, but not both.
2. Dental caries should be monitored to evaluatethe effectiveness of the preventive program.Both baseline and follow-up studies are rec-ommended (however, only the baseline studywas within the scope of the grant proposal).The baseline survey of dental caries is essen-tial and should target children 6, 8, 12, and15 years old The recommended survey uses atooth-based index (DMFT) and the diagnosticcriteria and coding recommended by WHO.In addition to the DMFT, which is essential, asurface-based index (DMFS) provides specificinformation about different types of cariespredilection sites with strongly differingdavier-proneness (fissures and pits, approxi-mal surfaces, free smooth surfaces) but is notmandatory for assessment of the public healthimpact of the preventive program.
3. Dental fluorosis indicates past exposure tofluoride and should be monitored to assessunacceptable cosmetic effects of systemicfluoride overuse during years when perma-nent teeth are developing. Dental fluorosis isto be measured by a modified version ofDean’s Index that includes only the upperanterior teeth (cuspid to cuspid). Only thefacial surfaces should be evaluated using thesix categories described by Dean. Otherteeth, while not essential, could be included.
4. Urinary fluoride excretion should be moni-tored to evaluate current exposure to fluo-ride. The target population for urinary fluo-ride excretion studies involves children 3–5years old. This study, although highly recom-mended, was considered non-essential. Ac-cording to WHO recommendations, thesestudies should be carried out immediately be-fore introducing systemic fluoride and then 6and 12 months after initiation. PAHO’s rec-
ommendations were modified to include onlyone evaluation, 24 months after the programwas initiated, but stated that a baseline studycould be included if the country considered itnecessary. A 14–18 hour period was consid-ered an acceptable protocol for urine collec-tion (1). In addition, this study should beconducted in clusters of 30–35 children incommunities with suboptimal, optimal, andabove-optimal concentration of fluoride indrinking water; follow-up studies should in-clude communities were fluoridated salt isdistributed.
5. Conducting a baseline study of fluoride con-centration in water for human consumptionis essential. In all participating countries,fluoride occurs naturally, and its concentra-tion may vary seasonally and as a result ofgeological activities. Consequently, all watersources with fluoride concentrations above0.5 ppm should be monitored on an ongoingbasis to avoid overexposure were the fluoridecontent of the water to increase after the in-troduction of salt fluoridation.
6. A nutritional survey to determine the con-sumption and ingestion of salt is considerednon-essential. Data from previous nutri-tional studies could be used.
7. Regarding additional sources of fluoride in-take:a. The use of dietary fluoride supplements
such as drops, tablets, or multi-vitaminsthat contain fluoride should be stopped.This recommendation could be carriedout by monitoring the presence of theseproducts in the market and by conductingsurveys of health practitioners or parents.
b. In a country that has a national systemicsalt fluoridation program in place, pro-grams advocating the use of fluoridemouth rinses to provide additional topicalpreventive effect should not be put inplace if the DMFT at age 12 falls below 3.In countries that do not have a nationalsalt fluoridation program, fluoride mouth-rinse programs should be continued if theDMFT index is greater than 3; if the indexis less than 3, these programs can continue
PROMOTING ORAL HEALTH
88

if they have been shown to be cost-effective. Fluoride mouth rinses shouldonly be provided to children older than 6years; at this age, the swallowing reflex issufficiently developed to avoid accidentalingestion of the product. Even if theseolder children swallow the product, the ef-fect on dental fluorosis is negligible be-cause most anterior teeth have been fullyformed at this age.
c. The use of fluoridated toothpaste ishighly recommended. In children youngerthan 6 years, only a pea-sized portion of toothpaste should be delivered by theparent/guardian. Moreover, toothbrush-ing with fluoride toothpaste by childrenunder 3 years old should be superviseddirectly by the parent or guardian. It isrecommended that children under 6 yearsold should use toothpaste with a fluorideconcentration between 400 and 550 ppm.Children older than 6 years should usethe standard formulated fluoride tooth-paste (between 1,000 and 1,500 ppm). Abaseline survey followed by periodic sur-veys of toothpaste use are part of the on-going monitoring recommendation. Peri-odic evaluations could be performedthorough sales and import data.
d. Oral health promotion and toothbrushingtraining should continue after the imple-
mentation of national programs usingsystemic fluoride.
8. The recommended range of fluoride concen-tration in salt for human consumption is200–250 mg/k (equivalent to 250 ppm F).The actual concentration should be adjustedbased on the level of urinary fluoride excre-tion, the level of fluoride in the drinkingwater, and the prevalence and severity of flu-orosis that accounts for the time-lapse be-tween when fluorosis is observed and whenexposure occurred.
9. Countries should assess the existing and reg-ulatory framework that supports or hampersthe introduction and sustainability of fluori-dation programs. This requires the review ofexisting laws and regulations, and the pro-motion of new or supplementary ones. Also,a regulatory mechanism for quality controlshould be part of the regulations concerningdosage. The Regional Oral Health Programwill promote the introduction of fluoridatedsalt in the Codex Alimentarius.
10. Continuing education to the public and tohealth professionals is essential.
Reference
1. Marthaler TM (ed). Monitoring of renal fluoride excre-tion in community preventive programmes on oralhealth. Geneva: World Health Organization; 1999.
PAHO’S RECOMMENDATIONS
89
if they have been shown to be cost-effective. Fluoride mouth rinses shouldonly be provided to children older than 6years; at this age, the swallowing reflex issufficiently developed to avoid accidentalingestion of the product. Even if theseolder children swallow the product, the ef-fect on dental fluorosis is negligible be-cause most anterior teeth have been fullyformed at this age.
c. The use of fluoridated toothpaste ishighly recommended. In children youngerthan 6 years, only a pea-sized portion of toothpaste should be delivered by theparent/guardian. Moreover, toothbrush-ing with fluoride toothpaste by childrenunder 3 years old should be superviseddirectly by the parent or guardian. It isrecommended that children under 6 yearsold should use toothpaste with a fluorideconcentration between 400 and 550 ppm.Children older than 6 years should usethe standard formulated fluoride tooth-paste (between 1,000 and 1,500 ppm). Abaseline survey followed by periodic sur-veys of toothpaste use are part of the on-going monitoring recommendation. Peri-odic evaluations could be performedthorough sales and import data.
d. Oral health promotion and toothbrushingtraining should continue after the imple-
mentation of national programs usingsystemic fluoride.
8. The recommended range of fluoride concen-tration in salt for human consumption is200–250 mg/k (equivalent to 250 ppm F).The actual concentration should be adjustedbased on the level of urinary fluoride excre-tion, the level of fluoride in the drinkingwater, and the prevalence and severity of flu-orosis that accounts for the time-lapse be-tween when fluorosis is observed and whenexposure occurred.
9. Countries should assess the existing and reg-ulatory framework that supports or hampersthe introduction and sustainability of fluori-dation programs. This requires the review ofexisting laws and regulations, and the pro-motion of new or supplementary ones. Also,a regulatory mechanism for quality controlshould be part of the regulations concerningdosage. The Regional Oral Health Programwill promote the introduction of fluoridatedsalt in the Codex Alimentarius.
10. Continuing education to the public and tohealth professionals is essential.
Reference
1. Marthaler TM (ed). Monitoring of renal fluoride excre-tion in community preventive programmes on oralhealth. Geneva: World Health Organization; 1999.
PAHO’S RECOMMENDATIONS

In this era of expanding international trade, lawsestablishing product standards have become in-creasingly important. Furthermore, strict quality
control of a food product such as salt is necessary toprotect consumers and to ensure the effectiveness of salt fluoridation programs. The Pan AmericanHealth Organization studied existing legislation cov-ering salt iodization as a way to issue recommenda-tions for the enactment of unified legislation andstandards for salt iodization and salt fluoridation.Working with a lawyer consultant and using existinglegislation from Mexico and Ecuador as a basis,PAHO came up with the legislative blueprint that ispresented in this section. Countries wishing to enactsuch legislation can use it as is, or may modify it tosuit their particular circumstances.
WHEREAS:
I. Iodine and fluoride deficiencies are a serioushealth problem for the country due to theirimpact on both health and the economy;
II. Their rising incidence causes significant dete-rioration, mainly in the population with lim-ited economic resources;
III. One of the most effective preventive measuresagainst iodine deficiency disorder and dentalcaries consists of the addition of iodine and flu-oride to salt destined for human consumption;
IV. The success achieved in the eradication of en-demic goiter in the Americas through massconsumption of iodized salt indicates that saltwould also be an appropriate vehicle for flu-oride intake.
THE FOLLOWING IS DECREED:
Unified Regulations Of The Law On MandatoryIodization Of Salt For Human ConsumptionAnd The National Fluoridation Program
Section I.
DefinitionsArt. 1. “Salt for human consumption without
other additives” is the designated term for the com-mercially pure or purified product chemically iden-tified as sodium chloride, extracted from naturalsources. It is found in the form of colorless crystalsthat are soluble in water and have a clear salty taste;its consumption is authorized by the Health Author-ity. Excluded from this definition is salt utilized fornon-dietary industrial purposes.
Art. 2. “Salt destined for human consumption”is considered to be for both direct and indirectconsumption.
Art. 3. “Salt for direct human consumption” isunderstood as that used in the kitchen and at thetable in the preparation and seasoning of food.
9. A LEGAL FRAMEWORK FOR
MANDATORY IODIZATION AND
FLUORIDATION OF SALT
90

Art. 4. “Salt for indirect human consumption” isunderstood as that utilized in the food industry as apreservative and seasoning and, in general, as anadditive in food processing.
Art. 5. “Salt for animal consumption” is the termused for the product made from sodium chloridethat is utilized only in the feeding of animals.
Section II
General Sanitary RegulationsArt. 6. The periodic monitoring of salt for human
consumption is the exclusive function of the Ministry ofPublic Health through the corresponding department.
Art. 7. All salt produced in the country for directhuman consumption (domestic salt)—that is, tablesalt and kitchen salt—must be iodized or iodizedand fluoridated prior to its sale.
Art. 8. Salt for human consumption, listed by thecharacteristics, purity, and granulation indicated inthese Regulations, is classified into three groups:ground salt, refined salt, and table salt.
Art. 9. Salt for human consumption should be pre-sented in the form of white cubic crystals, bonded to-gether to form small pyramids with a quadrilateralbase.
The different types of granulated salt must beuniform within each type. In addition, theymust be free of nitrites, impurities, and mi-croorganisms that would indicate improperhandling of the product—that is, coliform andother pathogenic and chromogenic microor-ganisms must not be present. The basal germcount may not be higher than 20,000.
Art. 10. Ground refined salt is the producttreated to eliminate hygroscopic magnesium andcalcium salts, organic impurities, sand, and shellfragments; the crystals should pass through a No. 20mesh sieve and at least 25% should pass through aNo. 60-mesh sieve. Furthermore, its physical andchemical characteristics should satisfy the criteriaand standards with the following limits:
• Moisture no greater than 2% at 150°C. • Insoluble residue in water no greater than 0.3%.• Sodium chloride (on a dry basis, free of anti-
humectants) no less than 98%.• Degree of turbidity no greater than 25%.
Art. 11. Table salt has the same granulation andphysical and chemical constants as those establishedfor refined salt, except that the moisture contentshould not exceed 0.5%. This limit requires that an-tihumectants be added, not to exceed 2%; this willallow sodium chloride content to fall to 96%.
Art. 12. Salt for direct human consumptionshould be iodized, or iodized and fluoridated, andshould meet the specifications and sanitary stan-dards for each type as described here. It should con-tain iodized salt, a product consisting basically ofsodium chloride (NaCl), to which has been addedpotassium iodate or sodium iodate (KIO3 or NaIO3,respectively) or potassium iodide (KI), and whichhas a free iodine concentration no greater than 75 mg/kg of salt, with a tolerance of ±25 mg/kg ofsalt. These concentrations may be modified by theMinistry of Public Health, in response to the findingsof the respective nutritional surveys and when justi-fied by epidemiological studies on iodine dosage.
Art. 13. Iodine should be added only by usingpotassium iodate or sodium or potassium iodide. Flu-oride should be added by using sodium fluoride orpotassium fluoride (NaF or KF, respectively), in ac-cordance with the dry or wet method of production.
Art. 14. Salt for human consumption destined formanufacturing industries other than the food indus-try is exempt from fluoridation.
Art. 15. Salt for human consumption must bepackaged in new containers that preserve the prod-uct’s integrity, offering adequate protection againstcontamination and moisture. Packaging materialthat comes in contact with the product must not bebroken down by the product and must have proper-ties so that it does not alter the product’s taste orsmell.
Art. 16. Establishments and facilities involved inthe industrial production of salt for human con-sumption also must comply with the general re-quirements stipulated by the Sanitary Code and thepresent Regulations.
Art. 17. The production and fractionation ofiodized salt for indirect use may only take place infacilities previously authorized by the health au-thority and the Ministry of Public Health.
Art. 18. Individual or corporate entities that ownthe facilities mentioned in Art. 17 must comply withthe requirements established by the Sanitary Code.
A LEGAL FRAMEWORK FOR MANDATORY IODIZATION AND FLUORIDATION OF SALT
91
Art. 19. Centers for the production, fractionation,packaging, or repackaging of iodized salt and fluor-idated iodized salt or of salt for indirect humanconsumption must also comply with technical re-quirements stipulated in the section of the SanitaryCode that applies to environmental sanitation andequipment.
Art. 20. In order to guarantee the correct additionand persistence of iodine and fluoride in the salt, theproducer must use an efficient, economically feasi-ble process, utilizing the wet method which guaran-tees homogeneous distribution of the elements, sothat a random sample satisfies the requirements forcontent of iodine and of fluoride established in thepresent Regulations.
Art. 21. Imported salt for direct or indirecthuman consumption that is marketed in the countrymust comply with the specifications in the Law withregard to physical, chemical, and microbiologicalproperties and the addition of micronutrients (io-dide or iodide and fluoride).
Art. 22. Plants that refine and purify salt forhuman consumption must have stainless steelequipment, given the high degree of corrosion thatthis raw material causes.
The plant will consist of:
(a) A drum dryer that produces a contiguous saltcurtain, purifying it and raising its tempera-ture to 120°C throughout.
(b) A cyclone turbine system that removes im-purities that become separated from theproduct as it passes through the drum dryerby means of a strong current of air.
(c) Screening equipment with stainless steel meshto avoid contamination of the product by rust.
(d) Mechanized transport from one stage of theprocess to another, with no operator cominginto contact with the product.
(e) Precision mixer, given the low dosage ofpotassium iodide and sodium or potassiumfluoride to be incorporated. This is a verticalconic mixer with highly precise epicycloidalmovement that consists basically of a conicshaft with an Archimedes’ screw incorpo-rated in its interior to provide the homoge-nization of the mixture required by the Min-istry of Public Health.
(f) Fully automated packaging for salt forhuman consumption in which the full cyclecan run its course without human handstouching the product once it has been refined.
The equipment detailed above is the minimumrequired for these processes. Quality control must beexercised in incorporating iodine and fluoride: twosamples must be collected from each batch from themixer, labeled with the date and batch number, andanalyzed; the information must be made availableto the Ministry of Public Health for 45 days. Salt re-fining and purifying plants, as well as facilities forpackaging salt for human consumption, must be li-censed by the Ministry of Public Health.
Section III
Container and LabelingArt. 23. Packaging of iodized and iodized fluori-
dated salt for direct consumption must be carried instrict compliance with the conditions stipulated inArt. 15 of these Regulations.
Art. 24. The container for the sale of iodized andiodized fluoridated salt must bear a visible label inthe country’s official language with clear letteringthat shows the name and patent, if any, as well asthe following:
• The designation “iodized salt for human con-sumption” or “iodized fluoridated salt for hu-man consumption.”
• The net contents of the product in the con-tainer, expressed in decimals.
• Name and location of the manufacturer, sani-tary registration number, and patent and lotnumbers.
• The wording, “Manufactured in its country oforigin.”
• Declaration of the additives used.• Warning, in the case of fluoridated iodized salt:
“Do not consume or sell this product in areaswhere water for human consumption has fluo-ride levels higher than 0.7 ppm.
Art. 25. The container for the sale of salt for in-direct human consumption must bear a visible labelin the country’s official language, stating:
PROMOTING ORAL HEALTH
92
1. The designation: “Salt for use in the food in-dustry.”
2. Net contents expressed in decimal metric sys-tem units.
3. Name and location of the manufacturer, sa-nitary registration number, patent and lotnumbers.
Section IV
Monitoring and SanctionsArt. 26. The technical sections of the Ministry of
Public Health shall keep a record of the plants thatproduce salt for human consumption. These recordsprovide such technical information as productionvolume, types of products manufactured, salt distrib-utors, and other necessary data for efficient control.
Art. 27. Individuals, corporations, commercialfirms, etc., listed as owners of factories or establish-ments that produce, package, or repackage iodizedsalt for the food industry, and fortified salt with io-dide and fluoride for human consumption, shall bedirectly responsible for all products delivered forsale that have production defects or packaging defi-ciencies. No excuse aimed at reducing or avoidingsuch responsibility shall be accepted.
Art. 28. The centers where iodized salt and forti-fied salt with iodide and fluoride are sold, such assupermarkets, warehouses, and grocery stores, thatdispense salt that does not comply with the provi-sions of the present Regulations shall be sanctionedin accordance with the penalties established in theSanitary Health Code.
Art. 29. Every salt iodization and fluoridationplant must maintain quality control records of theproduction process. These records must be availableto the health or trade authorities that request them.
Art. 30. Salt destined for nonfood industrial useand that is considered unsuitable for human con-sumption is exempt from the above requirements.
Art. 31. The establishments that produce salt fordirect or indirect human consumption must complywith the sanitary and hygienic standards establishedin the Sanitary Health Code and these Regulations.
Art. 32. Permission to possess common non-iodized and non-fluoridated salt is granted only tothe concession-holders of deposits being exploited,
to manufacturers that refine it or that iodize andfluoridate it, and to those that utilize it for nonfoodindustrial purposes.
Art. 33. The marketing of nationally produced orimported salt for direct or indirect human consump-tion that does not comply with the requirements inthe previous articles, shall be regarded as a crimeagainst the public health, and those responsible willbe sanctioned as provided by the Penal Code.
Art. 34. The National Health Authorities (Min-istry of Public Health) of each country will enforceall provisions in effect on hygiene, quality, iodineand fluoride content, and packaging of salts for di-rect and indirect human consumption, salt for use inthe food industry, and salt for animal consumptionestablished in the present Regulations.
Art. 35. Producers of iodized and fluoridated saltfor direct and indirect human consumption, salt forthe food industry, and salt for animal consumptionand refiners, packagers or repackagers that sell ordistribute salt that do not comply with the provi-sions in the present Regulations will be sanctionedin conformance with the penalties established in theSanitary Health Code.
Art. 36. When violation of the requirements ofquality, iodization, or fluoridation has been verified,the producer or dealer will be sanctioned as estab-lished in the Sanitary Health Code.
Art. 37. Verification of the chemical specifica-tions of fluoride established in these Regulations willbe carried out using a potentiometer with fluorideion-specific and reference electrodes.
Art. 38. Manufacturers of containers for iodizedand fluoridated salt may make them only for personsor companies whose sanitary registration is up-to-date, and every month must submit the list of con-tainers made for salt to the salt fluoridation program.
Temporary Provisions
Country-specific Recommendations
• Tariff barriers should not be considered thebasic criteria for these Regulations.
• Social policies and sanitary criteria shouldprevail over business and/or commercial con-siderations from trade agreements (such as
A LEGAL FRAMEWORK FOR MANDATORY IODIZATION AND FLUORIDATION OF SALT
93

the North American Free Trade Agreement(NAFTA), Mercado Común del Sur (MERCO-SUR), and the European Economic Commu-nity (EEC).
• Laws, decrees, and regulations should be re-viewed so that the programs are implementedeffectively.
• The introduction of iodized salt and iodizedfluoridated salt (where addition of fluoride isnecessary) within the food code should becompulsory.
• Regulations on the additional use of fluorideshould be reviewed to reduce the risk offluorosis.
• Strict monitoring of the salt industries, takinginto account both quantitative and qualitativeconsiderations, should be put in place.
• Strict monitoring of the public sector—partic-ularly epidemiological surveillance and qual-ity assurance of fluoridated salt—should beinstituted.
• International agreements with respect to for-eign trade (import and export) should be fixed.
• The government’s support for the programsshould be ensured.
PROMOTING ORAL HEALTH
94

The three protocols included in this section aremeant to be used by oral health care providersand researchers for collecting and reporting
information on salt fluoridation programs. Theyprovide a systematic approach for the collection ofdata, enabling these health workers to make stan-dard measurements of oral diseases and conditionsas a basis for planning and evaluating salt fluorida-tion programs. They also ensure that the data col-lected is comparable across countries.
The protocols were developed by PAHO’s Re-gional Oral Health Program with the support of acore group of consultants—notably Eugenio Beltrán,Herschel S. Horowitz, Ramón Baez, and OswaldoRuíz—and the participation of all the countries thathave salt fluoridation programs. This team tookWHO standard protocols for determining caries, flu-orosis, and fluoride excretion in children as the foun-dation, and modified them for this purpose.1
1. EXAMINATION PROCEDURES ANDCODING FOR VISUAL-TACTILE ORALHEALTH SURVEYS2
IntroductionA dentist examining an individual patient and anepidemiologist determining the prevalence of dental
disease in a population share many of the sameworking methods. But there are important differ-ences in their goals.
The dental clinician follows diagnostic criteriaand procedures intended to determine the patient’soral health needs. With that in mind, the dentistcompiles an inventory of signs and symptoms, anduses X rays and other diagnostic tools to supplementthe information obtained by direct observation.
In contrast, the epidemiologist looks for descrip-tors of oral health conditions in a population. Theepidemiologist’s goal is to quantify the prevalence ofdisease conditions in the population and to trackchanges in those conditions over time. Oral epidemi-ology studies—such as open-mouth surveys—requirethe examination of a large number of subjects and,usually, the participation of several examiners. Fur-ther, the epidemiologists’ diagnostic criteria andmethods emphasize the reproducibility of results,rather than meticulous detection of the earliest signof disease. To maximize reproducibility, epidemio-logic methods use conservative diagnostic criteria,relying on unambiguous visual evidence of pathol-ogy, rather than the more sensitive clinical or radio-graphic diagnostic aids used in a dental practice. Theprocess by which examiners and their recorders (per-sons recording the data) learn these criteria andmethods is called standardization; quantifying thelevel of standardization is called calibration.
Why are standardization and calibration of ex-aminers and recorders so important in epidemio-logic studies? In data collection, two of the most im-portant issues are validity and reliability. Bias is themain threat to data validity. We all have biases,which, even after professional training, can affect
10. STANDARDIZED
RESEARCH PROTOCOLS
95
1The three protocols in this chapter originally appeared inPAHO’s Regional Oral Health Program’s “Final Report to theW.K. Kellogg Foundation,” Project #43225, Multi-Year Plan forSalt Fluoridation programs in the Region of the Americas (Be-lize, Bolivia, Dominican Republic, Honduras, Nicaragua,Panama, Venezuela), published in Washington D.C. in 2000.2Adapted from WHO’s Oral Health Surveys, Basic Methods 4thedition, 1997.
our ability to be objective. To diminish bias, wemust establish strict diagnostic criteria for each dis-ease or condition we intend to examine. This is whatis meant by standardization.
However, establishing strict standard criteria isnot the only requirement for high-quality data.Physical and psychological factors such as fatigue,uneven interest, indecisiveness, and variations in vi-sual acuity and tactile sense can affect the judgementof examiners. To reduce these factors, a system thatchecks the reliability of examiners and recordersmust be implemented during the examinationprocess. This reliability checking is what is meant bycalibration. Reliability must be assessed between ex-aminers (interexaminer reliability) and in each ex-aminer (intraexaminer reliability).
The process of standardization and calibrationhas two phases. First, oral health care providersmust study and memorize the diagnostic criteriaand procedures described in this chapter. Second,they must undergo a calibration exercise in whichthey will be asked to apply the criteria and methodsin a setting similar to that which will be found dur-ing field-data collection.
Summarizing, the objectives of calibration forepidemiologic studies are (1):
1. To ensure uniform interpretation, understand-ing, and application of diagnostic criteria forthe various diseases and conditions to be ob-served and recorded.
2. To ensure that each examiner can examine toa uniform standard.
3. To minimize variations in examiners and be-tween examiners.
This protocol is divided into two main sections.The first explains the procedures that must takeplace immediately before the oral examinations. Thesecond section provides the coding for different oralhealth conditions to be included in the epidemio-logic survey. Each coding scheme is followed bynotes and special considerations. These notes areimportant, and in reading the chapter you will cometo understand when and why these points are appli-cable before the calibration exercise.
The latest version of the data entry form (“Sam-ple Data-Entry Form Used to Survey Schoolchild-ren”) appears on page 103.
General Instruction and Procedure forExaminationAs an examiner, you will receive from the surveyplanner a list of schools to visit and a guide to theprocedure that should be used to select childrenfrom the school. It is important that you follow theseinstructions, as the validity of the survey depends onyour ability to randomly select children from everyschool that is part of the survey.
The survey planner also will make available to youequipment, instruments, and materials for conduct-ing the survey. The equipment should be arranged ina room within the school. This room should have ac-cess to power outlets, appropriate ventilation andcooling, a waiting area with enough chairs to accom-modate participating children, access to a nearbywater faucet for washing hands and instruments, andaccess to a garbage bin for discarding used material.You will receive an infection-control protocol thatmust be followed during the entire examinationprocess.
When you arrive at the school the day of the ex-amination you should first contact the principal,whom the survey planner has notified of the day andtime of your visit. The principal can help you ap-point a person from the school staff to coordinatethe movement of children from classrooms to the ex-amination room so as to cause the least possible dis-ruption. If your survey includes a parental consentform, each child should bring the form to the exam-ination area.
You will need three chairs to carry out the exam-ination: one for yourself, one for the recorder whowill be writing your diagnosis codes during the ex-amination, and the third for the child being exam-ined. The codes will be written down on a paperform (see “Sample Data Entry Form on page 103)or entered into a data-entry program on a laptopcomputer. Before the child sits in the chair or lies onthe examination table, the recorder collects the con-sent form and transfers the information (identifica-tion number, sex, birth date, age) to the paper form
PROMOTING ORAL HEALTH
96
our ability to be objective. To diminish bias, wemust establish strict diagnostic criteria for each dis-ease or condition we intend to examine. This is whatis meant by standardization.
However, establishing strict standard criteria isnot the only requirement for high-quality data.Physical and psychological factors such as fatigue,uneven interest, indecisiveness, and variations in vi-sual acuity and tactile sense can affect the judgementof examiners. To reduce these factors, a system thatchecks the reliability of examiners and recordersmust be implemented during the examinationprocess. This reliability checking is what is meant bycalibration. Reliability must be assessed between ex-aminers (interexaminer reliability) and in each ex-aminer (intraexaminer reliability).
The process of standardization and calibrationhas two phases. First, oral health care providersmust study and memorize the diagnostic criteriaand procedures described in this chapter. Second,they must undergo a calibration exercise in whichthey will be asked to apply the criteria and methodsin a setting similar to that which will be found dur-ing field-data collection.
Summarizing, the objectives of calibration forepidemiologic studies are (1):
1. To ensure uniform interpretation, understand-ing, and application of diagnostic criteria forthe various diseases and conditions to be ob-served and recorded.
2. To ensure that each examiner can examine toa uniform standard.
3. To minimize variations in examiners and be-tween examiners.
This protocol is divided into two main sections.The first explains the procedures that must takeplace immediately before the oral examinations. Thesecond section provides the coding for different oralhealth conditions to be included in the epidemio-logic survey. Each coding scheme is followed bynotes and special considerations. These notes areimportant, and in reading the chapter you will cometo understand when and why these points are appli-cable before the calibration exercise.
The latest version of the data entry form (“Sam-ple Data-Entry Form Used to Survey Schoolchild-ren”) appears on page 105.
General Instruction and Procedure forExaminationAs an examiner, you will receive from the surveyplanner a list of schools to visit and a guide to theprocedure that should be used to select childrenfrom the school. It is important that you follow theseinstructions, as the validity of the survey depends onyour ability to randomly select children from everyschool that is part of the survey.
The survey planner also will make available to youequipment, instruments, and materials for conduct-ing the survey. The equipment should be arranged ina room within the school. This room should have ac-cess to power outlets, appropriate ventilation andcooling, a waiting area with enough chairs to accom-modate participating children, access to a nearbywater faucet for washing hands and instruments, andaccess to a garbage bin for discarding used material.You will receive an infection-control protocol thatmust be followed during the entire examinationprocess.
When you arrive at the school the day of the ex-amination you should first contact the principal,whom the survey planner has notified of the day andtime of your visit. The principal can help you ap-point a person from the school staff to coordinatethe movement of children from classrooms to the ex-amination room so as to cause the least possible dis-ruption. If your survey includes a parental consentform, each child should bring the form to the exam-ination area.
You will need three chairs to carry out the exam-ination: one for yourself, one for the recorder whowill be writing your diagnosis codes during the ex-amination, and the third for the child being exam-ined. The codes will be written down on a paperform (see “Sample Data Entry Form on page 105)or entered into a data-entry program on a laptopcomputer. Before the child sits in the chair or lies onthe examination table, the recorder collects the con-sent form and transfers the information (identifica-tion number, sex, birth date, age) to the paper form

or data-entry program. After putting on your glovesand before starting the examination, you will ask forthe final parental agreement releasing the child forthe examination. You are now ready to collect dataon the following conditions:
• Dental fluorosis in children aged 12, 15, andadults 35–44.
• Coronal caries/sealants and treatment needs inchildren aged 5, 12, 15, and adults 35–44.
• Prosthetic status in adults 35–44.• Prosthetic needs in adults 35–44.• Urgency of treatment for all ages.
Once you have collected this information, therecorder will transfer the value you have assignedfor “urgency of treatment” to a form with the nameof the person examined. This form should be re-turned to the teacher for distribution or handed tothe child or adult.
Each examination will take less than five minutesand will require your systematic visual or tactile ob-servation and diagnosis of the teeth or surfaces se-lected. Once you have reached a diagnosis for eachtooth or surface, you will provide that information tothe recorder. You should not need to identify thetooth for which you are providing the code, becausethe examination is carried out sequentially and allboxes in the form or data-entry program are filledout accordingly. However, for consistency’s sake,each tooth should be identified using the World Den-tal Federation (FDI) codes shown below.
For assessing dental fluorosis, you should alwaysstart on tooth 13 (upper right cuspid), follow to-ward the midline, and continue to tooth 23 (upperleft cuspid). A total of six codes will be provided tothe recorder.
For assessing dental caries/sealants and treat-ment needs, you will start with tooth 17 (upper rightsecond permanent molar) and continue toward the
midline, ending in the maxillary jaw with tooth 27(upper left 2d permanent molar). You will then con-tinue with tooth 37 (lower left second permanentmolar) and then follow in the opposite direction to-ward tooth 47.
First, you will provide the code for each surface-caries status, meaning five numbers for molars andpremolars and four numbers for incisors and cus-pids (no occlusal surface). In providing the surfacecode for each tooth you will always follow the orderof mesial, distal, buccal, lingual.
Once you have finished with the surface data youwill provide one additional code corresponding tothe treatment need for that entire tooth.
For determining prosthetic status and needs youwill assess the entire mouth following the same pat-tern as in the assessment of caries. You will providetwo codes, one for status and one for needs. Thesecodes apply to the entire person.
Finally, based on your observations, you will ex-plain the code—to the child’s parents or to the adultthat has been examined—regarding the urgency ofneed for treatment.
Important Notes:
1. In this survey you will use the FDI codes thatcorrespond to permanent teeth. The samespaces (cells in the sample data-entry form)will be used for the primary dentition. Differ-entiation between a primary and a permanenttooth will be done based on the code used(mostly numbers for permanent teeth, andmostly letters for primary teeth).
2. Third molars are excluded from examination.3. It is important that the examination and re-
cording follow the same path within the mouthin all subjects. Do not skip teeth or surfaces.
4. The recorder should understand that the ex-aminer will provide six codes for the molars
STANDARDIZED RESEARCH PROTOCOLS
97
Upper right quadrant Upper left quadrant
17 16 15 14 13 12 11 21 22 23 24 25 26 2755 54 53 52 51 61 62 63 64 65
47 46 45 44 43 42 41 31 32 33 34 35 36 3785 84 83 82 81 71 72 73 74 75
Lower right quadrant Lower left quadrant

and five for anterior teeth (including treat-ment). Since this is done sequentially, it is agood idea if the examiner says a key word(e.g., “check” or “midline”) after he or she hasreached the final code for tooth 11, 27, and 31.This allows the recorder to check his or hersynchronization. If there is no congruency inthe sequence, the examiner should restart inthe first tooth of the quadrant.
5. The examiner will call out a total of 169 codesfor each person, regardless of the person’s age.These correspond to the 169 available cells inthe clinical section of the data entry form.
6. All spaces in the data entry form should befilled in before the person leaves the examina-tion area. There are special codes for eachvariable when the person, because of age, doesnot qualify for a specific examination.
Special Diagnostic and Clinical Situationsduring Examination for Dental FluorosisOnly fully-erupted teeth are scored, using a goodsource of artificial light. The teeth should not bedried before scoring.
A tooth is not evaluated for fluorosis if one-thirdor more of the visible enamel area is replaced with arestoration or is destroyed by caries or covered withan orthodontic band.
Staining per se in otherwise intact enamel is not adiagnostic criterion specific to any of the classifications.
Fluorosed teeth do not erupt with pits. Instead,pitting occurs post-eruptively when teeth are subjectto masticatory forces. A pit is defined as a discrete,focal loss of outermost enamel. The defect is partly orwholly surrounded by a wall of enamel. Initially, theenamel wall is usually intact. But with wear, theenamel wall can be abraded, so that often only partof the enamel can be detected. In contrast to intactenamel on which the explorer tip can be moved eas-ily across the smooth surface, pitted areas demon-strate a definite physical defect in which the base ofthe defective area may be either carious or sound. Ifit is sound, the base of the pit is rough and offers re-sistance to the lateral movement of the explorer tip; ascratchy sound is detected when the explorer ismoved across it. If the base is carious, it demonstratessoftness upon being probed with moderate pressure.In either case, the pitted area is usually stained or adifferent color compared to the surrounding enamel.
PROMOTING ORAL HEALTH
98
CODING FOR DENTAL FLUOROSIS:Tooth-based coding for upper anterior teeth—cuspid to cuspid.
Code Diagnostic criteria
0
5
1
2
3
4
8
9
No Fluorosis: The enamel surface is smooth, glossy, and usually a pale creamy-white color.
Questionable: The enamel shows slight aberrations from the translucency of normal enamel; aberrations may rangefrom a few white flecks to occasional spots, usually, but not always, located on the incisal third of the surface.
Very Mild: Opaque, paper-white areas or lines the thickness of a pencil mark scattered irregularly over the toothbut involving less than 25% of the surface. Many times the hypocalcifications follow the perikimata lines.
Mild: The white opacities on the enamel extend to more than 25% but less than 50% of the surface.
Moderate: The amount of enamel affected extends to more than 50% of the surface. Sometimes the hypocalcifiedenamel captures particles and chromogenic bacteria from the environment and saliva, changing the enamel fromwhite to brown.
Severe: This code is applicable to any of the previous classifications combined with the presence of distinctiveunique or confluent pits. Pits correspond to enamel that is lost after eruption. Single pits are diagnosed with an ex-plorer and should have delimited walls in most of the pit’s circumference. The bottom of the pit can have normalenamel or fluorotic enamel with or without brown coloration. Brown coloration is not a sufficient criterion to code“severe.”
Not recorded: This code is applicable to any partially erupted tooth or any tooth cover with a crown or orthodonticband/bracket.
Excluded: Applicable to any primary tooth.

STANDARDIZED RESEARCH PROTOCOLS
99
CODING FOR DENTAL CARIES: Surface-based coding.Code for Code for Primary PermanentTeeth Teeth Diagnostic Criteria
Sound: A sound surface is one without any signs of cavitation due to decay, sequelae (restora-tions), or a sealant. If the surface has lost part of its structure due to fracture or trauma it is con-sidered sound. Pits and fissures represent a special situation. Any surface with less than 25% ofits pits and fissures showing coloration will be considered sound; otherwise, it will be consideredas a non-cavitated lesion (see codes L and U).
Noncavitated lesion: This code applies only to surfaces with pits and fissures showing more than25% coloration (brown to black) without clinical signs of decay, i.e., decalcification or undermin-ing of surrounding enamel or demineralized dentin at the bottom of the fossae/fissure.
Decayed: Three types of lesions can be coded as decayed:
1) Pit-and-fissure caries lesions—defined as the presence of a cavitation or decalcification or un-dermining of the surrounding enamel (with a change of color to dark) or soft dentin at thebottom of the pit or fissure. The explorer should be used only to confirm the presence of softdentin and only when diagnosis cannot be made with the naked eye.
2) Free-surface caries lesions—lesion on any other surface that does not have pits or fissures.(These surfaces include the entire mesial and distal surfaces and the buccal surfaces of ante-rior teeth; lingual surfaces of upper anterior teeth and sometimes the lower anterior teethcan have pits.) In the buccal surfaces (nonproximal), the diagnosis is reached when there isclear evidence of cavitation. In the anterior proximal surfaces, the diagnosis can be reachedusing the mirror to transilluminate the proximal area. In the posterior proximal surfaces, theexaminer needs to detect the presence of the cavity with the explorer (changes in color in themarginal reach are not enough to diagnose proximal decay).
3) Secondary caries next to a restoration—Diagnosis is reached if you can detect with the ex-plorer the presence of soft dentin. A gap between the restoration and the tooth is notenough of a criterion to diagnose caries. Any temporary restoration is considered as decayed.
Filled: A filled surface includes any surface that has been restored partially or completely with arestorative material as a direct consequence of decay. Restorative materials include silver amal-gam, crowns (stainless steel or cast), inlays, composite resins, silicates, and glass ionomers.
Missing due to caries: This code applies to any surface from any tooth that has been extractedas a direct consequence of caries. In the primary teeth, the code D will be applied to all emptyspaces in the primary molar area up to age 8 (8 and 11 months). If the child is 9 or older, thesespaces are coded as unerupted permanent (code 9). Any empty space in the primary anteriorarea at any age also will be coded as unerupted permanent (code 9). In older cohorts, it will bedifficult to assess if the tooth has been extracted due to caries or periodontal diseases, or be-cause a dentist decided to extract the tooth for prosthetic reasons. In all these cases the codeassigned should be 3.
Missing for other reasons: This code applies to any surface of any tooth that has been lost forreasons unrelated to caries, i.e., due to trauma or orthodontic treatment.
Sealant present: Total or partial sealant present only in occlusal surfaces of permanent or pri-mary teeth. This includes sealants on parts of the occlusal surface that have been slightly en-larged from using a round bur to eliminate suspicious carious tissue. Sealants on fissures frombuccal or lingual surfaces of molars or incisors are not included. A restoration with a compositeresin which required a full preparation is not considered a sealant.
Bridge abutment: This code applies only to any tooth prepared as an abutment in both anterioror posterior teeth.
Implant: This code applies only to the presence of crowns associated with an implant.
Unerupted tooth: Applies only to spaces in the arch with primary teeth absent due to normalshedding and before any clinical signs of the erupted permanent tooth can be distinguished.
Trauma: Applies to untreated fractures, changes in color in the entire crown, restoration involv-ing the incisal edge, and anterior crowns installed due to trauma.
Excluded: This code applies to all surfaces in specific situations, including anterior crowns addedfor cosmetic reasons. It also applies to teeth that cannot be assessed completely because theyare partially covered with orthodontic bands or brackets.
A I
N U
B 1
C 2
D 3
E 4
F 6
H 7
8
9
K T
L X
Special Clinical Situations
• Incisal edges of anterior teeth are not consideredseparate surfaces. If a lesion or restoration is con-fined solely to the incisal edge, its score should beassigned to the nearest adjacent surface.
• When a filling or lesion on a posterior tooth, ora caries lesion on an anterior tooth, extends be-yond the line angle onto another surface, thenthe other surface is also scored as affected.However, a proximal filling on an anteriortooth is not considered to involve the adjacentlabial or lingual surface unless it extends atleast one-third into that surface. The reasonfor this is that tooth structure on adjacent sur-faces often must be removed to provide accessfor the restoration of a proximal lesion on an-terior teeth.
• In this survey there is no independent code forcrowns in either dentition. Therefore, if a poste-rior tooth has a full-crown restoration placedbecause of caries, you should code for the threesurfaces filled due to caries (code 2). Thesesurfaces are the mesial, occlusal, and distal. Ifan anterior tooth has a full-crown restorationplaced because of caries, you should providecodes for the two surfaces filled—the mesial anddistal. By convention, all crowns on posteriorteeth, excluding abutment teeth for fixed or re-movable prostheses, are considered to have beenplaced as a result of caries. On anterior teeth,however, the examiner makes the determinationof the reason for crown placement. If the crownwas placed for any reason other than caries—such as fracture, malformation, or aesthetics—the tooth is coded as excluded (code X).
• If a tooth has been restored with less than fullcoverage, all surfaces not involved should bescored in the usual manner.
• Some teeth, typically the first bicuspids, areextracted for orthodontic reasons. Label theseas missing for other reasons (code 4). To rec-ognize these patients, check the status of thecontralateral bicuspid and look for evidence oforthodontic treatment. Be aware that otherteeth may be extracted for orthodontic reasons.In most cases, former or current orthodonticpatients will recall having had extractions.
• Nonvital teeth are scored in the same manneras vital teeth. Therefore, restorations on thelingual surfaces of anterior teeth used as entryfor root-canal therapy should not be recordedas restored. Code this surface as sound.
• Hypoplastic teeth are scored in the usual man-ner. However, if a restoration on such a toothwas placed solely for aesthetic reasons, thatrestoration will not be scored. If a hypoplastictooth is restored with a full crown, it is codedas excluded (code X).
• Malformed teeth are scored in the usual man-ner, except when they have been restored witha full crown for aesthetic reasons, in whichcase they are coded as excluded (code X).
• When the tooth crown is destroyed by cariesand only the root remains, score all surfaces ascarious.
• Fractured or missing restorations are scored asif the restorations were intact unless there iscaries. If caries is found within or adjacent tothe margins of a fractured or missing restora-tion, caries should be scored only in the sur-faces involved.
• In the case of supernumerary teeth, only onetooth is called for the tooth space. The exam-iner must decide which tooth is the main occu-pant of the space.
• If both a primary and permanent tooth occupythe same tooth space, score only the permanenttooth. There is a hierarchy in coding when morethan one code is possible. Sound surfaces/teethare at the bottom of the hierarchy. Sealedsurfaces/teeth have precedence over soundsurfaces/teeth. Restored surfaces or teeth haveprecedence over sealed surfaces/teeth. Finally,surfaces/teeth with untreated have precedenceover restorations.
• In general, when the same tooth surface is bothcarious and filled (e.g., upper permanentmolar with mesial pit filled and distal pit withcaries), code for caries.
• Third molars are not scored. When examiningsecond molars it is important to note that adrifted molar may occupy the space of a miss-ing second molar. In such cases, the diagnosisand call must apply to the status of the missingsecond molar, not the third molar. If the second
PROMOTING ORAL HEALTH
100
molar, for example, was extracted due to cariesand the space is now occupied by a sound thirdmolar, the second molar is scored as missingdue to caries (code 3).
• A tooth is considered erupted if any of its clin-ical crown projects through the gum.
• Stain and pigmentation alone should not be re-garded as evidence of decay, since either canoccur on sound teeth.
• A surface is coded as sealant present if anypart of the surface remains covered with thesealant. In most clinical situations, the sealantcovers the surface’s pit and fissure. Rememberthat sealant products vary widely in color andyou may need tactile confirmation of the pres-ence of sealant.
• If you are sure that a composite material hasbeen used as a restoration (i.e., it requiredpreparation using a rotary instrument) in all orpart of the fissure, then score the surface as
filled. In case of doubt and if there is compos-ite material present, code the surface and toothas sealant present.
Important Information when CodingCaries Prevalence Using a Paper FormIn this type of survey, you will be collecting surfacedata for caries. However, certain codes are applica-ble to all surfaces. The examiner can save time byfollowing the code with the the word “all.” Therecorder will know that the preceding code appliesto all surfaces and will write the code for the mesialsurface and a horizontal line across the remainingsurfaces. Then, the following number will corre-spond to the code for treatment needed for thattooth. The codes for which this shortcut applies are:
Sound (A, 1), missing, both due to caries and forother reason (D,E,3 and 4), bridge abutment (7),implant (8), unerupted tooth (9), and excluded (X).
STANDARDIZED RESEARCH PROTOCOLS
101
NEED-FOR-TREATMENT CODING: Tooth-based Coding.Code Diagnostic Criteria
0 No need for treatment: The crown is sound or has a restoration in good condition (no secondary caries).
F Fissure sealant: A permanent molar will be eligible for sealant if the following three conditions are present: (1) tooth is within three years of eruption; (2) there is an obvious “catch” during examination with the probe; and(3) there is at least one additional restoration in any other pit and fissure. A primary molar will be eligible forsealants if conditions (2) and (3) are present.
1 The tooth needs one surface restoration.
2 The tooth needs two or three surface restorations or multiple restorations in combinations of one, two, or threesurfaces.
3 The tooth needs a crown for any reason.
4 Veneer or laminate for aesthetic reasons (anterior teeth).
5 Pulpar care and post-treatment: The tooth probably needs pulpar care and, later, a restoration with a filling orcrown. Pulpar care could be needed as a consequence of caries or trauma. Pulpar care includes treatments (e.g.,pulpotomy, pulpectomy) in both primary and permanent teeth.
6 Extraction: A tooth is indicated for extraction because caries has destroyed most of the crown or becauseperiodontal disease has progressed to the stage that the tooth is highly movable and nonfunctional. Teeth thatneed to be extracted due to prosthetic or orthodontic reasons are not included here.
7 Reserved code (if more information is needed)
8 Reserved code (if more information is needed)
9 Not recorded (excluded). Code ‘9’ (unerupted tooth) is assigned to the tooth in the diagnosis of caries.

For example, for a sound permanent molar whichmay benefit from sealants, the examiner will say, “1-ALL-F,” where 1 is the diagnostic code for sound,ALL indicates that the code applies to all surfaces,and F means that a pit and fissure sealant is indi-cated for the occlusal surface.
Special Consideration Regarding NeededTreatmentA tooth should receive a sealant or restoration (fill-ings, crowns, etc.) to treat primary and secondarycaries, replace lost or fractured restorations, correctanomalies in tooth shape and color (as when severefluorosis is present), in cases of trauma, and to re-place poor fillings or sealants. However, examinersneed to be realistic and avoid “ideal” treatmentplans. The need for prostheses should be evaluatedseparately by the examiner and only in the adult co-hort 35–44 years old. Examiners should use theirown criteria and clinical standards to assess the leveland complexity of needed treatment. Generally,treatment for aesthetic reasons should be avoided(except in cases of severe tooth malformation), asshould implants and crowns/veneers over teeth witha change in color due to trauma. Orthodontic treat-ment is not indicated, nor are tooth spacers or anyremovable or fixed appliance.
Items to Be Included in Reports ofEpidemiological Surveillance ActivitiesMost epidemiological surveillance activities associ-ated with salt fluoridation programs include varia-tions of open-mouth visual and tactile surveys, whichdental health workers conduct to assess standardmeasurements of oral diseases and conditions of themouth.3 This section describes the minimum dataitems to be reported from any open-mouth survey as-sociated with salt fluoridation surveillance activities.
SamplingAll surveys include some sort of sampling procedure,in which a representative sample of the populationis selected to be examined. Any survey report shouldinclude:
a. Type of sampling probability or nonprobability.b. If probability sampling was used, the report
should explain how the final sample was at-tained (such as through stratified sampling orcluster sampling). It also is important to in-clude if any weighting or sampling design effectwas used in analyzing the data and to identifyany computer software (e.g., SUDAAN) used.
PROMOTING ORAL HEALTH
102
3The methodology and steps in these surveys have been de-scribed in PAHO’s Regional Oral Health Program’s “Final Reportto the W.K. Kellogg Foundation,” Project #43225, Multi-YearPlan for Salt Fluoridation programs in the Region of the Ameri-cas (Belize, Bolivia, Dominican Republic, Honduras, Nicaragua,Panama, Venezuela), published in Washington D.C. in 2000.
CODING FOR URGENCY OF TREATMENTCode Criteria
0 No need for current treatment
1 Tooth cleaning and scaling needed
2 Low urgency: Restorations and crowns needed,but none of them require immediate attention(restricted to the most superficial dentine).Include any person needing prosthesis or crowns.
3 Advanced urgency: Deep enough restorationsand crowns need attention right away (within7–14 days) to avoid pulpar involvement orinfection. Include any child with five or moreteeth needing restorations.
4 High urgency: requires urgent care due to painor infection. Include here any person in need ofpulpar treatment or extraction.
CODING FOR PROSTHETIC STATUS:Individual coding for the 35–44-year-old cohort.
Code Criteria
0 No prosthesis present
1 One fixed bridge
2 More than one fixed bridge
3 Removable partial denture
4 Both bridge(s) and partial denture(s)
5 Full removable denture
9 Excluded (children)
CODING FOR PROSTHETIC NEED:Individual coding for the 35–44-year-old cohort
Code Criteria
0 No prosthesis needed
1 Prosthesis needed for one tooth replacement
2 Multiunit prosthesis (fixed or removable) needed
3 Full denture needed
9 Excluded (children)

c. If nonprobability sampling was used (such as WHO’s survey methodology, “pathfinder”)the report should explain how the sample wasattained and the criteria used to select geo-graphical sites. Also, since many surveys ofthe pathfinder type include some randomnessin the selection of sample units after the geo-graphical sites have been selected, the reportshould describe these selection processes.
CalibrationOral health surveys are conducted by examinerswho apply specific diagnostic criteria and coding foreach oral condition being examined. To obtain use-ful information, the diagnostic criteria and codingmust be applied accurately and consistently acrossall examinees. Examiners and recorders learn thesecriteria during calibration exercises. Usually, theseexercises take place immediately before data collec-tion begins. Calibration of examiners and recordersincludes discussion of the diagnostic criteria andcoding, procedures for examination and recording,and duplicate clinical examinations of patients totest examiner reliability. Discrepancies in the appli-cation of diagnostic criteria during the clinical ex-aminations are discussed and corrected. In mostcases, examiners are considered “calibrated” whenthey obtain Kappa indicators greater than 0.60.(See “Calculation of Kappa [�] and Percent Agree-ment [PA]” at the end of this protocol.)
Oral health survey reports should include a de-scription of the calibration activities. Among itemsto include are:
a. How the calibration process was carried out.b. How many examiners and recorders were
included.c. The coding for each oral condition that was
examined.d. The overall percent agreement and kappa for
intraexaminer and interexaminer reliability.
ReliabilityAll examiners should demonstrate that they canapply diagnostic criteria accurately and consistently.Reliability has two dimensions: how reliable the ex-aminers are individually (intraexaminer reliability)and how reliable they are among themselves (in-
terexaminer reliability). The best technique formeasuring reliability is to perform duplicate exami-nations during the calibration process. Duplicate ex-aminations by the same examiner measure the reli-ability of that particular examiner. Duplicate examsby any two examiners measure interexaminer relia-bility. Two indices of reliability used extensively inoral health surveys are the percent agreement (PA)and Cohen’s kappa (�) and percent agreement (PA).(See Calculation of Kappa (�) and Percent Agree-ment (PA) at the end of this protocol for formulasand an annotated example.)
Oral health survey reports should include the fol-lowing information regarding reliability:
• Interexaminer and intraexaminer reliabilityscores using both kappa and percent agree-ment, for all variables.
• Interexaminer and intraexaminer reliabilityshould be calculated for all possible examiners.However, when reporting reliability, all dupli-cate examination results across all examinersshould be pooled and an overall measure of in-terexaminer and intraexaminer reliabilityshould be reported. (See “Overall ReliabilityEstimates” at the end of this protocol.)
DataOral health survey reports should include tablesproviding data in the following areas:
Demographics
1. Distribution (number, percent in sample, andpercent in the population) by sex, race, age,and geographical site/unit (according to sam-pling). To avoid crowding, these should bestand-alone tables. All tables should includetotals at the bottom.
Disease Prevalence
Caries Prevalence and Severity
a. Age-specific proportion of persons with un-treated decay or caries-free:• percent of caries-free persons in primary or
permanent dentitions, and
STANDARDIZED RESEARCH PROTOCOLS
103

• percent of persons with untreated decay inpermanent and both dentitions.
b. Age-specific means and standard deviations(standard errors for probability sample sur-veys) for the following selected indicators ofcaries prevalence:• df-T (number of decayed and filled teeth in
primary dentition)• DMF-T (number of decayed, missing, and
filled teeth in permanent dentition)• df-t + DMF-T (total caries experience in
both dentitions)• d-T + D-T (untreated decay in both den-
titions)If the survey collected tooth surface informa-tion, a second table with the corresponding in-dicators should be included.
c. Age-specific contribution of the followingcomponents to DMF-T among those withDMF-T > 0• Percent D/DMF-T (Percent of decayed
teeth within DMF-T)• Percent M/DMF-T (Percent of missing
teeth within DMF-T)• Percent F/DMF-T (Percent of filled teeth
within DMF-T)d. Degree of caries experience in the permanent
dentition, which is obtained by classifying theentire sample into four categories according tothe individual DMF-T, as follows:1) DMF-T = 02) DMF-T between 1 and 3.0 included3) DMF-T between 3.1 and 6.0 included4) DMF-T greater than 6.0
Other Oral ConditionsAge-specific tables should be generated for otherconditions included in the survey. For example, ifthe survey obtained data for the presence of fluoro-sis or sealants, these variables need to be describedfor each age group and also after stratification bygeographical site, sex, and race, if appropriate. Itshould be stressed that for conditions reported as adichotomy (yes/no), the sample percentage for ei-ther “yes” or “no” category should be included inthe table. If the condition has been reported as a cat-egory with many levels (polychotomy), e.g., Dean’sIndex of dental fluorosis, then the table should in-
clude the number and the percent for each category.Finally, if the condition is measured as a continuousvariable (e.g., caries prevalence indices), then thetable should include means, standard deviations,and standard errors in case of probability estimates.
Formatting RequirementsThe following guidelines apply when preparing anytable:
a. All tables should be stand-alone and self-explanatory. Titles should include informa-tion on four categories: person (population/sample), place, time (year), and statistic(s)included in the table.
b. Labels in tables should be clear and concise.c. Titles should be consistent across all tables.d. Use periods (.), not commas (,), to express
decimals. Use commas (,), not periods (.), toexpress thousands.
e. For statistics such as means, standard devia-tions, and standard errors, values should berounded upward to two decimal digits. For per-centages use only one decimal digit. Integersshould not be reported with decimal digits.
f. Do not calculate statistics for cells that havefewer than 30 persons. Be aware that someage groups will end up with fewer than 30persons after stratification by variables suchas sex and race. Exceptions to the 30-personsrule are those cases where the overall statistichas been computed based on more than 30persons, but the number diminishes when thestatistic is broken down (not stratified) by itsconstituent elements.
g. Include totals and subtotals in each table. Besure that all subtotals add up to the total.
h. Any unusual element in the table, such asmissing data, should be explained using afootnote. Also use footnotes to give the mean-ing of unusual abbreviations (such as “m.d.”for “missing data;” “n.c.” for “not calcu-lated,”) or symbols such as hyphens.
i. Charts and graphs are excellent media toshow differences and trends. In oral healthsurvey reports, charts and graphs can be in-cluded in addition to but not as substitutes fortabulated data.
PROMOTING ORAL HEALTH
104

STANDARDIZED RESEARCH PROTOCOLS
105
Sample Data-Entry Form Used to Survey Schoolchildren
Duplicate Update Date Examiner Recorder
Strata School Grade ID
Gender Race Date of birth Age
Fluorosis 13: 12: 11: 21: 22:
Mesial Occlusal Distal Buccal Lingual/buccal Treatment
UR17
UR16
UR15
UR14
UR13
UR12
UR11
UL21
UL22
UL23
UL24
UL25
UL26
UL27
LL37
LL36
LL35
LL34
LL33
LL32
LL31
LR41
LR42
LR43
LR44
LL45
LR46
LR47
Prosthetic status Prosthetic need Treatment urgency
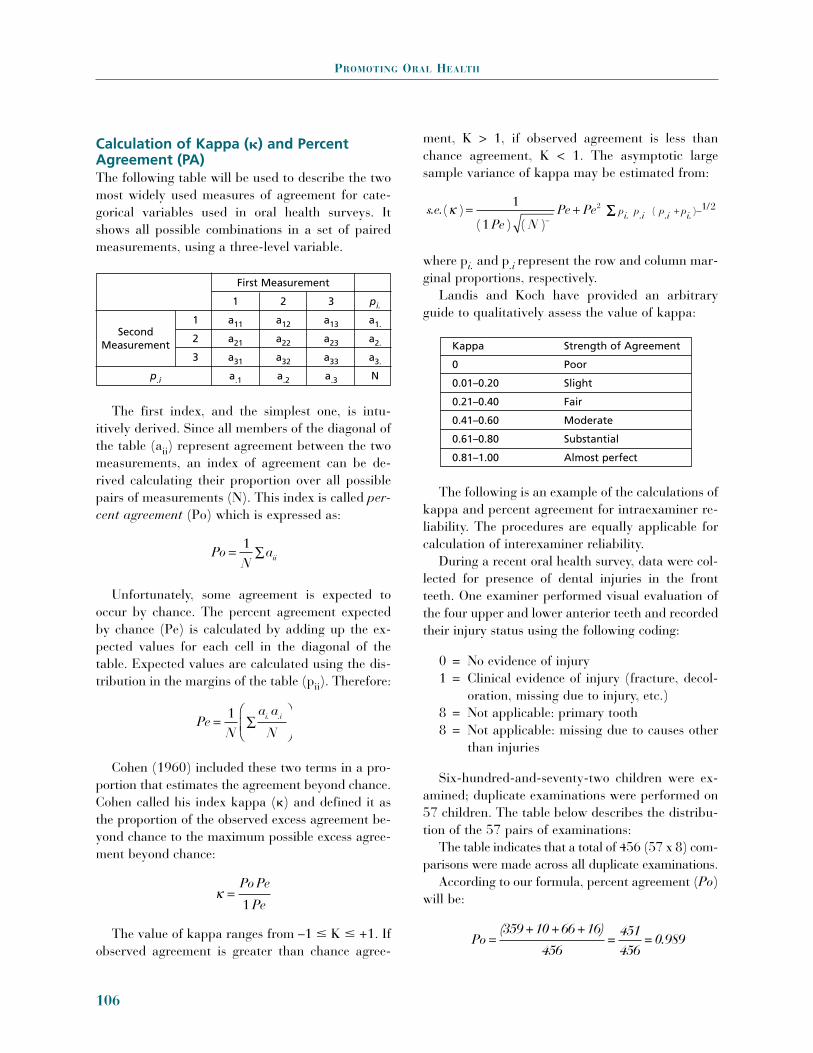
Calculation of Kappa (�) and PercentAgreement (PA)The following table will be used to describe the twomost widely used measures of agreement for cate-gorical variables used in oral health surveys. Itshows all possible combinations in a set of pairedmeasurements, using a three-level variable.
The first index, and the simplest one, is intu-itively derived. Since all members of the diagonal ofthe table (aii) represent agreement between the twomeasurements, an index of agreement can be de-rived calculating their proportion over all possiblepairs of measurements (N). This index is called per-cent agreement (Po) which is expressed as:
Unfortunately, some agreement is expected tooccur by chance. The percent agreement expectedby chance (Pe) is calculated by adding up the ex-pected values for each cell in the diagonal of thetable. Expected values are calculated using the dis-tribution in the margins of the table (pii). Therefore:
Cohen (1960) included these two terms in a pro-portion that estimates the agreement beyond chance.Cohen called his index kappa (�) and defined it asthe proportion of the observed excess agreement be-yond chance to the maximum possible excess agree-ment beyond chance:
The value of kappa ranges from –1 � K � +1. Ifobserved agreement is greater than chance agree-
ment, K > 1, if observed agreement is less thanchance agreement, K < 1. The asymptotic largesample variance of kappa may be estimated from:
where pi. and p.i represent the row and column mar-ginal proportions, respectively.
Landis and Koch have provided an arbitraryguide to qualitatively assess the value of kappa:
The following is an example of the calculations ofkappa and percent agreement for intraexaminer re-liability. The procedures are equally applicable forcalculation of interexaminer reliability.
During a recent oral health survey, data were col-lected for presence of dental injuries in the frontteeth. One examiner performed visual evaluation ofthe four upper and lower anterior teeth and recordedtheir injury status using the following coding:
0 = No evidence of injury1 = Clinical evidence of injury (fracture, decol-
oration, missing due to injury, etc.)8 = Not applicable: primary tooth8 = Not applicable: missing due to causes other
than injuries
Six-hundred-and-seventy-two children were ex-amined; duplicate examinations were performed on57 children. The table below describes the distribu-tion of the 57 pairs of examinations:
The table indicates that a total of 456 (57 x 8) com-parisons were made across all duplicate examinations.
According to our formula, percent agreement (Po)will be:
Po =(359 +10 +66 +16)
456=
451456
= 0.989
s.e. i. .i .i i.( )( ) ( )
( ) /k = +-
+ -1
1
2 1 2
Pe NPe Pe p p p pÂÂ
k =Po Pe
Pe1
PeN
a a
N= Â
Ê
ËÁˆ
¯1 i. .i
PoN
aii= Â1
PROMOTING ORAL HEALTH
106
First Measurement
1 2 3 pi.
1 a11 a12 a13 a1.
2 a21 a22 a23 a2.
3 a31 a32 a33 a3.
p.i a.1 a.2 a.3 N
SecondMeasurement Kappa Strength of Agreement
0 Poor
0.01–0.20 Slight
0.21–0.40 Fair
0.41–0.60 Moderate
0.61–0.80 Substantial
0.81–1.00 Almost perfect
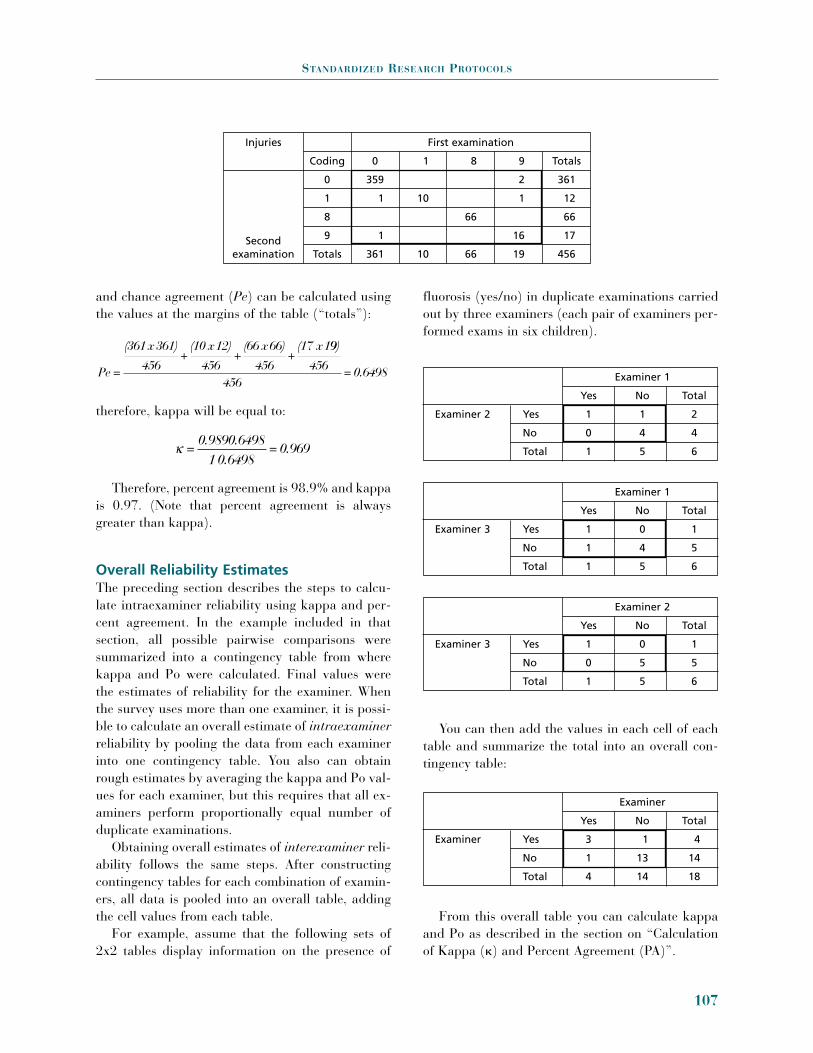
and chance agreement (Pe) can be calculated usingthe values at the margins of the table (“totals”):
therefore, kappa will be equal to:
Therefore, percent agreement is 98.9% and kappais 0.97. (Note that percent agreement is alwaysgreater than kappa).
Overall Reliability EstimatesThe preceding section describes the steps to calcu-late intraexaminer reliability using kappa and per-cent agreement. In the example included in thatsection, all possible pairwise comparisons weresummarized into a contingency table from wherekappa and Po were calculated. Final values werethe estimates of reliability for the examiner. Whenthe survey uses more than one examiner, it is possi-ble to calculate an overall estimate of intraexaminerreliability by pooling the data from each examinerinto one contingency table. You also can obtainrough estimates by averaging the kappa and Po val-ues for each examiner, but this requires that all ex-aminers perform proportionally equal number ofduplicate examinations.
Obtaining overall estimates of interexaminer reli-ability follows the same steps. After constructingcontingency tables for each combination of examin-ers, all data is pooled into an overall table, addingthe cell values from each table.
For example, assume that the following sets of2x2 tables display information on the presence of
fluorosis (yes/no) in duplicate examinations carriedout by three examiners (each pair of examiners per-formed exams in six children).
You can then add the values in each cell of eachtable and summarize the total into an overall con-tingency table:
From this overall table you can calculate kappaand Po as described in the section on “Calculationof Kappa (�) and Percent Agreement (PA)”.
k =0.9890.6498
10.6498= 0.969
Pe =
(361x361)
456+
(10 x12)
456+
(66 x66)
456+
(17 x199)
456456
= 0.6498
STANDARDIZED RESEARCH PROTOCOLS
107
Examiner 1
Yes No Total
Examiner 2 Yes 1 1 2
No 0 4 4
Total 1 5 6
Examiner 1
Yes No Total
Examiner 3 Yes 1 0 1
No 1 4 5
Total 1 5 6
Examiner 2
Yes No Total
Examiner 3 Yes 1 0 1
No 0 5 5
Total 1 5 6
Examiner
Yes No Total
Examiner Yes 3 1 4
No 1 13 14
Total 4 14 18
Injuries First examination
Coding 0 1 8 9 Totals
0 359 2 361
1 1 10 1 12
8 66 66
9 1 16 17
Totals 361 10 66 19 456Second
examination

2. DETERMINING FLUORIDECONCENTRATION IN DRINKING WATER
This protocol is a systematic tool for oral healthworkers to collect data on water samples, as part ofan effort to determine naturally occurring fluoridelevels in drinking water in areas that will establish asalt fluoridation program. The first part lists datathat must be obtained and must accompany eachsample; the second lists steps that should be fol-lowed in the actual collection of samples.
Water Sample Identifying DataSequential number. A sequential identification
number must be assigned to each sample, in case itis necessary to verify the samples or for other follow-up needs. The sequence number can be assigned ac-cording to the geographical zone where the samplewas collected.
Source name. Identify the origin of the waterdistribution sample.
Location. Name the district, city, and commu-nity where the sample originated.
Zone. Indicate whether the area where the sam-ple was collected is urban, peri-urban, or rural.
Coverage. Determine and indicate the approxi-mate number of persons that use the water source.
Soil. Soil type can influence the amount of fluo-ride in water. State whether the soil is rocky, clayey,sandy, volcanic, etc.
Altitude above sea level. Because individualmetabolism (and, thus, retention and excretion offluoride) varies with altitude, it is necessary to in-clude altitude above sea level at the site where thewater was collected.
Reservoir systems. Materials used in reservoirsystems can influence the concentration of fluoride.Indicate if collection tanks are made of concrete,clay or clay fiber, aluminum, or fiberglass. Also in-dicate the piping material used to transport thewater. This is a reason to collect water samples atthe source and at residences.
Temperature. Provide the temperature of the airwhere the sample was collected. The range recom-mended for optimal concentration of fluoride in agiven population may vary according to ambienttemperature.
Type of sources. Specify the type of watersource, such as a river, lake, creek, well, spring, etc.
Date. Provide the date of collection. Fluorideconcentration in water may vary according to thetime of year.
Name of responsible party . Identify the personresponsible for collecting and identifying the watersamples.
Technique for Sample CollectionUse 125 ml plastic bottles or 50 ml plastic cylinders.Wash the container three or four times with the
same water that will be collected.Let the water run up to the edge of the bottle mouth.After the sample is taken, close the bottle tightly.Immediately identify the bottle with a premade label,
providing the information listed above.
3. DETERMINING URINARY FLUORIDEEXCRETION IN CHILDREN: TIME-CONTROLLED URINE SAMPLING
One-time (spot) samples of urine offer insufficientinformation on average daily fluoride intake. Thisinformation can best be obtained from samples col-lected over a 24-hour period. This may be possiblewith parental collaboration or from hospitalizedchildren. If it is difficult to obtain parental collabo-ration for supervised collection of urine during themorning and afternoon, efforts should be made forsupervised collection of urinary samples during pre-school and school hours and for one overnight col-lection at home. The following procedure has beenadapted from standard methods for urine samplingand analysis to determine fluoride intake, as used inmilk fluoridation studies. The procedure permits col-lection of urine over a period of 14–18 hours in a 24-hours cycle, and provides sufficient information toestimate the total daily fluoride intake in children.
Protocol RequirementsSince children 3–5 years old may be attendingkindergarten or elementary school, arrangementsshould be made with the school administration incommunities where urine sampling will be con-
PROMOTING ORAL HEALTH
108

ducted. Administration approval is essential to facil-itate communication with parents and to ensure thatteachers and staff collaborate in all required activi-ties before and during the project.
A brief clear note explaining the purpose of thestudy should be prepared by the investigators andmade available to the school nurse, so it can be sentto parents asking them to allow their children to par-ticipate. The nurse should be informed of the studyobjectives, implications, risks. and the time that eachparticipanting child would have to devote to theproject, so that she or he can answer any questionsparents might have. Invitations should be sent toparents at least one week in advance of the date forsampling. Parents should be informed that the con-sent form will include all pertinent information to thestudy and that it will be necessary for them to sign itto give permission for their child to participate.
Institutional Review Boards (IRB) oversee thesafety and rights of humans participating as re-search subjects. The consent form must explain thepurpose of the sampling and activities to be con-ducted, benefits and risks of the study to subjects,and participation time in plain language that will be easily understood by an individual with limitededucation. The consent form must be approved bythe local IRB or equivalent agency and must besigned by the parent or guardian of the participat-ing child, as well as by the investigator and a wit-ness. The date the agreement was signed should berecorded. The project director will keep originalsigned and dated consent forms with other projectrecords. A copy of the consent form should be givento the parent of the participating child.
Parents should also be instructed that they willneed to provide demographic information on theirchild and to indicate the type of foods eaten by thechild the day before and on the day of sample col-lection. Additional information on use of productscontaining fluorides (such as toothpaste, tablets,drops or topical fluorides) should be collected byhaving parents complete simple questionnaire.
General Instructions
1. The day before urine collection starts, it isadvisable to meet with the school nurse to fi-
nalize details and to identify classrooms thatwill be used and restroom facilities for boys andgirls, and to discuss the necessary project flow.Any additional information on project specificscan be provided at this time. Parents should bereminded that urine collection will begin thefollowing day and that they should record thefoods (solids and liquids) eaten by the child theday before and the day of the sample collection.Parents should be contacted directly or a notemay be sent home with the child.
2. A roster of participating children should bemade and corresponding identification num-bers assigned to each child.
3. On the day of the sampling, when the childneeds to urinate he or she is asked to emptythe bladder. The name of the child and thetime are recorded. The urine is not collected.This procedure is followed with each partici-pating child. Note: With some 3-year-old chil-dren it may be necessary to use pediatric urinecollectors.
4. When each child returns to urinate, a con-tainer of approximately 135 ml is given forhim or her to urinate in. The time of urinationand the volume of urine are recorded. Theurine is then transferred to a larger, graduatedcontainer. The procedure is repeated at eachurination during the pre-set collection period,i.e., morning, or period A. When each childnext needs to urinate, a container of about135 ml capacity is given to him or her to uri-nate in. The time and volume of urine arerecorded.
5. At the end of the first supervised pre-set col-lection period, the process is repeated. Thetime should be recorded for each child. If achild is unable to urinate during this secondcollection, the time of his or her last urinationis recorded as the end of his or her collectionperiod.
6. For each child, the time and volume of urinecollected are recorded on the test tube’s label,and the following information transferred tothe recording form: a. Time of initial voiding of the bladderb. Time of last urine collection into the large
container
STANDARDIZED RESEARCH PROTOCOLS
109

PROMOTING ORAL HEALTH
110
Recording Form for Collection of Urinary Samples
School: Locality: Date:Mean temperature:
Period A Period B Period C Period D(Morning) (Noon and (Afternoon
Children’s Data: Afternoon) & evening) (Nocturnal)
No. ID Age Sex Weight Start End Start End Start End Start End
Time
Vol.
Time
Vol.
Time
Vol.
Time
Vol.
Time
Vol.
Time
Vol.
Time
Vol.
Time
Vol.
Time
Vol.
Time
Vol.
Time
Vol.
Time
Vol.
Time
Vol.
Time
Vol.
Time
Vol.
Time
Vol
Source: Adapted from WHO Form No. 96391 (2).

c. Total volume of urine collected between the initial voiding and the end of collectionperiod.
7. Thirty ml of urine from the large, graduatedcontainer are placed into a plastic test-tube,and a small thymol crystal is added as a pre-servative. The cap is secured and the samplestored in a cool place. If a refrigerator is notavailable, a portable cooler with ice cubes ordry ice may be used to maintain samples at acool temperature and to transfer them to thelaboratory for analysis.
Steps 5–7 are repeated in the afternoon (Period Bon recording form). If parents have agreed to col-laborate on supervised collection at home during theremainder of the afternoon and evening, the proce-dure should be carefully explained to them. A con-tainer with a label marked as Period C should bemade available; parents will enter necessary infor-mation on the label. If a third collection period is notto be conducted, an overnight collection should bearranged. A separate container should be providedto parents for this collection. The container shouldhave a label on which parents can record the time oflast urination before the child goes to bed and thetime of first urination in the morning.
If it is suspected that the child may urinateduring the night without notifying the parent, it
may be necessary to fit him or her with a pediatricurine collector. Parents should be instructed ontheir method of its use and reminded that these col-lectors are for single sample collections. The col-lected urine needs to be emptied into a larger con-tainer and the volume recorded. If the child is oldenough to urinate directly into the large container,he or she should be asked to do so if urinating dur-ing the night. The total volume of urine since thelast urination before going to bed is recorded on thelarge container label for Period D. Samples need tobe kept cool.
The concentration of fluoride is determined ineach sample collected from each child for each pe-riod. The recorded volume and concentration ofeach sample for each period are used to calculateurinary flow and fluoride excretion rates per hour,per period, and for 24 hours.
References
1. Moller IJ, Eklund SA. Calibration of Examiners for theInternational Collaborative Study of Oral Health (ICSII). Limited distribution. Geneva: World Health Orga-nization;1991.
2. Marthaler TM (ed). Monitoring of renal fluoride excre-tion in community preventive programmes on oralhealth. Geneva: World Health Organization;1999.
STANDARDIZED RESEARCH PROTOCOLS
111


