Shabbir H. Gheewala Professor and Head
Life Cycle Sustainability Assessment Lab
The Joint Graduate School of Energy and Environment
King Mongkut’s University of Technology Thonburi
ICSoLCA, 24 October 2018, Jakarta
Promoting sustainability in emerging
economies via life cycle thinking
Life Cycle Thinking - Pathway of Thailand
1990 GT/CT Projects in industry
• LCA Pilot Projects
Life Cycle Network • Thai LCA Network • LCA in academics
LCA/Eco-Design Capacity Building • Supported by JP
government.
National LCI DB • MoU 5 Orgs – MoI-
FTI-TEI-NSTDA-TRF
LCA Applications (+ in Policy) • National Carbon Footprint
• Eco-Product Directory
• National LCI DB - 2 • Water Footprint, PEF • Sust. Ass./SCP/SEEA
• GT/LCA for SD
• Global LCA Network
• Asia CF Network
LC Thinking (Type I)
• Green label
• Full GT/LCA for SDGs/SCP
• Sustainable Industry/
Agricuture/ Tourism / City ..
1993
1997-1999
2000
2002 2007- 2009
2009
2012
2012-2015
2013-2015
2015-present
• LCA Agrifood Asia Network
Sustainable Development • National committee on SD
• Water Footprint
• Env. Footprint,
• Green GDP, SAFA
• SCP/SD indicators
Courtesy: Dr Thumrongrut Mungcharoen, NSTDA
1
LCT
2 Cap Bldg
3 Appl
4
SDGs
Thai National LCI Database
Basic Materials
Thai National LCI Database (Master Plan, Dec. 2004)
Agriculture Cassava
Rice
Sugar cane
Corn
Cotton
Natural rubber
Vegetable oil
livestock
Animal feed
Recycle and Waste
Management Recycle
Landfill
Anaerobic digestion
Incineration
CommodityChemicals NaOH H2SO4 HCl Cl2 Lime Na2CO3 Sulfur Fertilizer/
Pesticide
Industrial Materials Plastics (PS, PE, PP, etc.)
Non-ferrous metals
Ferrous metals
Aluminum, Copper
Fibers
Synthetic rubber (SBR,
BR)
Pulp & Paper
Petrochemicals (7)
Building and Construction
Materials Steel/ Gypsum
Cement
Glass
Wood
Tiles
Energy, Utilities
and Transportation Coal, Natural Gas
Petroleum (gasoline, diesel,
jet fuel, gas oil)
Biofuels
Electricity grid
Transportation system
Water supply (surface /ground)
Infrastructure
MOU since 30 Mar.2007 (renewed every 2 years)
MOU with JRC/EU 22
Aug. 2007
join UNEP/SETAC LC
initiative
Technical Support by
Japanese Government
through GPP
Financial Support by
Thai Government
Thai LCA Software
LCI Databases exchange with other Countries
NA
TIO
NA
L L
CI
DA
TA
BA
SE
Thai LCI Data for Research
WEBSITE
1,300
Land Transportation
Department of Mineral Fuels
Partners in Thailand
Petroleum Institute of Thailand
Office of Natural Resources and Environmental Policy and Planning.
etc. Courtesy: Dr Thumrongrut Mungcharoen, NSTDA
Courtesy: Dr Jitti Mungkalasiri, MTEC
LCI applications
Thailand joins the Global LCA Data network (GLAD)
- UN Environment
LCA Data
Footprint Family: CF, WF,
etc.
Sust. Assess.
Policy Justification
Green Public
Procurement
Eco Product Directory
…Green GDP, Green public procurement, Ecolabel,
Resource efficiency, Circular economy, Sustainable
development goals…
More than 800 databases are domestically available
LCA Inventory
data
Water/ Environmental
Footprint (since 2010)
Sustainability assessment (Biofuels,
AgriFood,..) (since 2006)
Policy Justification
(since 2012)
EcoProducts Directory (since 2009)
Green Public Procurement
(since 2012)
Carbon Footprint (since 2009)
• Food vs. Feed vs. Fuel ?
• Green GDP/Green Industry • Eco-efficiency/ Factor X • Adder/ Externalities ? • Env. Tax, etc.
Sugar cane/ Molasses/ Cassava/ Oil palm/ Jatropha
GHG emission factors
1
2
3
4 5
6
SCP-SD Indicators/ Institutional framework (since 2013)
7
LCA Applications & Initiatives
Courtesy: Dr Thumrongrut Mungcharoen, NSTDA
LCA-based labels in Thailand
Ecolabel
based on LCT Carbon footprint label
based on LCA
Type 1 Type 2 Type 3
Company labels
100g
Carbon Footprint Labels
2,872 products
537 companies 514 products
75 companies
29 products
12 companies
34 products
21 companies
113 fabric str.
27 companies
East 4 Municipalities
North 45 Municipalities
Northeast 34 Municipalities
South 22 Municipalities
Thailand
Carbon Footprint for Organization
(CFO) from 2011 to 2017:
127 Municipalities
City Carbon Footprint (CCF) from 2014
to 2017: 71 Municipalities
CFO & CCF in 2018: 23 Municipalities
Central 22 Municipalities
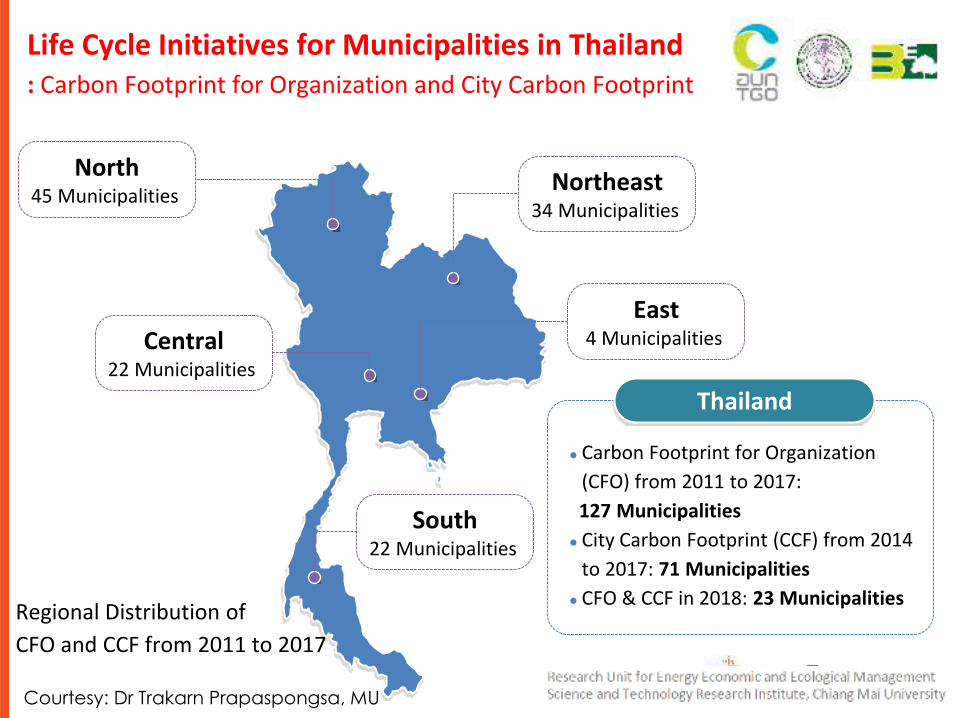
Life Cycle Initiatives for Municipalities in Thailand
: Carbon Footprint for Organization and City Carbon Footprint
Regional Distribution of
CFO and CCF from 2011 to 2017
Courtesy: Dr Trakarn Prapaspongsa, MU
City Carbon Footprint (CCF) of
23 Municipalities (M) in Thailand in 2018
Municipality
Size
Average GHG
Emission (t CO2eq/person)
Large Scale 6.93
Medium Scale 4.84
Small Scale 6.50
Municipality Size
Average GHG Emission
(t CO2eq/household)
Large Scale 29.56
Medium Scale 11.78
Small Scale 16.82
Municipality
Size
Average GHG
Emission (t CO2eq/km2)
Large Scale 73,389.70
Medium Scale 13,234.01
Small Scale 8,331.17
M1
M2
M3
M4
M5
M6
M7
M8
M9
M10
M11
M12
M13
M14
M15
M16
M17
M18
M19
M20
M21
M22
M23
17
LC-Water Footprint Activities in Thailand
• 2010-2011: policy research: study how to use STI to support WF (by NSTDA)
• 2012: (12-16 Nov.) NSTDA nominated Prof.
Shabbir Gheewala as the Thai representative to the “Train the Trainers on CF & WF” in Paris organized by the UNEP-SETAC LC Initiative
• 2013: (2-3 July) NSTDA (with the support by
UNEP) organized “Train the Trainers on WF” at NSTDA. Lecturers are Stephan Pfister (ETH
Zurich) & Shabbir (batch 1: 35 trainees)
• 2014: (15-16 Oct.) NSTDA organized “Train the Trainers on WF” using lecturers of batch 1 (top 3) (batch 2: 40 trainees)
• 2015: (29 July) NSTDA provided lecturer for Water Institute for Sustainability, FTI “Train the Trainers on WF” (baatch 3: 30 trainees)
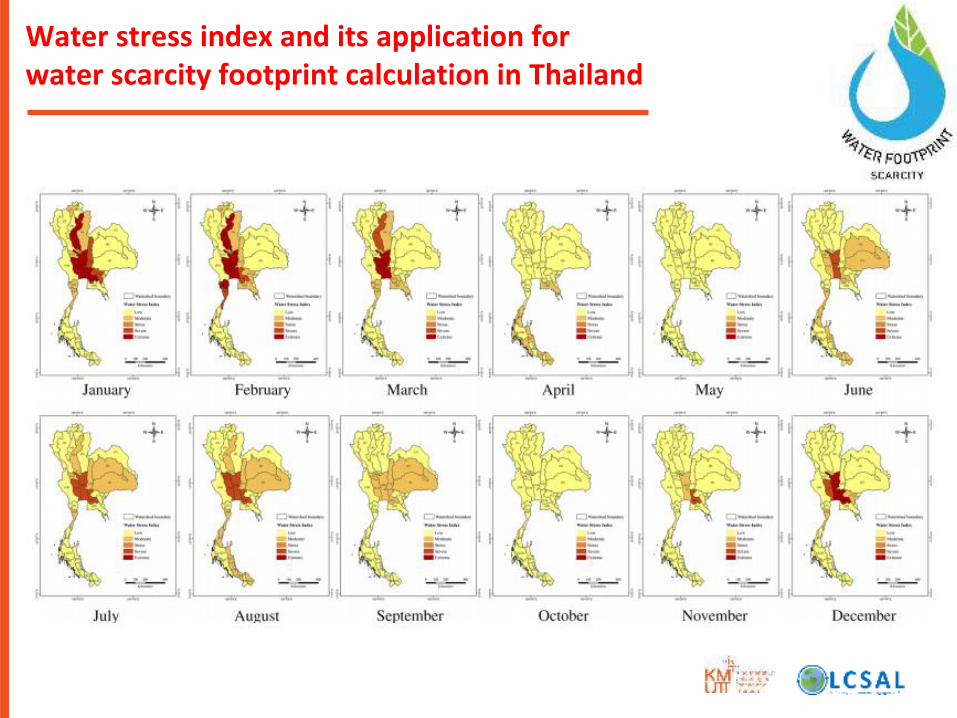
• @ present: several research works on WF (supported by TRF, ARDA, NSTDA,..) Water Stress Index of 25 watersheds
in Thailand (Source: S. Gheewala)
Life Cycle Environmental Sustainability
Assessment of Oil Palm Plantations in Thailand
Independent
Smallholders
Land use and
conversion
Materials and fuel
used
Life cycle inventory
LC-GHG emissions (Carbon
Footprint)
Water requirement, footprint
and impact potential
Water requirement, footprint
and impact potential
Land use and HCV areas
Data for supporting Thailand National LCI Database of Oil palm plantations (Province/Region levels)
Group of
Smallholders
Mini Estates
Mills with plantation
Life Cycle Inventory Data Collection Sustainability Assessment Outputs
Water use
Fertilizers &
Agrochemical
Wastes
Agricultural
practices
Identification of
environmental hotspots
and recommendations
for supporting
sustainable oil palm
production
Environmental sustainability indicators and baseline data for oil palm plantation in Thailand for supporting certification of RSPO and/or other sustainability standards
Sustainability Assessment of Sugarcane Complex for
Enhancing Competitiveness of Thai Sugarcane Industry
Land use for sugarcane plantation LUC scenarios for
sugarcane plantation in
Thailand
Scenarios for sustainability assessment
Comparative assessment
for different agricultural
practices, varieties, yields
Sugarcane cultivation & Harvesting
Sugarcane complex
Bio-electricity
generation
Sugar
processing
Comparative assessment
for different production
systems and different by-
products utilization
systems. The scope of
impact assessment
includes
(1)GHG emissions
(2)Water use
(3)Eutrophication
(4)Acidification
(5)Eco-toxicity
(6)Human-toxicity
(7)Photo-chemical
oxidation
(8)Socio-economic impact
(9)Other aspects related to
BSI, GBEP
(1) Sustainability
indicators &
Baseline data for
Thai sugarcane
industry
(2) Life cycle GHG
emission method
and GHG emission
factors for the Thai
sugarcane industry
Molasses
Bagasse Agr.
residues
Waste/By-products
utilizations
Sugar milling
Bio-ethanol
production
Cane juice Filter cake Wastewater
Spent wash
Sugar Bio-electricity Bio-ethanol
Sugarcane
Value-added
products
GIS data/
Statistic
Field data
Field data
Life cycle of sugarcane systems
(3) Roadmap for
sustainable
sugarcane
bioenergy
production in
Thailand
Green GDP is one of the indicators used to assess Sustain. Development
To integrate environmental and social impacts into traditional economic GDP
Why Green GDP?
• Limitation of GDP has as an indicator of economic performance
and social progress
• Need more comprehensive macroeconomic indicator consistent
with the concept of Sustainable Development
• Green GDP can integrate environmental statistics into national
accounts and reflect a country’s ability to manage its economics and
resources
What is Green GDP?
Green GDP = Traditional GDP – Environmental Consequences
e.g. Resource depletion, environmental
degradation, protective or restorative
environmental initiatives
Economic & Social Environment & Social
Green GDP is an indicator of economic growth with the consequences on that growth
factored into the traditional GDP
Courtesy: Dr Viganda Varabuntoonvit, KU
• Green GDP Critical Review
- Petroleum Refinery
• Monitoring and Update
- Petroleum refinery
- Upstream Petrochemical
- Sugar
- Mining
- Cement
- Rubber
- Iron and steel
• GPP at Rayong
• Monitoring/Update
- Petroleum Refinery
- Upstream
Petrochemical
- Sugar
- Mining
- Cement
- Rubber
• Finalize Green GDP
Calculation Method
for Industrial Sector
- Petroleum Refinery
- Sugar
- Cement
• BIOTEC:
Green GDP of
Agricultural
sector based on
SEEA concept
• VGREEN KU:
Green GDP of
Agri sector by
using EIO-LCA
(Agri)
• Policy
justification and
Decoupling
indicator
- SD Index/
Green GDP
Green GDP is a Joint KPI between ministries for Sustainability Growth
Start from Green GDP of Industrial Sector to incorporate and develop
2014 2016 2017 2012
• CMU and KU:
Green GDP for
Industrial
Sector
(petroleum
refinery, paper
and sugar)
2013
• Convert
physical value
in Thai National
LCI Database
to monetary
value for Green
GDP Calculation
• Joint KPIs
• Sustainable growth
indicator is Green
GDP
- Especially Green
GDP for
Industrial sector
2015
• Green GDP Timeline in Thailand
• Need to
research for
“Green GDP” - Calculation
method
Courtesy: Dr Viganda Varabuntoonvit, KU
Overall Green GDP Calculation Based on SEEA and LCA Concept
Inventory data will be collected from each ministry and convert to monetary term
• Green GDP Workflow
*Marginal Abatement Cost (Technology base)
**Marginal Abatement Cost (Extraction base)
Gross Domestic Product
(Sector level) Study Process
Defined Goal and Scope
Life Cycle Inventory Analysis (LCI)
Life Cycle Impact Assessment
Inte
rpre
tatio
n
MACT* Damage
cost
Defen-
sive cost
Degra-
dation cost
Deple-
tion cost
Green GDP of Each Sector
NESDB
GDP at current
market price
GtoG, FU
I/O Analysis
MACE**
Ph
ys
ica
l Un
its
Mo
ne
tary
Te
rms
Direct
Emissions (GtoG) Direct Impacts
Review/request
data each of
ministry
1
2
3
Courtesy: Dr Viganda Varabuntoonvit, KU
ECO FACTORY Roadmap
2014 2015 2016 2017 2018
• Std requirements V 1.0
• 2 Pilot cases • 12 Auditors
• Implementation • MoU with MoI, equivalent to GI4
• MoU with IEAT • Std requirements V 2.0
• 166 certified factories
www.ecofactory.fti.or.th
Courtesy: Dr Rattanawan Mungkung, KU
Several impacts of Thai Eco Factors developed
from the national policies
Emission to air
• Greenhouse gases
• Ozone-depleting substances
• Acidifying gases
• Photochemical Ozone Creation
• Paticulate matters
• Carcinogenic substances
• Heavy metals to air
Emissions to surface waters
• Nutrient emissions • Heavy metals to freshwater
Emissions to groundwater
• Nitrate
Emissions to soil
• Pesticide
Resources
• Primary energy • Land use
• Metal mineral • Non-metal mineral • Freshwater
Wastes
• Deposited solid waste
2011
NATIONAL POLICY TARGETS
Energy plans:- AEDP, EEP
Climate Change Master Plan
Environmental Quality Management Plan
Water / Air / Soil / ground water Quality Standards
Solid waste management target
Montreal Protocol on ODS
Forest Conservation target
….. etc. Courtesy: Dr Naruetep Lecksiwilai, JGSEE
Research Network for LCA and Policy
on Food, Fuel and Climate Change
• Development of capacity and human resources for LCA in Thailand
• Policy recommendations on food and fuel issues vis-à-vis climate change
• Commitment to continue activities on LCA of the researchers and partners
Rice
Oil palm
Cassava
Sugar cane
Rubber
Bio-refinery products
Food
Fuel
Efficient resources use
Ensuring food security
Enhancing energy security
Towards Green Economy & Poverty reduction
Support country’s SCP
Climate change mitigation
Land Energy
Water Chemical
Policies
Resources
Production Systems
Feedstocks
Products
Life Cycle Assessment, Carbon Footprint, Water Footprint, Ecological Footprint, Biodiversity
Footprint, Material Flow Analysis. Consequential LCA, Social LCA, Cost Benefit Analysis
Tools used
NSTDA Research Chair Grant 2016
Network for Research and Innovation
for Trade and Production of Sustainable Food and Bioenergy
Promoting Sustainability in Emerging
Economies via Life Cycle Thinking
November 2017, Issue 11, Pages 1641-1891
• Guest editors from Thailand
• 9 out of 18 papers are from Thailand
– Thai national life cycle inventory readiness for product environmental footprint
– Consequential and attributional environmental assessment of biofuels: implications of modelling choices on climate change mitigation strategies
– Budget constraint and the valuation of environmental impacts in Thailand
Promoting sustainability in emerging
economies via life cycle thinking
» Starting from the idea of cleaner production
» Introducing the importance of life cycle thinking
through various tools
– Ecolabeling, EPDs, Green public procurement
» Development of National LCI Database
» Application of life cycle-based tools in industry and
policy-making
» Aligning national goals with international movements