23
Promotional Guidelines Survey A Report by WorldatWork September 2016
Promotional Guidelines Survey
A Report by WorldatWork September 2016

About WorldatWork® – The Total Rewards AssociationWorldatWork (www.worldatwork.org) is a nonprofit human resources association forprofessionals and organizations focused on compensation, benefits, work-life effec-tiveness and total rewards – strategies to attract, motivate and retain an engaged andproductive workforce. WorldatWork and its affiliates provide comprehensive education,certification, research, advocacy and community, enhancing careers of professionalsand, ultimately, achieving better results for the organizations they serve. WorldatWorkhas more than 65,000 members and subscribers worldwide; 80 percent of Fortune 500companies employ a WorldatWork member. Founded in 1955, WorldatWork is affiliatedwith more than 70 local human resources associations and has offices in Scottsdale,Ariz., and Washington, D.C.
WorldatWork Society of Certified Professionals® is the certifying body for six presti-gious designations: the Certified Compensation Professional® (CCP®), Certified BenefitsProfessional® (CBP), Global Remuneration Professional (GRP®), Work-Life CertifiedProfessional® (WLCP®), Certified Sales Compensation Professional (CSCP)™ andCertified Executive Compensation Professional (CECP)™.
The WorldatWork group of registered marks also includes: workspan and WorldatWorkJournal.
Contact:WorldatWork Customer Relations
14040 N. Northsight Blvd.
Scottsdale, Arizona USA
85260-3601
Toll free: 877-951-9191
Fax 480-483-8352
©2016 WorldatWork Any laws, regulations or other legal requirements noted in this publication are, to the best of the publisher’s knowledge, accurate and currentas of this report’s publishing date. WorldatWork is providing this information with the understanding that WorldatWork is not engaged, directly or by implication, inrendering legal, accounting or other related professional services. You are urged to consult with an attorney, accountant or other qualified professional concerningyour own specific situation and any questions that you may have related to that.
No portion of this publication may be reproduced in any form without express written permission from WorldatWork.

Promotional Guidelines WorldatWork 1
Introduction & Methodology This report summarizes the results of a June 2016 survey of WorldatWork members to gather information about current trends in promotional guidelines. It focuses on a variety of practices and policies, including what employers consider to be promotions, as well as the standard pay increases that often accompany promotions.
On June 15, 2016, survey invitations were sent electronically to 5,201 WorldatWork members. Randomly selected members had designated compensation only or compensation and benefits as their primary job function(s) in their WorldatWork member profile.
The survey closed on July 5, 2016, with 703 responses, a 14% response rate. The dataset was cleaned and analyzed using statistical software. Any duplicate records were removed, resulting in a final dataset of 542 responses. Data comparisons with any relevant, statistically significant differences are noted in this report.
The demographics of the survey sample and the respondents are similar to the WorldatWork membership as a whole. The typical WorldatWork member works at the managerial level or higher in the headquarters of a large company in North America.
The frequencies or response distributions listed in the report show the number of times or percentage of times a value appears in a dataset. Due to rounding, frequencies of data responses provided in this survey may not total 100%.
WorldatWork conducted similar promotional guidelines surveys in 2014, 2012, 2010 and 2006. The reports can be viewed on the WorldatWork website. Where possible, historical comparisons from data gathered in the previous survey are shown.

Promotional Guidelines WorldatWork 2
Table of Figures Demographics
Figure 1: Sector ................................................................................................................................................ 4
Figure 2: Organization size .............................................................................................................................. 4
Figure 3: Industry .............................................................................................................................................. 5
Figure 4: Voluntary turnover ............................................................................................................................. 5
Figure 5: Region ............................................................................................................................................... 6
Definition of Promotion Figure 6: Promotion definitions and criteria ..................................................................................................... 9
Size and Determination of Promotional Increases Figure 7: Average promotional increase ......................................................................................................... 9
Figure 8: Influential factor(s) in determining rates of promotional increase .................................................... 9
Number of Promotions Figure 9: Percentage of employees promoted ................................................................................................. 10
Figure 10: Percentage of employee promoted in 2015 (or last fiscal year) ..................................................... 10
Funding of Promotional Increases Figure 11: Funding of promotional increases ................................................................................................... 10
Figure 12: Size limitation on promotional increases ......................................................................................... 11
Figure 13: Maximum amount of promotional increases ................................................................................... 11
Communicating Promotional Guidelines Figure 14: Communication of promotional guidelines or policies ..................................................................... 12
Position Movement Figure 15: Limitations on grades, levels or bands employees are permitted to move ..................................... 12
Figure 16: Number of grades, bands or levels an employee can move in one promotion ............................... 13
Figure 17: Employee eligibility for an increase when moving laterally ............................................................. 13
Effect of Promotions on Merit Increases and Variable Pay Awards Figure 18: Management of merit increases for promoted employees ............................................................. 14
Timing and Frequency Figure 19: When promotions occur .................................................................................................................. 14
Figure 20: Promotion eligibility after an employee is hired............................................................................... 15
Figure 21: Frequency of employee eligibility for a promotion .......................................................................... 15
Figure 22: Calculation of bonuses or incentives after a promotion ................................................................. 15
Promotional Opportunities and Employee Motivation Figure 23: Promotional opportunities to attract new employees ...................................................................... 16

Promotional Guidelines WorldatWork 3
Figure 24: Effect on employee engagement and motivation ............................................................................ 16
Global Practices Figure 25: Promotional guidelines or policies designed and administered by global regions .......................... 16
Figure 26: Consistency of promotional guidelines or policies by global regions .............................................. 17

Promotional Guidelines WorldatWork 4
Demographics Figure 1: “Your organization is:” (n=510)
Figure 2: “Please choose the total number of full-time employees (FTEs) your organization employs
worldwide:” (n=511)
Option Percentage
Fewer than 100 employees 0%
100 to 499 5%
500 to 999 7%
1,000 to 2,499 21%
2,500 to 4,999 17%
5,000 to 9,999 18%
10,000 to 19,999 13%
20,000 to 39,999 9%
40,000 to 99,999 6%
100,000 or more employees 3%
Private sector, publicly traded (stock ticker)
52%Private sector, privately held
27%
Nonprofit/not-for-profit or
public sector22%

Promotional Guidelines WorldatWork 5
Figure 3: “Please choose one category that best describes the industry in which your organization operates:” (n=508)
Industries with less than 2% are not listed in this table.
Option Percentage
All Other Manufacturing 14% Finance & Insurance 14% Health Care & Social Assistance 9% Utilities, Oil & Gas 7% Consulting, Professional, Scientific & Technical Services 6% Information (includes Publishing, IT, etc.) 6% Educational Services 4% Retail Trade 4% Computer & Electronic Manufacturing 3% Accommodations & Food Services 2% Other Services (except Public Administration) 2% Pharmaceuticals 2% Transportation 2% Other 21%
Figure 4: “What is the approximate annual voluntary turnover for employees?” (n=503)
19%
37%
23%
11%
6%3%
1%
0%-5% 6%-10% 11%-15% 16%-20% 21%-26% 27%-40% 41% or more

Promotional Guidelines WorldatWork 6
Figure 5: “For which regions of the world do you have responsibility? (Select all that apply.)” (n=513)
96%
25%
24%
17%
15%
13%
8%
United States/Canada
Asia-Pacific
Western Europe
Latin America
Eastern Europe
Middle East
Africa

Promotional Guidelines WorldatWork 7
Executive Summary The percentage of employees receiving a promotion on an annual basis has increased from 7.0% to 9.3% since 2010, (a shift from 9.0% in 2014 to 9.3% in 2016). (See Figure 9.) More than 60% of organizations agree that the number of promotions has remained about the same. (See Figure 10.) The average size of promotional increases, as a percentage of base pay, are increasing among nonexempt (hourly) and exempt (salaried) employees, to 8.1% and 9.3% respectively. While hourly and salaried employees’ promotional increases are rising, promotional increases for officers/executives have declined to 9.6% this year, down from 10.1% in 2014. (See Figure 7.) Most organizations (47%) do not limit the size of promotional increases, a shift from previous years. (See Figure 12.) 80% of organizations define promotions with the following criteria: higher-level responsibilities/job or an increase in pay grade, band or level. (See Figure 6.) During 2016, the most influential factors in determining rates of promotional increases were pay range for a new position (70%) and rates paid to other employees similarly situated within the organization (64%). (See Figure 8.)
Funding of Promotional Increases The practice of budgeting separately for funding promotional increases has declined since 2014, but is still occurring in 33% of organizations. Not far behind in funding these increases are vacancy savings, savings from vacant positions or during recruitment, at 32%. (See Figure 11.)
Communicating Promotional Guidelines 38% of organizations use promotional guidelines and policies to direct human resources and management, communicating with employees when they ask. (See Figure 14.)
Position Movement Most organizations do not set limits for how many grades, bands or levels employees are permitted to move in a single promotion (77%). (See Figure 15.) Of the 13% who responded that there was
a limit for moving in a single promotion, more than 90% either permit one or two moves, 57% and 35% respectively. (See Figure 16.)
80% 80%
39% 37%
Higher-levelresponsibilities/job
Increase in paygrade, band or
level
New title Increase in pay
C r i t e r i a t o D e f i n e a P r o m o t i o n
33%
32%
22%
19%
19%
Separate from other payincrease budgets
Vacancy savings (savings fromvacant positions or during
recruitment)
Part of our merit budget
Salary savings (hiring at a lowerrate than the previous
incumbent)
Part of another budget
P r o m o t i o n a l I n c r e a s e F u n d i n g
Promotional Guidelines WorldatWork 8
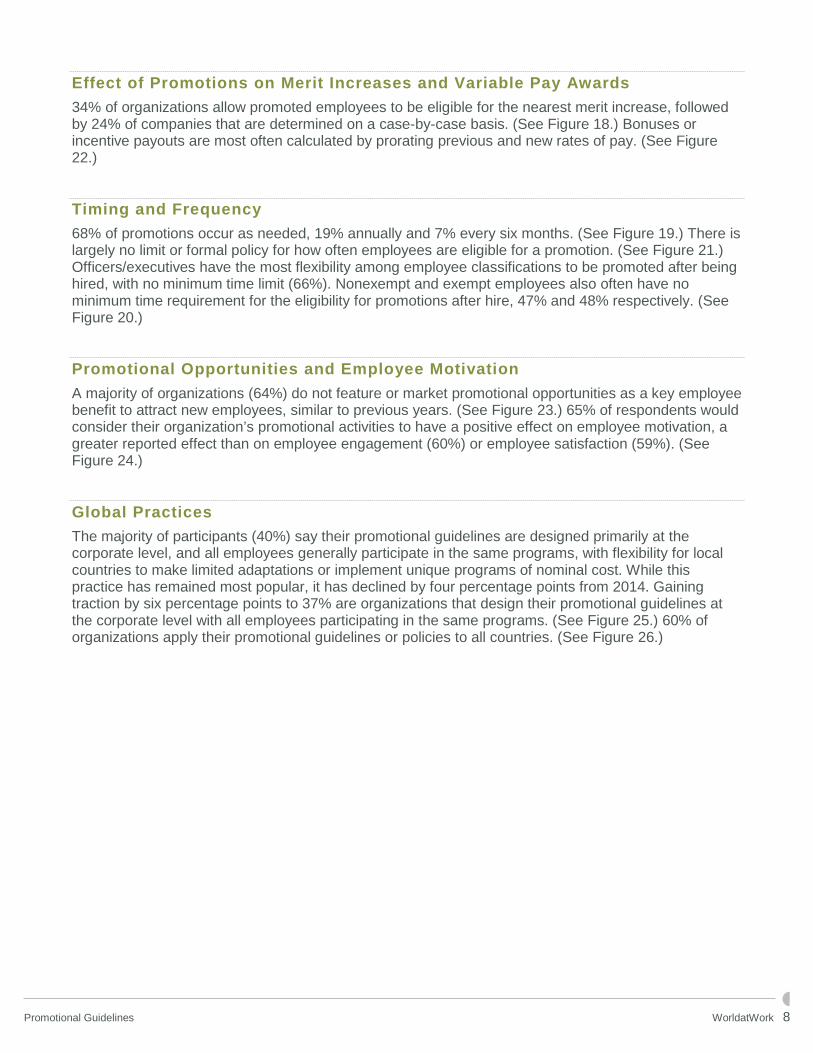
Effect of Promotions on Merit Increases and Variable Pay Awards 34% of organizations allow promoted employees to be eligible for the nearest merit increase, followed by 24% of companies that are determined on a case-by-case basis. (See Figure 18.) Bonuses or incentive payouts are most often calculated by prorating previous and new rates of pay. (See Figure 22.)
Timing and Frequency 68% of promotions occur as needed, 19% annually and 7% every six months. (See Figure 19.) There is largely no limit or formal policy for how often employees are eligible for a promotion. (See Figure 21.) Officers/executives have the most flexibility among employee classifications to be promoted after being hired, with no minimum time limit (66%). Nonexempt and exempt employees also often have no minimum time requirement for the eligibility for promotions after hire, 47% and 48% respectively. (See Figure 20.)
Promotional Opportunities and Employee Motivation A majority of organizations (64%) do not feature or market promotional opportunities as a key employee benefit to attract new employees, similar to previous years. (See Figure 23.) 65% of respondents would consider their organization’s promotional activities to have a positive effect on employee motivation, a greater reported effect than on employee engagement (60%) or employee satisfaction (59%). (See Figure 24.)
Global Practices The majority of participants (40%) say their promotional guidelines are designed primarily at the corporate level, and all employees generally participate in the same programs, with flexibility for local countries to make limited adaptations or implement unique programs of nominal cost. While this practice has remained most popular, it has declined by four percentage points from 2014. Gaining traction by six percentage points to 37% are organizations that design their promotional guidelines at the corporate level with all employees participating in the same programs. (See Figure 25.) 60% of organizations apply their promotional guidelines or policies to all countries. (See Figure 26.)

Promotional Guidelines WorldatWork 9
Results and Analysis
Definition of Promotion Figure 6: “Which of the following describes how your organization defines an employee “promotion?”
(Select all criteria that are REQUIRED to be considered a promotion.)” 2010 2012 2014 2016
n= 719 707 443 541 Higher-level responsibilities/job 73% 76% 77% 80% Increase in pay grade, band or level 84% 84% 75% 80% New title 33% 36% 39% 39% Increase in pay n/a n/a 35% 37% New department 1% 1% 2% 3% Other 4% 4% 2% 3%
Size and Determination of Promotional Increases Figure 7: “In 2016 (or current fiscal year), what has been the average promotional increase, expressed
as a percentage of base pay, for each employee category in your organization? If the employee category is not applicable for your organization, please leave it blank.”
2010 2012 2014 2016 n % n % n % n % Nonexempt (hourly) 504 7.0% 505 7.4% 306 7.6% 392 8.1% Exempt (salaried) 584 8.3% 578 8.7% 355 8.8% 457 9.3% Officers/executives 380 9.5% 383 10.2% 239 10.1% 317 9.6%
Figure 8: “During 2016, what has been the most influential factor(s) in determining rates of promotional
increase? (Select up to three factors).” 2010 2012 2014 2016
n= 684 689 428 530 Pay range for the new position 66% 69% 71% 70% Rates paid to other employees similarly situated within the organization 60% 60% 60% 64% External pay data, if available 36% 38% 39% 44% Qualifications of the individual, compared to the qualifications of other employees in the same job within the organization 30% 27% 32% 31%
Performance level of the individual being promoted 29% 28% 29% 27% Number of pay grades between the old position and the new position 19% 16% 19% 15% A fixed percentage increase for most promotional increases 21% 21% 16% 12% Whether the promotional increase involves a change from nonexempt to exempt classification 8% 8% 8% 9%
Promotional Guidelines WorldatWork 10
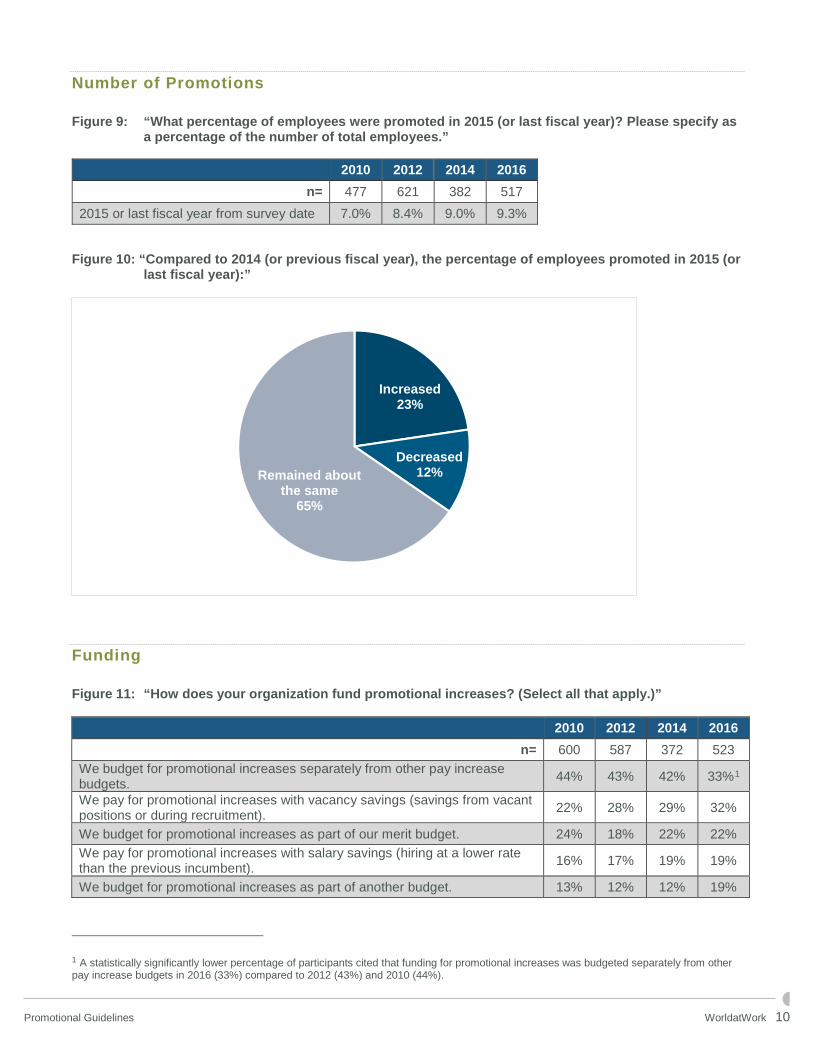
Number of Promotions Figure 9: “What percentage of employees were promoted in 2015 (or last fiscal year)? Please specify as
a percentage of the number of total employees.”
Figure 10: “Compared to 2014 (or previous fiscal year), the percentage of employees promoted in 2015 (or
last fiscal year):”
Funding Figure 11: “How does your organization fund promotional increases? (Select all that apply.)”
2010 2012 2014 2016 n= 600 587 372 523
We budget for promotional increases separately from other pay increase budgets. 44% 43% 42% 33%1
We pay for promotional increases with vacancy savings (savings from vacant positions or during recruitment). 22% 28% 29% 32%
We budget for promotional increases as part of our merit budget. 24% 18% 22% 22% We pay for promotional increases with salary savings (hiring at a lower rate than the previous incumbent). 16% 17% 19% 19%
We budget for promotional increases as part of another budget. 13% 12% 12% 19%
1 A statistically significantly lower percentage of participants cited that funding for promotional increases was budgeted separately from other pay increase budgets in 2016 (33%) compared to 2012 (43%) and 2010 (44%).
Increased23%
Decreased12%Remained about
the same65%
2010 2012 2014 2016 n= 477 621 382 517
2015 or last fiscal year from survey date 7.0% 8.4% 9.0% 9.3%

Promotional Guidelines WorldatWork 11
We pay for promotional increases out of our merit budget, but the merit budget is not inflated to cover promotional increases. 13% 16% 15% 14%
We pay for promotional increases out of another budget, but the other budget is not inflated to cover promotional increases. (Please specify budget.)
• Department budget 8% 7% 6% 9%
Figure 12: “Does your organization limit the size of some or all promotional increases?”2
Figure 13: “What is the maximum amount employees are eligible for as a promotional increase? Please
choose the most accurate response for each employee category.” Only participants who answered “yes” in Figure 12 received this question.
n= Less than 5%
5%-9% 10%-14%
15%-19%
20%-29%
30%-49%
More than 50%
No limit for this type of
employee Nonexempt (hourly) 82 4% 29% 29% 20% 11% 2% 0% 5%
Exempt (salaried) 91 3% 19% 35% 24% 13% 1% 0% 4% Officers/executives 79 4% 11% 24% 24% 18% 0% 0% 19%
2 In 2016, the percentage of organizations not limiting the size of promotional increases was statistically significantly greater (47%) than in 2014 (35%), 2012 (37%) and 2010 (33%).
27%
33%
40%
25%
37% 38%
26%
35%39%
19%
47%
34%
Yes, all promotional increases arelimited.
No, promotional increases are notlimited.
Some promotional increases arelimited.
2010 (n=624) 2012 (n=603) 2014 (n=375) 2016 (n=536)

Promotional Guidelines WorldatWork 12
Communicating Promotional Guidelines Figure 14: “What is your organization’s approach to the communication of promotional guidelines or
policy?”
2014 2016 n= 371 515
The guidelines and policy are mostly to guide HR and management; we will share these with employees when they ask 46% 38%
We do not have a formal policy on promotional guideline communication n/a 29% We want every employee to fully understand the guidelines and policy 23% 14% We do not share the promotional guidelines or policy with employees 21% 13% We communicate the guidelines to employees only when they are involved in a promotion 5% 5% Other 5% 2%
Position Movement Figure 15: “Does your organization set a limit for how many grades, bands or levels employees are
permitted to move in a single promotion?”3
3 A statistically significantly larger percentage of organizations do not set a limit for how many grades, bands or levels employee can move in a single promotion in 2016 (77%) compared to 2014 (67%).
67%
17%
16%
77%
13%
11%
No
Yes
Depends on the employee’s classification
2014 (n=372) 2016 (n=513)

Promotional Guidelines WorldatWork 13
Figure 16: “How many grades, bands or levels are employees permitted to move in one promotion?” Only participants who answered “yes” in Figure 15 received this question.
Figure 17: “Are employees typically eligible for a promotional increase when moving laterally?”4
4 In 2016, the percentage of organizations not permitting eligibility for lateral moves is statistically significantly lower (45%) than 2010 (57%), while the percentage of promotional increases for lateral moves based on the position is statistically significantly greater (45%) compared to 2010 (35%).
57%
36%
3%5%
53%
31%
3%
13%
40%43%
5%
13%
57%
35%
2%6%
One Two Three Other
2010 (n=76) 2012 (n=97) 2014 (n=63) 2016 (n=65)
10%
11%
8%
8%
45%
47%
52%
57%
45%
43%
40%
35%
2016 (n=513)
2014 (n=443)
2012 (n=604)
2010 (n=622)
Yes No It depends on the position

Promotional Guidelines WorldatWork 14
Effect of Promotions on Merit Increases and Variable Pay Awards Figure 18: “How are merit increases managed for promoted employees?”
2010 2012 2014 2016
n= 620 601 443 512 Promoted employees are eligible for the nearest merit increase. 46% 43% 33% 34%5 Practice varies by employee or manager or is determined on a case-by-case basis. n/a n/a 24% 24%
The merit increase is included in the promotional increase. 17% 19% 16% 17% Promoted employees are eligible for a prorated merit increase. 16% 12% 9% 10% Promoted employees are ineligible for a merit increase until the next cycle. 7% 7% 7% 7% We do not offer merit increases. n/a n/a 2% 2%
• Other: Depends on timing of the promotion 15% 19% 9% 7%
Time and Frequency Figure 19: “When do most promotions in your organization occur?”
5 In 2016, the percentage of companies granting eligibility for the nearest merit increase to promoted employees has statistically significantly declined (34%) since 2010 (46%).
74%
17%
6%1% 2%
72%
19%
7%1% 2%
71%
16%
9%2% 3%
68%
19%
7%3% 3%
As needed Annually Every 6 months Quarterly Other
2010 (n=622) 2012 (n=601) 2014 (n=443) 2016 (n=512)

Promotional Guidelines WorldatWork 15
Figure 20: “How soon after hire are employees eligible for a promotion? Please choose an answer for each employee category.”
n= No minimum; immediate if necessary
No promotions within first
three months of service
No promotions
within first six months of
service
No promotions
within first 12 months of
service
Not until other specific days
or months
Nonexempt (hourly) 465 47% 6% 23% 22% 2% Exempt (salaried) 498 48% 4% 20% 24% 3% Officers/executives 458 66% 2% 12% 16% 4%
Figure 21: “How often are employees eligible for promotion?”
2010 2012 2014 2016 n= 613 594 373 511
No limit or formal policy 59% 63% 58% 61% 12 months after last promotion 16% 18% 16% 14% Depends on employee level or position n/a n/a 12% 14% 6 months after last promotion 12% 9% 7% 7% 18 months after last promotion 3% 2% 3% 1% 24 months after last promotion 2% 2% 2% 1% 9 months after last promotion 0% 1% 1% 0% Other 7% 6% 2% 2%
Figure 22: “How are bonus or incentive payouts calculated for employees who have received a
promotional increase?”
2010 2012 2014 2016 n= 579 580 371 510
Prorate of previous and new rates 43% 46% 37% 41% New rate of pay and new bonus rate, if applicable 29% 29% 29% 29% Not applicable; we do not offer bonuses or incentives n/a n/a 11% 12% Previous rate of pay and previous bonus rate 4% 5% 6% 5% Current rate of pay and previous bonus rate 3% 2% 2% 3% Previous rate of pay and new bonus rate 1% 1% 2% 1% Other:
• New rate of pay and prorated bonus rate • Depends on timing of the promotion
19% 18% 14% 11%

Promotional Guidelines WorldatWork 16
Promotional Opportunities and Employee Motivation Figure 23: “Does your organization feature or market the promotional opportunities (or activities) as a
key employee benefit when attempting to attract new employees?”
Figure 24: “What would your workforce say is the effect of your organization’s promotional opportunities
(or activities) on:”
n= Extremely positive or
positive effect No effect or
neutral Extremely negative or
negative effect Employee satisfaction 496 59% 36% 5% Employee motivation 497 65% 31% 4% Employee engagement 497 60% 35% 4%
Global Practices Only participants with responsibil ity for more than one region or country, as shown in see Figure 5, received the following questions. Figure 25: “If you have employees in multiple countries, how are your promotional guidelines or policies
designed and administered?”
2012 2014 2016 n= 136 120 149
Promotional guidelines are designed primarily at the corporate level, and all employees generally participate in the same programs, with flexibility for local countries to make limited adaptations or implement unique programs of nominal cost.
51% 44% 40%
Promotional guidelines are designed exclusively at the corporate level, and all employees worldwide participate in the same programs. 31% 31% 37%
Promotional guidelines are designed and administered primarily at the local level to ensure they are meeting the unique needs of local employees. 10% 15% 13%
Promotional guidelines are designed with significant input from local human resources and/or line management. One or a few core promotional policies or guidelines exist 8% 10% 10%
Yes36%
Yes37%
Yes40%Yes
35%
No64%
No63%
No60%
No66%
2016 (n=510)2014 (n=370)2012 (n=596)2010 (n=614)

Promotional Guidelines WorldatWork 17
company wide. However, different countries have significant latitude to implement additional local programs based on local practice and competitive factors.
Figure 26: “Are your promotional guidelines or policies applied consistently to all countries?”
Yes60%
Yes65%
Yes66%
No40%No
35%No
34%
2016 (n=147)2014 (n=122)2012 (n=140)

Promotional Guidelines WorldatWork 18
Participating Organizations
2U Inc. AAM Abacus Technology ACCO Brands Accuray Acosta Sales & Marketing ACT AgFirst Farm Credit Bank Aimia Inc. Air Liquide USA Airbus Helicopters Inc. Alaska Communications Alion Science and Technology Alkermes Alliance Data Alliant Energy Allscripts AM Castle & Co. Ameren Corp. American Dental Association American Family Insurance American Red Cross American University AmeriGas Propane Inc. AmeriHealth Caritas Amica Mutual Insurance Amneal Pharmaceuticals Applied Materials Apptio Aramark Uniform Services Argonne National Laboratory Arkansas Electric Cooperatives Arkema Inc Ascensus Aspen Technology Aurora Health Care Automobile Club of Southern California AXA US AZZ Inc. Babcock and Wilcox Bank of Hawaii Bankrate Inc. BarclaycardUS Barry Callebaut BBVA Compass BCBSMA Beaumont Health Bechtel Marine Propulsion Corp. Bell Canada Black Hills Corp. BlackBerry Limited
Blue Cross Blue Shield of Kansas Blue Cross Blue Shield of South Carolina Blue Cross Blue Shield of Tennessee BMW Manufacturing BNSF Railway Co. Booz Allen Hamilton Boston College Boston Scientific Bridgepoint Education Brigham Young University Broadridge Financial Solutions Inc. Bucknell University Canon Solutions America Canon USA Capital One Financial CARE CareerBuilder Carpenter Technology Corp. Centene CenterPoint Energy Inc. CF Industries CGI Group Inc. Chemtura Corp. Chico's FAS Inc. Children's National Health System Chipotle Mexican Grill CHRISTUS Health CHS Inc. Cincinnati Children's Hospital Medical Center Citizens Property Insurance Corp. City of Ann Arbor Clarins Clean Harbors CME Group CNA Insurance Cognex Colas USA Colgate Palmolive Colonial Pipeline Co. Columbia University CommScope Compass Group Canada Conifer Health Solutions Corporate Office Properties Trust Cotiviti County of Kent CUNA Mutual Group Curtiss-Wright Corp. Cushman & Wakefield Facilities & Engineering (S) Pte Ltd Daymon Worldwide

Promotional Guidelines WorldatWork 19
Dealer Tire LLC Dealertrack DENSO International America Inc. Dex Media Inc. DHL Supply Chain Dick's Sporting Goods Digi International Direct Energy Discover Financial Services DLA Piper LLP (US) Dominion Resources Inc. Draeger Driscoll's DRS Technologies Dunkin' Brands Inc. E & J Gallo Winery Eaton Elbit Systems of America EmblemHealth Empire Life Insurance Co. Encana Enerflex Ltd. EnLink Midstream Ensco plc Equity Office Properties ESP LLC Eventbrite Evonik Corp. Excellus BCBS Express Scripts Fallon Health Federal-Mogul FedEx Ground Feeding America Fike Corp. FINRA FirstEnergy Service Corp. FirstGroup America (part of FirstGroup plc) FIS Flagstar Bank Flex Ford Motor Co. Franciscan Missionaries of Our Lady Health System Frankenmuth Insurance Freeman Co. Fruit of the Loom GameStop Geisinger Health System Gemological Institute of America General Mills Inc. General Motors Genomic Health Genpact
Glassdoor Goodwill Industries of Southeastern WI Grande Cheese Co. Graphic Packaging International Great Canadian Gaming Corp. Great-West Life GWL Hancock Holding Co. HarbisonWalker International Hasbro Inc. Hawaii Employers Council Hayashi Telempu North America HD Supply Health New England Healthfirst Helen of Troy Henkes & McCoy Hennepin Health System Heraeus Kulzer Herbalife International of America Hess HNTB Corp. Hollard Hologic Inc. HomeAway Inc. Honda North America Inc. Honeywell FM&T HonorHealth Horace Mann Educators Corp. Host Analytics Houghton Mifflin Harcourt Howard Hughes Medical Institute HubSpot Hyster-Yale Group Idaho National Laboratory IDEXX Laboratories Inc. IEEE Imperial Supplies IMS Health Incyte Independence Blue Cross Ingevity Corp. Ingram Micro Inc. Insitu Institute for Defense Analyses Intalere International Paper Intuit IRC Ironwood Pharmaceuticals ITC Holdings Corp. J. J. Keller & Associates Inc. Jack Henry & Associates Inc. Jack in the Box Inc.

Promotional Guidelines WorldatWork 20
Jackson Health System JEA Jefferson Science Associates Jet Propulsion Laboratory John Wiley & Sons Australia Ltd Johnson Controls Inc. Kaiser Permanente Kelly Services Kforce Kirkland's Inc. Kuehne + Nagel Canada L-3 WESCAM Lafarge Canada Inc. Laird Lam Research Lancaster General Health Laredo Petroleum Lawrence Livermore National Laboratory Lear Corp. Lehigh Valley Health Network Leidos Inc. Leupold & Stevens Inc. Level 3 Communications LexisNexis Risk Solutions LifeLabs Lifetime Brands Inc. Los Alamos National Laboratory Love's Travel Stop and Country Store Lower Colorado River Authority LPL Financial Lumentum Macy's Macy's Systems & Technology Main Line Health Management Sciences for Health Manhattan Associates Inc. Manulife Financial Mary Kay Inc. Media General Inc. MEDNAX Services Inc. Mersen USA Bn Corp. Microsoft Miraca Life Sciences Mitchell International Moody's Morningstar Mountain America Credit Union MSC Industrial Direct National Football League Nationstar Mortgage Nationwide Insurance NAV CANADA Navy Federal Credit Union NBTY Inc.
NCI Building Systems NEC Corporation of America New York Life Insurance Co. NewMarket Corp. NiSource Inc. Nordson Corp. Northwestern Mutual Novartis Novozymes North America NSF International NVIDIA Corp. Ocean Spray Cranberries Inc. OCLC OGE Energy Corp. Omaha Public Power District One Call Care Management OneAmerica Financial Partners Inc. OneMain Holdings Inc. ONEOK Inc. Oshkosh Corp. Osram Panera Bread Paycor Pekin Insurance PeroxyChem LLC PetSmart Inc. Philips Lighting Americas Pinnacle Foods Pioneer Investments PNM Resources Inc. Pöyry Premier Health Princess Auto Ltd. Private Bancorp Inc. Progress Project HOPE Provident Bank PTC Public Service Enterprise Group PVH Corp. QBE Asia Pacific QBE GSSC Qorvo Qualcomm Quantum Corp. RAND Corp. Randstad US Raytheon Co. Red Robin Gourmet Burgers Regeneron Remy Cointreau USA Republic Airways Holdings Revlon RingCentral

Promotional Guidelines WorldatWork 21
Rockwater Energy Solutions Inc. Rowan Ryder System Inc. Ryerson University Sabre Corp. Safwa Cement Co. Salt River Project SanDisk santander españa SAS Institute Savannah River Remediation Scientific Research Corp. Seattle Genetics Inc. Serta Simmons Bedding LLC Simmons Foods SLAC National Accelerator Laboratory Snapchat Inc. Solar Turbines Inc. Solix Inc. Sonora Quest Laboratories Southern Co. Southland Industries Spectra Energy Splunk Sprouts Farmer's Market SRI International St. Jude Medical St. Vincent's Healthcare Stage Stores Inc. StandardAero STIHL Inc. STMicroelectronics Inc. Sutter Health Terracon Consultants Inc. Tesoro Corp. Textron Systems Corp. The Johns Hopkins University/Applied Physics Laboratory The Marcus Corp. The Maschhoffs The Rockefeller Group The Schwan Food Co. The Trustmark Companies The University of Chicago Thomas Jefferson University and Jefferson Health Thrivent Financial Time Warner Cable Tower International Toyota Boshoku America TriZetto
Trupanion TVA UCB Inc. Union Bank & Trust University of California Office of the President University of Dayton University of Maryland Medical System University of Maryland University College University of Notre Dame University of St. Thomas UNS Energy Corp. US Pharmacopeia USO Inc. UT Health Science Center San Antonio UTC Aerospace Systems Inc. Vantiv Vector Security Inc. Veolia North America Verisign Veritas Virginia Mason Viskase Companies Inc. VMWare Volkswagen Group of America Chattanooga Operations LLC VSP Walt Disney Parks and Resorts Washington Metropolitan Area Transit Authority WBI Energy Inc. Weber Shandwick Weill Cornell Medicine Wellesley College Wellmark Blue Cross Blue Shield Western & Southern Financial Group Western Union Westfield Group Westinghouse Electric Co LLC. Whataburger Whirlpool Corp. Whole Foods Market Wind River Wolters Kluwer Woodforest National Bank Workplace Safety & Insurance Board World Vision US Xactly Corp. Xcel Energy Inc. Xero Xome Ziggo Zurich North America


