Vol. 10, No. 1/January 1993/J. Opt. Soc. Am. A 127 Propagation of photon-density waves in strongly scattering media containing an absorbing semi-infinite plane bounded by a straight edge Joshua B. Fishkin and Enrico Gratton Laboratory for Fluorescence Dynamics, Department of Physics, University of Illinois at Urbana-Champaign, 1110 West Green Street, Urbana, Illinois 61801 Received March 2, 1992; revised manuscript received May 18, 1992; accepted July 2, 1992 Light propagation in strongly scattering media can be described by the diffusion approximation to the Boltzmann transport equation. We have derived analytical expressions based on the diffusion approximation that describe the photon density in a uniform, infinite, strongly scattering medium that contains a sinusoidally intensity-modulated point source of light. These expressions predict that the photon density will propagate outward from the light source as a spherical wave of constant phase velocity with an amplitude that attenuates with distance r from the source as exp(-ar)/r. The properties of the photon-density wave are given in terms of the spectral properties of the scattering medium. We have used the Green's function obtained from the dif- fusion approximation to the Boltzmann transport equation with a sinusoidally modulated point source to derive analytic expressions describing the diffraction and the reflection of photon-density waves from an absorbing and/or reflecting semi-infinite plane bounded by a straight edge immersed in a strongly scattering medium. The analytic expressions given are in agreement with the results of frequency-domain experiments performed in skim-milk media and with Monte Carlo simulations. These studies provide a basis for the understanding of photon diffusion in strongly scattering media in the presence of absorbing and reflecting objects and allow for a determination of the conditions for obtaining maximum resolution and penetration for applications to op- tical tomography. 1. INTRODUCTION Light diffusion in strongly scattering media is of primary importance in several fields, including spectroscopy of highly turbid media and optical imaging of thick tissues. 7 After a few scattering events the light propagation pro- cess can be treated as a transport of particles that un- dergo a large number of collisions, performing a random walk through the scattering medium. This diffusion ap- proximation is valid at distances from the light source much larger than the mean free path for light scattering. 89 In a macroscopically uniform medium without boundaries the measurement of the average light intensity at different distances from the source and at different angles cannot separate scattering from absorption properties. For the case of multiple scattering of light, fluctuation correlation spectroscopy has been used largely in the study of optical properties, with an emphasis on the determination of the diffusion coefficient of the scattering particles. A large literature on this subject exists, and for a review we refer to Ref. 1. However, when the problem is the identifica- tion of macroscopic regions in the scattering medium with different absorption and transport scattering coefficients, this approach cannot be used. In the present approach we neglect the diffusion of the scattering particles. It has been suggested that the use of short light pulses can pro- vide a better approach to the identification of different macroscopic regions with different optical properties, since the time of photon propagation through a strongly scattering medium is related to the effective optical path, which is dependent on the absorption and transport scat- tering coefficients of the medium. Time gating makes possible discrimination between the direct optical path and the longer photon paths, which permits one to isolate regions of the medium with different optical properties. A number of publications have recently appeared on the different aspects of light pulse propagation and reflection, almost exclusively in the time domain. 4 ' 6 ' 10 " In this paper we present the complementary frequency- domain approach, and we show that in the frequency domain the problem of light propagation in strongly scat- tering media can be treated within the familiar frame- work of wave phenomena. It must be remembered that, in the frequency-domain method, only the front of the photon-density wave is considered, not the optical light front, which is multiply scattered in the diffusion regime. In particular, we derive the Green's function for the diffu- sion approximation to the Boltzmann transport equation with a sinusoidally modulated point source, and we experi- mentally verify the basic predictions of the theory. Hav- ing in mind the problem of optical imaging of tissues and its application to medicine, we performed a frequency- domain study of the problem of the diffusion of photons in the presence of a semi-infinite absorbing plane bounded by a straight edge. Our aim in studying the effect of the edge on the diffusing photons is to determine systemati- cally the conditions necessary for obtaining the highest spatial resolution by observing how different parameters of the experiment affect the sharpness of the edge. In this paper we present an analytical solution to the edge problem in the frequency domain that is derived from the above-mentioned Green's function, and we verify with ex- periments the principal features of the solution. Hebden and Kruger have reported preliminary time-domain ob- 0740-3232/93/010127-14$05.00 C 1993 Optical Society of America J. B. Fishkin and E. Gratton
Transcript
Vol. 10, No. 1/January 1993/J. Opt. Soc. Am. A 127
Propagation of photon-density waves in strongly scatteringmedia containing an absorbing
semi-infinite plane bounded by a straight edge
Joshua B. Fishkin and Enrico Gratton
Laboratory for Fluorescence Dynamics, Department of Physics, University of Illinois at Urbana-Champaign,1110 West Green Street, Urbana, Illinois 61801
Received March 2, 1992; revised manuscript received May 18, 1992; accepted July 2, 1992
Light propagation in strongly scattering media can be described by the diffusion approximation to theBoltzmann transport equation. We have derived analytical expressions based on the diffusion approximationthat describe the photon density in a uniform, infinite, strongly scattering medium that contains a sinusoidallyintensity-modulated point source of light. These expressions predict that the photon density will propagateoutward from the light source as a spherical wave of constant phase velocity with an amplitude that attenuateswith distance r from the source as exp(-ar)/r. The properties of the photon-density wave are given in termsof the spectral properties of the scattering medium. We have used the Green's function obtained from the dif-fusion approximation to the Boltzmann transport equation with a sinusoidally modulated point source to deriveanalytic expressions describing the diffraction and the reflection of photon-density waves from an absorbingand/or reflecting semi-infinite plane bounded by a straight edge immersed in a strongly scattering medium.The analytic expressions given are in agreement with the results of frequency-domain experiments performedin skim-milk media and with Monte Carlo simulations. These studies provide a basis for the understandingof photon diffusion in strongly scattering media in the presence of absorbing and reflecting objects and allowfor a determination of the conditions for obtaining maximum resolution and penetration for applications to op-tical tomography.
1. INTRODUCTION
Light diffusion in strongly scattering media is of primaryimportance in several fields, including spectroscopy ofhighly turbid media and optical imaging of thick tissues. 7
After a few scattering events the light propagation pro-cess can be treated as a transport of particles that un-dergo a large number of collisions, performing a randomwalk through the scattering medium. This diffusion ap-proximation is valid at distances from the light sourcemuch larger than the mean free path for light scattering.8 9
In a macroscopically uniform medium without boundariesthe measurement of the average light intensity at differentdistances from the source and at different angles cannotseparate scattering from absorption properties. For thecase of multiple scattering of light, fluctuation correlationspectroscopy has been used largely in the study of opticalproperties, with an emphasis on the determination of thediffusion coefficient of the scattering particles. A largeliterature on this subject exists, and for a review we referto Ref. 1. However, when the problem is the identifica-tion of macroscopic regions in the scattering medium withdifferent absorption and transport scattering coefficients,this approach cannot be used. In the present approach weneglect the diffusion of the scattering particles. It hasbeen suggested that the use of short light pulses can pro-vide a better approach to the identification of differentmacroscopic regions with different optical properties,since the time of photon propagation through a stronglyscattering medium is related to the effective optical path,which is dependent on the absorption and transport scat-tering coefficients of the medium. Time gating makes
possible discrimination between the direct optical pathand the longer photon paths, which permits one to isolateregions of the medium with different optical properties.A number of publications have recently appeared on thedifferent aspects of light pulse propagation and reflection,almost exclusively in the time domain.4'6' 10"
In this paper we present the complementary frequency-domain approach, and we show that in the frequencydomain the problem of light propagation in strongly scat-tering media can be treated within the familiar frame-work of wave phenomena. It must be remembered that,in the frequency-domain method, only the front of thephoton-density wave is considered, not the optical lightfront, which is multiply scattered in the diffusion regime.In particular, we derive the Green's function for the diffu-sion approximation to the Boltzmann transport equationwith a sinusoidally modulated point source, and we experi-mentally verify the basic predictions of the theory. Hav-ing in mind the problem of optical imaging of tissues andits application to medicine, we performed a frequency-domain study of the problem of the diffusion of photons inthe presence of a semi-infinite absorbing plane boundedby a straight edge. Our aim in studying the effect of theedge on the diffusing photons is to determine systemati-cally the conditions necessary for obtaining the highestspatial resolution by observing how different parametersof the experiment affect the sharpness of the edge. Inthis paper we present an analytical solution to the edgeproblem in the frequency domain that is derived from theabove-mentioned Green's function, and we verify with ex-periments the principal features of the solution. Hebdenand Kruger have reported preliminary time-domain ob-
0740-3232/93/010127-14$05.00 C 1993 Optical Society of America
J. B. Fishkin and E. Gratton
128 J. Opt. Soc. Am. A/Vol. 10, No. 1/January 1993
servations of the effect of an absorbing edge on photondiffusion." We perform frequency-domain Monte Carlosimulations of particles diffusing in a lattice in which wesimulate the presence of an absorbing plane bounded by astraight edge to verify the theoretical prediction furtherand to compare it with experiments.
The detection of unscattered photons in strongly scat-tering media has also received attention.' Of course, ifunscattered light can be detected, optical spectroscopyand optical imaging are feasible in the conventional way.However, for most applications to the medical field, theuse of unscattered light for optical imaging is restricted toonly a few tissues such as the eye or to tissues that are atmost a few millimeters thick.'4
2. ANALYTICAL SOLUTION FOR AUNIFORM INFINITE MEDIUM
An isotropic source of visible or near-infrared light isimmersed in a macroscopically homogeneous, stronglyscattering medium. It is assumed for this case that thedensity of photons U(r, t) and the photon current den-sity J(r, t) satisfy the diffusion approximation to theBoltzmann transport equation 9 5 :
where v is the speed of a photon in the transporting me-dium (i.e., water in our experiments), D is the diffusioncoefficient, namely,
D = {3 [P'a + AL(l - g)1-1, (2)
Ia is the linear absorption coefficient (i.e., the inverse ofthe mean free path for photon absorption, with units ofinverse distance), ,ut is the linear scattering coefficient(i.e., the inverse of the mean free path for photon scatter-ing), g is the average of the cosine of the scattering angle,and qo(r, t) is the photon source. Equations (1) imply a tre-mendous simplification. Use of the diffusion approxima-tion to the Boltzmann transport equation means neglectof interference terms arising from the superpositioning ofelectromagnetic fields. Polarization as a degree of free-dom is also neglected. The density of photons and thephoton current density can be accurately calculated fromthe diffusion approximation to the Boltzmann transportequation when the point of interest is far from sources orboundaries and when the ratio ,s/(a + U) is close tounity, i.e., when the absorption of the medium is low.'5
In the case of a sinusoidally intensity-modulated pointsource of light, the photon source is
we obtain the steady-state equations (i.e., the dc part)
v,/J[U(r)]dC + V [J(r)]dc= S8(r),
[J(r)]dC = -vDV[U(r)]dc
(5a)
(5b)
and the frequency-dependent equations (i.e., the ac part)
We make the assumption that coD << v, which is equiva-lent to saying that the wavelength in vacuum of the wave ofangular frequency co is much larger than the distance be-tween the scattering particles in the medium. With thisassumption Eq. (6b) reduces to
(7)
Eliminating the dependent variable [J(r)]dc from Eqs. (5),we obtain the steady-state diffusion equation
V2[U(r)]dc - (a/D) [U(r)]de = -(S/vD)8(r). (8)
Eliminating the dependent variable [J(r)]ic from Eq. (6a)and expression (7), we obtain the frequency-dependent dif-fusion equation
V2 [U(r)] - i) [U(r)] = -SA (r).vD v D
(9)
For an infinite medium, Eqs. (8) and (9) can easily be solvedto yield
S [ A(-,./2 SAU(r, t) = 4'D exp -r- ] + 4rrvDr
4 r 2 2 + D2 /4 [1 j1exp-r a2D2 ) cosl 2 tan -Hf
X ex(rk v2D
2
- i(cot + E)}-
sin F- tan' (o) 12
\V/~La/ 1
(10)
For a nonabsorbing medium, Aa = 0, and Eq. (10) reduces to
U(r, t) = S u S A exp -]47rvDr 4vDr exP /
X exp [ir(0) - E()t + e.
Equation (10) is the Fourier transform equivalent of
p(r, t) = (4-;rvDt)1 exp - 4vDt - aVt
(11)
(12)
qo(r, t) = (r)S{1 + A exp[-i(wt + e)]}, (3)
where 8(r) is a Dirac delta function located at the origin, Sis the fluence of the source (in photons per second), A is themodulation of the source, i = VIY, w is the angular modu-lation frequency of the source, and is an arbitrary phase.Substituting Eq. (3) into Eq. (la) and assuming that U(r, t)and J(r, t) have the forms
which is the time-dependent solution of the diffusionequation as reported by Patterson et al.6 Here, p(r, t) isthe photon density that satisfies the diffusion approxima-tion to the Boltzmann transport equation when the sourceterm is a narrow pulse given by q0(r, t) = 8(r)8(t). Exami-nation of Eqs. (10) and (11) shows that the photon densityU(r, t) generated by a sinusoidally intensity-modulatedpoint source immersed in a strongly scattering, infinitemedium constitutes a scalar field that is propagating ata constant speed in a spherical wave and attenuates as
J. B. Fishkin and E. Gratton
Wr)]. =--- -vDV[U(r)1..
Vol. 10, No. 1/January 1993/J. Opt. Soc. Am. A 129
exp(-ar)/r as it propagates. Equations (10) and (12) showthe practical difference in describing photon diffusion inthe frequency domain with respect to its Fourier trans-form equivalent in the time domain: the photon densitygenerated by a sinusoidally intensity-modulated source atany given modulation frequency propagates with a singlephase velocity, while pulses undergo dispersion owing tothe different phase velocity of each frequency componentof the pulse.
The approach that regards photon transport in stronglyscattering media as a diffusional process shows that lightemitted from a sinusoidally intensity-modulated pointsource in such a medium can be treated within the frame-work of wave phenomena; we therefore refer to U(r, t) as aphoton-density wave. The study of the propagation, thereflection, and the refraction of these waves becomes atrivial problem. For a nonabsorbing medium the photon-density wave emitted from a source of angular modulationfrequency co has a wavelength, from Eq. (11), of
tive to the source, the average intensity of the detectedsignal (i.e., the dc), and the amplitude of the frequency-dependent part of the detected signal (i.e., the ac), areshown in Fig. 1(b). Equation (10) yields expressions forthese experimentally determined quantities in a uniform,infinite medium:
1V21A.2 + 1O, /(= (2D2 )2r/4 sin I tan'(0
(15)
(16)ln[(r)(dc)] = -r() + ln(4 SD ),
ln[(r)(ac)] = V2(Aa2 + )2)1/4
X Cos - tan-( ±) 1 + In(S A). (17)
A = 2 (2vDIss) ,
and its wave front advances at constant speed
V = (2vDw)"2 .
(13)
(14)
Note that Eqs. (13) and (14), respectively, describe the wave-length and the phase velocity of a photon-density wave,not the wavelength and the phase velocity of the electro-magnetic wave, which is multiply scattered for the case ofvisible and near-infrared light propagating over large dis-tances in strongly scattering media. Sinusoidal modula-tion of the intensity of a light source in strongly scatteringmedia has the following consequences:
The above three expressions are linear functions of thesource/detector separation r but have a more complicated
(a)source
.E
(1) A diffraction pattern caused by an object immersedin a strongly scattering medium should be evident in thepresence of a photon-density wave. From the Green'sfunction solution of Eq. (9), we can use the superpositionprinciple to calculate this diffraction pattern caused bythe absorbing and/or reflecting object.
(2) An apparent index of refraction of the photon-density wave can be defined as the ratio of the phase ve-locity of the photon-density wave to the phase velocity oflight in vacuum.
(3) The phase velocity is dependent on the modulationfrequency of the source but is independent of the distancefrom the source.
(4) There is an exponential attenuation of the ampli-tude of a photon-density wave as it propagates in thestrongly scattering medium because of the first-ordertime derivative in Eqs. (1).
Figure 1(a) gives a schematic representation of light in-tensity measured in response to a narrow pulse emittedinto a strongly scattering medium, and Fig. 1(b) shows thetime evolution of the intensity measured when light froma sinusoidally intensity-modulated source propagatesthrough the same medium. In Fig. 1(b) the light signalmeasured by the detector is of the same modulation fre-quency as that of the light source, but it is shifted in phaseand demodulated relative to the light source. The quanti-ties that are measured in a frequency-domain experiment,namely, the phase lag cF of the signal at the detector rela-
e0)rZ
d tctor
two time
time
Fig. 1. (a) Schematic representation of the time evolution of thelight intensity measured in response to a narrow light pulsetraversing an arbitrary distance in a scattering and absorbingmedium. If the medium is strongly scattering, there are no un-scattered components in the transmitted pulse. (b) Time evolu-tion of the intensity from a sinusoidally intensity-modulatedsource. The transmitted photon wave retains the same fre-quency as the incoming wave but is delayed owing to the phasevelocity of the wave in the medium. The reduced amplitude ofthe transmitted wave arises from attenuation related to scatter-ing and absorption processes. The demodulation is the ratio ac/dcnormalized to the modulation of the source.
J. B. Fishkin and E. Gratton
A
130 J. Opt. Soc. Am. A/Vol. 10, No. 1/January 1993
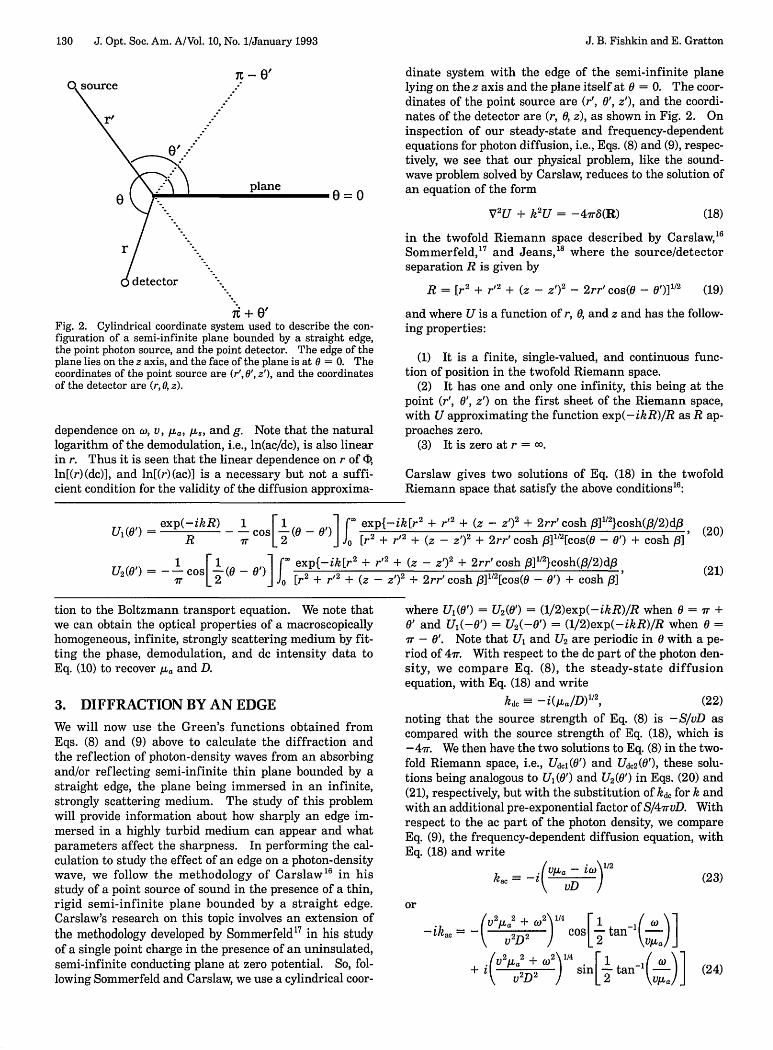
dinate system with the edge of the semi-infinite planelying on the z axis and the plane itself at 0 = 0. The coor-dinates of the point source are (r', 0', z'), and the coordi-nates of the detector are (r, 0, z), as shown in Fig. 2. Oninspection of our steady-state and frequency-dependentequations for photon diffusion, i.e., Eqs. (8) and (9), respec-tively, we see that our physical problem, like the sound-wave problem solved by Carslaw, reduces to the solution ofan equation of the form
V2U + k2U = -4g78(R) (18)
detector
+ e'Fig. 2. Cylindrical coordinate system used to describe the con-figuration of a semi-infinite plane bounded by a straight edge,the point photon source, and the point detector. The edge of theplane lies on the z axis, and the face of the plane is at 0 = 0. Thecoordinates of the point source are (r', 0', z'), and the coordinatesof the detector are (r, 0, z).
dependence on o, v, Fa, /L, and g. Note that the naturallogarithm of the demodulation, i.e., ln(ac/dc), is also linearin r. Thus it is seen that the linear dependence on r of C1,ln[(r)(dc)], and ln[(r)(ac)] is a necessary but not a suffi-cient condition for the validity of the diffusion approxima-
in the twofold Riemann space described by Carslaw, 6
Sommerfeld,' 7 and Jeans, 8 where the source/detectorseparation R is given by
R = [r2 + r2 + (z - Z')2 - 2rr' cos(0 - 0P)]1/2 (19)
and where U is a function of r, 0, and z and has the follow-ing properties:
(1) It is a finite, single-valued, and continuous func-tion of position in the twofold Riemann space.
(2) It has one and only one infinity, this being at thepoint (r', 0', z') on the first sheet of the Riemann space,with U approximating the function exp(-ikR)/R as R ap-proaches zero.
(3) It is zero atr= .
Carslaw gives two solutions of Eq. (18) in the twofoldRiemann space that satisfy the above conditions 6 :
exp(-ikR) 1 [1 ,1 J exp{-ik[r2 + r + (z - z')2 + 2rr'cosh f]1"2}cosh(13/2)d,8U, (0') = R C - O) Jo[ r2 + r + (z - Z)
2 + 2rr' cosh G]"'[cos(0 - 0') + cosh ,6]
U2 (0) =- 1 [1 ( - 0 J exp{-ik[r' + r" + (z - z')' + 2rr' cosh p]12}cosh(3/2)dj3Or 2 fJ [r' + r + (z - z') + 2rr' cosh 13]l2[cos(0 - 0') + cosh ,13]
tion to the Boltzmann transport equation. We note thatwe can obtain the optical properties of a macroscopicallyhomogeneous, infinite, strongly scattering medium by fit-ting the phase, demodulation, and dc intensity data toEq. (10) to recover A,, and D.
3. DIFFRACTION BY AN EDGE
We will now use the Green's functions obtained fromEqs. (8) and (9) above to calculate the diffraction andthe reflection of photon-density waves from an absorbingand/or reflecting semi-infinite thin plane bounded by astraight edge, the plane being immersed in an infinite,strongly scattering medium. The study of this problemwill provide information about how sharply an edge im-mersed in a highly turbid medium can appear and whatparameters affect the sharpness. In performing the cal-culation to study the effect of an edge on a photon-densitywave, we follow the methodology of Carslaw' 6 in hisstudy of a point source of sound in the presence of a thin,rigid semi-infinite plane bounded by a straight edge.Carslaw's research on this topic involves an extension ofthe methodology developed by Sommerfeld' 7 in his studyof a single point charge in the presence of an uninsulated,semi-infinite conducting plane at zero potential. So, fol-lowing Sommerfeld and Carslaw, we use a cylindrical coor-
where U(0') = U2 (0') = (1/2)exp(-ikR)/R when 0 = ir +0' and Ul(-0') = U2(-0') = (1/2)exp(-ikR)/R when 0 =7r - 0'. Note that U, and U2 are periodic in 0 with a pe-riod of 41r. With respect to the dc part of the photon den-sity, we compare Eq. (8), the steady-state diffusionequation, with Eq. (18) and write
kdc -iQua/D)", (22)noting that the source strength of Eq. (8) is -S/vD ascompared with the source strength of Eq. (18), which is- 4 ir. We then have the two solutions to Eq. (8) in the two-fold Riemann space, i.e., Ude,(0') and UdC2(0'), these solu-tions being analogous to U,(0') and U2(0') in Eqs. (20) and(21), respectively, but with the substitution of kdc for k andwith an additional pre-exponential factor of S/47rvD. Withrespect to the ac part of the photon density, we compareEq. (9), the frequency-dependent diffusion equation, withEq. (18) and write
kVa, - ic)1/2
k" =- vD y (23)
or- 2,,a2 + co2 1/4 1 / t
- ikac =_t V2 2 ) cos- tan V(-I
+ i 2 Aa 2 + C)20 1/4
V2D 2) sin[ 1 tan- °) (24)
source
0plane
e0=0
(20)
(21)
J. B. Fishkin and E. Gratton
;- 0,'
Vol. 10, No. 1/January 1993/J. Opt. Soc. Am. A 131
coordinate 0 = 7r + O', (1/2)exp(-ikR)/R is taken for U(6')and U2 is taken for U(-6'). Thus the solution to the prob-lem of the absorbing semi-infinite plane takes the follow-ing forms (refer to Fig. 3):
Region A:
A(1,1)plane
0=0
C(2,2)Region B:
Ud = Ud1l(0') - Udl(-6'),
Uac = Uacl(6') - Uacl(O') ;
Ud. = Ud1l(0') - Ud2(-6'),
Uac = Uaci(6') - Uac2( 0');
Region C:
d =
, + ' Uac =
UdC2(0') - Ud2(-6'),
Uac 2(0') - Uac2(6O');Fig. 3. Division of the physical space into three regions aboutthe semi-infinite plane bounded by a straight edge and the corre-sponding values of U1 and U2 used for U(6') and U(-O') in eachregion of the physical space.
and note that the source strength of Eq. (9) is -SA/vD.We then have the two solutions to Eq. (9) in the twofoldRiemann space, i.e., Uaci(6') and Uac2('), which are analo-gous to U1(0') and U2(0') in Eqs. (20) and (21), respectively,but with the substitution of kac for k and with an addi-tional pre-exponential factor of SA/47rvD.
The boundary condition imposed by a semi-infinite ab-sorbing plane is that the photon density U must vanish at
= 0 and = 2r. To satisfy this condition, we put polesat (r', ', z') and (r', -', z') and take the physical space tobe the first sheet of the twofold Riemann space, as de-fined by
0 < 0 < 2,
and the imaginary space to be the second sheet of the two-fold Riemann space, as defined by
-2i < 0 < 0.
Thus
U= U(0') - U(-0') (25)
satisfies all the conditions of the physical problem posedby an absorbing plane in a strongly scattering medium,where U(6') is the source function and U(-6') is the imagefunction.
As shown by Carslaw,'6 care must be taken in the choiceof proper values for U(6') and U(-6') in Eq. (25), the choiceof these functions being dependent on the value of in thephysical space. The physical space is divided into threeregions, as shown in Fig. 3. In the region 0 0 < r - 6'the values for both U(0') and U(-0') in Eq. (25) are givenby U1. In the region - ' < 0 < + 6 U is taken forU(0') and U2 is taken for U(-0'). In the region i + 6' <6 c 2r the values for both U(0') and U(-0') are given byU2. At the coordinate = r - 6', U is taken for U(0')and (1/2)exp(-ikR)/R is taken for U(-6'), where R is de-fined in Eq. (19) as the source/detector separation. At the
At 7r - 0':
U_~ - 1 S exp[-R(tLa/D)"2 ]Ud = Ud.1(0 ) -sD 2 4rvD R
-UA: = U.O- 1 SA exp(-ikR)Uac Uai(6') 2 470v R
At nr + 0':
-Ud = 1 S exp[-R(pka/D) 2 ] - Ud.2(-'0)
Udc = 2 4 D R
-Uv 1 SA exp(-ikacR)) _-. _0 2ac=2 4 D R
(32)
(33)
(34)
(35)
We see from Eqs. (26) and (27) that at 0 = 0, UdC = 0 andUac = 0 for 0 < r < , and from Eqs. (30) and (31) we seethat at = 2, Udc = 0 and Uac = 0 for 0 < r < .
For a reflecting semi-infinite plane the boundary condi-tion is that (1/r)aU/a6 must vanish at = 0 and = 2r.This condition is met in a manner that is analogous tothe solution for the photon-absorbing plane, the only dif-ference being that for the reflecting plane we add thesource function to the image function to satisfy theboundary condition.
Thus
U = U(0') + U(-0') (36)
satisfies the boundary condition imposed by a reflectingplane in a strongly scattering medium.
For the case of a semi-infinite plane that has a probabil-itypab. of absorbing a photon that collides with it, the solu-tion of the physical problem is given by
U = U(6') - Pabs U(-06) + (1 - Pabs)U( 0') . (37)
When Pabs = 1, Eq. (37) reduces to Eq. (25), the solutionfor the absorbing plane, and when Pabs = 0, Eq. (37) re-duces to Eq. (36), the solution for the reflecting plane. Ifsome of the light is able to pass through the plane, we addan isotropic source term such as Eq. (10) above at point(r', ', z') with a coefficient proportional to the transmis-sion probability and we normalize the absorption, reflec-tion, and transmission probabilities.
B(1,2)
(26)
(27)
(28)
(29)
(30)
(31)
J. B. Fishkin and E. Gratton
. - '
132 J. Opt. Soc. Am. A/Vol. 10, No. 1/January 1993
The phase shift (D relative to the source, the average (dc)intensity, and the amplitude of the frequency-dependentpart of the signal (the ac) are given by
= tani[(c)] (38)
dc = UdC, (39)
ac = [Re(Uac) 2 + Im(U) 2]1/2, (40)
respectively, and
demodulation = ac/dc, (41)
where Re(Uac) and Im(Uac) are, respectively, the real andthe imaginary parts of Uac
4. MONTE CARLO SIMULATION
To confirm further the validity of the analytical solutionand to treat problems with more complicated boundaryconditions, we implemented a Monte Carlo simulation pro-gram to trace individual photon histories. We simulateda point source of photons in a homogeneous cubic lattice inwhich each cell has a probability for absorption and scat-tering. We also added a semi-infinite absorbing planebounded by a straight edge to the homogeneous lattice,where the plane had the thickness of a lattice cell. Weperformed the simulations by using a random-numbergenerator to sample discrete events from probability dis-tributions derived from the speed of a photon, v, in thescattering medium, the absorption coefficient la, thescattering coefficient As, and the average cosine of scat-tering angle, g. In a given simulation we built up a timehistogram in the three-dimensional lattice by tracing atleast 106 individual photon histories. We then performeda fast Fourier transform on the time histogram at eachpoint in the lattice to obtain a frequency-domain MonteCarlo simulation, that is, a simulation of an intensity-modulated point source in a strongly scattering medium.The size of the lattice was such that, for the value of qused, no photon escaped the lattice.
5. EXPERIMENTAL APPARATUS ANDMETHOD
We have studied the photon-transport properties ofstrongly scattering media through frequency-domain ex-periments on 3.78 L of skim milk mixed with quantities ofblack India ink varying from no ink to 2000 AL of ink.We have qualitatively compared the data from the analyti-cal solutions, the Monte Carlo simulations, and the skim-milk experiments.
For the skim-milk experiments our light source was aSpectra Diode Laboratories SDL-2431-H2 diode laserwith a 1-m fiber optic pigtail of diameter 100 gm. Theaverage diode current was set at values ranging from 200to 830 mA and was sinusoidally modulated with a MarconiInstruments Model 2022A signal generator with its out-put amplified by a Model M502C wideband rf amplifierfrom RF Power Labs, Inc. In a given experiment, lightwas transferred from the diode laser into the skim-milk/black-India-ink medium through the optical fiber pigtailof the diode laser, the end of the fiber being immersed in
the milk/black-ink solution. The wavelength of the diode-laser light was 810 nm, and the intensity of the lightsource was modulated at frequencies ranging from 20 to120 MHz, the modulation frequency being fixed for a givenexperiment. The light detector was a 3-mm-diameter op-tical fiber bundle with one end immersed in the skim-milksolution and the other end attached to a Hamamatsu R928photomultiplier. The photomultiplier signals were pro-cessed by a cross-correlation electronics system using thedigital acquisition system described by Feddersen et al.9
In the course of the skim-milk experiments, care wastaken to keep the ends of the source and detector opticalfibers as far as possible from the walls of the solution con-tainer and from the surface of the solution. The entiresetup was completely protected from room light that couldinfluence the dc measurement.
Three types of experiment were performed by theMonte Carlo simulations and the skim-milk/black-India-ink experiments. In one type of experiment we measuredthe phase shift (D, the dc intensity, and the ac amplitude ofthe light intensity [Fig. 1(b) above] at a given modulationfrequency as a function of the source/detector separation rto verify the validity of the diffusion approximation resultof Eq. (10) above. Here, the phase data were recordedrelative to the phase measurement made at the shortestsource/detector separation distance, and the dc and acdata were normalized to the respective dc and ac valuesmade at the shortest source/detector separation distance.In the case in which this experiment was performed onskim milk, the end of the detector optical fiber was im-mersed in the milk at a distance r from the source opticalfiber, with the ends of the two fibers pointing in the samedirection, as shown in Fig. 4. This orientation of the endof the detector fiber relative to the end of the source opti-cal fiber ensured that only scattered photons were de-tected. In the skim-milk experiments the source/detectorseparation was varied from 2.5 to 9.6 cm in increments of0.115 cm during the course of an experiment. The twoother types of experiment were undertaken to verify thevalidity of Eqs. (26)-(35) above. We measured the effectthat an absorbing semi-infinite plane immersed in ourscattering media had on the intensity-modulated light.The geometry for these experiments is explained in thecaption to Fig. 5. We measured the phase shift AD, the dc
SINUSOIDALLYINTENSITY-MODULATED
LASER LIGHT
Fig. 4. Schematic of the experimental setup used to test thevalidity of the diffusion approximation result of Eq. (10) above.
J. B. Fishkin and E. Gratton
Vol. 10, No. 1/January 1993/J. Opt. Soc. Am. A 133
ij9TANK CONTAINING _ SOURCEMILK/BIACK INDIA _ OPTICALINK MIXTURE FIBER
. 14cm .
6. RESULTS OF EXPERIMENTS ONHOMOGENEOUS MEDIA
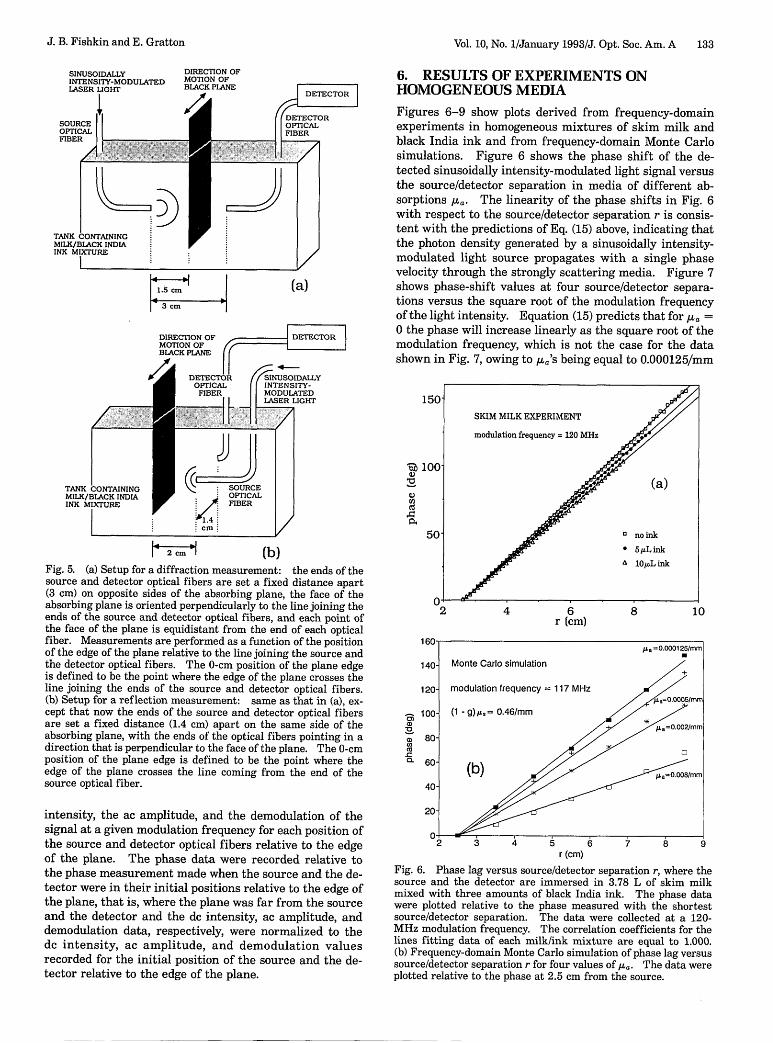
Figures 6-9 show plots derived from frequency-domainexperiments in homogeneous mixtures of skim milk andblack India ink and from frequency-domain Monte Carlosimulations. Figure 6 shows the phase shift of the de-tected sinusoidally intensity-modulated light signal versusthe source/detector separation in media of different ab-sorptions q. The linearity of the phase shifts in Fig. 6with respect to the source/detector separation r is consis-tent with the predictions of Eq. (15) above, indicating thatthe photon density generated by a sinusoidally intensity-modulated light source propagates with a single phasevelocity through the strongly scattering media. Figure 7shows phase-shift values at four source/detector separa-tions versus the square root of the modulation frequencyof the light intensity. Equation (15) predicts that for qua =0 the phase will increase linearly as the square root of themodulation frequency, which is not the case for the datashown in Fig. 7, owing to ,ua's being equal to 0.000125/mm
150
'3 100
I.)CZP.
./I" 2 cm 1 (b)
Fig. 5. (a) Setup for a diffraction measurement: the ends of thesource and detector optical fibers are set a fixed distance apart(3 cm) on opposite sides of the absorbing plane, the face of theabsorbing plane is oriented perpendicularly to the line joining theends of the source and detector optical fibers, and each point ofthe face of the plane is equidistant from the end of each opticalfiber. Measurements are performed as a function of the positionof the edge of the plane relative to the line joining the source andthe detector optical fibers. The 0-cm position of the plane edgeis defined to be the point where the edge of the plane crosses theline joining the ends of the source and detector optical fibers.(b) Setup for a reflection measurement: same as that in (a), ex-cept that now the ends of the source and detector optical fibersare set a fixed distance (1.4 cm) apart on the same side of theabsorbing plane, with the ends of the optical fibers pointing in adirection that is perpendicular to the face of the plane. The 0-cmposition of the plane edge is defined to be the point where theedge of the plane crosses the line coming from the end of thesource optical fiber.
intensity, the ac amplitude, and the demodulation of thesignal at a given modulation frequency for each position ofthe source and detector optical fibers relative to the edgeof the plane. The phase data were recorded relative tothe phase measurement made when the source and the de-tector were in their initial positions relative to the edge ofthe plane, that is, where the plane was far from the sourceand the detector and the dc intensity, ac amplitude, anddemodulation data, respectively, were normalized to thedc intensity, ac amplitude, and demodulation valuesrecorded for the initial position of the source and the de-tector relative to the edge of the plane.
50
0
-C
r (cm)
Fig. 6. Phase lag versus source/detector separation r, where thesource and the detector are immersed in 3.78 L of skim milkmixed with three amounts of black India ink. The phase datawere plotted relative to the phase measured with the shortestsource/detector separation. The data were collected at a 120-MHz modulation frequency. The correlation coefficients for thelines fitting data of each milk/ink mixture are equal to 1.000.(b) Frequency-domain Monte Carlo simulation of phase lag versussource/detector separation r for four values of a. The data wereplotted relative to the phase at 2.5 cm from the source.
J. B. Fishkin and E. Gratton
134 J. Opt. Soc. Am. A/Vol. 10, No. 1/January 1993
0,
la
Cu0.
r=lcm
r=2cm
r=3cm
r=4cm
0 8 16 24 32square-root mod. freq. [Sqrt(MHz)]
Fig. 7. Frequency-domain Monte Carlo simulation of phase lagversus the square root of modulation frequency. Each set of datawas obtained at a fixed source/detector separation.
c
5.0
10
6r (cm)
Fig. 8. (a) Natural logarithm of the source/detector separemultiplying the dc intensity obtained at r, versus r, whesource and the detector are immersed in 3.78 L of skimmixed with three amounts of black India ink. The dalnormalized to the r dc value at r = 2.5 cm. The correlationficients for the lines fitting these data are equal to(b) Monte Carlo simulation of ln(r dc) versus r for four valQua. The data are normalized to the r dc value at r = 2.5
in this particular frequency-domain Monte Carlo siition. Figures 8 and 9 report plots of the naturalrithm of the source/detector separation r multiplyirdc intensity and the ac intensity of the detectedsignal versus the source/detector separation r in me
c
5.
different absorptions a_ The linearity of the fits to thedata in Figs. 8 and 9 is consistent with the predictions ofEqs. (16) and (17) respectively, as are the decreasing valuesof the slopes of the linear fits to the data in Figs. 8 and 9with respect to the increasing media absorption ia.
The slopes of the linear fits to the phase-shift data ofFig. 6(a) were used in the calculation (Table 1) of values forthe wavelength A and the phase velocity V of sinusoidallyintensity-modulated light at 120-MHz modulation fre-quency as it propagates in the homogeneous scatteringmedium (3.78 L of skim milk mixed with no ink to 10 uLof black India ink). Comparing the wavelength and thephase velocity of the 120-MHz light-intensity wave in avacuum with the wavelength and the phase velocity of the120-MHz photon-density wave in the skim-milk media,
0h
10r (cm)
10r (cm)
Fig. 9. (a) Natural logarithm of the source/detector separation rmultiplying the ac amplitude obtained at r, versus r, where thesource and the detector are immersed in 3.78 L of skim milkmixed with three amounts of black India ink. The data are
lo normalized to the r ac value at r = 2.5 cm. The correlation co-efficients for the lines fitting these data are equal to 1.000.
Ltion r (b) Frequency-domain Monte Carlo simulation of ln(r ac) versus rre the for three values of /a-. The data are normalized to the r ac valueL milk at r = 2.5 cm.ta are1 coef- Table 1. Wavelength and Phase Velocity of a1.000.ues of Photon Density Wave in 3.78 L of Skim Milk
cm. Mixed with Black India Inka
mula-loga-
ng thelight
Ea of
A (mm) V (mm/s)
No ink 160 1.92 X 10'°5 L of black ink 168 2.02 X 10"10 L of black ink 176 2.11 X 10'°
&/21r = 120 MHz.
J. B. Fishkin and E. Gratton
Vol. 10, No. 1/January 1993/J. Opt. Soc. Am. A 135
lc
o
~0la
0
0.
0.
0.
0.
0.
0.
0.
0.
0.
C
~0
0
9 >>hi\ m = 0.0017/mm
= 0.008/mm
t.8- \ \\ lea= 0.032/mm
7- .= 0.128/mm
6
5-
4 Diffraction by an edge:
calculation
(1 -9)ILs = 0.50/mm (a)
0-5 -4 -3 -2 -1 0 1 2 3 4
source/det. pos. relative to edge (cm)
medium thus has implications for the use of sinusoidallyintensity-modulated light in the imaging of objects im-mersed in strongly scattering media: the effect of in-creasing the photon-absorbing properties of a scatteringmedium reduces the resolving power of the frequency-dependent part of the photon density by increasing itswavelength. This result is consistent with Eq. (10) above.Note that Eq. (10) also predicts that increasing the densityof scatterers in a transporting medium improves the re-solving power of the frequency-dependent part of the pho-ton density by reducing its wavelength. As the results inSection 7 will show, the ability to resolve an object im-mersed in a highly scattering medium may be improved by
Fig. 10. (a) Plots calculated from diffusion theory of dc intensityat four medium absorptions versus the position of an absorbingedge. (b) Measurement in skim milk mixed with four amountsof black India ink of dc light intensity versus the position of anabsorbing edge.
2.2-
2 Diffraction by an edge:
skim milk experiment
e 1 24\
0.6
0.4
0.2
00 5 10 15 20 25 30 35 40 45
square root of microliters of ink
Fig. 11. Inverse sharpness of an edge (the sharpness is the in-verse of the distance moved by the edge, relative to the source/detector position, that causes the intensity to decrease from 90%to 10% of the initial value) versus the square root of the volume ofblack India ink in the skim milk. This figure was derived fromthe plots in Fig. 10(b).
we see that the wavlength and the phase velocity of thephoton-density wave in skim milk are reduced by a factorof the order of 10 relative to the wavelength and the phasevelocity, respectively, of the light-intensity wave in avacuum. The values in Table 1 show that, as the mediumabsorption increases, the wavelength of the photon-densitywave increases, as does the phase velocity. The magnitudeof the photon-absorbing properties of a transporting
Fig. 13. (a) Plots calculated from diffusion theory of ac ampli-tude at four modulation frequencies versus the position of an ab-sorbing edge. (b) Frequency-domain Monte Carlo simulation ofac amplitude at three modulation frequencies versus the positionof an absorbing edge.
J. B. Fishkin and E. Gratton
136 J. Opt. Soc. Am. A/Vol. 10, No. 1/January 1993
50- (1 - = .bU/mm
°) 40- modulation frequency = 120 MHz~(40-O 30- it,~~~A = 0.00171lm A / /30
.> A 0.008/mm
20- = 0.032/mm
10- (a)
-10-5 0 , -4 -3 -2 -1 0 1 2 3 4
source/det. pos. relative to edge (cm)
80.0
70.0-Diffraction by an edge:
60.0 skim milk experiment
. 50.0v
40.0 modulation frequency= 120 MHz
ID 30.0O
7~ 20.0-*83 ~(b)10.0-
0.0 -- - -
-10.0-5 -4 -3 -2 -1 0 1 2 3 4
source/det. pos. relative to edge (cm)
| no ink -- 30 AL ink - 300pL ink
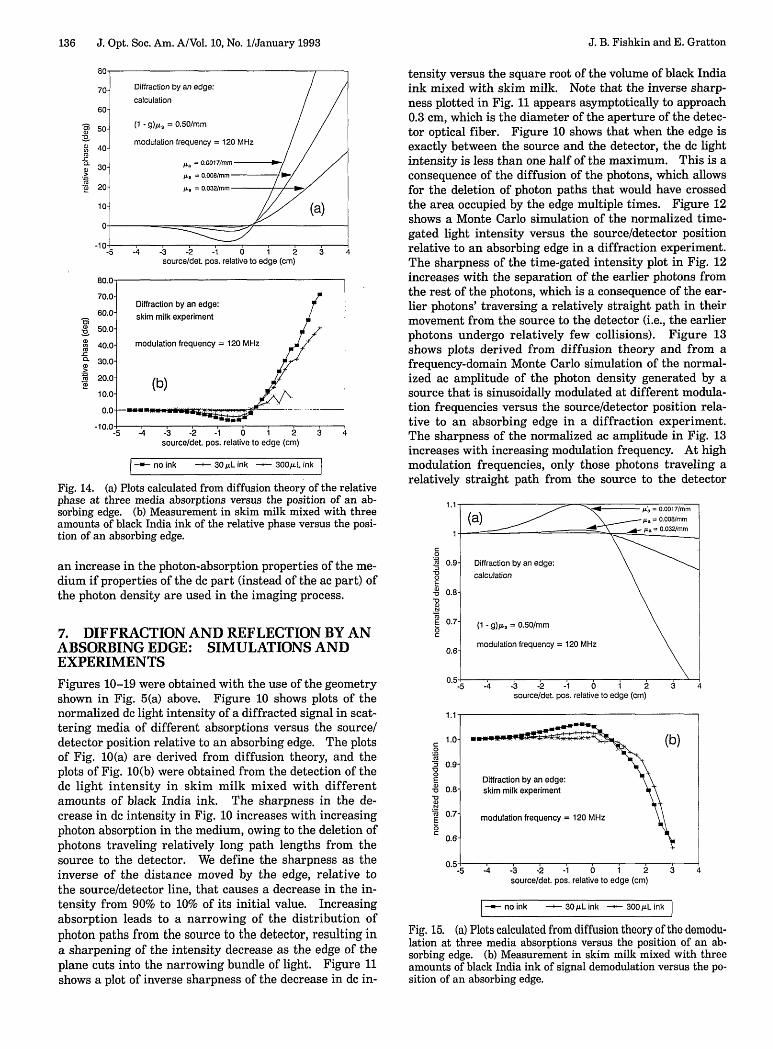
Fig. 14. (a) Plots calculated from diffusion theory of the relativephase at three media absorptions versus the position of an ab-sorbing edge. (b) Measurement in skim milk mixed with threeamounts of black India ink of the relative phase versus the posi-tion of an absorbing edge.
an increase in the photon-absorption properties of the me-dium if properties of the dc part (instead of the ac part) ofthe photon density are used in the imaging process.
7. DIFFRACTION AND REFLECTION BY ANABSORBING EDGE: SIMULATIONS ANDEXPERIMENTS
Figures 10-19 were obtained with the use of the geometryshown in Fig. 5(a) above. Figure 10 shows plots of thenormalized dc light intensity of a diffracted signal in scat-tering media of different absorptions versus the source/detector position relative to an absorbing edge. The plotsof Fig. 10(a) are derived from diffusion theory, and theplots of Fig. 10(b) were obtained from the detection of thedc light intensity in skim milk mixed with differentamounts of black India ink. The sharpness in the de-crease in dc intensity in Fig. 10 increases with increasingphoton absorption in the medium, owing to the deletion ofphotons traveling relatively long path lengths from thesource to the detector. We define the sharpness as theinverse of the distance moved by the edge, relative tothe source/detector line, that causes a decrease in the in-tensity from 90% to 10% of its initial value. Increasingabsorption leads to a narrowing of the distribution ofphoton paths from the source to the detector, resulting ina sharpening of the intensity decrease as the edge of theplane cuts into the narrowing bundle of light. Figure 11shows a plot of inverse sharpness of the decrease in dc in-
J. B. Fishkin and E. Gratton
tensity versus the square root of the volume of black Indiaink mixed with skim milk. Note that the inverse sharp-ness plotted in Fig. 11 appears asymptotically to approach0.3 cm, which is the diameter of the aperture of the detec-tor optical fiber. Figure 10 shows that when the edge isexactly between the source and the detector, the dc lightintensity is less than one half of the maximum. This is aconsequence of the diffusion of the photons, which allowsfor the deletion of photon paths that would have crossedthe area occupied by the edge multiple times. Figure 12shows a Monte Carlo simulation of the normalized time-gated light intensity versus the source/detector positionrelative to an absorbing edge in a diffraction experiment.The sharpness of the time-gated intensity plot in Fig. 12increases with the separation of the earlier photons fromthe rest of the photons, which is a consequence of the ear-lier photons' traversing a relatively straight path in theirmovement from the source to the detector (i.e., the earlierphotons undergo relatively few collisions). Figure 13shows plots derived from diffusion theory and from afrequency-domain Monte Carlo simulation of the normal-ized ac amplitude of the photon density generated by asource that is sinusoidally modulated at different modula-tion frequencies versus the source/detector position rela-tive to an absorbing edge in a diffraction experiment.The sharpness of the normalized ac amplitude in Fig. 13increases with increasing modulation frequency. At highmodulation frequencies, only those photons traveling arelatively straight path from the source to the detector
0
~00
E-o*0-0
0
1.
._*0
1x
'OE
0
0c
.
0.
0.
0.
0.
source/det. pos. relative to edge (cm)
source/det. pos. relative to edge (cm)
I no ink - 30 AL ink - 300AL ink
Fig. 15. (a) Plots calculated from diffusion theory of the demodu-lation at three media absorptions versus the position of an ab-sorbing edge. (b) Measurement in skim milk mixed with threeamounts of black India ink of signal demodulation versus the po-sition of an absorbing edge.
. -- W- =7__ (b)
9-
Diffraction by an edge: A8- skim milk experiment
7- modulation frequency = 120 MHz
6-
-5 -4 -3 -2 -1 6 i 2 3
Vol. 10, No. 1/January 1993/J. Opt. Soc. Am. A 137
Fig. 16. (a) Plots calculated from diffusion theory of the relativephase at three modulation frequencies versus the position of anabsorbing edge. (b) Measurement in skim milk of the relativephase at three modulation frequencies versus the position of anabsorbing edge.
survive, owing to the exp(-ar)/r attenuation of the acpart of the signal. In comparing the plots of Fig. 10 withthe plots of Figs. 12 and 13, we can see that the photon-absorption properties of a medium and the time resolutionof the scattered photons are analogous insofar as how theyaffect the resolution of the absorbing edge in the scatter-ing medium. Higher photon absorption in the mediumprovides sharper resolution of the edge when the dc inten-sity of the light signal is measured, owing to the deletionfrom the medium of photons traveling relatively longerpath lengths from the source to the detector; faster timegating or higher modulation frequencies provide sharperresolution of the edge in measurements of the time-gatedor frequency-dependent part of the signal, owing to thedetection of photons undergoing relatively few scatteringevents. Figures 14 and 15, respectively, show plots of thephase and the demodulation of a diffracted signal at 120-MHz modulation frequency versus the source/detector po-sition relative to an absorbing edge in media of differentabsorptions. The plots of Figs. 14(a) and 15(a) are derivedfrom diffusion theory, and the plots of Figs. 14(b) and15(b) were obtained from the detection of a sinusoidallyintensity-modulated light signal in skim milk mixed withdifferent amounts of black India ink. Figures 16 and 17,respectively, show plots of the phase and the demodulationof a diffracted signal at different modulation frequenciesversus the source/detector position relative to an absorbingedge. The plots of Figs. 16(a) and 17(a) are derived from
diffusion theory, and the plots of Figs. 16(b) and 17(b) wereobtained from the detection of a sinusoidally intensity-modulated light signal in skim milk. Figures 18 and 19,respectively, show plots of the phase and the demodulationof a diffracted signal at different modulation frequenciesversus the source/detector position relative to an absorbingedge. The plots of Figs. 18(a) and 19(a) are derived fromdiffusion theory, and the plots of Figs. 18(b) and 19(b) arefrom a frequency-domain Monte Carlo simulation.
The frequency-resolved plots of Figs. 14-19 show thatthe phase first decreases as the source and the detectorapproach the zero position and then sharply increases.The overall magnitude of the effect decreases as the pho-ton absorption within the medium increases. To explainthis effect qualitatively, we must consider that at thedetector we are measuring the contribution of photonstraveling throughout a distribution of paths. As thesource and the detector approach the zero position, thefield of view becomes occupied by the absorbing edge, andall the longer paths that would have crossed the boundarynow occupied by the edge are deleted. This deletioncauses an effective advance of the average wave front andan increase in the modulation of the signal. As the sourceand the detector move closer to the zero position, the phasereaches its minimum value and the modulation reaches itsmaximum value. When the edge passes the zero position,all the shorter paths are deleted, and the wave front isstrongly retarded and demodulated. The addition of inkeffectively deletes the longer photon paths, thereby de-
0
~0E
0
1.
a0
15
0
E-o
.31
0C:
0.
0.
0.
0.
0.
source/det. pos. relative to edge (cm)
9-Diffraction by an edge:e
)- skim milk experiment
7-
6 (b)
5-5 -4 -3 -2 -1 0 1 2
source/det. pos. relative to edge (cm)3 4
-120 MHz- 60MHz - 20 MHz I
Fig. 17. (a) Plots calculated from diffusion theory of the demodu-lation at three modulation frequencies versus the position of anabsorbing edge. (b) Measurement in skim milk of the signal de-modulation at three modulation frequencies versus the position ofan absorbing edge.
J. B. Fishkin and E. Gratton
I1
138 J. Opt. Soc. Am. A/Vol. 10, No. 1/January 1993
S
,,
source/det. pos. relative to edge (cm)
SW10.
100-
Diffraction by an edge: 180- Monte Carlo simulation (b)
Fig. 18. (a) Plots calculated from diffusion theory of the relativephase at four modulation frequencies versus the position of anabsorbing edge. (b) Frequency-domain Monte Carlo simulationof the relative phase at five modulation frequencies versus theposition of an absorbing edge.
creasing the overall effect. In the limit of high absorptionthe phase difference caused by the insertion of the edgebecomes small since the effective wave velocity is high.
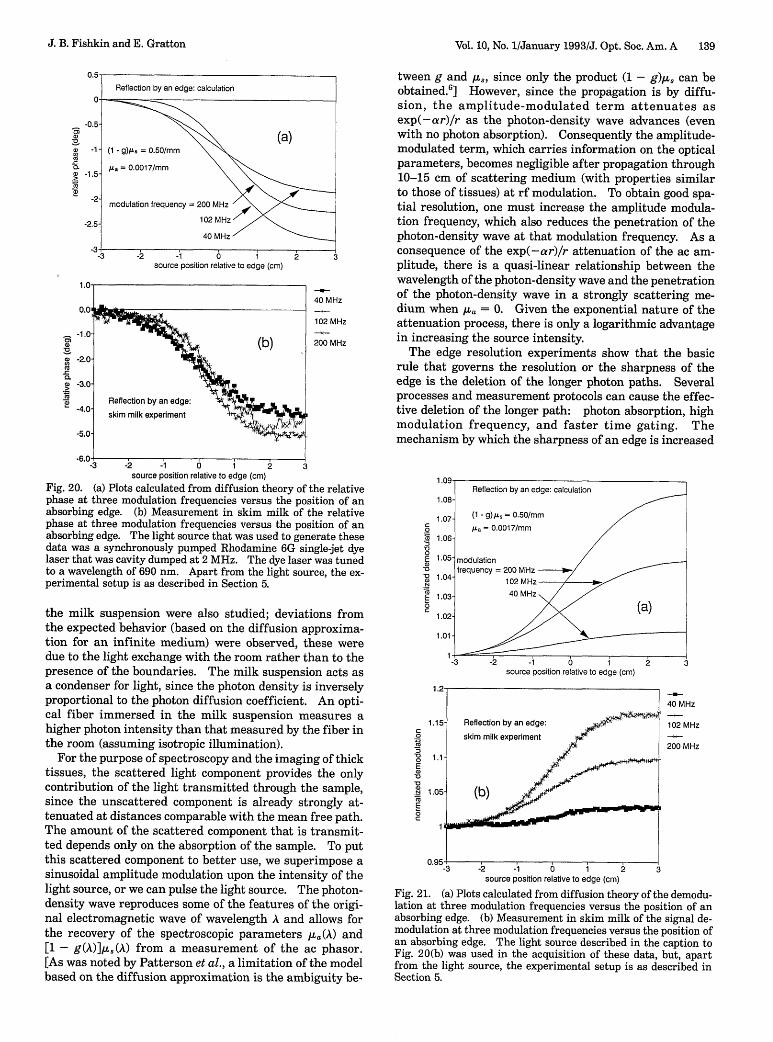
Figures 20 and 21, respectively, show plots of the phaseand the demodulation of a reflected signal at differentmodulation frequencies versus the source position relativeto an absorbing edge. These plots were acquired with theuse of the geometry shown in Fig. 5(b) above. The plotsof Figs. 20(a) and 21(a) are derived from diffusion theory,and the plots of Figs. 20(b) and 21(b) were obtained fromthe detection of a sinusoidally intensity-modulated lightsignal in skim milk. The plots of Figs. 20 and 21 showthat the phase decreases as the source approaches the zeroposition and then reaches a constant value, while themodulation increases and then reaches a constant value.The qualitative explanation of this effect is almost identi-cal to the qualitative explanation of the behavior of thephase and the demodulation in the diffraction experiment,the only difference being that the phase and the modula-tion reach a constant value in the reflection experimentbecause the source and the detector are on the same sideof the plane; when the edge of the plane passes the sourceand the detector, the distribution of the photon paths be-tween the source and the detector becomes constant.
8. CONCLUSIONThe diffusion approximation to the Boltzmann transportequation fully describes our experiments of propagation of
photons in macroscopically homogeneous infinite mediafor all the absorptions investigated. The range of absorp-tion and transport scattering coefficients that we havestudied is typical of many animal tissues in the near-infrared region.6 At high absorption or at distances fromthe light source that are of the order of the mean free pathfor light scattering, the diffusion approximation shouldfail.'5 Given the value of (1 - g)1,8 and the value of 11afor light of 810-nm wavelength in skim milk, which wedetermined from our data to be 0.50/mm and 0.0017/mm,respectively, few unscattered photons will survive thetransit from the source to the detector when the source/detector separation is of the order of a few centimeters.(Note that for our measurements the minimum source/detector separation was 2.5 cm.) However, at shortdistances from the source, unscattered photons will con-tribute to the light intensity. We have performed otherexperiments, not reported here, in which we have studiedthe angular dependence of the light intensity in a milksuspension. We have oriented the end of the detector op-tical fiber either directly toward the source or away fromthe source, and we have measured the same intensity inthe medium within errors. Only when the detector wasvery close to the source, less than a centimeter for theskim-milk experiment, did we observe a definitive depen-dence of the light intensity on the orientation of the end ofthe detector optical fiber relative to the source. The ef-fects on the measured light intensity in the milk suspen-sion that are due to the boundary of the tank containing
Fig. 19. (a) Plots calculated from diffusion theory of the demodu-lation at four modulation frequencies versus the position of anabsorbing edge. (b) Frequency-domain Monte Carlo simulationof the demodulation at five modulation frequencies versus the po-sition of an absorbing edge.
J. B. Fishkin and E. Gratton
Vol. 10, No. 1/January 1993/J. Opt. Soc. Am. A 139
2-
a:76
source position relative to edge (cm)
en
(a
-C
..5
40 MHz
102 MHz
200 MHz
-3 -2 -1 0 1 2 3source position relative to edge (cm)
Fig. 20. (a) Plots calculated from diffusion theory of the relativephase at three modulation frequencies versus the position of anabsorbing edge. (b) Measurement in skim milk of the relativephase at three modulation frequencies versus the position of anabsorbing edge. The light source that was used to generate thesedata was a synchronously pumped Rhodamine 6G single-jet dyelaser that was cavity dumped at 2 MHz. The dye laser was tunedto a wavelength of 690 nm. Apart from the light source, the ex-perimental setup is as described in Section 5.
the milk suspension were also studied; deviations fromthe expected behavior (based on the diffusion approxima-tion for an infinite medium) were observed, these weredue to the light exchange with the room rather than to thepresence of the boundaries. The milk suspension acts asa condenser for light, since the photon density is inverselyproportional to the photon diffusion coefficient. An opti-cal fiber immersed in the milk suspension measures ahigher photon intensity than that measured by the fiber inthe room (assuming isotropic illumination).
For the purpose of spectroscopy and the imaging of thicktissues, the scattered light component provides the onlycontribution of the light transmitted through the sample,since the unscattered component is already strongly at-tenuated at distances comparable with the mean free path.The amount of the scattered component that is transmit-ted depends only on the absorption of the sample. To putthis scattered component to better use, we superimpose asinusoidal amplitude modulation upon the intensity of thelight source, or we can pulse the light source. The photon-density wave reproduces some of the features of the origi-nal electromagnetic wave of wavelength A and allows forthe recovery of the spectroscopic parameters /iLa(A) and[1 - g(A)]p,a(A) from a measurement of the ac phasor.[As was noted by Patterson et al., a limitation of the modelbased on the diffusion approximation is the ambiguity be-
tween g and Iu,, since only the product (1 - g), can beobtained.6 ] However, since the propagation is by diffu-sion, the amplitude-modulated term attenuates asexp(-ar)/r as the photon-density wave advances (evenwith no photon absorption). Consequently the amplitude-modulated term, which carries information on the opticalparameters, becomes negligible after propagation through10-15 cm of scattering medium (with properties similarto those of tissues) at rf modulation. To obtain good spa-tial resolution, one must increase the amplitude modula-tion frequency, which also reduces the penetration of thephoton-density wave at that modulation frequency. As aconsequence of the exp(-ar)/r attenuation of the ac am-plitude, there is a quasi-linear relationship between thewavelength of the photon-density wave and the penetrationof the photon-density wave in a strongly scattering me-dium when /-a = 0. Given the exponential nature of theattenuation process, there is only a logarithmic advantagein increasing the source intensity.
The edge resolution experiments show that the basicrule that governs the resolution or the sharpness of theedge is the deletion of the longer photon paths. Severalprocesses and measurement protocols can cause the effec-tive deletion of the longer path: photon absorption, highmodulation frequency, and faster time gating. Themechanism by which the sharpness of an edge is increased
0
E(a-o
0
1.09
1.08
1.07
1.06
1.05
1.04
1.03
1.02
1.01
source position relative to edge (cm)
C
~00
EI
E 1-a0
40 MHz
102 MHz
200 MHz
-3 -2 -1 0 1 2 3source position relative to edge (cm)
Fig. 21. (a) Plots calculated from diffusion theory of the demodu-lation at three modulation frequencies versus the position of anabsorbing edge. (b) Measurement in skim milk of the signal de-modulation at three modulation frequencies versus the position ofan absorbing edge. The light source described in the caption toFig. 20(b) was used in the acquisition of these data, but, apartfrom the light source, the experimental setup is as described inSection 5.
Reflection by an edge: calculation
- (1 -9)/i's = 0.50/mm
a = 0.0017/mm
-modulationfrequency = 200 MHz - /
102 MHz
40 MHz
(a)
J. B. Fishkin and E. Gratton
.,. -1 e J
140 J. Opt. Soc. Am. A/Vol. 10, No. 1/January 1993
can easily be explained from the perspective of a bundle ofphoton paths that join the source to the detector. Thethinner the light bundle, the closer the approach to thecomputer tomography geometry. In practice, the effectivelight bundle can be made very narrow, of the order of amillimeter for source/detector distances of 3-5 cm and ab-sorption and scattering transport coefficients of the orderof those found in animal tissues in the near infrared. Theultimate resolution or sharpness of an edge should not beconfused with the detectability of a small object. Thedetectability is determined by the precision of the phaseand demodulation measurement, which can be extremelyhigh.20 Instead, the sharpness of an edge or the separa-tion of two small objects depends on the optical propertiesof the medium, modulation frequency, or time gating.Since we have obtained the analytical solution for sometypical cases, we understand how the optical propertiesand modulation frequency or time gating determine thesharpness of an edge.
The measurement of the photon-density wave front pro-vides a simple and powerful method to detect macroscopicinhomogeneities in a scattering medium. An absorbingobject causes a wave-front deformation that is easy tomeasure. We are studying the limit of resolvability ofsmall absorbing objects in highly turbid media.
ACKNOWLEDGMENTS
These experiments and analyses of the data produced wereperformed at the Laboratory for Fluorescence Dynamics(LFD) in the Department of Physics at the University ofIllinois at Urbana-Champaign (UIUC). The LFD and thisstudy are supported jointly by the Division of ResearchResources of the National Institutes of Health (RR03155)and UIUC. The authors thank Julie Butzow for help inpreparing this paper.
REFERENCES
1. A. Ishimaru, Wave Propagation and Scattering in RandomMedia (Academic, New York, 1978).
2. M. J. Stephen, "Temporal fluctuations in wave propagation inrandom media," Phys. Rev. B 37, 1-5 (1988).
3. R. Berkovits and S. Feng, "Theory of speckle-pattern tomog-raphy in multiple-scattering media," Phys. Rev. Lett. 65,3120-3123 (1990).
4. B. White, P. Sheng, M. Postel, and G. Papanicolaou, "Probingthrough cloudiness: theory of statistical inversion for multi-ply scattered data," Phys. Rev. Lett. 63, 2228-2231 (1989).
5. J. R. Singer, F. A. Grunbaum, P. Kohn, and J. P. Zubelli,"Image reconstruction of the interior of bodies that diffuseradiation," Science 248, 990-993 (1990).
6. M. S. Patterson, B. Chance, and B. C. Wilson, "Time resolvedreflectance and transmittance for the non-invasive measure-ment of tissue optical properties," Appl. Opt. 28, 2331-2336(1989).
7. D. J. Pine, D. A. Weitz, P. M. Chaikin, and E. Herbolzheimer,"Diffusing-wave spectroscopy," Phys. Rev. Lett. 60, 1134-1137 (1988).
8. P. W Anderson, "The question of classical localization: atheory of white paint?" Philos. Mag. B 52, 505-509 (1985).
9. A. Ishimaru, "Diffusion of light in turbid material," Appl.Opt. 28, 2210-2215 (1989).
10. B. Chance, S. Nioka, J. Kent, K. McCully, M. Fountain,R. Greenfeld, and G. Holtom, "Time-resolved spectroscopy ofhemoglobin and myoglobin in resting and ischemic muscle,"Anal. Biochem. 174, 698-707 (1988).
11. B. White, P. Sheng, Z. Q. Zhang, and G. Papanicolaou, "Wavelocalization characteristics in the time domain," Phys. Rev.Lett. 59, 1918-1921 (1987).
12. J. C. Hebden and R. A. Kruger, 'A time-of-flight breast imag-ing system: spatial resolution performance," in Time-Resolved Spectroscopy and Imaging of Tissues, B. Chance,ed., Proc. Soc. Photo-Opt. Instrum. Eng. 1431, 225-231(1991).
13. K. M. Yoo, F. Liu, and R. R. Alfano, "Biological materialsprobed by the temporal and angular profiles of the backscat-tered ultrafast laser pulses," J. Opt. Soc. Am. B 7, 1685-1693(1990).
14. R. R. Anderson and J. A. Parrish, The Science of Photo-medicine, J. D. Regan and J. A. Parrish, eds. (Plenum,New York, 1982), Chap. 6, p. 147.
15. K. M. Case and P. F. Zweifel, Linear Transport Theory(Addison-Wesley, Reading, Mass., 1967).
16. H. S. Carslaw, "Some multiform solutions of the partial dif-ferential equations of physical mathematics and their applica-tions," Proc. London Math. Soc. 30, 121-161 (1898).
17. A. Sommerfeld, "Uber verzweigte Potentiale im Raum,"Proc. London Math. Soc. 28, 395-429 (1897); 30, 161-163(1898).
18. J. H. Jeans, Mathematical Theory of Electricity and Magne-tism (Cambridge U. Press, London, 1933).
19. B. A. Feddersen, D. W Piston, and E. Gratton, "Digital paral-lel acquisition in frequency domain fluorometry," Rev. Sci.Instrum. 60, 2929-2936 (1989).
20. B. Barbieri, F. De Picoli, M. vandeVen, and E. Gratton, "Whatdetermines the uncertainty of phase and modulation mea-surements in frequency domain fluorometry?" in Time-Resolved Laser Spectroscopy in Biochemistry II, J. R.Lakowicz, ed., Proc. Soc. Photo-Opt. Instrum. Eng. 1204,158-170 (1990).